Quantitative Research Methods: Assignment 1
Table of Contents
A1.1 Chapter 2, Problem 2.1…………………...…………………………………………………3
A1.2 Chapter 2, Problem 2.2.……………………………………………………………………..3
A1.3 Chapter 2, Problem 2.3..…………………………………………………………………….3
A1.4 Chapter 2, Problem 2.4………….…..………………………………………………………3
A1.4.a Words and Letters….……….…...……………………………………………………..3
A1.4.b Words and Letters Conversions…....…………………………………………………..3
A1.5 Chapter 2, Problem 2.5……………………………………………………………………...4
A1.6 Chapter 2, Problem 2.6……….……………………………………………………………..4
A1.6.a Checking Data……………………………………………………………………….....4
A1.6.b Ways to Check Data……………………………………………………………………4
A1.7 Chapter 2, SPSS Problem 2.1……………………………………………………………….5
A1.7.a Data Output…………………………………………………………………………….5
A1.7.b Students with Complete Data………………………………………………………….6
A1.7.c Non-meaningful Data………………………………………………………………….6
A1.8 Chapter 2, SPSS Problem 2.2……………………………………………………………….7
A1.8.a Mean Height of Students/Same Sex Parents…………………………………………...7
A1.8.b Percentage of Males/Students with Children…………………………………………..7
Reference………………………………………………………………………………………….8
2
5/20/2023
Quantitative Research Methods: Assignment 1
A1.1: Chapter 2, Problem 2.1
The first step after the collection of data is to verify the data is complete and useable.
Morgan et al. (2020) offers an example of mistakes made in survey completions that include
double answers, blanks, unclear responses, and responses not within the confines of the allowed
range. Once the deficiencies are identified the researcher should create rules on how to handle
each anomaly. This will create a safeguard of data integrity since all mistakes of the same nature
are handled in the same manner. Once the rules are created the data can be made useable for
research analysis.
A1.2: Chapter 2, Problem 2.2
According to Morgan et al. (2020) nominal variables should have the values labeled since
these variables are not ordered in a specific range hierarchy. Labelling is not as important for
data that are ordered in groups. Labels are paramount for nominal variables since the group
affiliation is arbitrary.
A1.3: Chapter 2, Problem 2.3
The primary purpose of printing the codebook or dictionary is to have a complete view of
all of the variables and labels associated with the research study. The codebook offers a compete
view whereas the variable view is an abbreviated view of the research data setup.
A1.4: Chapter 2, Problem 2.4
A1.4.a: Words and Letters
Words and letters are permissible in data collection. The use of words and letters in data
collection limits the ability of the researcher to produce statistical data (Morgan et al., 2020). All
letters or words must be assigned a numerical value to be entered as part of the dataset.
A1.4.b: Word and Letter Conversion
3
5/20/2023
Quantitative Research Methods: Assignment 1
Words and letters do not represent usable values for statistics and must be assigned a
numeric value to prove useful. An example would be a survey asking participants if they are
right or left-handed. The response from the participant may be a “L” or “R”. In this case the
researcher would need to assign a value to “L” and “R” such as “L=1, R=2”. This allows the data
to be analyzed.
A1.5: Chapter 2, Problem 2.5
The use of the Mean Function to create a variable is a quicker way to determine an
average for a set of data. This function also disregards blanks found in the data set and only
computes available data. One downfall to this method is the presence of survey bias in the case
where certain questions are consistently blank.
A1.6: Chapter 2, Problem 2.6
A1.6.a Checking Data
The simple answer to this question is it is important to check the raw data before and
after insertion into the data table to prevent human interpretation or input error. This is especially
true for complex variable data and large sample data. Another reason to check the data pre-input
is to address any answers that are outside the descriptive rules and make adjustments. Checking
the N value after input will identify any incomplete datasets for participants.
A1.6.b Ways to Check Data
One method to check the data pre-insertion is to visually check every questionnaire for
accuracy and completeness. This may be time consuming dependent on the amount of data being
evaluated. If the data is on paper hard copy, this may be the only way to check the data. If the
data is collected digitally, the software used to collect the data will typically have tools that set
rules for collection and will notify the researcher of errors at presentation.
4
5/20/2023

Quantitative Research Methods: Assignment 1
One method of checking the data after entering into the data table is to run descriptive
analysis that outputs N value, Minimum, Maximum, and Standard Deviation. The N value
should correspond to the number of completed surveys for each completed questionnaire. Any
variable that falls below or above the predetermined N value will need evaluation for accuracy.
The minimum and maximum for each variable will determine if the entered results are within the
acceptable range for the variable. This will also identify any dataset errors.
A1.7: Chapter 2, SPSS Problem 2.1
A1.7.a Data Output
Figure 1
5
5/20/2023
Quantitative Research Methods: Assignment 1
A1.7.b Students with Complete Data
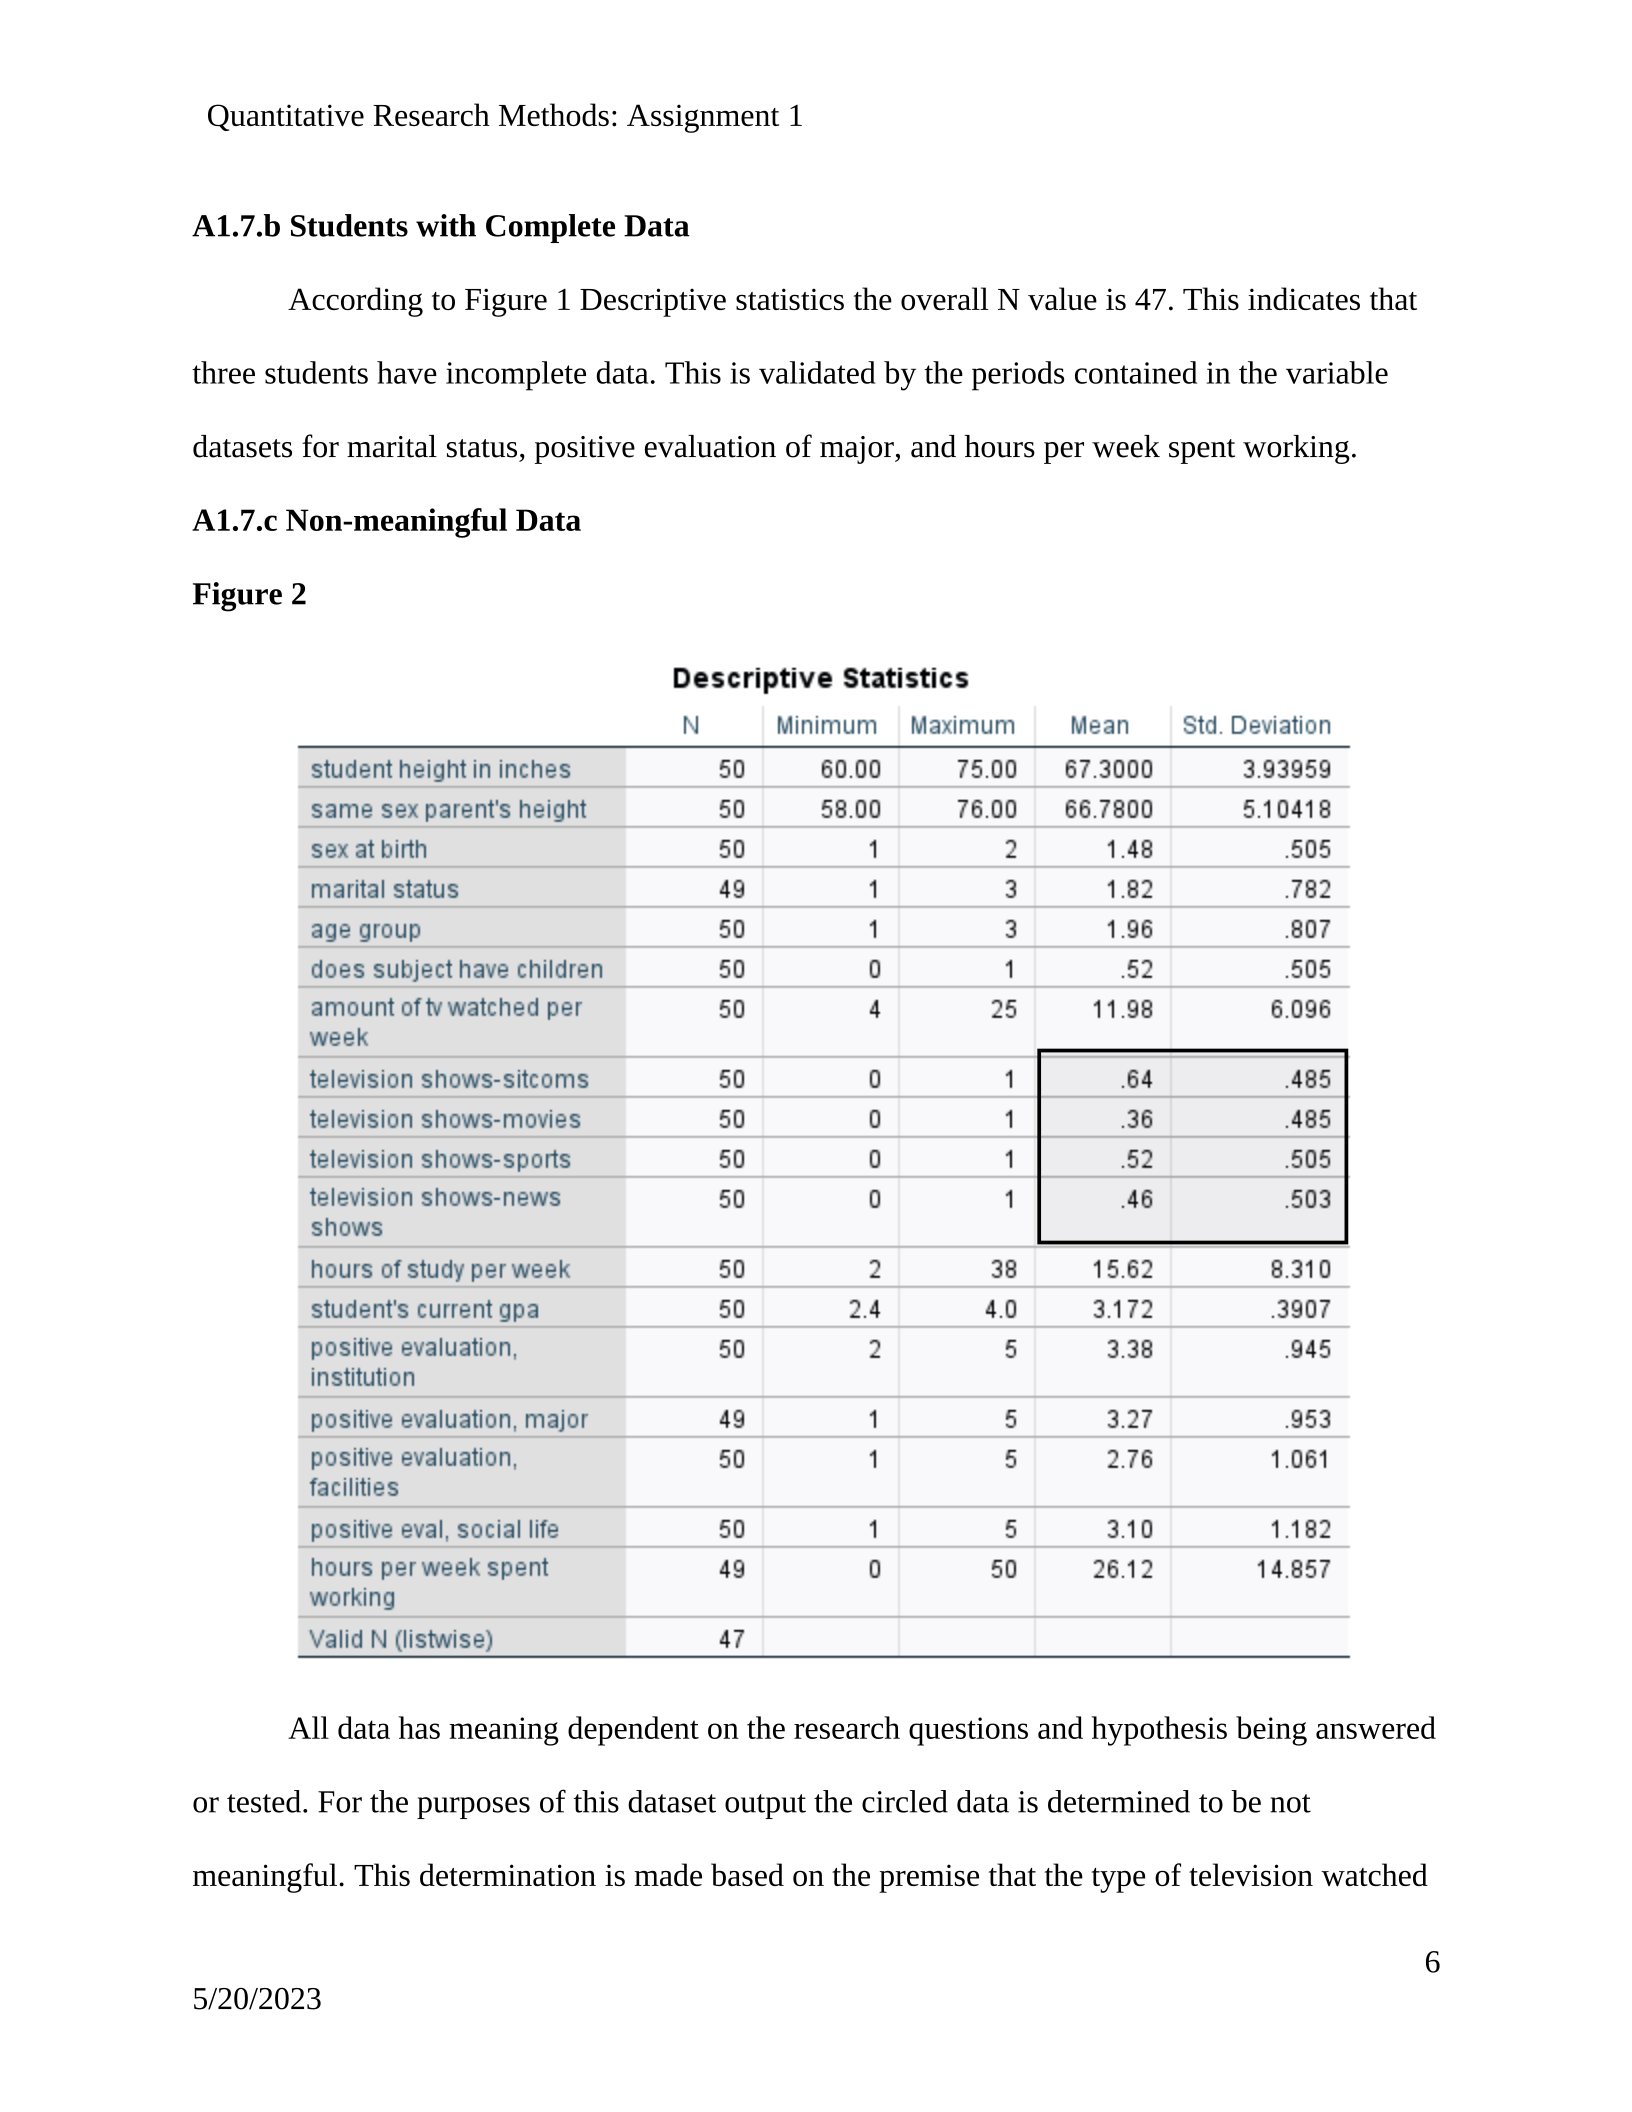
According to Figure 1 Descriptive statistics the overall N value is 47. This indicates that
three students have incomplete data. This is validated by the periods contained in the variable
datasets for marital status, positive evaluation of major, and hours per week spent working.
A1.7.c Non-meaningful Data
Figure 2
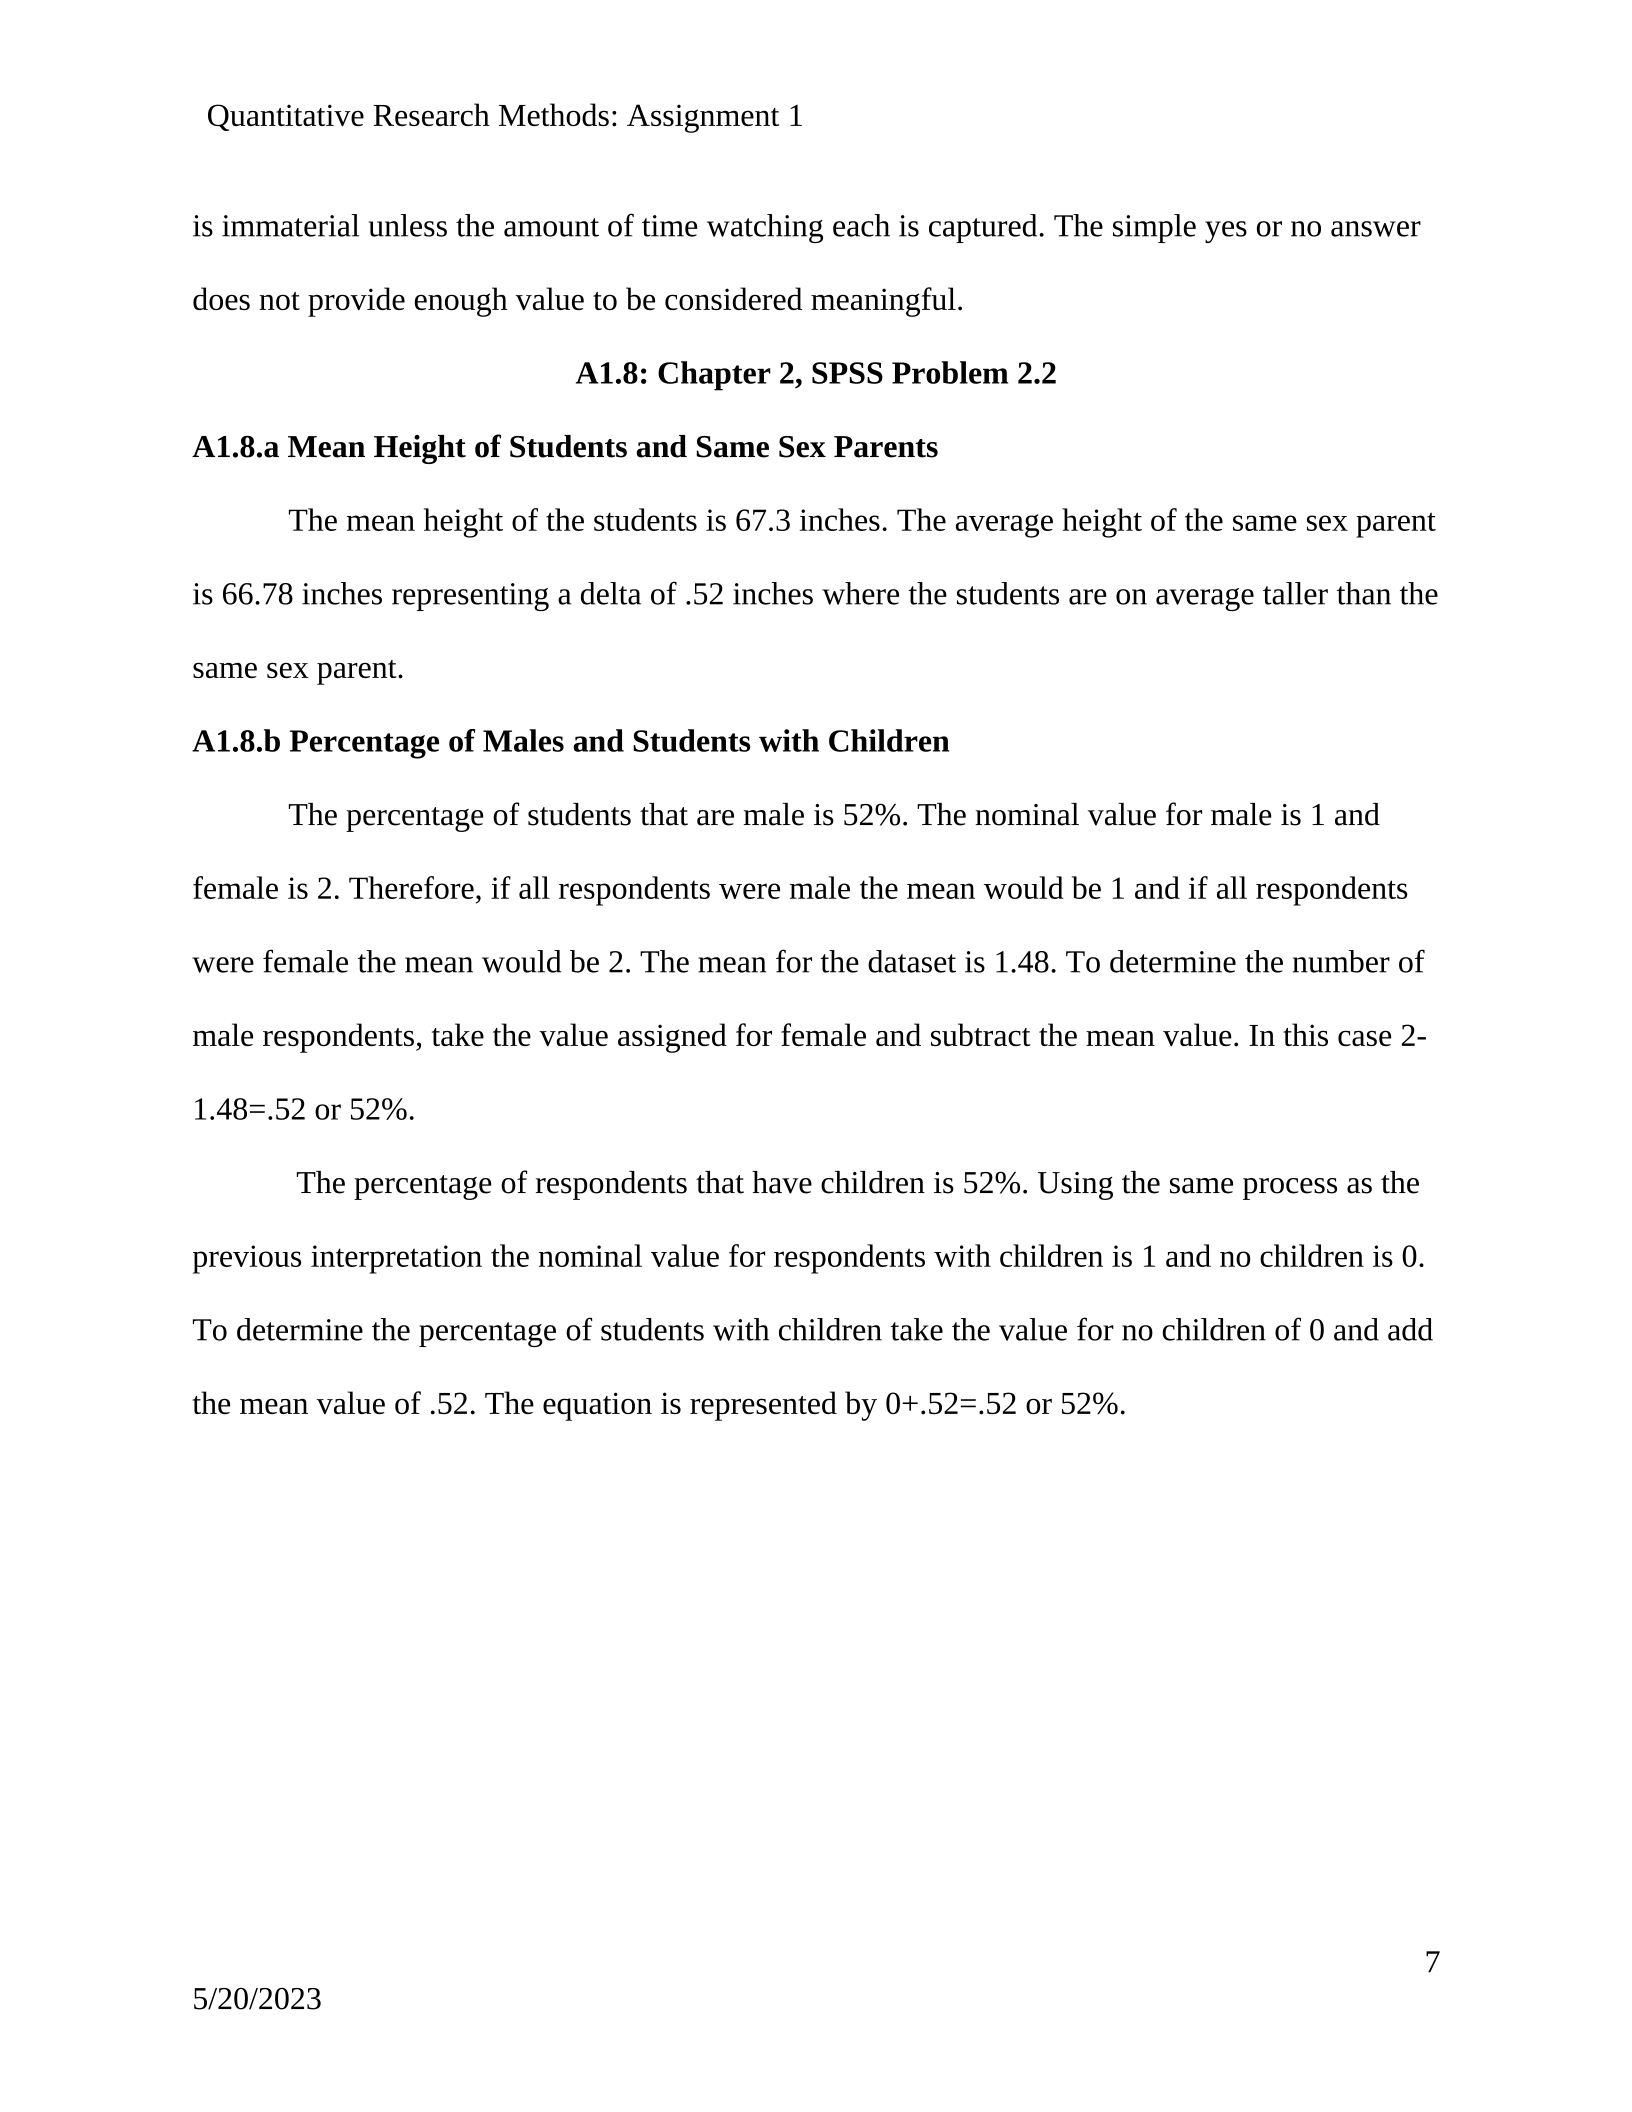
All data has meaning dependent on the research questions and hypothesis being answered
or tested. For the purposes of this dataset output the circled data is determined to be not
meaningful. This determination is made based on the premise that the type of television watched
6
5/20/2023
Quantitative Research Methods: Assignment 1
is immaterial unless the amount of time watching each is captured. The simple yes or no answer
does not provide enough value to be considered meaningful.
A1.8: Chapter 2, SPSS Problem 2.2
A1.8.a Mean Height of Students and Same Sex Parents
The mean height of the students is 67.3 inches. The average height of the same sex parent
is 66.78 inches representing a delta of .52 inches where the students are on average taller than the
same sex parent.
A1.8.b Percentage of Males and Students with Children
The percentage of students that are male is 52%. The nominal value for male is 1 and
female is 2. Therefore, if all respondents were male the mean would be 1 and if all respondents
were female the mean would be 2. The mean for the dataset is 1.48. To determine the number of
male respondents, take the value assigned for female and subtract the mean value. In this case 2-
1.48=.52 or 52%.
The percentage of respondents that have children is 52%. Using the same process as the
previous interpretation the nominal value for respondents with children is 1 and no children is 0.
To determine the percentage of students with children take the value for no children of 0 and add
the mean value of .52. The equation is represented by 0+.52=.52 or 52%.
7
5/20/2023