


1
ANALYSIS OF THE INFLUENCE OF MACROECONOMIC VARIABLES ON
THE STOCK MARKET
Introduction:
In 2020, United States experienced a contraction in economic growth to -2.07 percent due to
the COVID-19 pandemic (Pratiwi 2022). The worsening economic conditions due to the pandemic
also had an impact on the decline in investment growth (Dewi 2021). People tend to choose to be
more cautious in investing in bad situations (Nasution et al. 2020). This can be seen from the
decline in the number of stock transaction volumes, which originally reached 3,562 (Billion Shares)
in 2019 before the pandemic to only 2,752 (Billion Shares) in 2020 after the pandemic. Its daily
average transaction volume originally reached 15,020 (Million Shares) in 2019 to only 11,864
(Million Shares) in 2020.
The decrease in trading volume occurs because investors tend to hold back purchases due to
the pandemic which creates uncertainty in the market. Indirectly, the decrease in trading volume
also affects market capitalization (Yutanesy et al. 2022). This is because the calculation of market
capitalization is done by multiplying all shares in the market by the latest market price. When the
market price of a stock drops, it will also result in a decrease in total market capitalization. In 2019,
Indonesia's stock market capitalization reached 7,265 (IDR Trillion), but due to the pandemic the
market capitalization has decreased to only 6,970 (IDR Trillion).
The Composite Stock Price Index (JCI), which is a measure of the investment climate of the
Indonesian capital market, showed a fairly negative response when COVID-19 was first announced
in Indonesia, even the decline that occurred brought the JCI to a fairly low level. Based on Figure 1,
it can be seen that during the COVID-19 pandemic, from January to March 2020 the JCI
experienced a sharp decline from the 6300 area to the 3900 area. The lowest position occurred on
March 24, 2020 at the level of 3937.63 which means that it has dropped by 37.49 percent from the
level of 6299.54 at the close of 2019.
The decline in the JCI occurred partly due to the panic selling factor carried out by investors
due to fears related to the continued increase in positive victims of COVID-19 (Zaeni at al. 2022).
Generally, stock fluctuations are influenced by external and internal factors (OJK). Various
problems that occur within the company itself are referred to as internal factors, while problems that
come from outside the company are referred to as external factors.

2
Macroeconomic factors are one of the external factors that investors need to pay attention to
because they have a very large influence on stock price fluctuations (Prakoso at al. 2018).
Inflation is one of the macroeconomic factors that investors need to pay attention to because
inflation can be a reference for investors to weigh which investment instruments are most suitable
for minimizing eroded returns. When the COVID-19 pandemic occurred, Indonesia's inflation
tended to decline due to a decrease in domestic demand. Apart from inflation, the BI rate is also a
macroeconomic factor that can affect the movement of Indonesian stocks (Prakoso et al. 2018).
During the pandemic, Bank Indonesia lowered the BI rate for monetary operations to maintain
adequate liquidity and accelerate national economic recovery. The decrease in the BI rate will be
followed by a decrease in lending and deposit interest rates. This will encourage investors to switch
to investing in the stock market in the hope of getting higher returns than just keeping their money
in the bank.
Another macroeconomic variable that can affect stock prices is the dollar to rupiah exchange
rate (USD/IDR). Exchange rates play an important role in international trade. For companies that
depend on exports and imports, the exchange rate affects the profits they will generate. When the
pandemic occurred, the rupiah exchange rate against the dollar had experienced a deep weakening
to touch IDR 16,000 in 2020, one of which was due to a decline in export commodity prices.
Another factor that also affects stock prices is brent oil, which is a benchmark for world oil prices.
Since the pandemic occurred, world oil has experienced a significant increase to US$100 per barrel
due to the energy crisis exacerbated by the war between Russia and Ukraine. The increase in oil
prices has an impact on the company's production costs. Various changes that occur in various
macroeconomic variables either directly or indirectly contribute to the performance of a company.
Therefore, to be able to make the right investment decision, investors need to pay attention to
various macroeconomic variables and study the company's fundamental factors before making an
investment decision.
Problem Formulation:
Various macroeconomic variables have experienced a downward trend since early 2020
after the discovery of COVID-19 in Wuhan China. Apart from having an impact on the health
sector, the pandemic has also had an impact on the economy such as a decline in investment growth
(Dewi 2021). The same thing happened to the performance of the stock market in Indonesia, which
can be seen from the performance of the JCI, which also experienced a downward trend from the
beginning of 2020 to March 2020. By

3
Due to the similarity of these trends, research is needed to see the relationship of these
macroeconomic variables to the stock market. In addition, the importance of the role of the stock
market for a country's economy is important to note because when a shock occurs, it can have
adverse consequences for a country's economy.
Research related to the influence of macroeconomic factors on the stock market has been
conducted previously. Yilmaz and Ilhan (2022) examined the dynamic relationship between various
macroeconomic variables and stock indices in four emerging countries including Brazil, Mexico,
Russia, and Turkey. The results of the study found that in the short-term model, bond interest and
COVID 19 have a negative relationship with the Brazilian stock market index. While in the long
run it is negatively affected by gold prices, bond yields, and crude oil prices. Mexico's stock market
index is negatively affected by COVID 19, crude oil prices and bond yields in the short term, while
in the long term it is affected by bond yields, gold prices and crude oil prices. In the Russian stock
market index, bond yields have a negative effect in the short term. Likewise, in the Turkish stock
market index, bond yields and gold prices have a negative effect in both the short and long term.
In the Indonesian stock market, Priyono (2022) examined the influence of macroeconomic
variables such as world gold prices and the rupiah exchange rate on the IHSG in the long and short
term. The study found that the rupiah exchange rate had a negative effect in both the short and long
term, while the world gold price had no significant effect. This finding is different from the findings
of Zaretta and Yovita (2019) who found that the rupiah exchange rate has a positive effect in the
short term and is not significant in the long term on the JCI. There are still differences in results
between studies that have been conducted and there are various other macroeconomic variables that
may affect stock prices, which is the reason for further research. So based on the explanation that
has been described, the following are some of the problems analyzed in this study.
1. What was the condition of the stock market and various macroeconomic variables during the study
period?
2. How do macroeconomic variables affect the JCI in the short and long term?

4
Capital Markets:
The capital market connects businesses that need money with investors who have the capital
to invest. According to Septiani et al. (2020) The capital market is a financial market for conducting
long-term investment activities in a company that can be traded in the form of equity or debt in the
form of securities or shares or bonds. The capital market is one of the elements that has a significant
impact on a country's economy. For investors, the capital market can be used as a means to obtain
returns.
There are two types of capital markets based on the transaction time, namely the primary
market and the secondary market. The primary market is when securities are offered to investors
directly by an underwriter or for the first time through an intermediary as a seller. The common
name for this procedure is an initial public offering (IPO). Meanwhile, the secondary market, where
investors can trade shares, is a continuation of the primary market. The supply and demand for
shares will cause the share price in the secondary market to change.
Shares:
Shares are an investment instrument for a person or a company in a business with the hope of
obtaining financial benefits in the future. A company can use stocks as an option to obtain funding
(IDX 2022). As for investors, stocks are an attractive option to multiply their money because they
are able to provide high returns. An investor chooses stocks over other financial instruments
because stocks are able to generate profits in the form of capital gains and dividends (Nidya and
Mawardi 2018).
In addition to the benefits, investing in stocks certainly has various risks including capital
loss and liquidation risk. Capital loss is a loss incurred due to investors selling their share
ownership at a price below the purchase price. Meanwhile, liquidation risk occurs when the
company goes bankrupt. Shareholder rights become the last priority after all obligations that are the
responsibility of the company are paid off. Liquidation risk conditions are the toughest and worst
conditions that shareholders must be prepared to accept if they choose to invest in stocks (IDX
2022).
Composite stock price index (JCI)
The main index used to measure the overall performance of the Indonesian stock market is
called the JCI, which reflects the overall performance of companies through price movements
(Wahyudi and Ramani 2022).
There are 42 Indices listed on the IDX based on February 2023 data. The performance of 20
state-owned stocks is transmitted by IDX BUMN20, and IDX80 measures the performance of 80

5
liquid companies with significant market capitalization. Weighted average method based on number
of listed shares or market value
The base value is 100 based on the base date of August 10, 1982. The base value is the product of
the number of shares on the base day and the share price on the base day.
Macroeconomic Variables
Inflation
Inflation is the continuous rise in the general price of goods and services over a period of time
(BI 2023). The average price level of various commodities is measured by an index known as the
Consumer Price Index. Inflation occurs when total consumer demand for goods and services
exceeds supply. When overall demand exceeds supply, there will be scarcity and rising prices.
BI Rate
In addition to serving as Bank Indonesia's benchmark interest rate, the BI rate is a means of
communicating its monetary policy stance (BI 2016). The BI rate is announced every month at the
Board of Governors meeting. The development of Overnight Interbank Money rates is an
operational target in monetary policy. The movement of the interest rate can be followed by the
movement of deposit rates and bank lending rates.
Exchange Rate (USD/IDR)
The exchange rate can describe the price level of a currency exchange against other countries'
currencies where the value can be used in economic activities such as international investment and
international trade transactions (Nidya and Mawardi 2018). The exchange rate consists of real and
nominal exchange rates. The agreement on the relative prices of goods from both countries is the
real exchange rate. The agreement on the relative prices of currencies between two countries is
known as the nominal exchange rate. If the exchange rate is expressed as USD/IDR, the cost is the
number of dollars needed to buy rupiah. If the USD/IDR exchange rate strengthens, the value of the
rupiah will depreciate or weaken. Conversely, if the USD/IDR exchange rate weakens, the value of
the rupiah will appreciate or increase.
Brent oil is one of the main classifications in crude oil trading being the standard price
reference for oil transactions around the world. Brent crude oil consists of a blend of Ekofisk,
Forties Blend, Oseberg, and Brent Blend crude oils, which are extracted from the waters of the
North Sea. Brent crude oil has a relatively low sulfur content and a relatively high gravity on the
American Petroleum Institute standard scale (Brock 2022). Brent oil is a crude oil price reference
that is very close to the m:ovement of ICP (Indonesia Crude Price).

6
Previous Research
There have been many studies that discuss the influence of macroeconomic variables on the
stock market in the short and long term. Some of them are research by Bhattacharjee (2022),
Priyono (2022), Wahyudi and Rahmani (2022), Linawati et al. (2021), Rahmayani and Oktavilia
(2020), Zaretta and Yovita (2019), and Situngkir (2019). Table 1 below contains information on the
results of these studies.
Framework of Thought
The COVID-19 pandemic has shaken the Indonesian economy (MoF 2021). The Indonesian
stock market has also been shaken, reflected in the JCI which has experienced a sharp decline since
the beginning of 2020. This condition was also responded to by various macroeconomic variables
which experienced various changes, both decreasing and increasing. This study was conducted to
analyze how the various changes that occurred in macroeconomic variables and COVID-19 on the
Indonesian stock market at the index level.
Data Analysis Method
ECM and ARDL Analysis Methods
The ARDL method is an econometric method that can be used by researchers who use time
series data to analyze the long-run and short-run effects on a model. Pesaran and Shin (1997) first
introduced the ARDL method using cointegration tests through the Bound Test Cointegration. The
ARDL method has the advantage that it can be used on data with short time series and does not
require the classification of preestimation variables, so it can be used on I(0), I(1), or a combination
of both. The cointegration test using the bound test is done by comparing the F-statistic value with
the critical value that has been set. (Pesaran 1997). Banerjee et al. (1993) stated that the ARDL
model can be derived into an Error Correction Model (ECM) through simple linear transformation.
Before describing the model, stationarity test, optimum lag test, and cointegration test are important
steps that need to be done first. Stationarity test is conducted to check whether the data already has
stationary properties. In addition, the lag optimum test is used to determine the most suitable lag in
the ARDL model. Meanwhile, the cointegration test is used to identify whether the short-term
variables are cointegrated with the long-term variables.
The ARDL method combines the characteristics of the Autoregressive (AR) model with
Distributed Lag (DL). In this approach, changes in the dependent variable are affected not only by
the independent variable in the same period, but also by the independent variable in the previous
period. Therefore, another advantage of the ARDL model is its ability to capture the dynamic
effects of the lag of the dependent variable and the lag of the independent variable. Furthermore,
this model is able to distinguish the impact of changes in the dependent variable on changes in the

7
independent variable, both in the short and long run (Gujarati and Porter 2015).
Stationarity Testing:
In modeling time series data or time series, a pre-estimation test is needed, namely data
stationary testing. This needs to be done because time series data is generally stochastic or has a
non-stationary trend that contains a unit root. Stationarity testing needs to be done to avoid spurious
regression. One alternative in the stationary test (unit root) is to use the Augmented Dickey Fuller
(ADF) method. If the t-statistic value of ADF is smaller than the critical t-statistic, the test result
will reject H0. Conversely, if the t-statistic value of the ADF is greater than or equal to the critical
value, the test result will accept H0 so that it is concluded that the data is not stationary or has a unit
root.
Determination of Optimum Lag:
The selection of the optimum lag in the model needs to be done so that the lag combination
in the ARDL model can be known. The optimum lag is selected based on several criteria including
the Akaike Information Criteria (AIC), Schawrz- Bayesian Criterion (SC), and Hannan Quinn
Criterion (HQ). Based on Pesaran and Shin (1997), ARDL-AIC and ARDL-SC proved to have the
best performance. The optimum lag selection is based on the smallest criterion value.
Cointegration Approach:
Cointegration testing is by testing for cointegration between variables that are not stationary
in level data. The cointegration will be formed if the combination of non-stationary variables can
produce stationary variables. The method in the cointegration test in this study is the Bound Test
Cointegration through the ARDL approach introduced by Pesaran et al. (2001). This method
compares the calculated F-statistic value with the critical value. If the F-statistic value is greater or
above the upper bound value, it can be concluded that cointegration occurs, while if the F-statistic
value is smaller or below the lower bound value, it can be concluded that there is no cointegration.
Meanwhile, if the F-statistic value is between the lower bound and upper bound values, the test
results cannot be concluded.
Autocorrelation Test:
Autocorrelation testing is used as a test for estimating the existence of a linear relationship
or correlation between error terms (Juanda 2009). The purpose of the autocorrelation test is to
determine whether there is a correlation between the error in period t and the error in the previous
period in the regression model. If there is an autocorrelation problem, the estimation results will be
in the form of coefficients and variants that are not true (Gujarati 2003). Testing autocorrelation can
be done using the Breusch-Godfrey Serial Correlation LM Test. The following is the hypothesis of
the Breusch-Godfrey test:

8
H0: the regression model does not have autocorrelation problems H1: the regression model has
autocorrelation problems
If the Breusch-Godgrey test results have a probability value> 0.05( 𝛼
= 5%) then it can be concluded that the regression model does not have
autocorrelation problem or accept H0. However, if the results of the Breusch-Godgrey test have a
probability value <0.05, it can be concluded that there is an autocorrelation problem in the
regression model.
Heteroscedasticity Test:
Heteroscedasticity is a condition when the variance in a model is random or not constant.
Heteroscedasticity testing is a test to determine whether the residuals have a patterned relationship
with the independent variables. According to Gujarati (2007) heteroscedasticity problems can cause
the results of the t test and F test to be biased. According to Firdaus (2020) heteroscedasticity
testing can be done using the BreuschPagan test by reviewing the results of the probability value is
significant or not at a real level of 5 percent. The following is the hypothesis in the Breusch-Pagan
test:
H0: the difference between observations is constant (homoskedastic) H1: the difference between
observations is random (heteroskedastic)
If the probability value is greater than the real level of 5 percent, the conclusion is that there
is no heteroscedasticity problem in the regression model or accept H0.
Normality Test:
Normality testing on the model can use the Jarque-Bera (JB) test. The test is carried out to test
whether the data is normally distributed or not (Firdaus 2020). The hypothesis in the test is as
follows:
H0: data is normally distributed
H1: the data is not normally distributed.

9
Stock market conditions and macroeconomic variables
Based on Figure 3, it can be seen that the JCI tends to experience an upward trend in the last
10 years from the 3900s level in 2012 up to the 7000s level in 2022. However, JCI also experienced
fluctuations every year. 2020 was the year when JCI experienced a severe decline due to COVID-
19. JCI corrected quite deeply from early 2020 to March 2020. As of March 24, 2020, the JCI had
fallen by 37.49 percent from its 2019 closing position of 6299.54 down to 3937.63.
Movements in the stock market are caused by various factors, one of which is the
macroeconomic factors of a country. Inflation is one of the macroeconomic variables to measure the
level of increase in the price of goods and services in general which will affect the performance of a
company both in terms of input and output. In Figure 4, it can be seen that in the last 10 years
Indonesia's inflation tends to fluctuate. However, from 2017 to 2020 inflation tends to experience a
downward trend. In 2020, Consumer Price Index (CPI) inflation was recorded at a low 1.68 percent
(yoy) and was below the target of 3.0 ± 1 percent. The low inflation was influenced by weak
domestic demand due to COVID-19, adequate supply, and as a result of policy synergy between
Bank Indonesia and the central and regional governments (BI 2021).
Apart from inflation, the BI rate is also one of the things that investors need to pay attention
to because it is related to the cost of borrowing which will affect the company's finances and
performance. In Figure 5, it can be seen that in the last 10 years, the BI rate has reached the highest
level of 7.75 percent at the end of 2014 and the lowest level of 3.5 percent in February 2021. Since
the beginning of February 2021 until July 2022, the BI rate has been maintained at 3.5 percent. BI's
decision to reduce the benchmark interest rate to a level of 3.5 percent is a continued effort to
encourage national economic recovery during the COVID-19 pandemic (BI 2021).
Brent oil is one of the world's crude oil price references that undeniably has an influence
on the price of Indonesian crude oil. When the world crude oil price rises, it will also push the price
of Indonesian crude oil to rise as well and will cause inflation to rise, especially inflation in terms of
the transportation sector. When this happens, it will also have an impact on the costs that will be
borne by various goods and services companies that require transportation facilities in their
business. Brent oil in the last 10 years tends to fluctuate, but from 2020 to 2022 it tends to
experience an upward trend. In March 2020, it only cost US$26.35 per barrel, rising to a price of
US$115.6 per barrel in May 2022. 2022 is the highest peak of the increase in world oil prices due to
COVID-.19 and the war between Russia and Ukraine triggered the energy crisis.
IDR
Percen
t
USD

10
Analyze the effect of macroeconomic variables on JCI in the short and long term.
Preestimation test results
Data processing with the ARDL-ECM method begins with generating process data required
as the first stage before entering the estimation and model analysis stage in determining the model
with the best lag. This is done to determine whether all variables used in the study have met the data
stationary requirements for ARDL-ECM processing. There are several tests at this stage, such as
stationarity test, optimum lag test, and cointegration test. The following are the results of the
preestimation test:
Stationarity Test Results
Data processing using non-stationary data can produce good regression results but does not
describe the actual situation. In general, time series data has a trend which explains that the data is
not stationary. The test method used in the data stationarity test is the ADF-test. The null hypothesis
(𝐻0 ) states that the data has
unit root, while hypothesis 1 (𝐻1 ) states that the data has a unit root.
free from unit root problems. Therefore, a data can be concluded
is free from nonstationary problems if the probability value is smaller than 0.05 (reject 𝐻0 ) or the
value of the tstatistic is smaller than MacKinnon's critical values at a real level of 1 percent, 5
percent, or 10 percent.
Based on the stationarity test at the level stage, the results show that there are still four variables
that have not been stationary, namely real GDP, inflation, BI rate and COVID dummy. Due to the
fact that there are still variables that are not stationary at the level stage, the next step is differencing
until t he data does not have a unit root.
In Table, the results of the data stationarity test with the first difference show that the JCI,
inflation, BI rate, exchange rate (USD/IDR), Brent oil, and COVID dummy variables are stationary
at the 5 percent level. Each variable has an ADF value that is smaller than the MacKinnon critical
value at the 5 percent real level. All variables have a probability value smaller than 0.05 which
indicates that the data in the study is integrated or does not have a unit root problem.
11
1. Lag ptimum Test Result
The next step is determining the optimum lag to find out how far to determine the lag of
each variable. This test is used to determine the time period required for a variable to respond to the
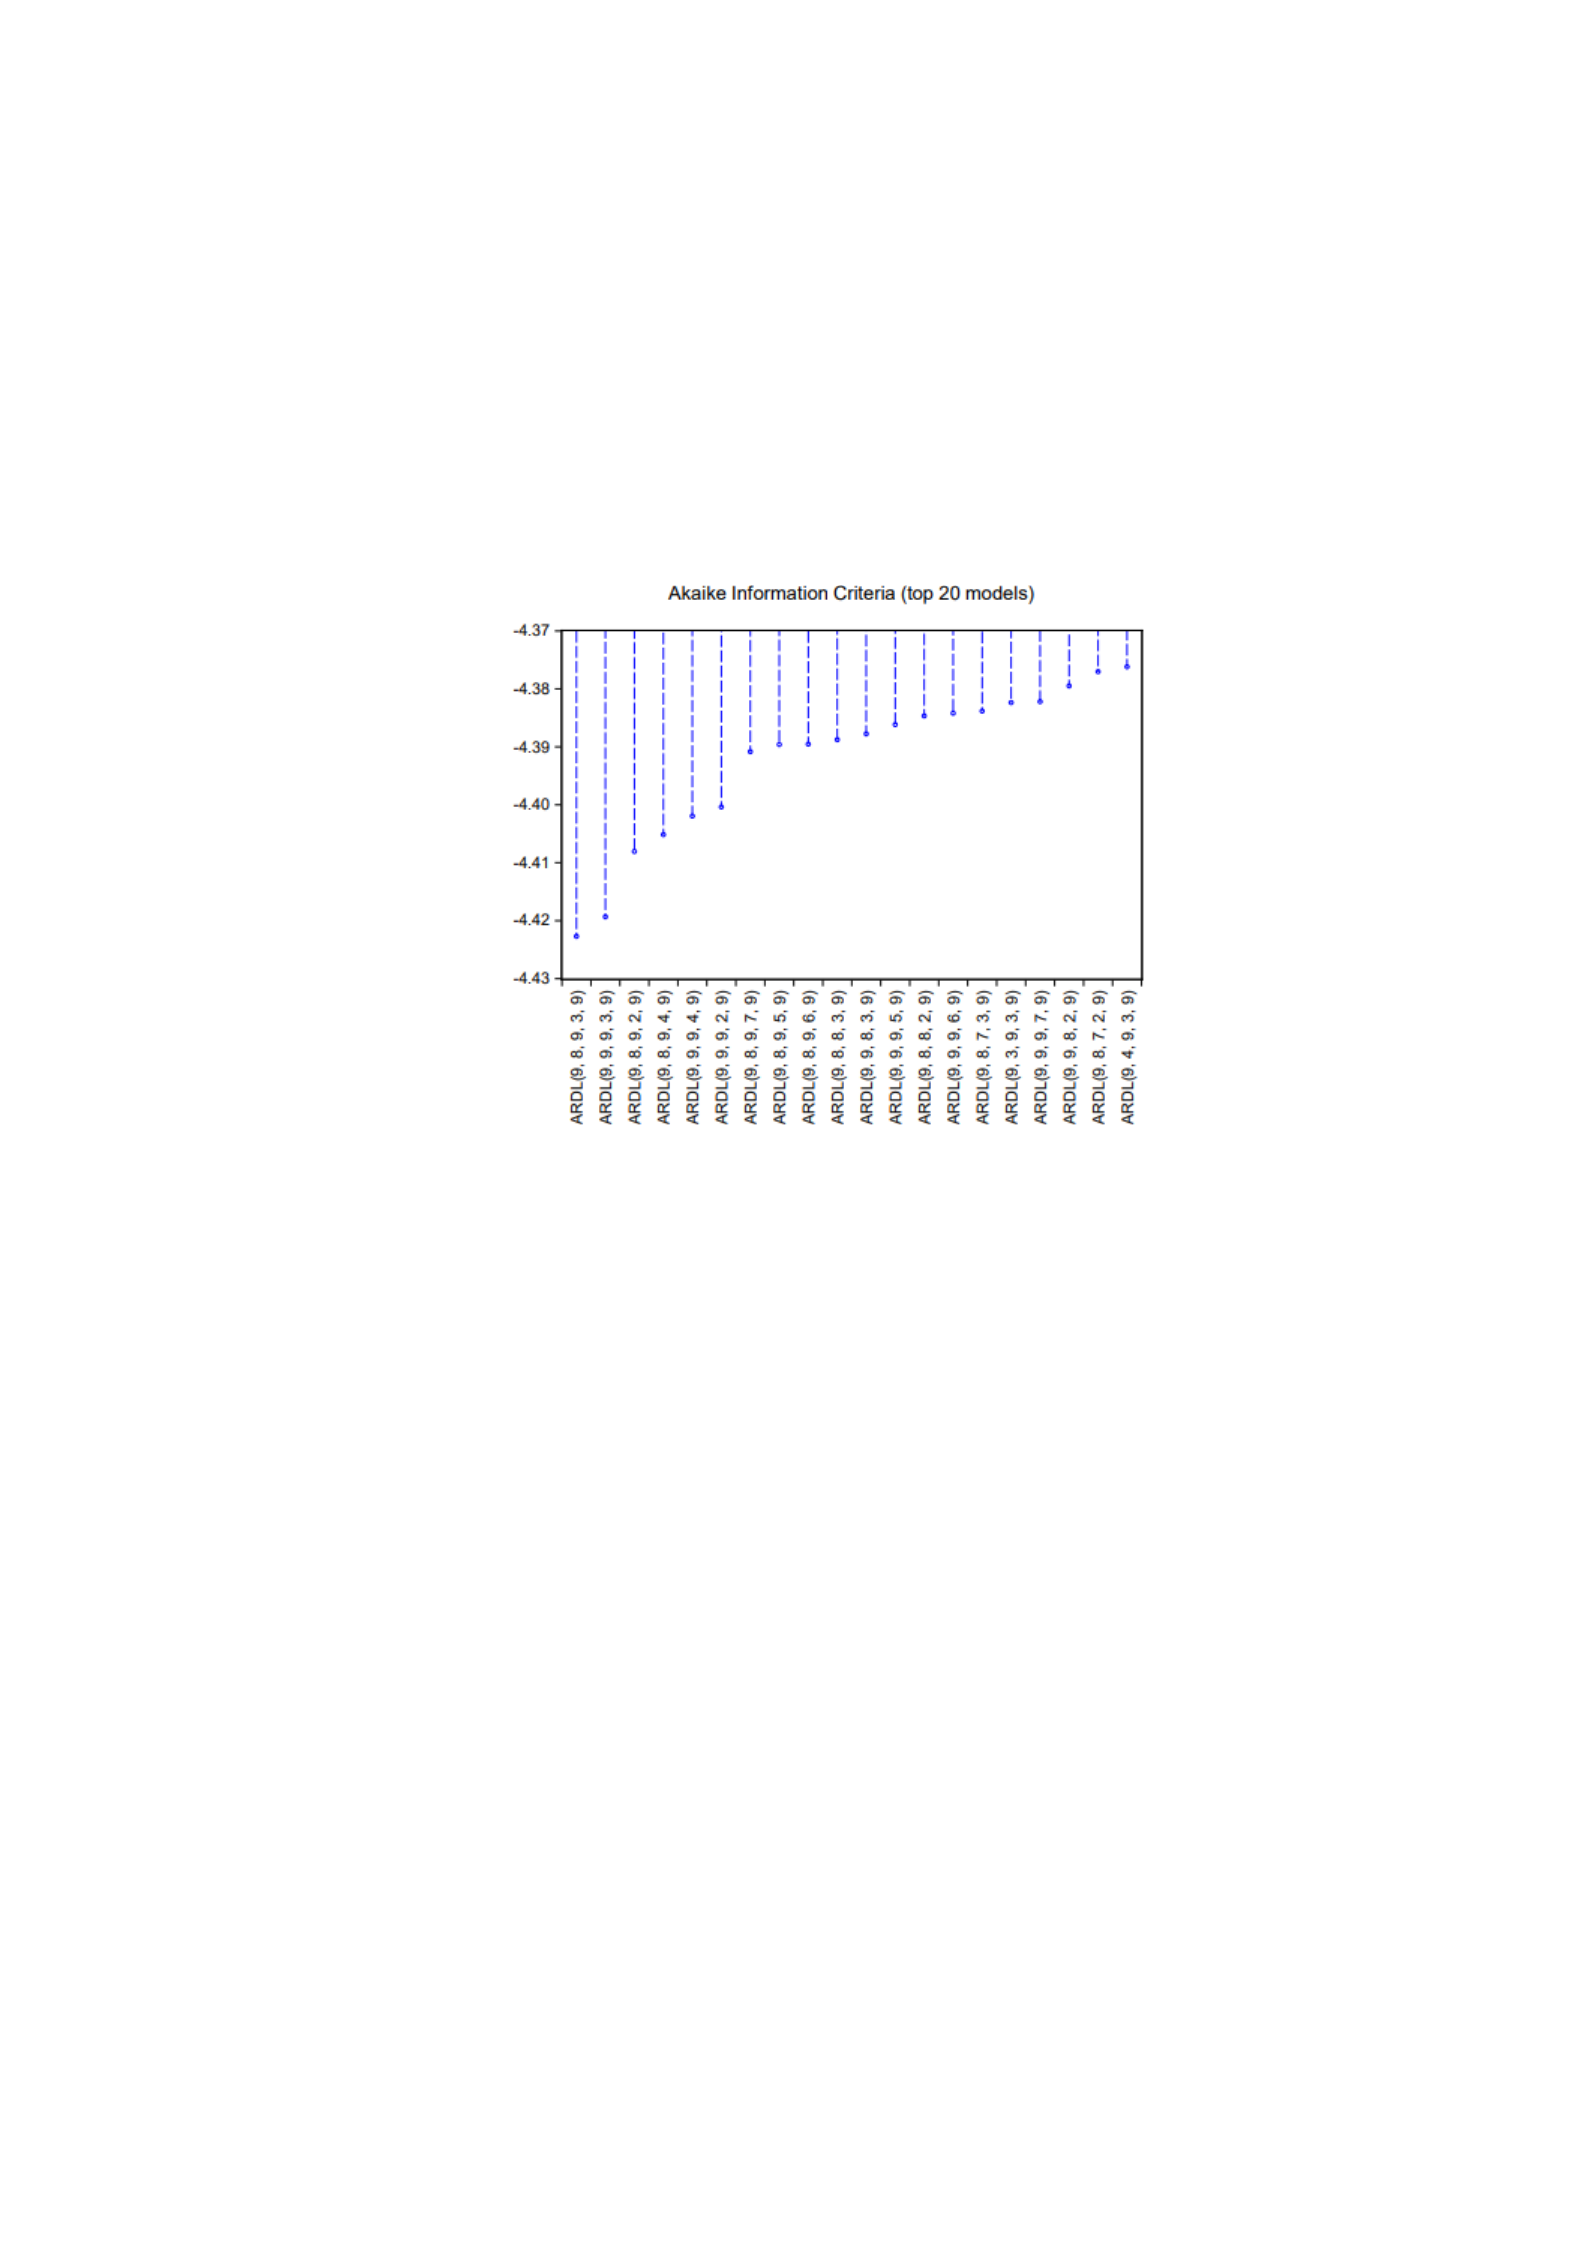
reaction of other variables. Optimum lag testing uses criteria based on the smallest AIC value at the
lag interval. Based on the results of the lag optimum test, the optimum lag selected in this study for
JCI is 9,8,9,3,9 (Figure 4).
2. Cointegration Test Results
The next step is cointegration testing which is done by comparing the F-statistic value with
the critical value. Cointegration testing aims to determine whether there is a long-term relationship
(cointegration) between variables. The method used in the cointegration test in this study is the
Bound Test Cointegration. Based on the cointegration test results, the F-statistic value of the JCI
model of 6.049100 is above the upper bound value of I(1) of 4.01. So it can be concluded that the
model has cointegration or there is a long-term relationship between variables
JCI ARDL-ECM estimation test results
The next step is to process the data using ARDL for long-term estimation and ECM for
short-term estimation. Correction with the ECM method is needed because there is a possibility of
imbalance in short-term estimation. The following are the results of the ARDL-ECM estimation test
on JCI.

12
The effect of various macroeconomic:
Based on the research results shown in Table 5, we can explain the influence of each
macroeconomic and COVID-19 variable on JCI as follows.
1. Lag effect of JCI on JCI
The JCI variable for the previous two, six, seven, and eight months has a positive and
significant influence at the 5 percent real level on the JCI with coefficients of 0.442075, 0.216867,
0.278823, and 0.223901, respectively. This means that any increase in the JCI in the previous months
by 1 percent will increase the current period JCI by 0.442075, 0.216867, 0.278823, and 0.223901
percent respectively, ceteris paribus. This shows that the JCI position in the previous period is
something that investors consider. Prices in the previous period tend to have a positive impact on
the movement of the JCI in the current period.
2. Effect of Inflation on JCI
In the short term, inflation six months earlier has a positive and significant effect at the 5
percent real level on the JCI with a coefficient of 0.018189. This result means that any increase in
the previous six months inflation by 1 percent will increase the current period JCI by 0.018189
percent, ceteris paribus. However, inflation seven months earlier has a negative and significant
effect at the 5 percent real level with a coefficient of -0.015250. These results mean that every
increase in inflation seven months earlier by 1 percent, it will reduce the current period JCI by
0.018189 percent, ceteris paribus. This finding is in line with the findings of Ranto (2019) who also
found that inflation has a negative effect on JCI in the short term. This can occur because when
inflation tends to rise, it will result in an increase in the prices of various goods and services
including capital goods for a company. If this happens, it will suppress profits and lower the JCI.
This will result in a decline in investor interest and pessimism about the company's future
performance which will result in a decline in share prices. Meanwhile, this study found that in the
long term JCI is not affected by inflation. These results are in line with Larasati's (2016) research
which also found that inflation has no effect on JCI in the long run.

13
Effect of Exchange Rate (USD/IDR) on JCI:
The exchange rate (USD/IDR) has a negative and significant effect on the JCI at the 1 percent
real level with a coefficient of -0.867120 in the short term. This means that any increase in the
exchange rate by 1 percent will reduce the current period JCI by -0.867120 percent, ceteris paribus.
These findings are in line with the research of Wahyudi et al. (2022). When the exchange rate
(USD/IDR) increases, it actually means that the rupiah is depreciating. If the rupiah weakens
against the dollar, companies that require production inputs from abroad will experience an increase
in costs and will reduce the company's ability to generate profits. This will bring pessimism to
investors regarding the company's future performance and result in a decrease in interest in the
company's shares. However, in the long term in this study it was found that the exchange rate (USD
/ IDR) has a positive and significant effect on JCI at the 1 percent real level with a coefficient of
1.011128. This result means that every 1 percent increase in the exchange rate will increase the
current period JCI by -0.867120 percent, ceteris paribus.
Effect of Brent Oil on JCI:
Based on Table 5, it is known that brent oil has no significant effect on the current period JCI
in the short term. These results are in line with Dewi's (2019) research which found that world oil
prices have no effect on JCI. However, brent oil one month earlier has a positive and significant
effect on JCI at a real level of 10 percent with a coefficient of 0.082438 in the short term. This
means that every increase in brent oil one month earlier by 1 percent will increase the current
period JCI by 0.082438 percent, ceteris paribus. Likewise, in the long term, brent oil also has a
positive and significant effect at the 1 percent real level with a coefficient of 0.274014. These results
mean that any increase in brent oil by 1 percent will increase the current period JCI by 0.082438
percent in the long run, ceteris paribus.
Effect of COVID-19 on JCI
This study found that both in the short and long term, COVID-19 has a negative and
significant effect. In the short term, COVID-19 has a negative and significant effect on JCI at a real
level of 5 percent with a coefficient of -0.035540. This means that every occurrence of COVID-19
will reduce the current period JCI by -0.035540 percent, ceteris paribus. Meanwhile, in the long
term, COVID-19 has a negative and significant effect on the JCI at a real level of 1 percent with a
coefficient of -0.096113. These results mean that every occurrence of COVID-19 will reduce the JCI
by -0.096113 percent in the long term, ceteris paribus.

14
This finding is in line with the research of Shedo et al. (2023) which also found that
COVID-19 has a negative effect on JCI. The pandemic has destabilized the economy around the
world, including Indonesia, forcing people to hold back on unnecessary purchases. This has resulted
in a decrease in demand for various goods and services to reduce company profits and even losses.
These uncertain conditions led investors to panic selling in the capital market to protect their assets.
The occurrence of panic in the market resulted in the correction of stock prices which was reflected
in the correction of the JCI.
Post-estimation Test Results
In the post-estimation test, a series of classical assumption tests are conducted to ensure that
there are no autocorrelation or heteroscedasticity problems in the model. In addition, a stability test
is also conducted to test the stability of the model in both the short and long term.
Classical Assumption Test:
Classical assumption testing has the aim of knowing whether the research model is free from
problems that can doubt the research results. The model can be said to be good if it meets classical
assumption tests such as residuals free from autocorrelation and homogeneous variance of sisaan
(free from heteroscedasticity). The classic assumption test can be done by comparing the probability
value of the F-statistic with the real level.
Table 5 Classical assumption test results
Classical Assumption Test Probability
Autocorrelation 0,6194
Heteroscedasticity 0,9928
Source: EViews 9
Table 5 shows that the probability of the F-statistic is greater than the 5 percent real level in
the JCI model. Based on this, it can be concluded that there are no autocorrelation and
heteroscedasticity problems in the JCI (9,8,9,3,9) ARDL-ECM model.
Stability Test:
Furthermore, a stability test can be conducted using the cumulative sum of recursive model
test (CUSUM test). This stability test can see the suitability of the ARDL-ECM model used in the
study. The stability test also aims to detect stability in both the short and long term. The CUSUM
test results will be in the form of a line plot with a real level of 5 percent. If the plot of the
cumulative sum is within the line area, the parameters estimated in the study are stable.

