


lOMoARcPSD|52269135
1
Selling Price and Area Analysis for D.M. Pan National Real Estate Company
Report: Selling Price and Area Analysis for D.M. Pan National Real Estate Company
Jaycee Dal Porto
Southern New Hampshire University
lOMoARcPSD|52269135
Selling Price Analysis for D.M. Pan National Real Estate Company 2
Introduction
This report will examine the relationship between square footage of homes and their
respective listing price. For the purpose of this report, we will select a random sample of the East
North Central Region of the United States to analyze. This region can include all counties in the
following states: Michigan, Ohio, Illinois, Wisconsin, and Indiana.
Representative Data Sample
This random sample was taken from the East North Central Region of the United States.
Median
Median Median Listing Square Median
Square Feet Price Feet Listing Price
Sample 1 1434 $102,450 Mean 1804 $195,222
Sample 2 1446 $99,970 Median 1723 $162,974
Sample 3 1449 $110,053 St. Deviation 427.116 $100,552.32
Sample 4 2472 $495,568 Sample 5
1563 $114,255
Sample 6 1767 $156,788
Sample 7 1591 $128,071
Sample 8 1726 $220,956
Sample 9 1844 $210,494 Sample 10 1090
$169,160
Sample 11 2094 $325,794
Sample 12 1494 $94,494
Sample 13 1327 $129,273
Sample 14 1818 $224,277
Sample 15 1832 $252,807
Sample 16 1552 $124,954
Sample 17 1667 $137,148
Sample 18 2173 $279,481
Sample 19 1811 $127,413
Sample 20 1606 $94,994
Sample 21 1482 $127,516
Sample 22 3099 $440,864
Sample 23 2117 $198,174
Sample 24 1736 $229,174
Sample 25 2413 $253,514
Sample 26 1822 $277,720

lOMoARcPSD|52269135
Selling Price Analysis for D.M. Pan National Real Estate Company 3
Sample 27 2712 $280,054
Sample 28 1709 $105,965
Sample 29 1720 $226,137
Sample 30 1546 $119,143
Data Analysis
This sample is not very representative of the national market. When looking at the
national market, the median listing price is $288,407 and for the above sample, the average
median listing price is $195,222, meaning that houses in this area are listed for significantly less
than the national market. Further, the average square footage in the random sample came in at
1,804, while the average national square footage of listed homes was 1,944, therefore it can be
inferred that the average house on the market in this random sample tend to be smaller in size
and less expensive than the national averages. The standard deviation of the measured homes
also vary widely between the sample and the national average, with the sample having a standard
deviation of 427.116 for square footage and $100,552.32 for listing price, while the national
standard deviation for square footage is 367 and the listing price is $163,986. Given this
comparison of information, the same is not reflective of the national market.
In order to ensure that a completely random sample of one region was taken, opportunity
for human biases and error were removed. This was achieved by assigning each county in the
region a random computer-generated value. From there, the data from each county was sorted
from smallest to largest by the random value assigned to it. Once sorted by the random value, the
first 30 counties were used as the random sample. This method of choosing 30 random counties
ensures that there is no unknown biases that may be present when choosing, thus relying on the
computer to generate a completely random sample.
lOMoARcPSD|52269135
Selling Price Analysis for D.M. Pan National Real Estate Company 4
Scatterplot
The Pattern
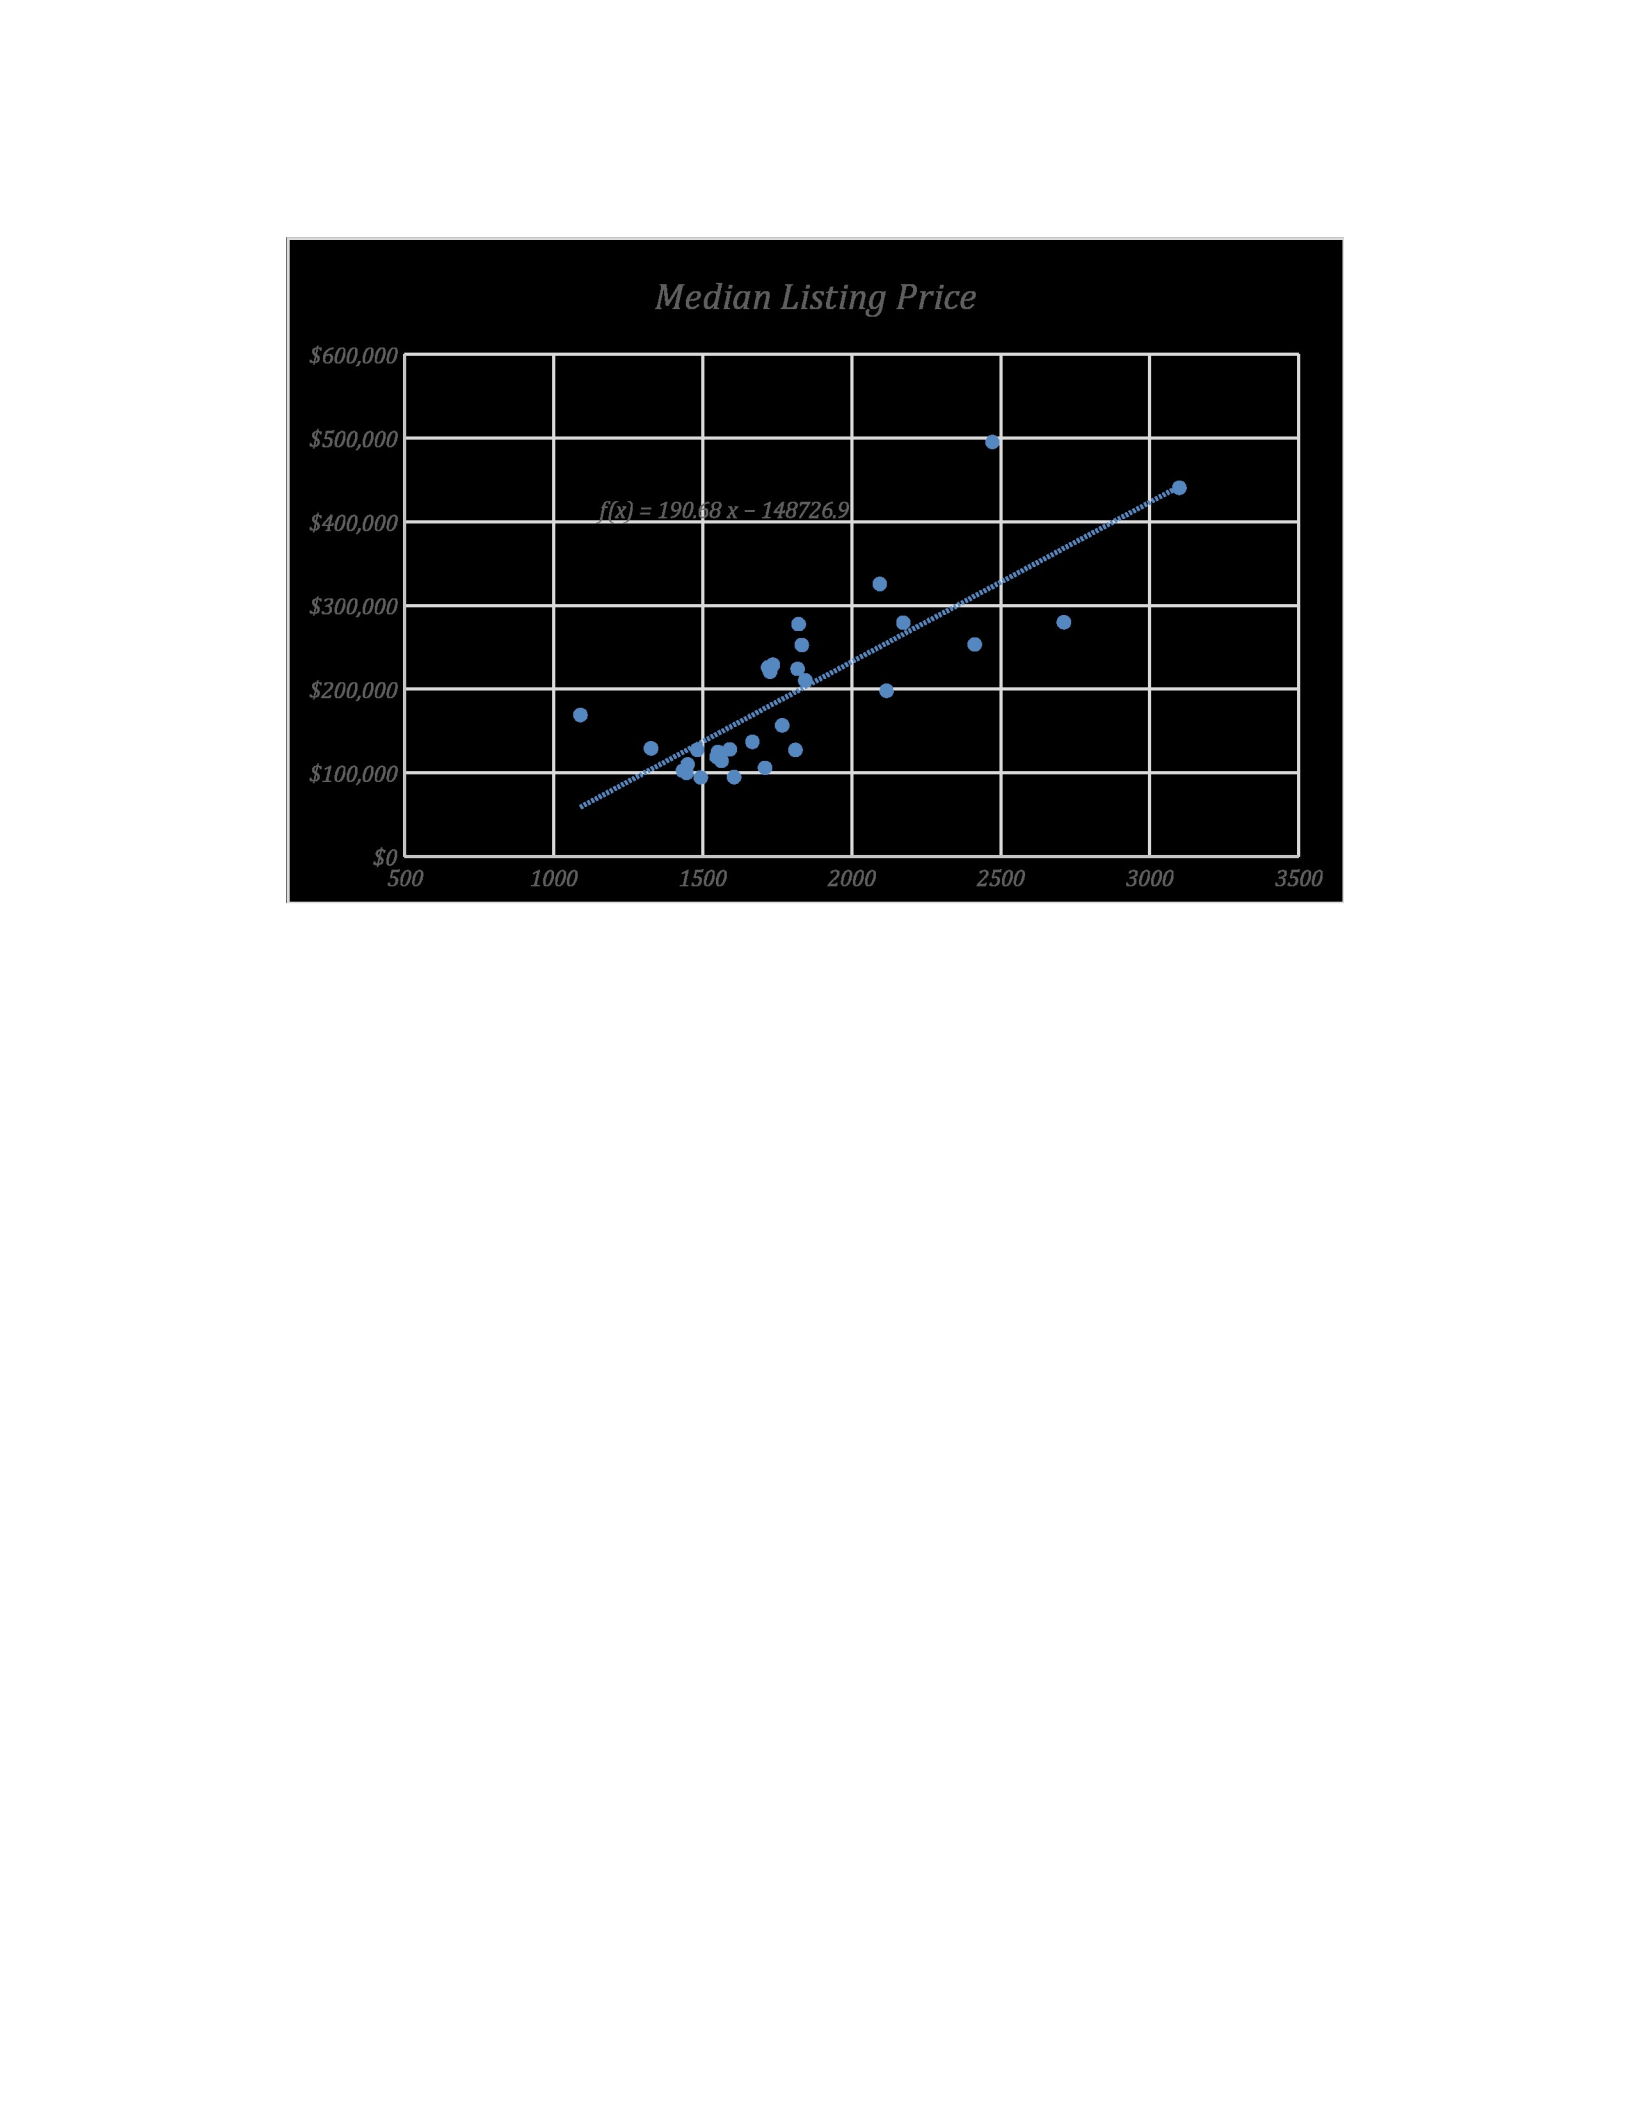
The independent variable (X) in the scatterplot above is the median square feet of the
sample homes. The dependent variable (Y) is the median listing price. Given that the
independent variable (also known as the predictor variable) is the median square feet of the
sampled homes, that is the variable that would be useful for making predictions, as it is the
variable that predicts the value of Y.
The association between X and Y that can be seen on the above scatterplot is that as the
median square footage of homes rise, so does the median listing price of the homes. Therefore
there is a positive relationship between the two variables. The relationship can also be described
as linear, which is demonstrated on the scatterplot with the trend line.
The regression equation of the scatterplot is y=190.68x-148,727. Given this information,
if a 1,200 square foot home were to be listed on the market, the price should be set at $80,089

lOMoARcPSD|52269135
Selling Price Analysis for D.M. Pan National Real Estate Company 5
($80,089=190.68(1,200)-148,727). There are a few outliers on the scatterplot, the largest one
being the home listed at $495,568 but is only 2,472 square feet large. Given the equation, the
home should have been listed at $322,633. The cause of this could be that the home could have
upgrades that are not usual, such as a recent complete remodel, a very large yard with a pool, etc.
These outliers represent numbers that fall a certain amount outside the normal variance of the
other values.

