


PSYC 354
SPSS HOMEWORK: TESTING DATA FOR NORMALITY TEMPLATE
Problem Set 1: Be sure you have added your initials into the variable name so they show up
in any output and graphs. For example, “EATING_DRINKING_ABC”
1. For the “EATING_DRINKING” variable, using the “Explore” command, test the data for
normality (as shown in the SPSS tutorial) by performing the following steps:
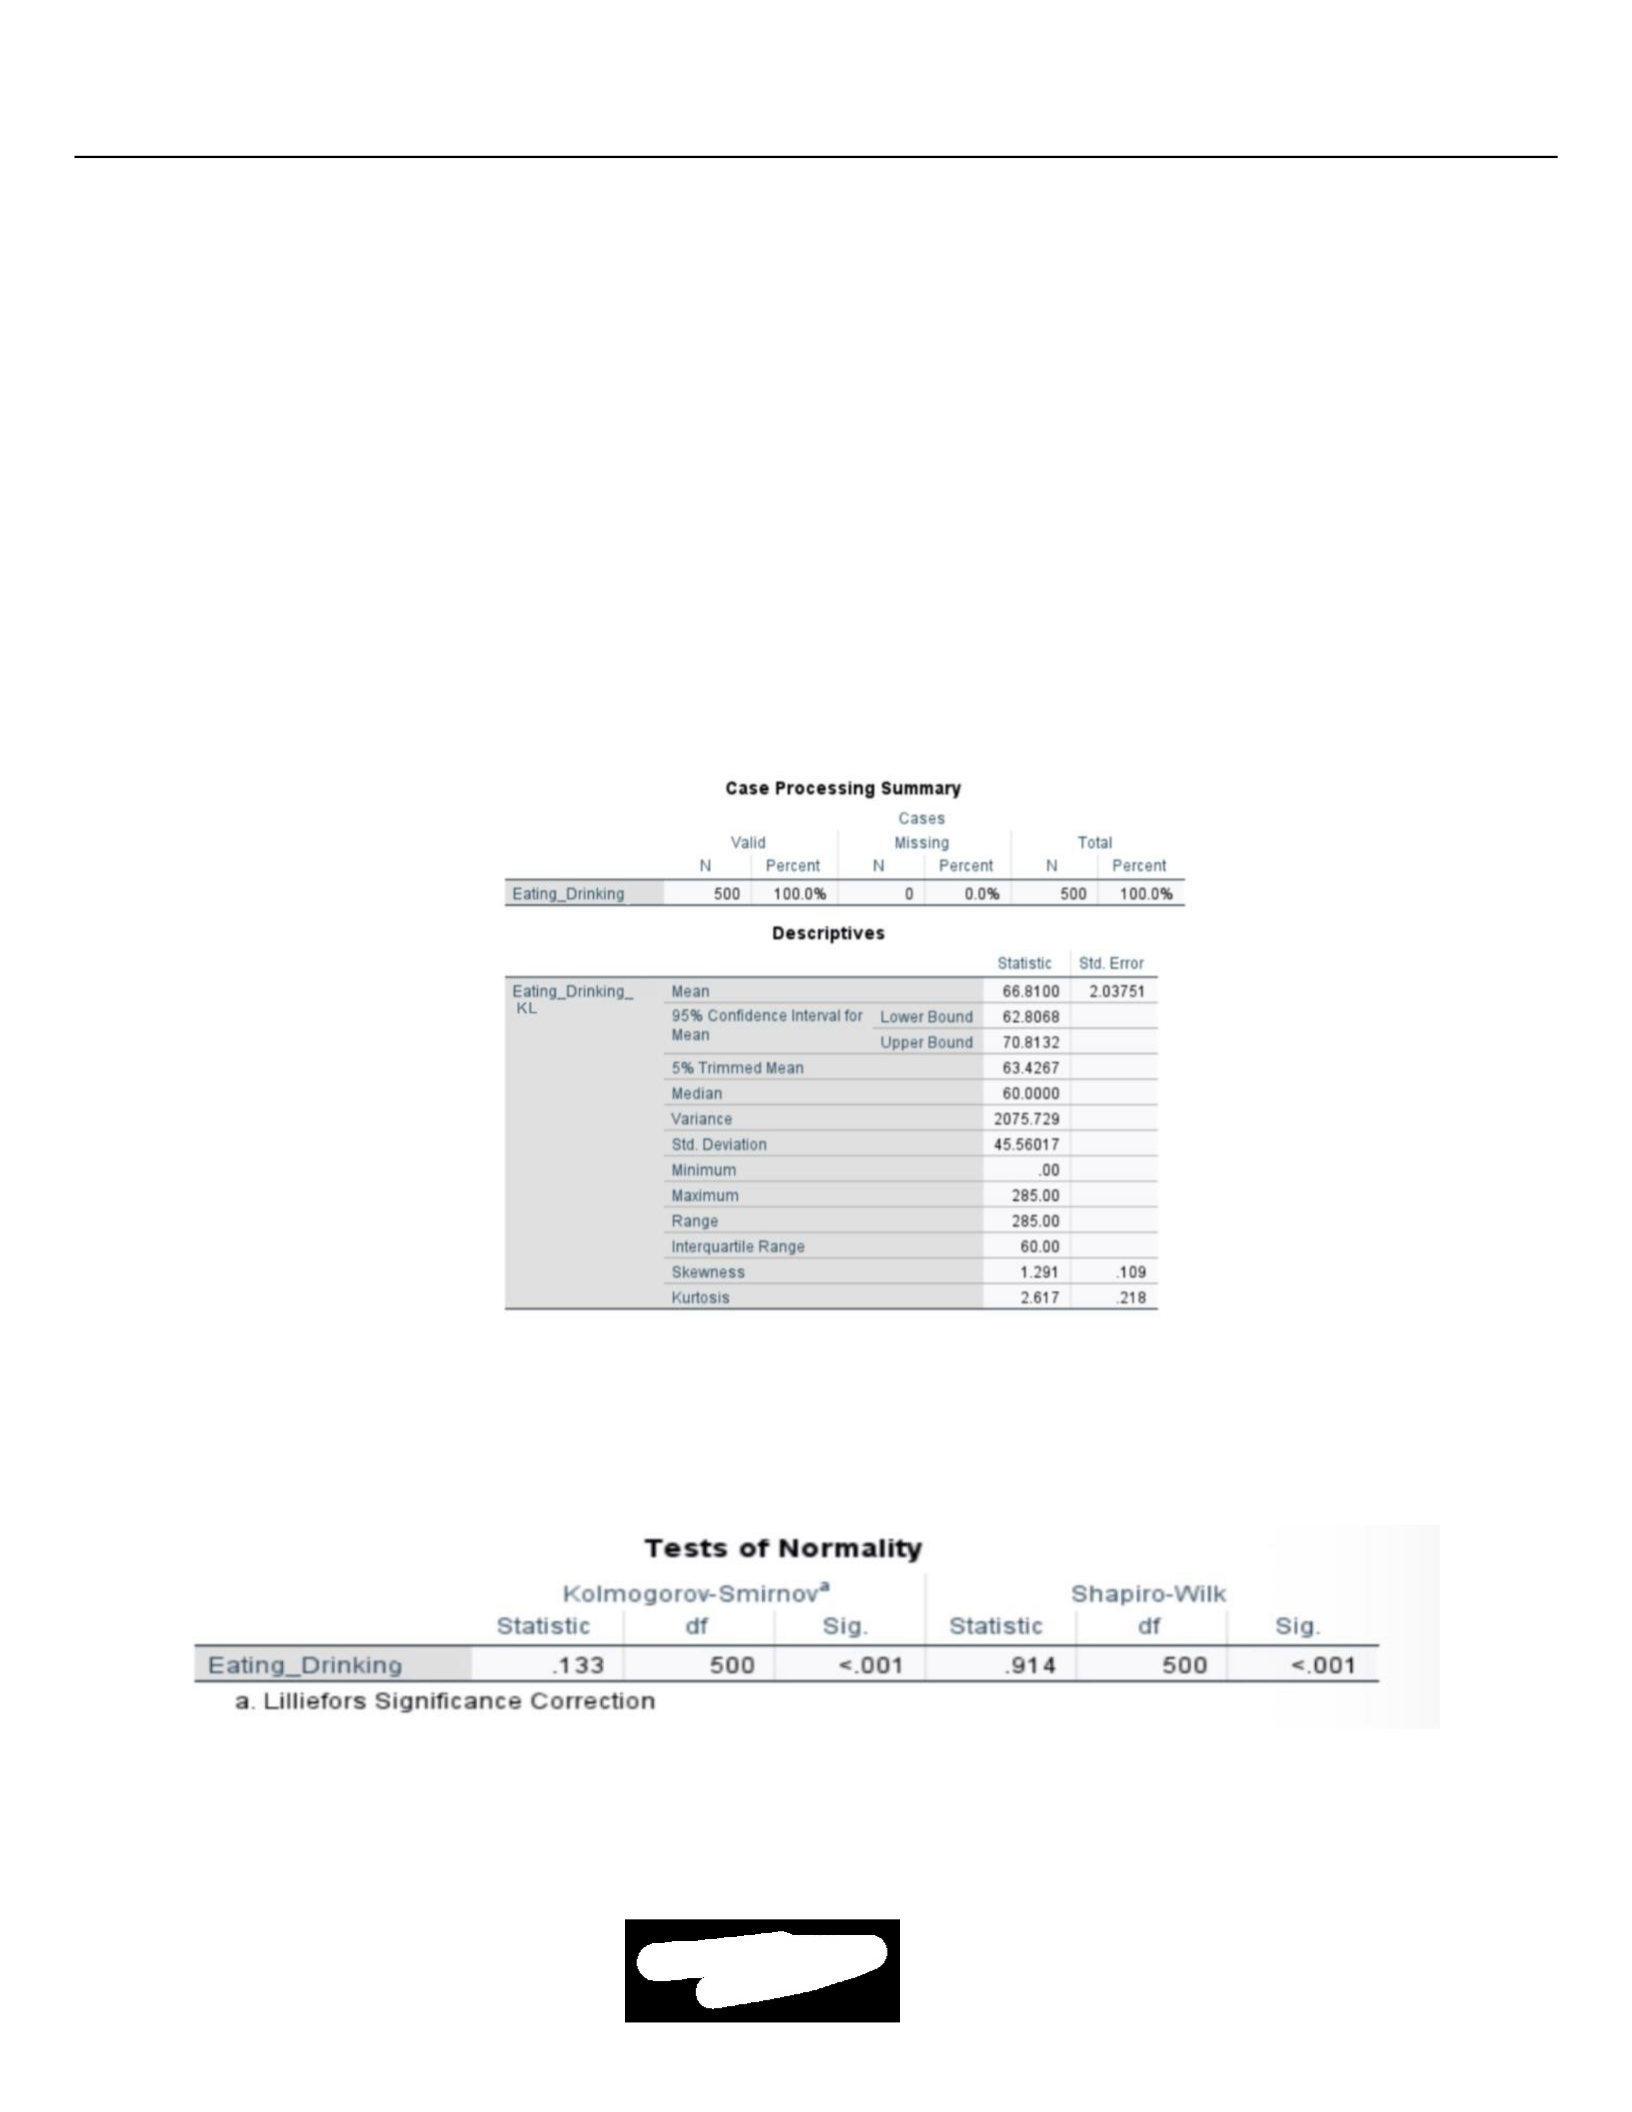
a. Create a table of descriptive statistics for this variable. Paste the table here: (6 pts)
b. Run a Kolomogorov-Smirnov/ Shapiro-Wilks test for this variable. Paste the table
here: (6 pts)
c. Create a “Normal Q-Q plot” for this variable. Paste the table here: (6 pts)

PSYC 354
2. Create a histogram for the “EATING_DRINKING” variable. Paste the histogram here: (6
pts)
Eating_Drinking_KL
3. In several sentences, discuss whether the daily minutes of eating and drinking is normally
distributed in this sample. Justify your answer using information from numbers 1 and 2
above. (6 pts)
The daily minutes of eating and drinking is not normally distributed in this sample. The
significance level is 0.001 but in order for there to be a normal distribution, the
significance level would have to be at least 0.05. With a mean of 66.81 and a median of
Normal Q -Q Plot of Eating_Drinking_KL

PSYC 354
60 there is clearly shown to have a significant variance. There are outliers and deviates
from the expected normal in the Normal Q-Q plot and has a high positive distribution of
1.291.
Problem Set 2: Be sure you have added your initials into the variable name so they show up
in any output and graphs. For example, “SLEEPING_ABC”
1. For the “SLEEPING” variable, using the “Explore” command, test the data for normality
by performing the following steps:
a. Create a table of descriptive statistics for this variable. Paste the table here: (6 pts)
b. Run a Kolomogorov-Smirnov/ Shapiro-Wilks test for this variable. Paste the table
here: (6 pts)
c. Create a “Normal Q-Q plot” for this variable. Paste the table here: (6 pts)

PSYC 354
Normal Q-Q Plot of Sleeping_KL
2. Create a histogram for the “SLEEPING” variable. Paste the histogram here: (6 pts)

PSYC 354
Sleeping_KL
3. Some might argue that the amount of sleep people report is normally distributed. Based
on careful evaluation of ALL of the data in numbers 4 and 5, would you agree or disagree
that minutes of “Sleep” is normally distributed in this sample? Support your answer with
information from the data and the reading/presentations this week. (6 pts)
I would agree that the amount of sleep reported is normally distributed. I believe this is
supported by the histogram and the Q-Q plot follows the expected normal pattern. The mean of
557.36 and the median 555 suggest that the minutes are evenly distributed as well. The rest of the
data seems to be normally distributed even though the significance level is 0.001 overall.
Powered by TCPDF (www.tcpdf.org)

