


lOMoARcPSD|22015503
MATH 201 Graph Project
Introduction to Probability and Statistics (Liberty
University)

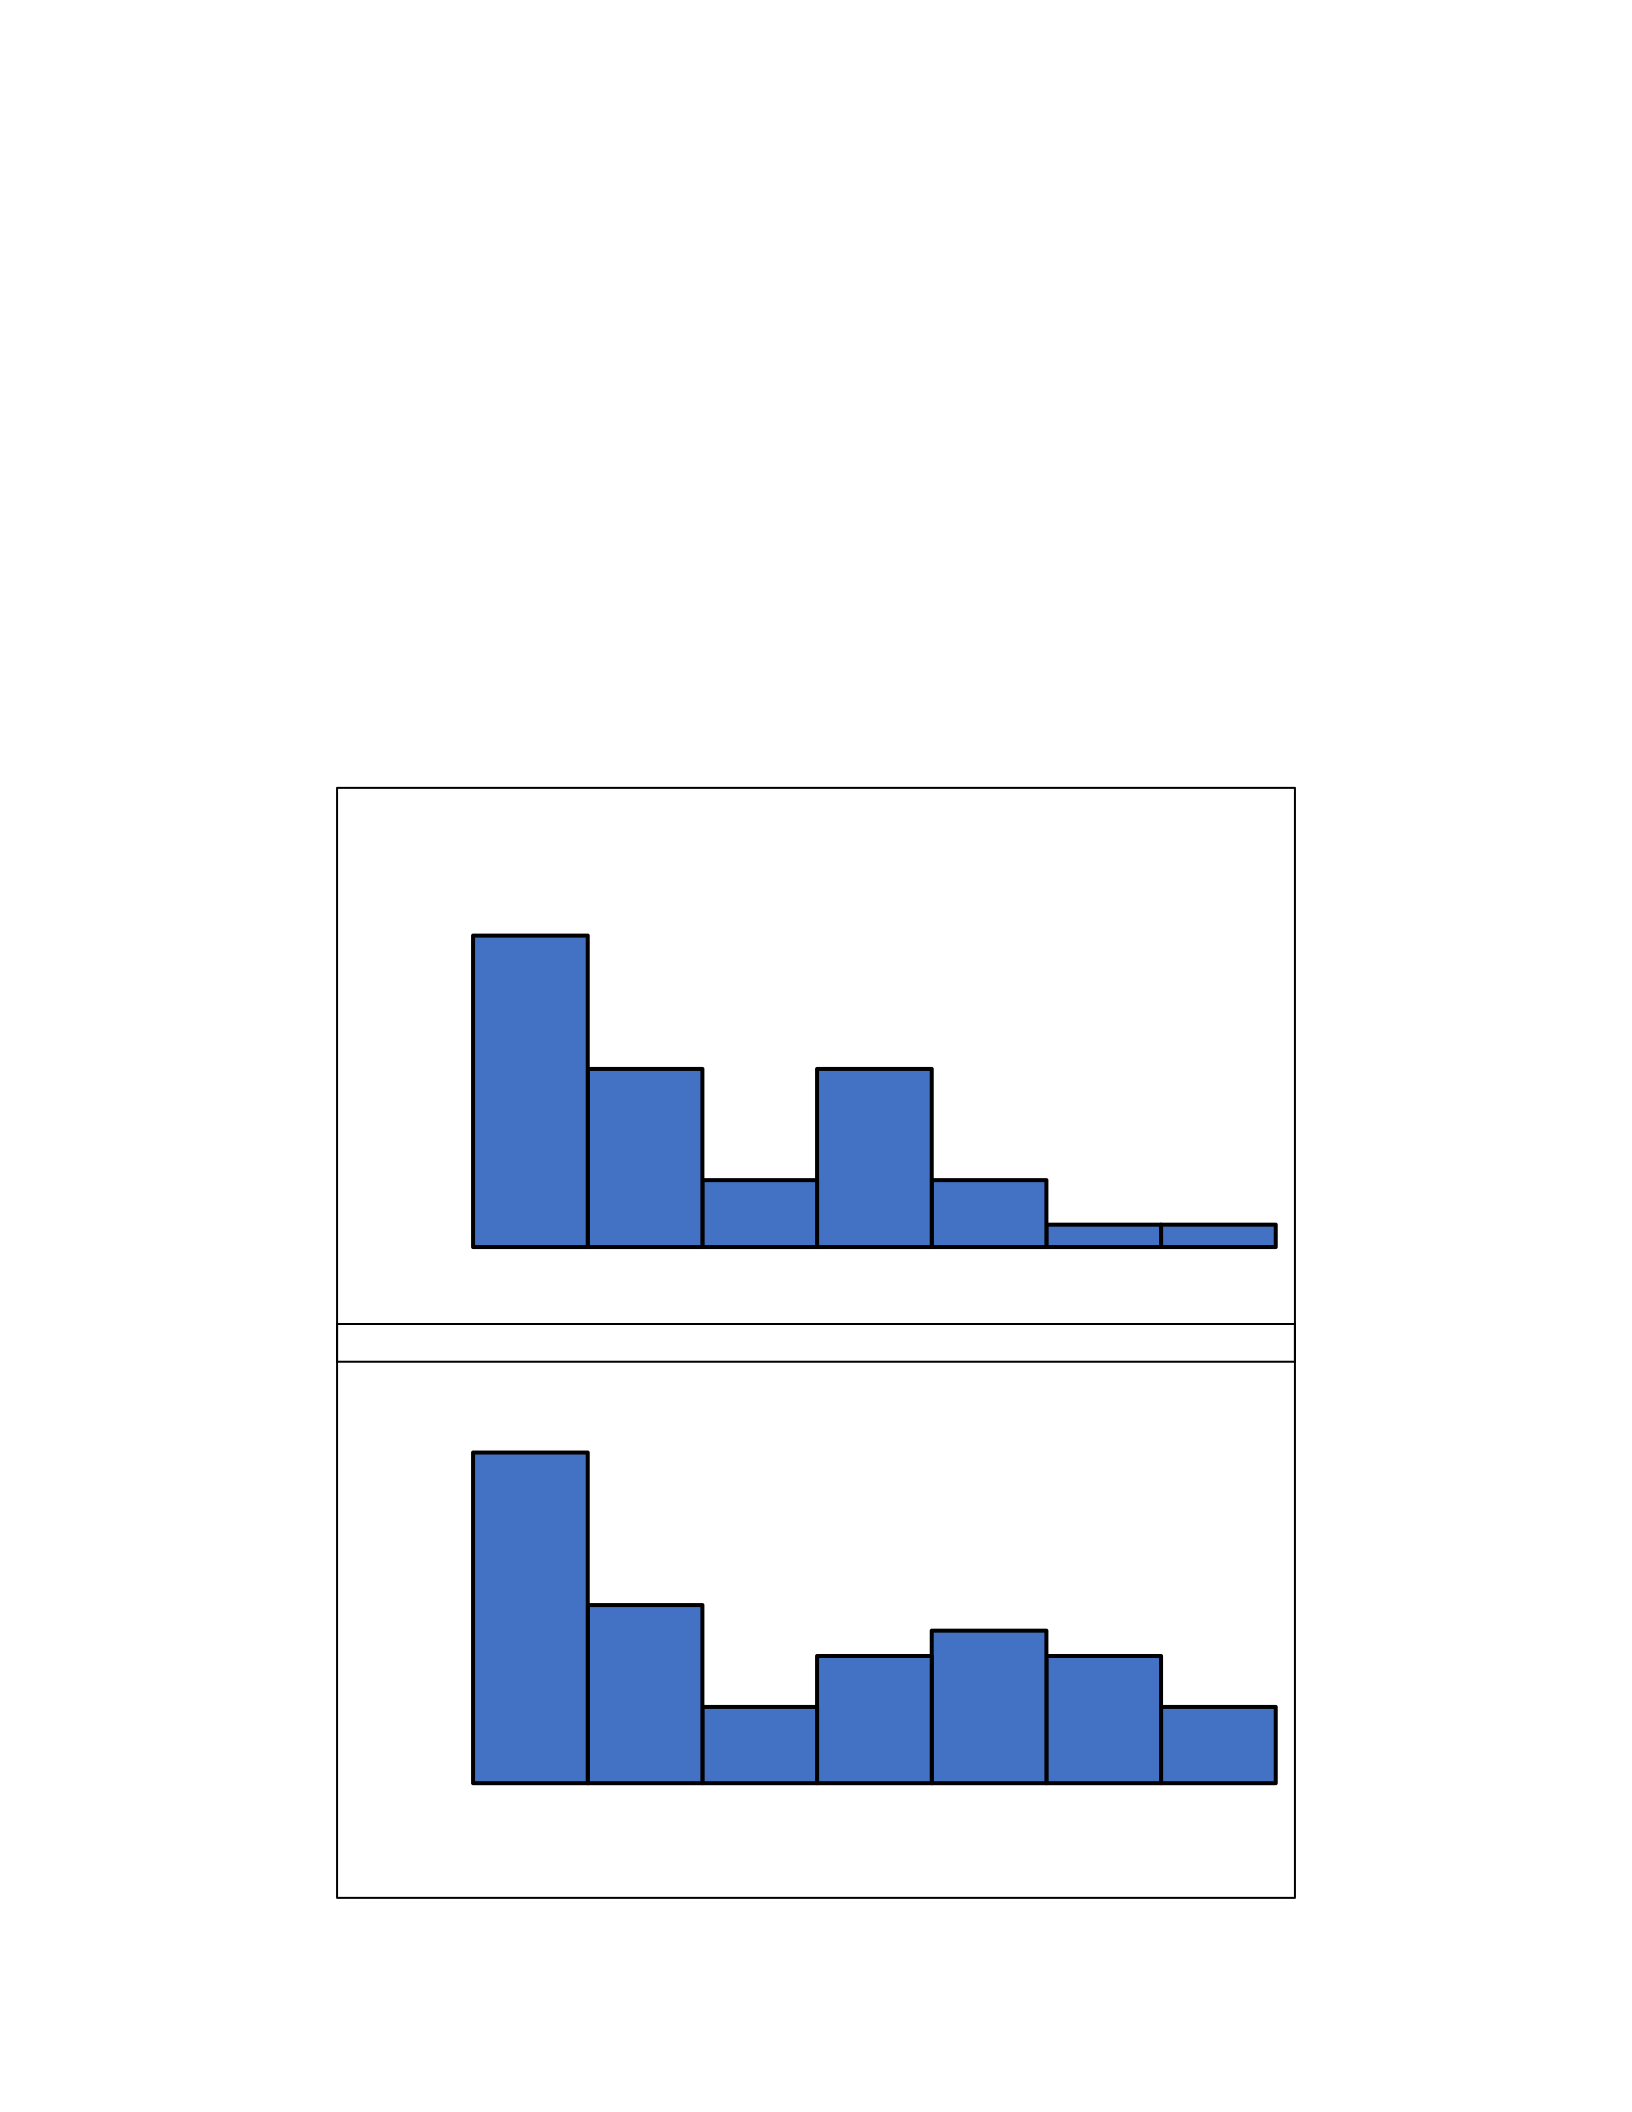
Life-span of Vice-Presidents After Office
14
12
10
8
6
4
2
00-5 6--10 11--1516--2021--2526--3031--35
Years after
office
Life-span of Presidents After Office
16
14
12
10
8
6
4
2
0
0-5 6--10 11--15 16-2021-25 26-30 31-35
Years after office
lOMoARcPSD|22015503
Catherine
Morales Graph
Project MATH
201—010
19 September 2017
Being President or Vice President of the United States of America is
an enormous task, and the stress of the job can be seen on the faces of
presidents throughout their years in office. These graphs show how long
former presidents and vice presidents lived after they exited office. They
also take into account presidents and vice presidents who died in office,
since their deaths were often caused by the stress and danger of their
position. Conclusion? 36% of presidents die within 5 years of leaving office,
and 31% of vice presidents. Based on the data, I would recommend being
Vice-President, as you have a greater chance of living longer after office.
# of Vice
# of

