


Liberty University SOE 04-20-2018
GROUP # WRITE-UP: ASSIGNMENT NAME
by
Furman Leopard, Amy Lundgren, Rebecca Peeler, Zaida Saldivar & Ashleigh Yearde
Liberty University
Partial Fulfillment
Of the Requirements for EDUC 812
Liberty University
2019

Liberty University SOE 04-20-2018
FINDINGS
Research Question
The research question for this study was:
RQ1: Is there a difference in the relationship between the criterion variable (Stats Exam
Scores) and the linear combination of predictor variables (Math test, English test, English GPA,
Math GPA, and Other GPA) for college students.
Null Hypothesis
The null hypothesis for this study was:
H01: There will be no significant predictive relationship between the criterion variable
(Stats Exam Scores) and the linear combination of predictor variables (Math test, English test,
English GPA, Math GPA, and Other GPA) for college students.
Descriptive Statistics
Data obtained for the criterion variable (Stats Exam Scores) and the linear combination of
predictor variables (Math test, English test, English GPA, Math GPA, and Other GPA) for college
students can be found in Table 1.
Table 1
Descriptive Statistics
Mean
Std.
Deviation N
Average percentage
correct on statistics
exams
60.11 19.788 100
Math aptitude test
score
460.60 77.366 100
English aptitude test
score
478.20 71.653 100
Liberty University SOE 04-20-2018
High school English
GPA
2.8183 .27633 100
High school math
GPA
2.7763 .30234 100
GPA in other high
school classes
3.0236 .22220 100
Results
Data screening
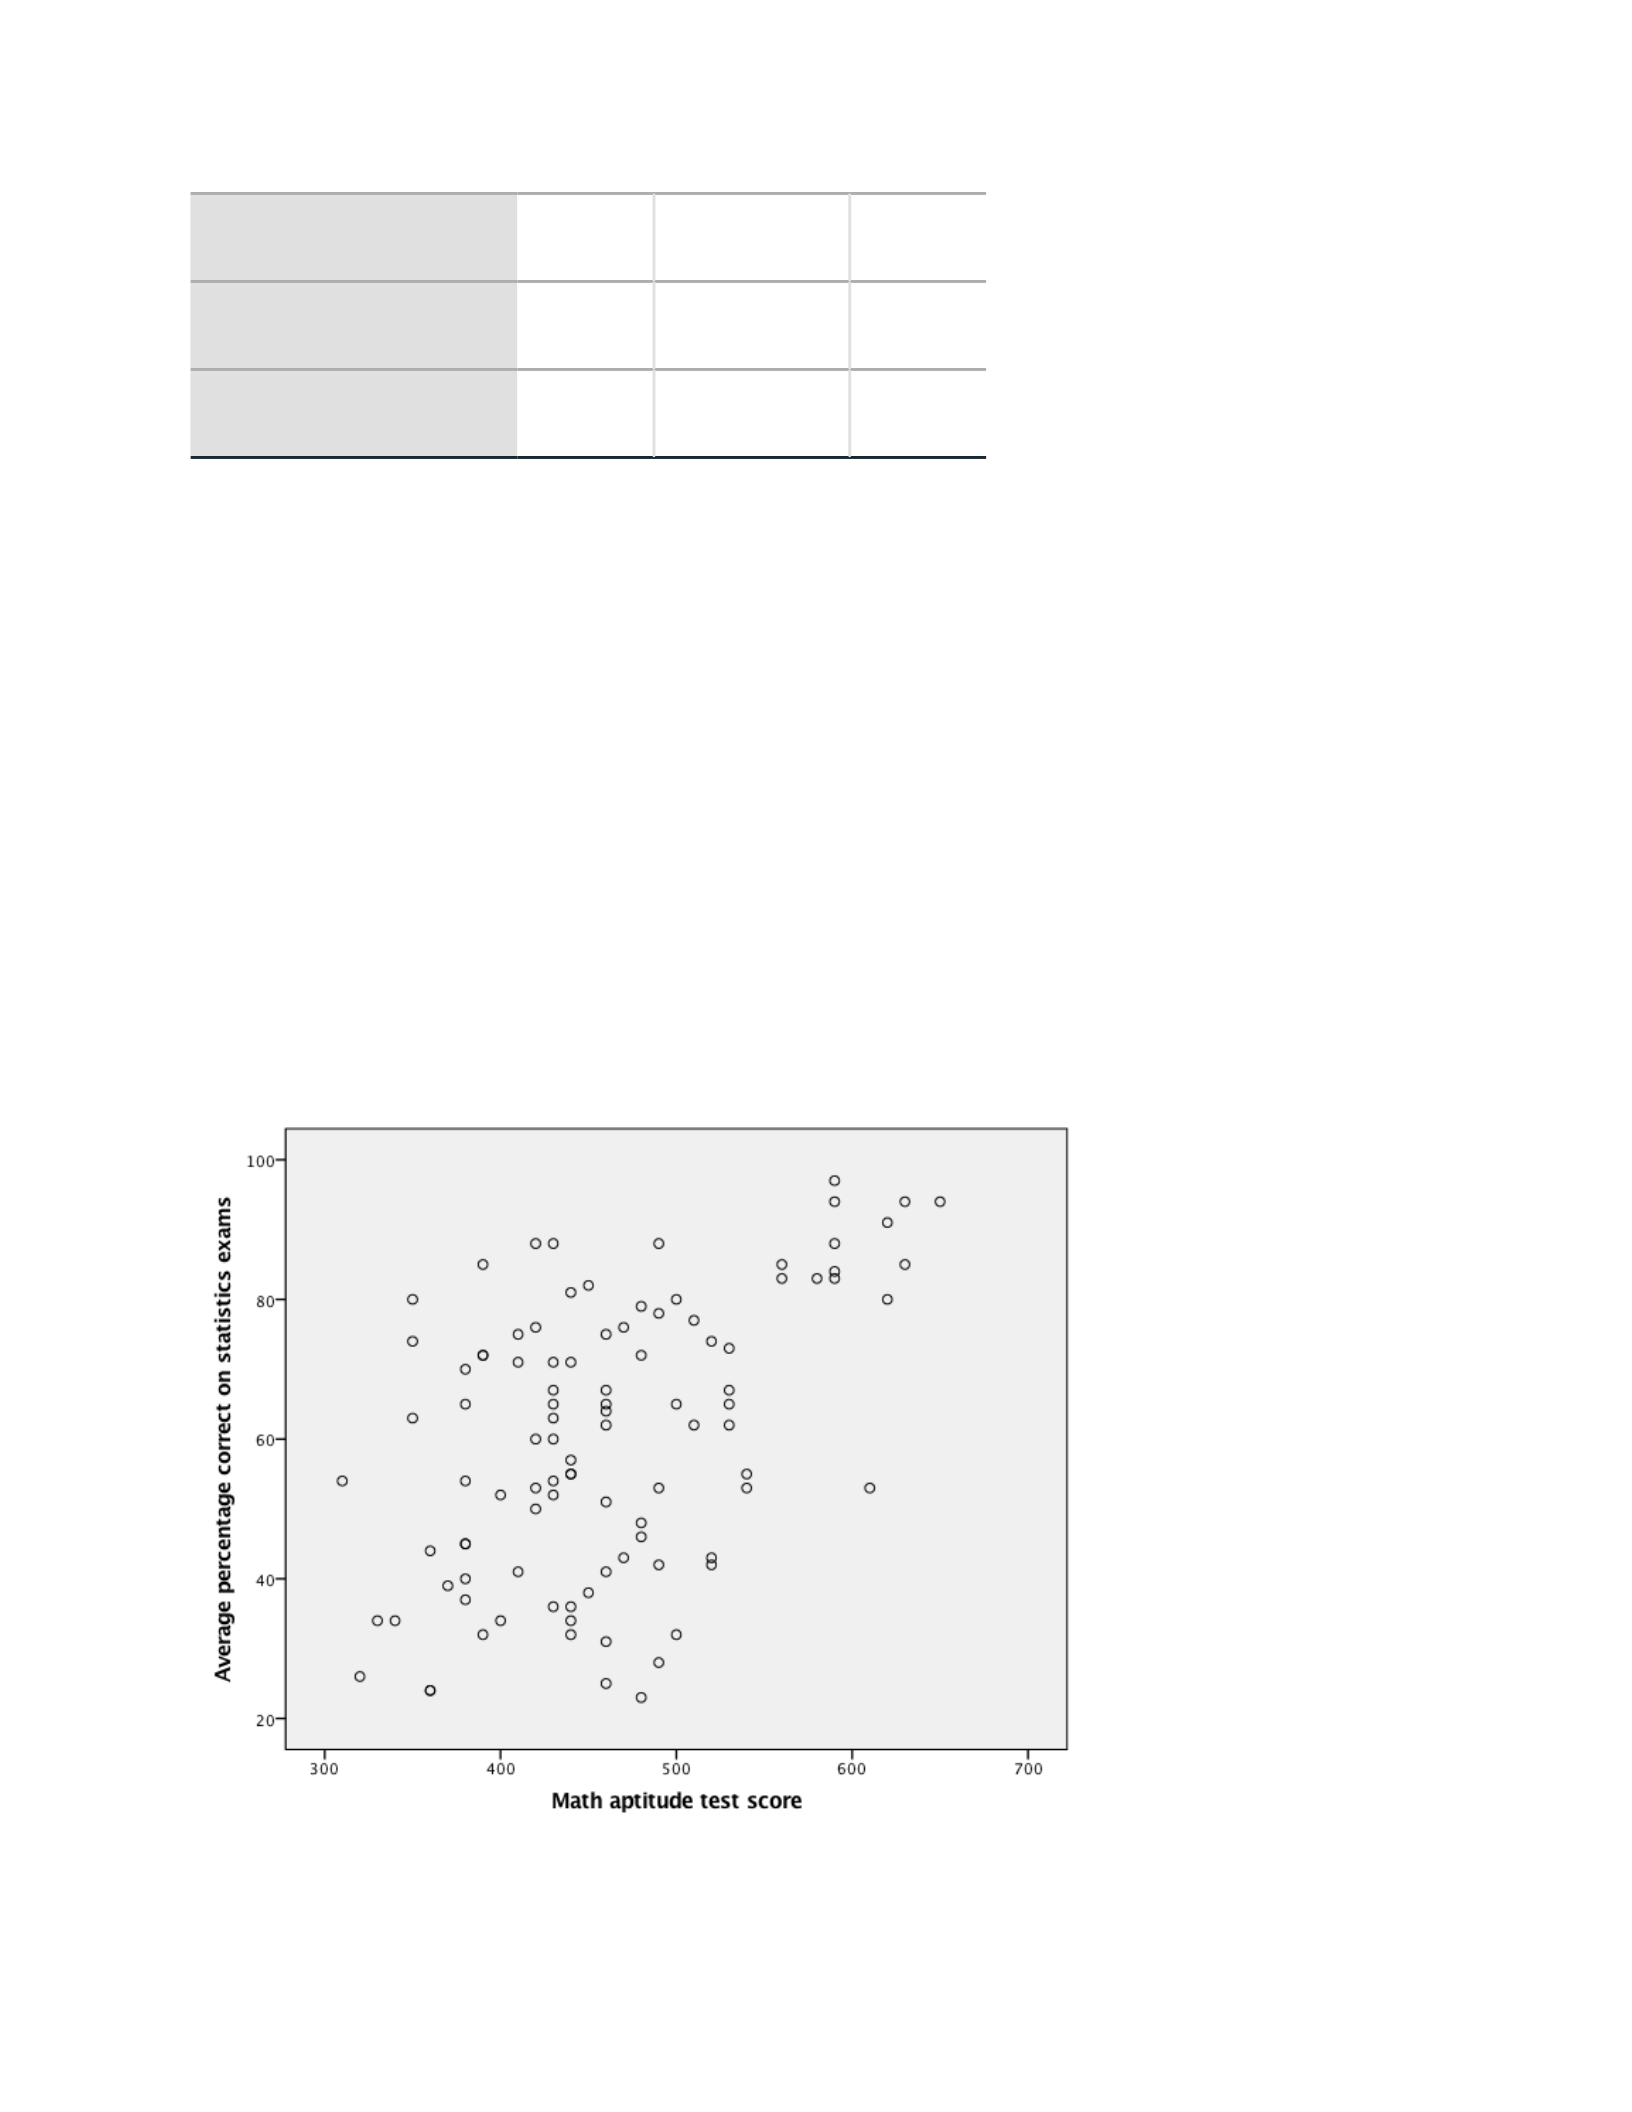
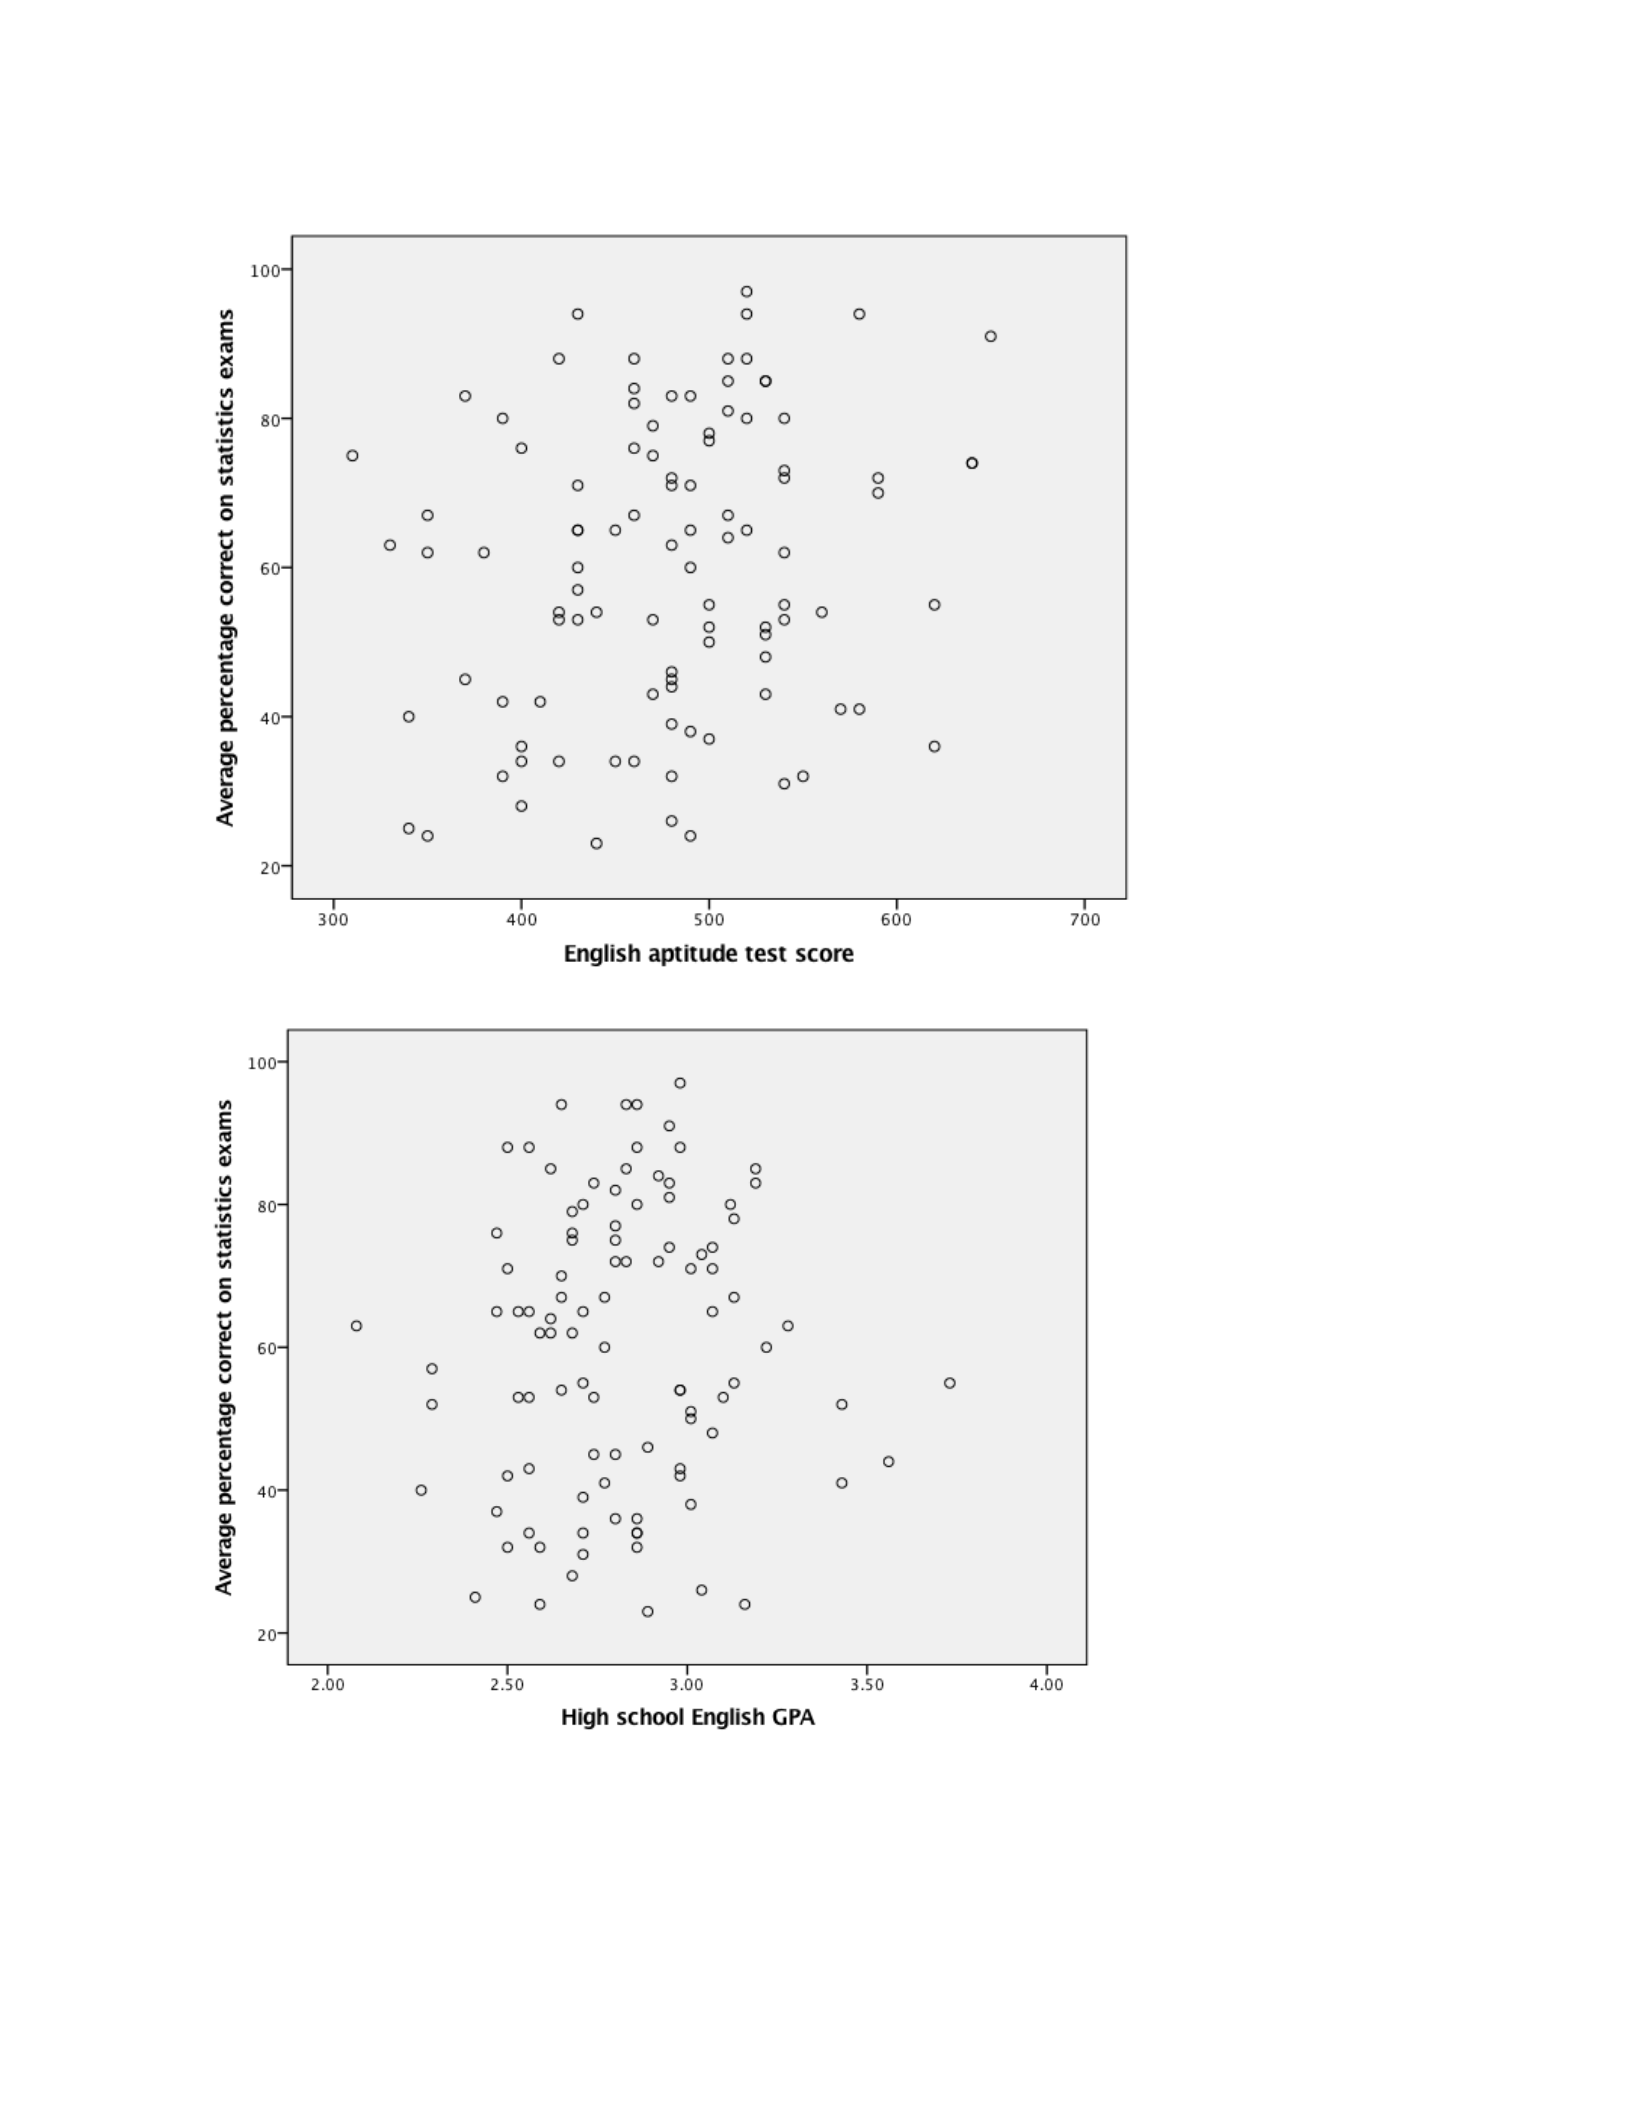
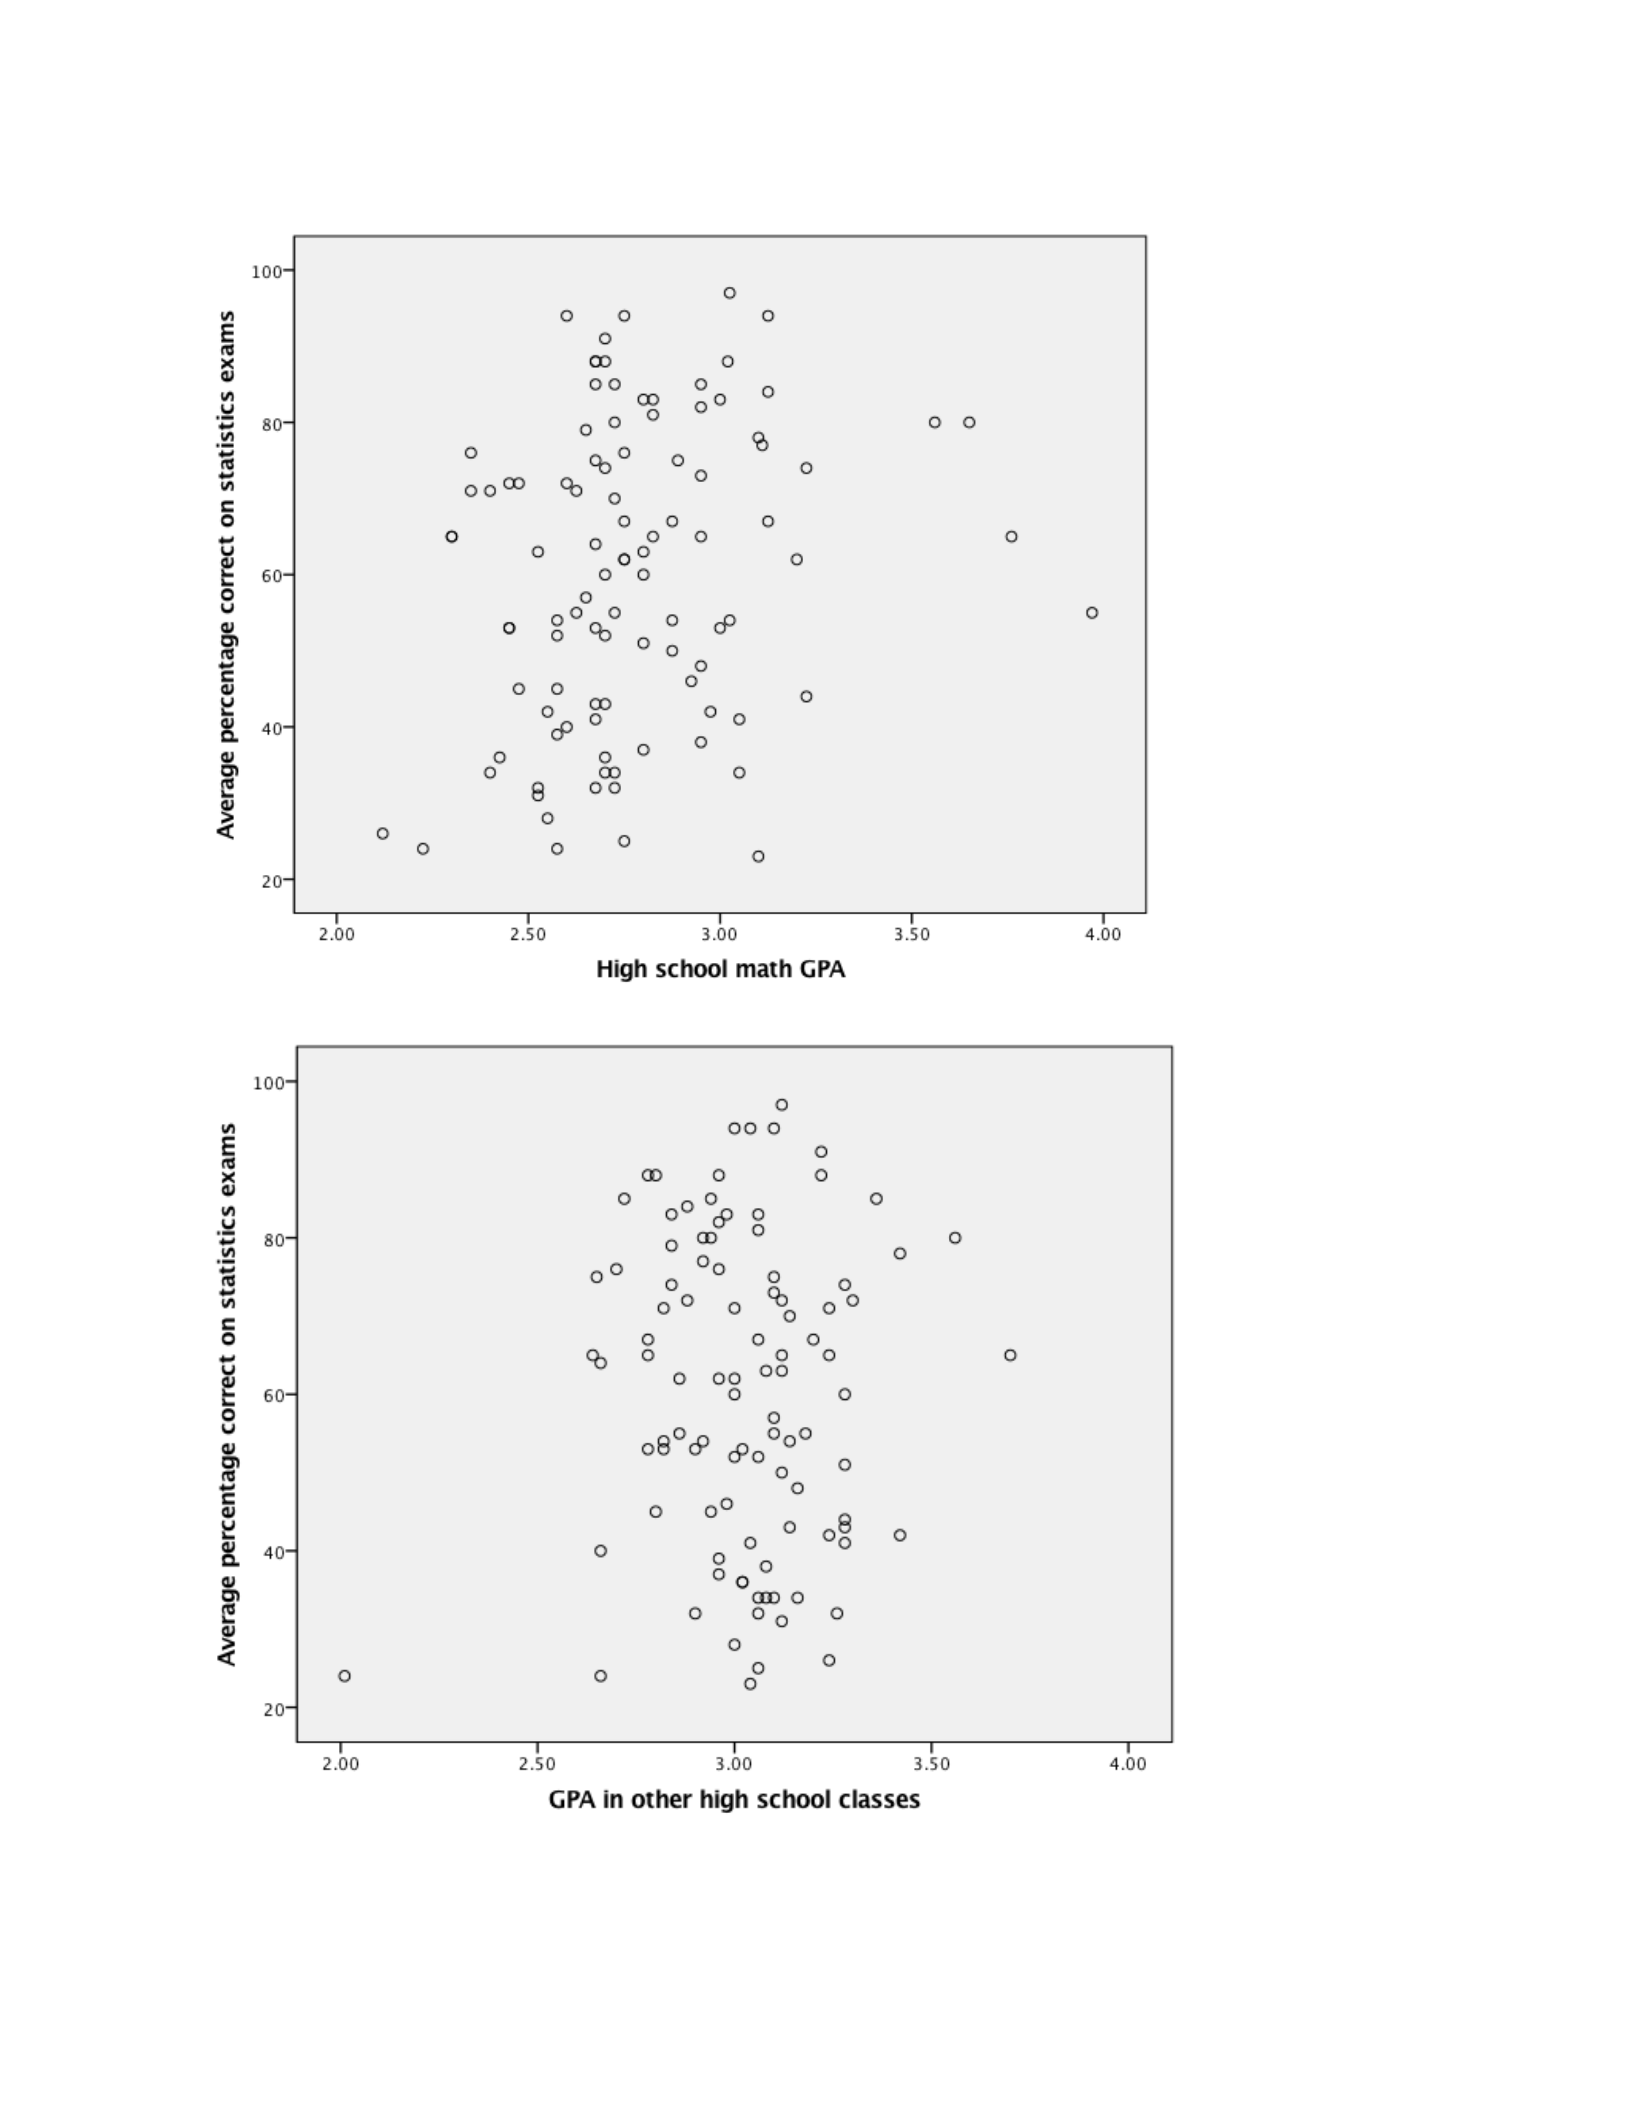
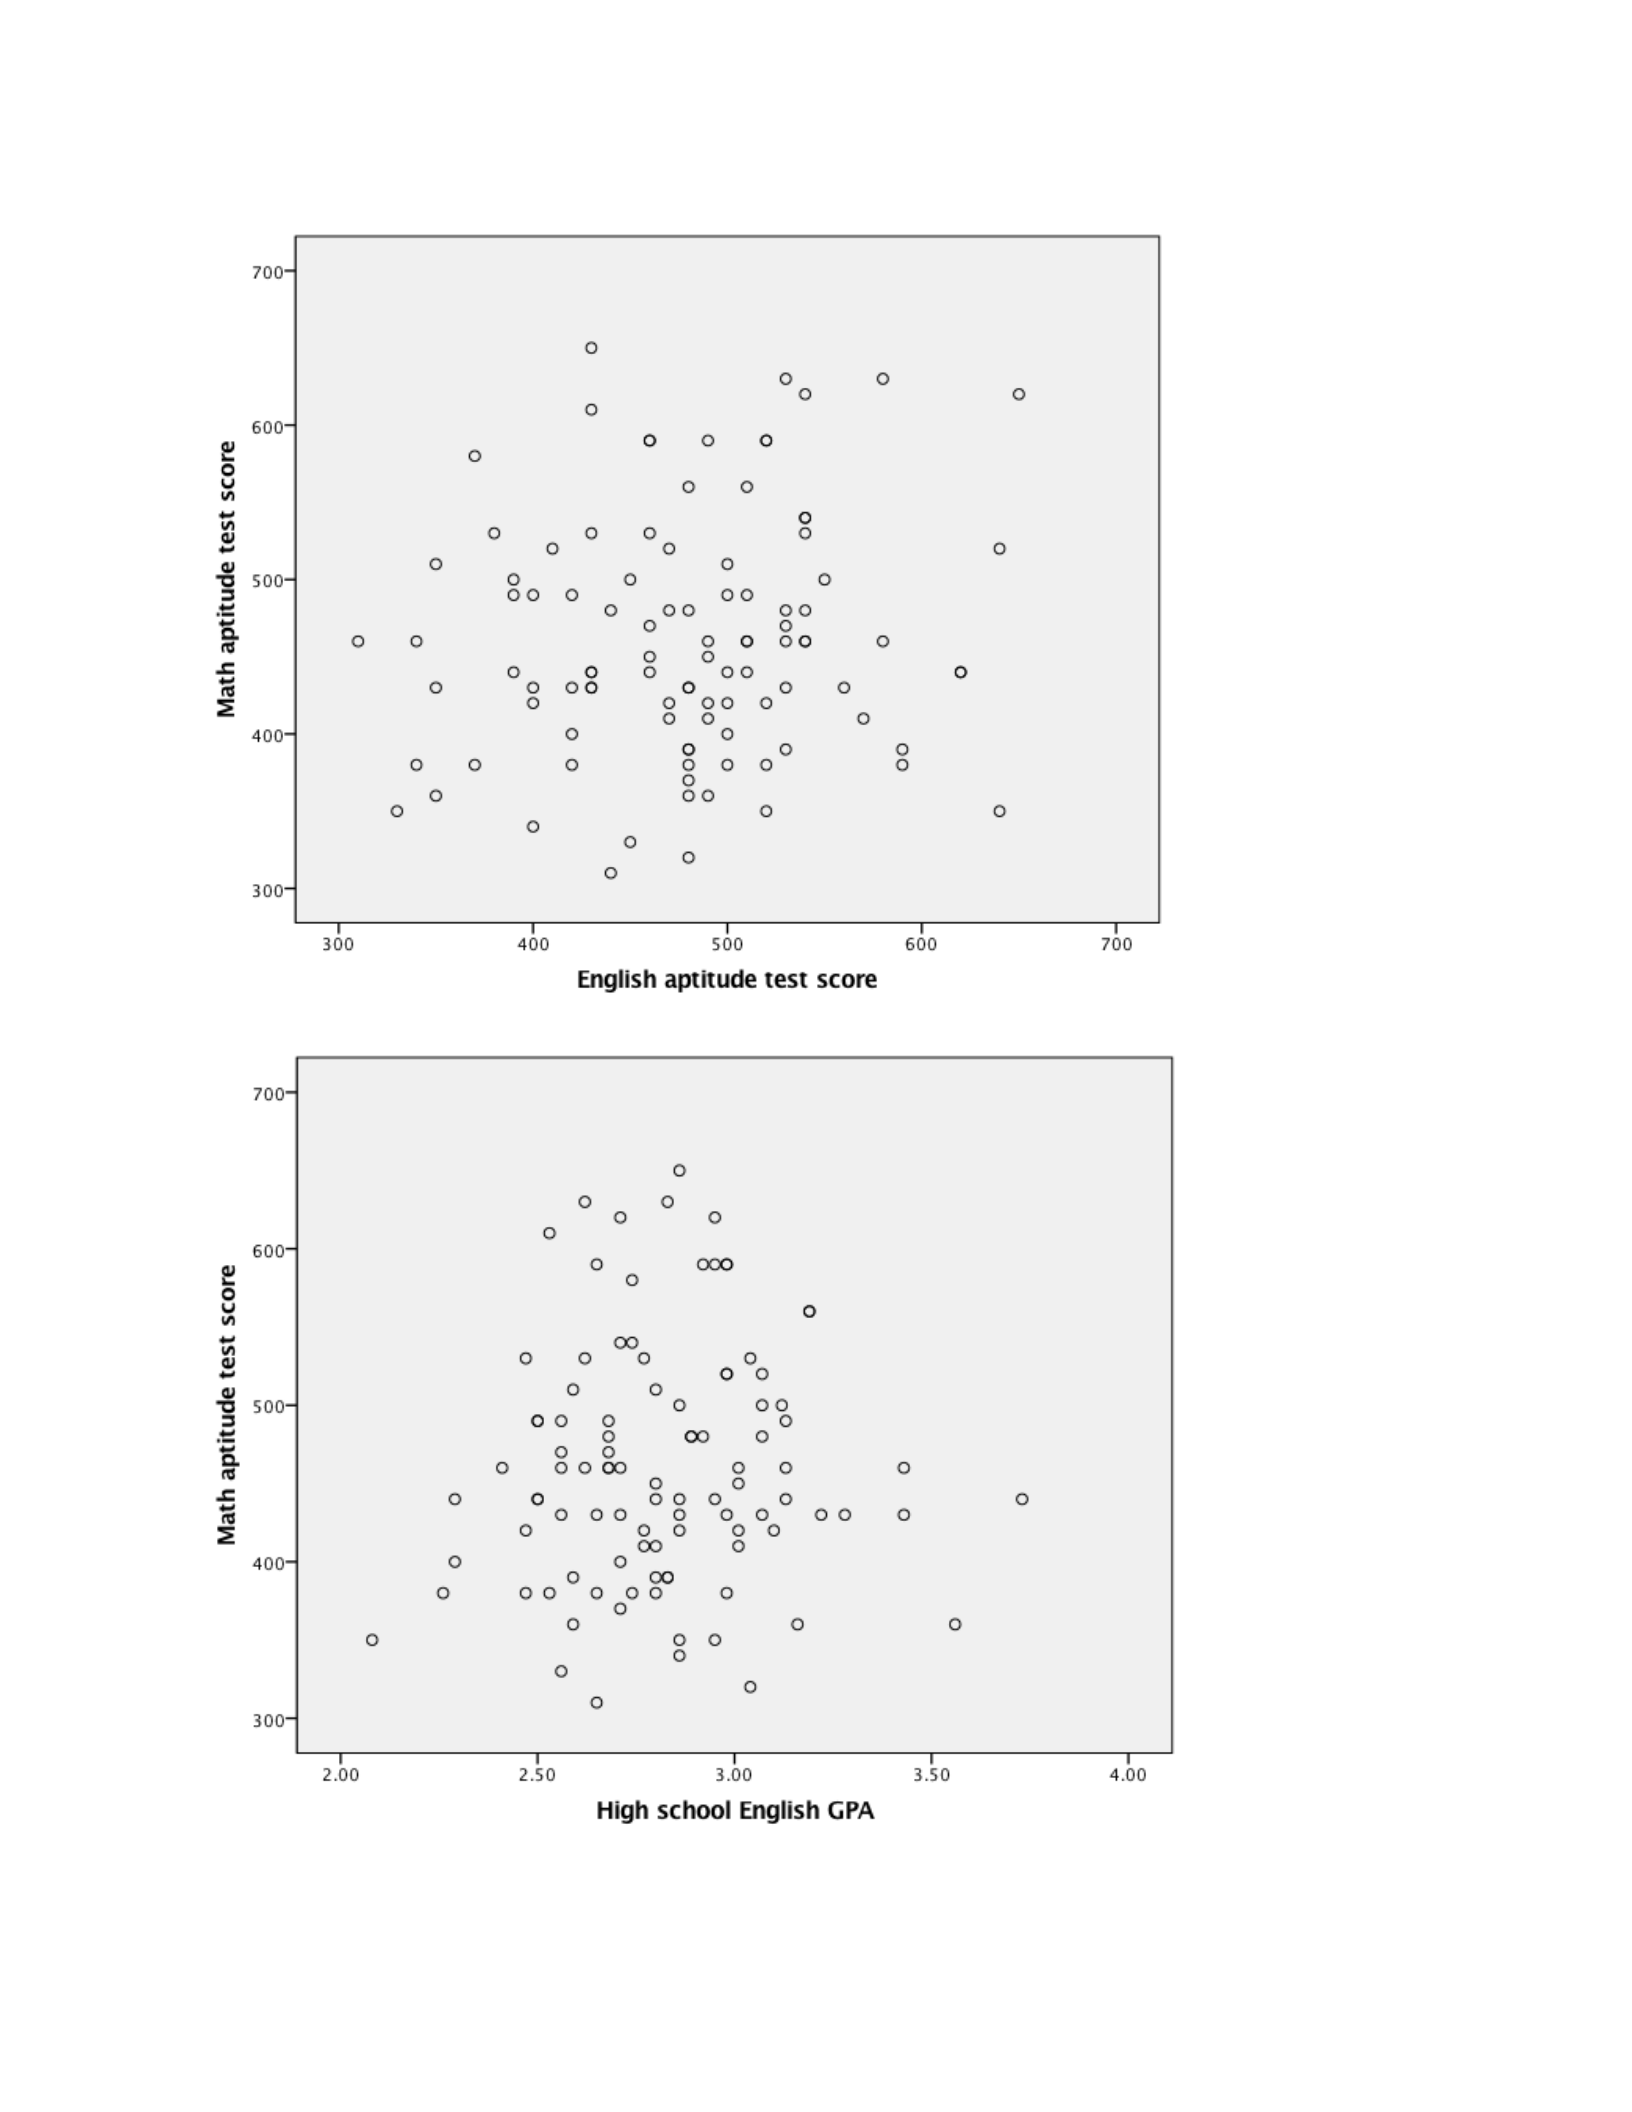
Data screening for the criterion variable (Stats Exam Scores) and the linear combination
of predictor variables (Math test, English test, English GPA, Math GPA, and Other GPA) for
college students. The researcher sorted the data on each variable and scanned for inconsistencies.
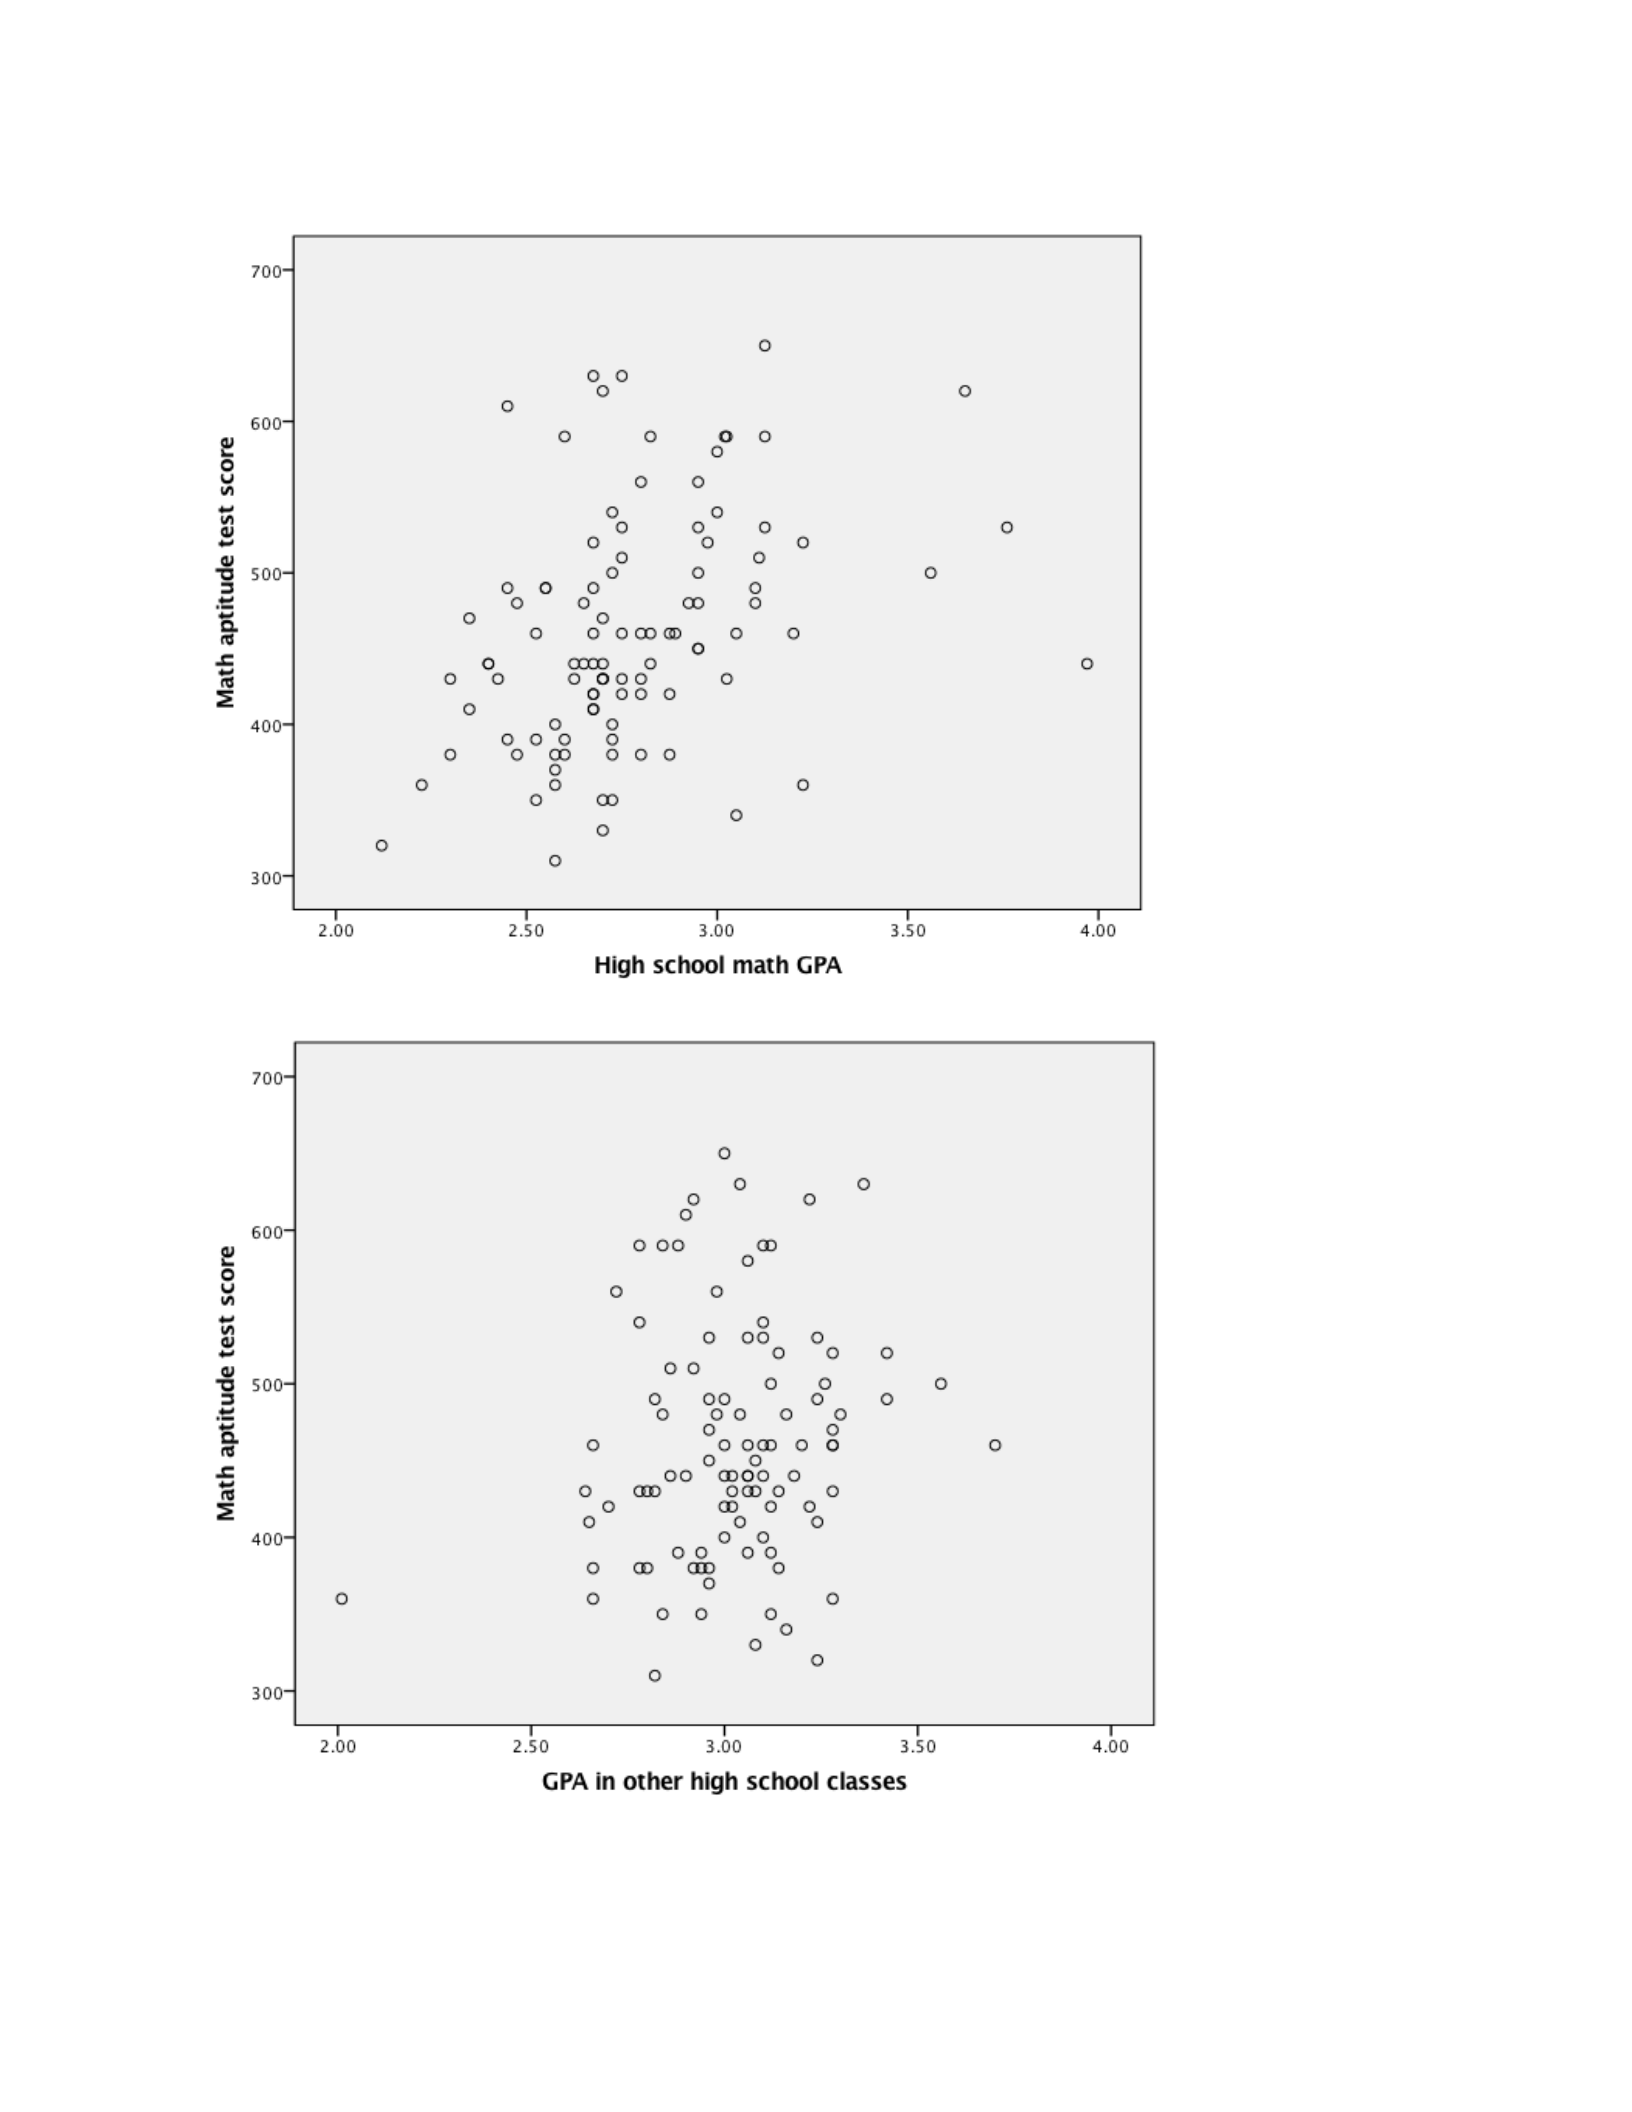
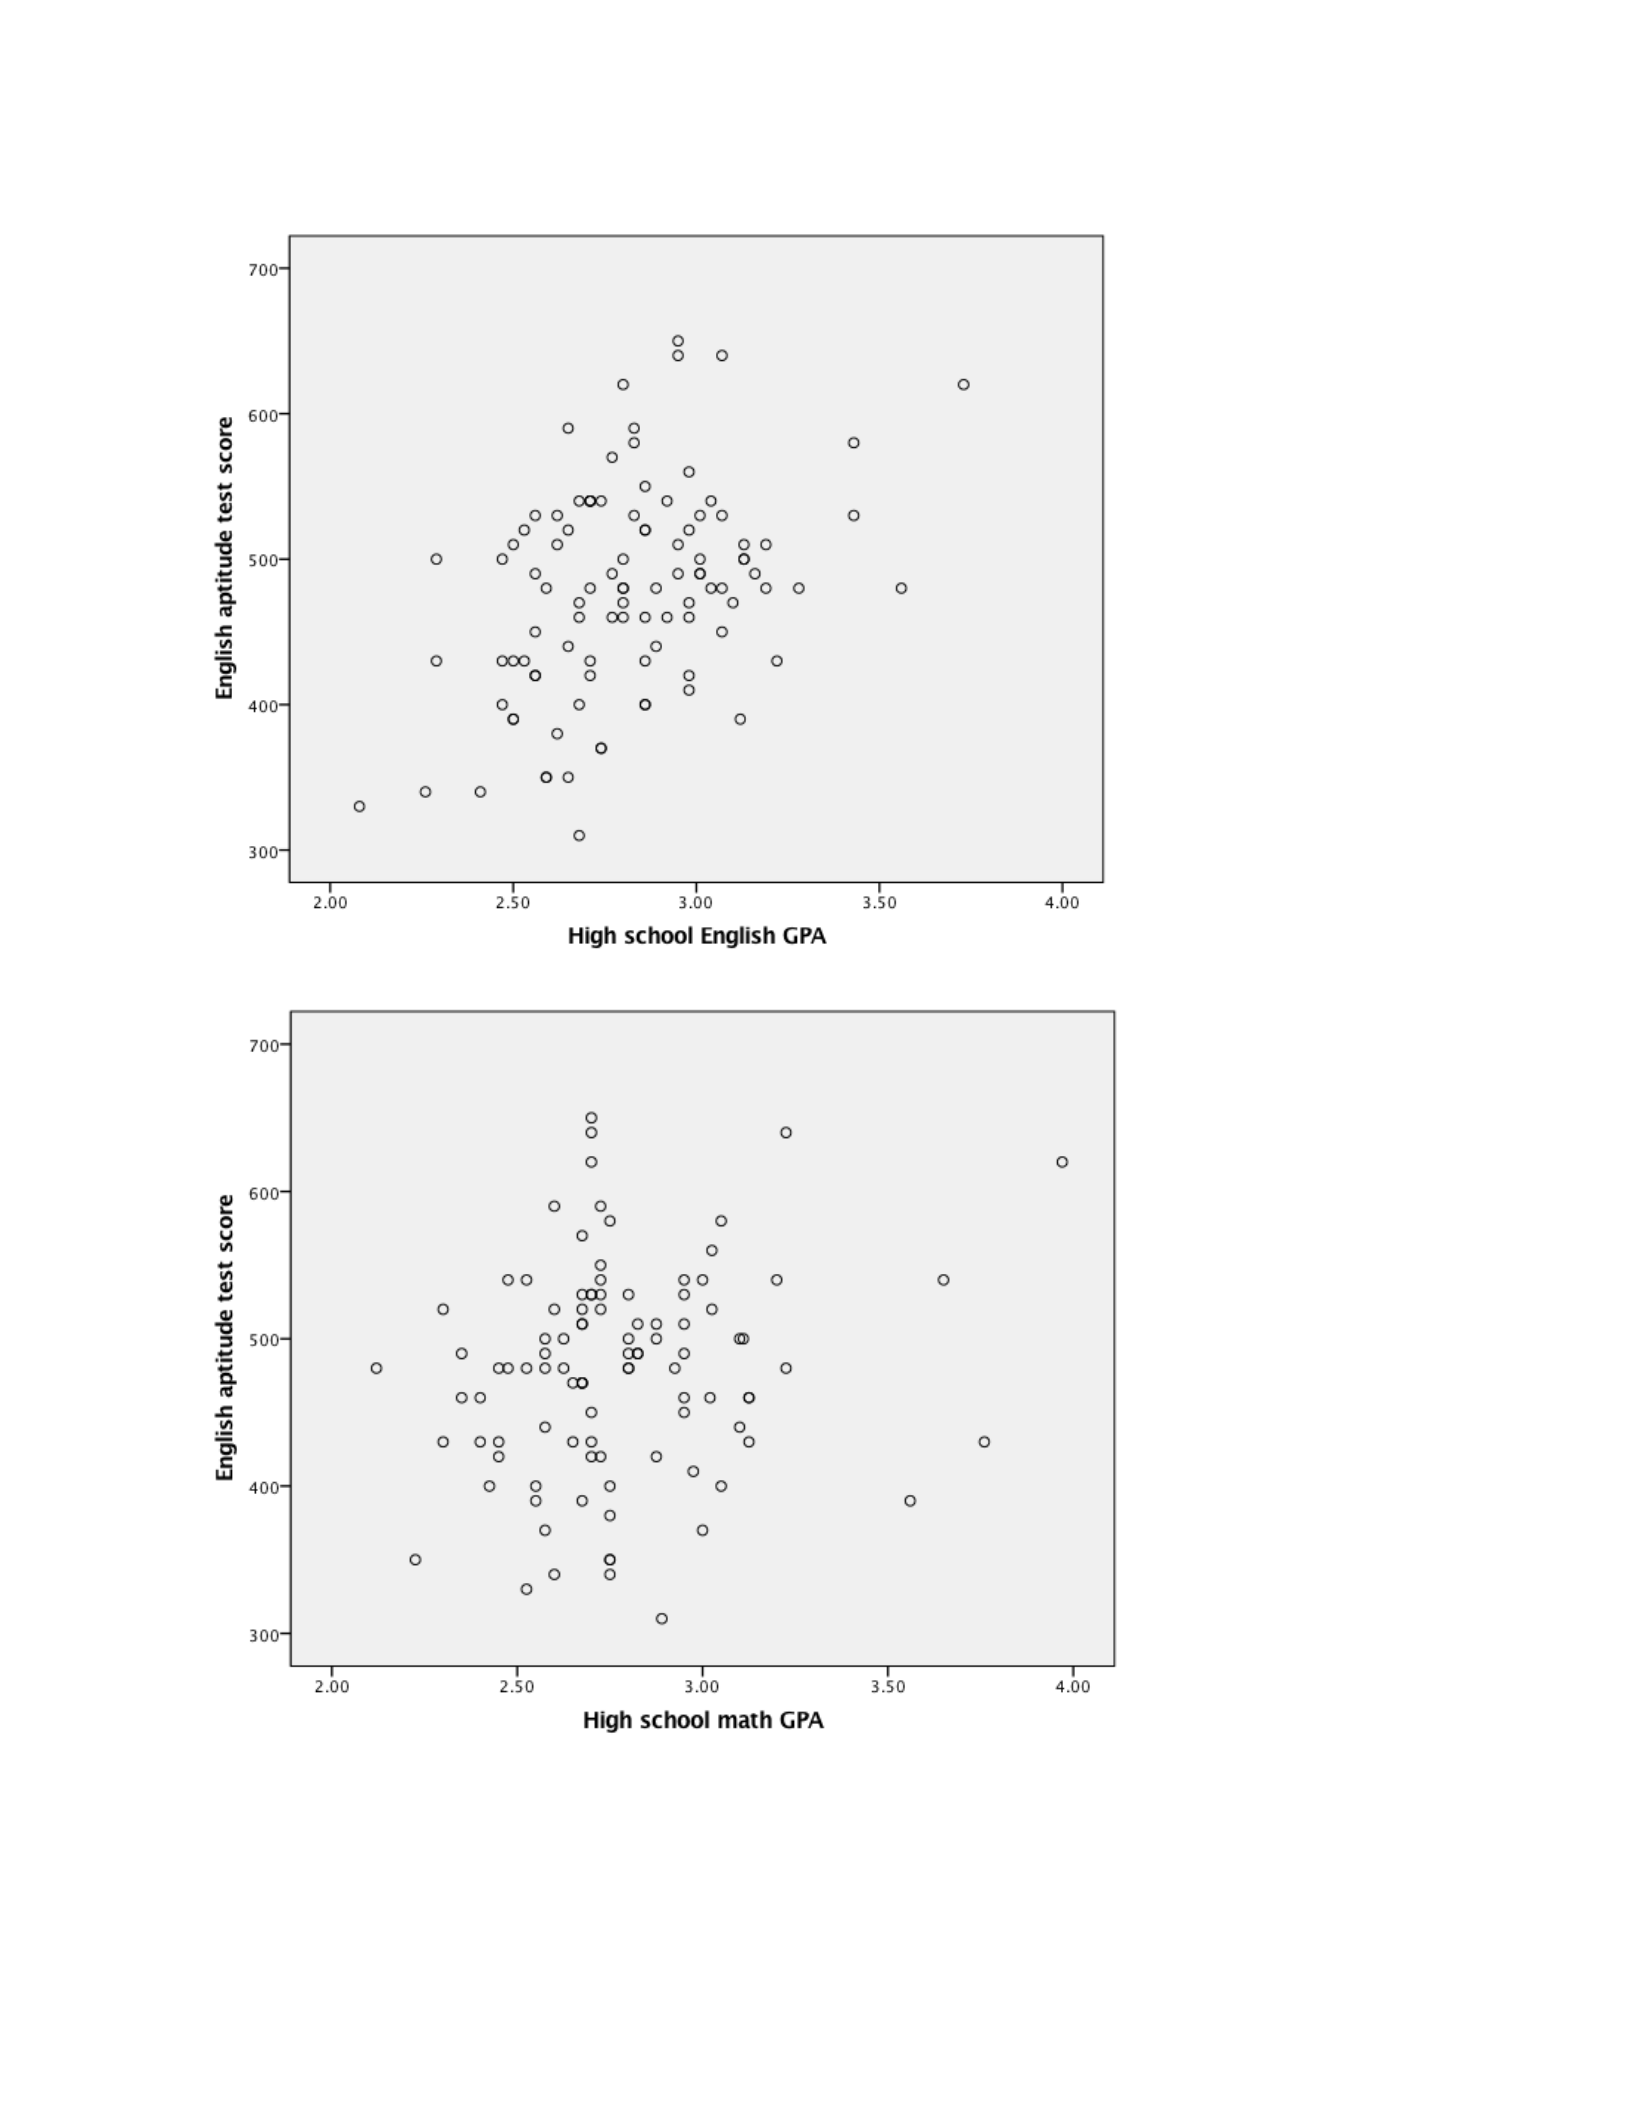
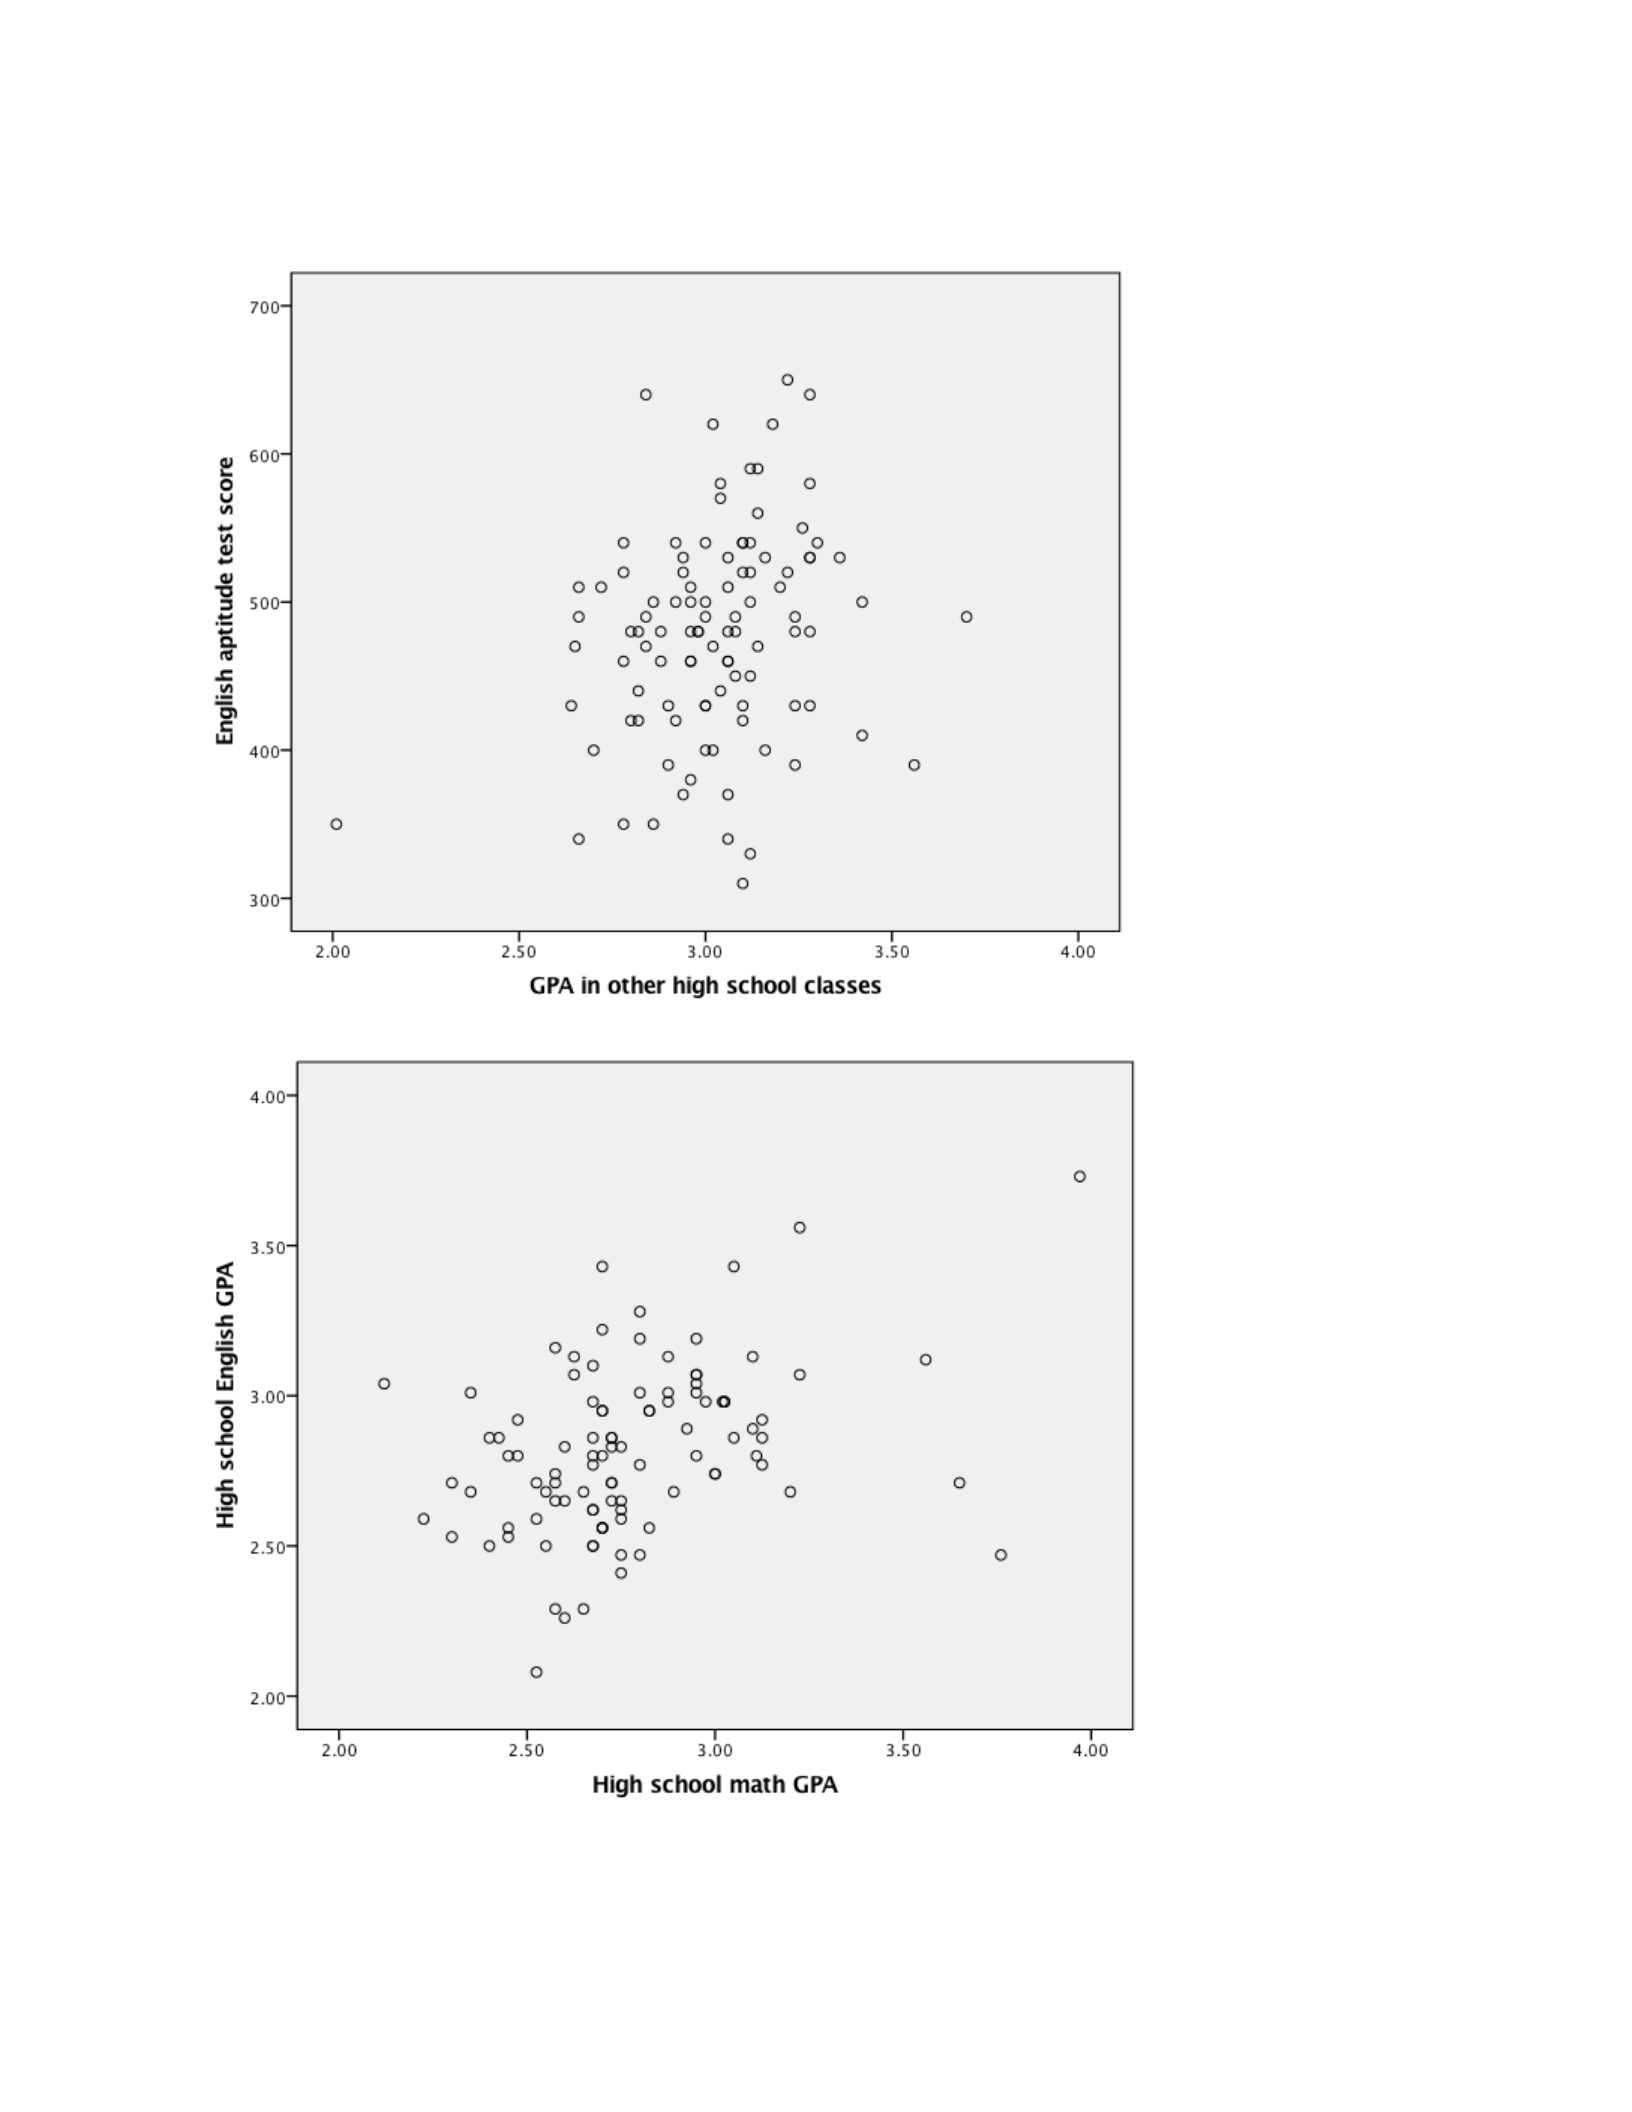
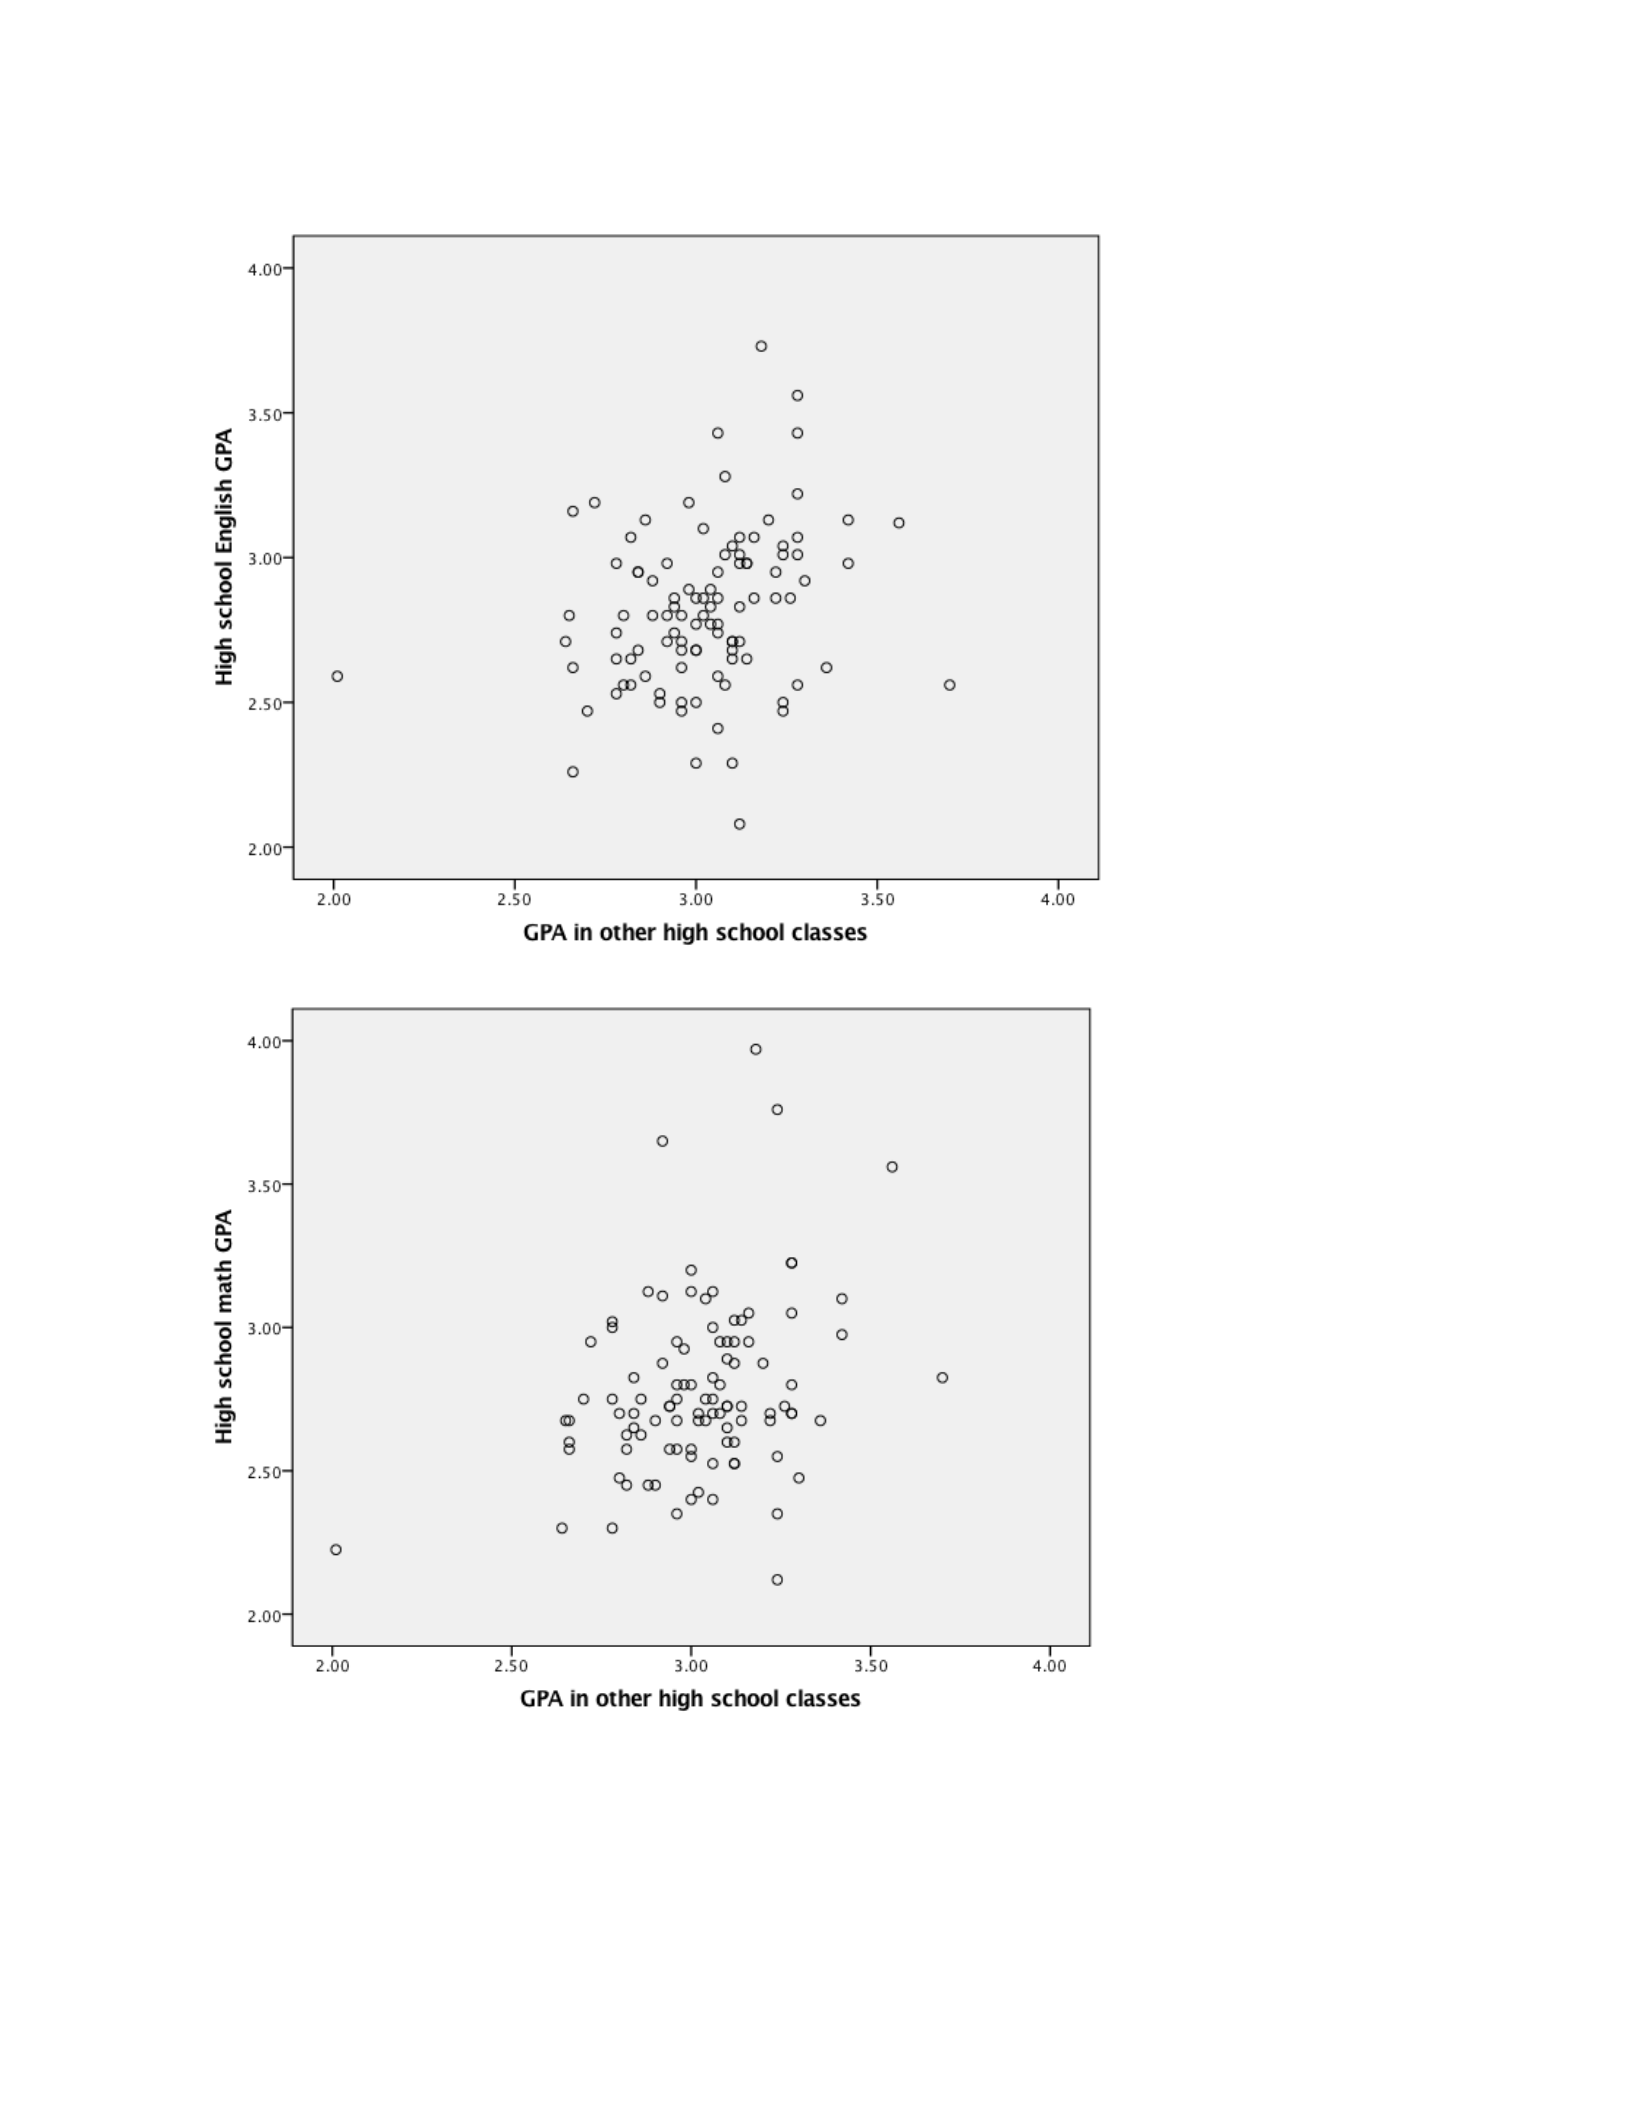
No data errors or inconsistencies were identified. No outliers were identified. See Figure 1
through 15 for scatter plots.
Figure 1
Liberty University SOE 04-20-2018
Figure 2
Figure 3
Liberty University SOE 04-20-2018
Figure 4
Figure 5
Liberty University SOE 04-20-2018
Figure 6
Figure 7
Liberty University SOE 04-20-2018
Figure 8
Figure 9
Liberty University SOE 04-20-2018
Figure 10
Figure 11
Liberty University SOE 04-20-2018
Figure 12
Figure 13
Liberty University SOE 04-20-2018
Figure 14
Figure 15

Liberty University SOE 04-20-2018
Assumptions
An Assumption regarding the Absence of Multicollinearity among the criterion variable
(Stats Exam Scores) and the linear combination of predictor variables (Math test, English test,
English GPA, Math GPA, and Other GPA) for college students. Predictor Variables were used to
test the first null hypothesis that looked at the differences among the State Exam Scores. The
Absence of Multicollinearity required that the assumptions of normality and homogeneity of
variance are met. No violations of normality were found. See Table 2 for Absence of
Multicollinearity.
Table 2
Coefficientsa
Model
Unstandardize
d Coefficients
Standardized
Coefficients
t Sig.
Collinearity
Statistics
B
Std.
Error Beta Tolerance VIF
1 (Constant) 6.745 27.691 .244 .808
Math aptitude
test score
.116 .025 .453 4.726 .000 .847 1.181
English
aptitude test
score
.049 .027 .179 1.816 .073 .801 1.249
High school
English GPA
-3.365 7.446 -.047 -.452 .652 .719 1.391
High school
math GPA
5.478 6.865 .084 .798 .427 .707 1.415
GPA in other
high school
classes
-9.702 8.500 -.109 -1.141 .257 .854 1.172
a. Dependent Variable: Average percentage correct on statistics exams

Liberty University SOE 04-20-2018
The assumption of homogeneity of variance was examined using the ANOVA test. A
violation was found (p = .000) so the assumption of homogeneity was not met. However, the
ANOVA is considered a robust test against the homogeneity assumption (Warner, 2013, p. 474).
For this reason, the researcher continued with the analysis. See Table 3 for ANOVA.
Table 3
ANOVAa
Model
Sum of
Squares df
Mean
Square F Sig.
1 Regress
ion
10432.43
2
5 2086.486 6.922 .000b
Residual 28333.35
8
94 301.419
Total 38765.79
0
99
a. Dependent Variable: Average percentage correct on
statistics exams
b. Predictors: (Constant), GPA in other high school classes,
Math aptitude test score, High school English GPA, English
aptitude test score, High school math GPA
Results for Null Hypothesis One
An ANOVA was used to test the first null hypothesis; the differences in the criterion
variable (Stats Exam Scores) and the linear combination of predictor variables (Math test,
English test, English GPA, Math GPA, and Other GPA) for college students. The first null
hypothesis was rejected at a 95% confidence level were F(2, 27) = 4.40, p = .02, 2 = .25. The
effect size was very large. See Table 4 Tests of Between-Subjects Effects.
Table 4
Tests of Between-Subjects Effects
Dependent Variable: Average percentage correct on statistics exams

Liberty University SOE 04-20-2018
Source
Type III
Sum of
Squares df
Mean
Square F Sig.
Partial Eta
Squared
Corrected
Model
14355.15
9a
36 398.754 1.029 .451 .370
Intercept 252802.7
63
1 252802.7
63
652.44
4
.000 .912
othr_gpa 14355.15
9
36 398.754 1.029 .451 .370
Error 24410.63
1
63 387.470
Total 400087.0
00
100
Corrected
Total
38765.79
0
99
a. R Squared = .370 (Adjusted R Squared = .010)

