


EDUC 606
LEARNING ACTIVITY: STATISTICS EXERCISES STUDENT TEMPLATE
Type your answers directly in the document in the spaces provided. Please consider
highlighting, starring*, or changing the font color of answers for ease of instructor grading.
You MUST show your work to be eligible for partial credit.
1. (20 Pts, 1 pt each). Calculate the mean, median, mode, standard deviation, and range for
the following sets of measurements (fill out the table):
a. 20, 18, 17, 17, 19
R=H-L
R=20-17=3
Average=20+18+17+17+19=91
91/5=18.2
Median= 20, 19,18, 17, 17
Mode=17
20= I
19=I
18=I
17=II
SD
20-18.2=4.8333333=9.6666666
19- 18.2 =3.8333333=7.6666666
18- 18.2 =2.8333333=5.6666666
17- 18.2 = 1.8333333=3.6666666
17- 18.2=1.8333333=3.6666666
=30.333333/5=6.0666666
√6.0666666= 1.1661903789691
b. 15, 10, 7, 6, 4
R=15-4=11
Average=15+10+7+6+4=42
42/5=8.4
Median=15,10,7,6,4
Mode=none
15=I
10=I
7=I
6=I
4=I
Page 1 of 10
EDUC 606
SD
15-8.4=6.6=43.56
10-8.4=1.6=2.56
7-8.4=-1.4=-1.96
6-8.4=-2.4=5.76
4-8.4=-4.4=19.36
=73.2/5=14.64
√14.64= 3.8262252939418
c. 28, 28, 28, 28, 28
R=28-28=0
Average=28+28+28+28+28=140
140/5=28
Median=28, 28,28,28,28
Mode=28
28=IIIIII
SD
28-28=0
√0= 0
d. 10, 10, 7, 6, 4, 79
R=79-10=69
Average=10+10+7+6+4+79=116
116/6=19.3333
Median=79,10,10,7,6,4
10+7=17
17/2=8.5
Mode=10
79=I
10= II
7= I
6= I
4=I
SD
Page 2 of 10
EDUC 606
79-19.3333=59.6667 =3,560.11509
10-19.3333=-9.3333=87.1104889
10-19.3333=-9.3333=87.1104889
7-19.3333=-12.3333=152.110289
6-19.3333=-13.3333=177.776889
4-19.3333=-15.3333=235.110089
=4,299.33333/6=716.555556
√716.55555555556= 26.768555350552
DISTRIB MEAN MEDIAN MOD
E
SD RA
NG
E
a. 18.2 18 17 1.1661903789691 3
b. 8.4 7 none 3.8262252939418 11
c. 28 28 28 0 0
d. 19.3333 8.5 10 26.768555350552 69
2. (20 Pts, 5 pts each) Answer the following questions.
a. Why is the SD in (d) so large compared to the SD in (b)?
Because the outliner in D is larger than in B. So the outline 79 skews the data
in D compared to B. If is more variability in D than there is in (b).
b. Why is the mean so much higher in (d) than in (b)?
Because the average in (d) is higher than the average in (b). B is a positively
skewed distribution. The distance from the mean is greater.
c. Why is the median relatively unaffected?
The median is the number that appears in the middle after the numbers are
put in order. It does not change unless there are two numbers in the middle.
d. Which measure of central tendency best represents the set of scores in (d)? Why?
The median. The mean changs significantly because of the outliner 79, and
that raises the average.
3. (4 pts) Determine the semi-interquartile range for the following set of scores.
92 95 89 65 99 100 85 67 72 99 85 100
65 67 72 85 85 89 92 95 99 99 100 100
Page 3 of 10
EDUC 606
Q1= 81.7500
Q3=99.0000
99.0000-81.7500=17.25
17.25/2
8.625
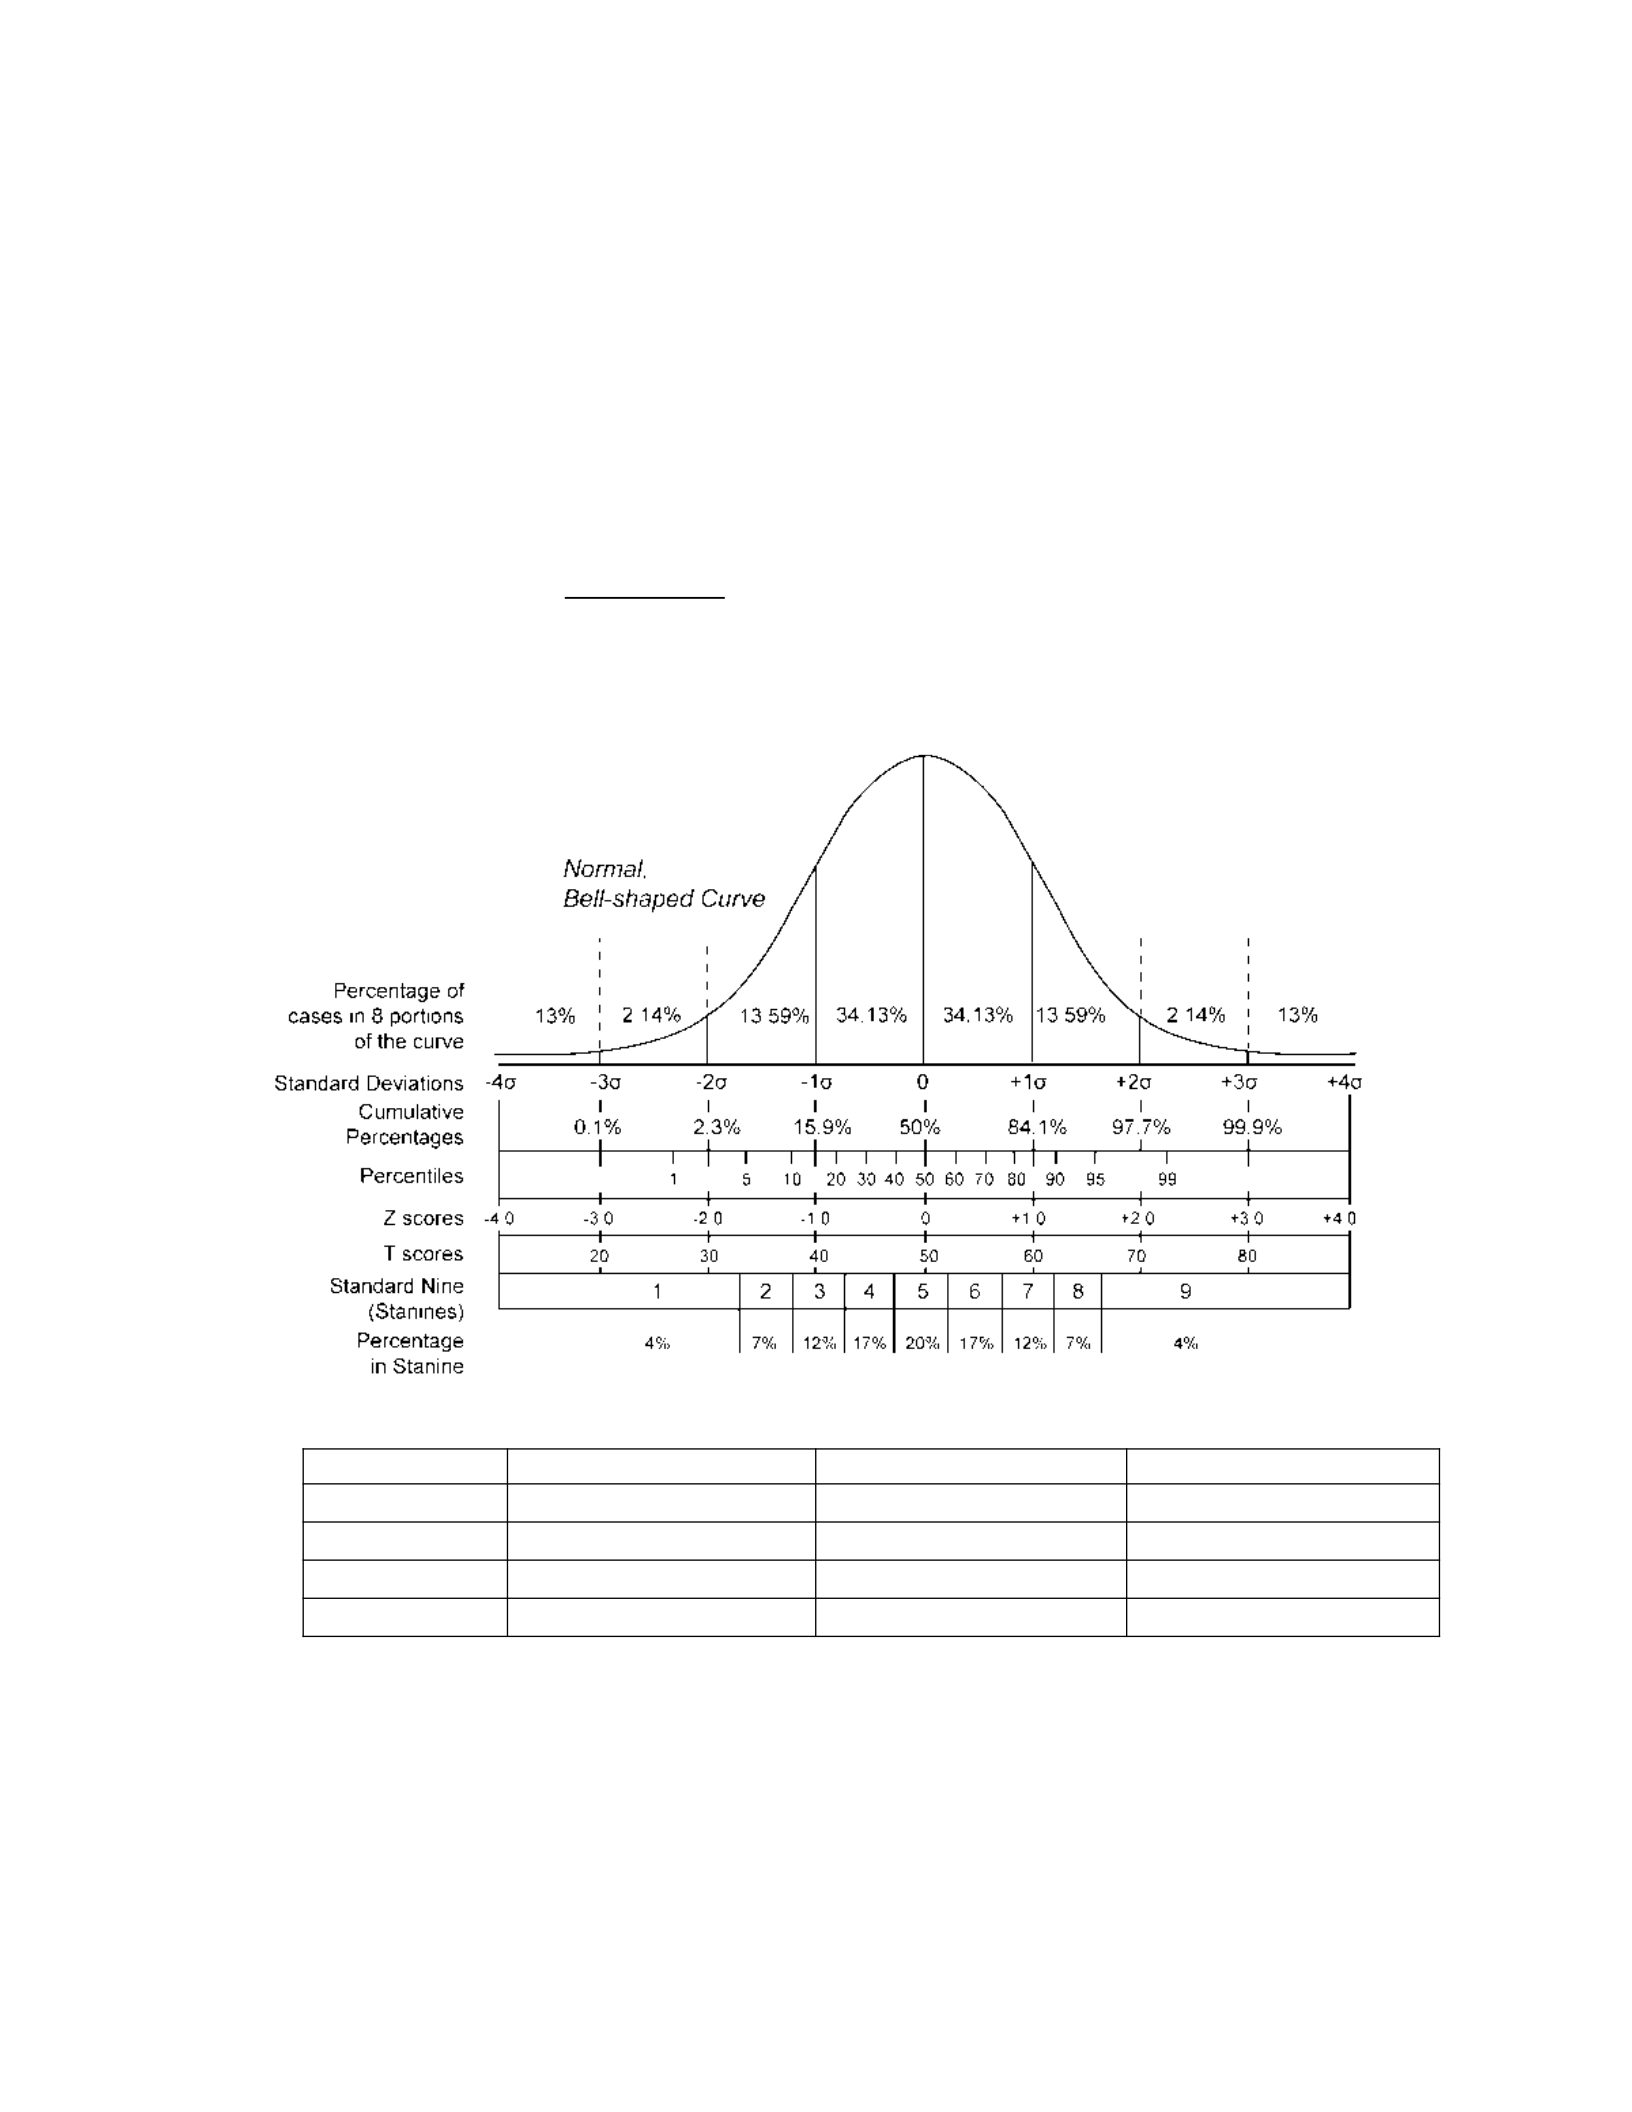
4. (24 pts, 2 pts each) Fill in the blanks on the table with the appropriate raw scores, z-
scores, T-scores, and approximate percentile ranks. You may refer to the distribution
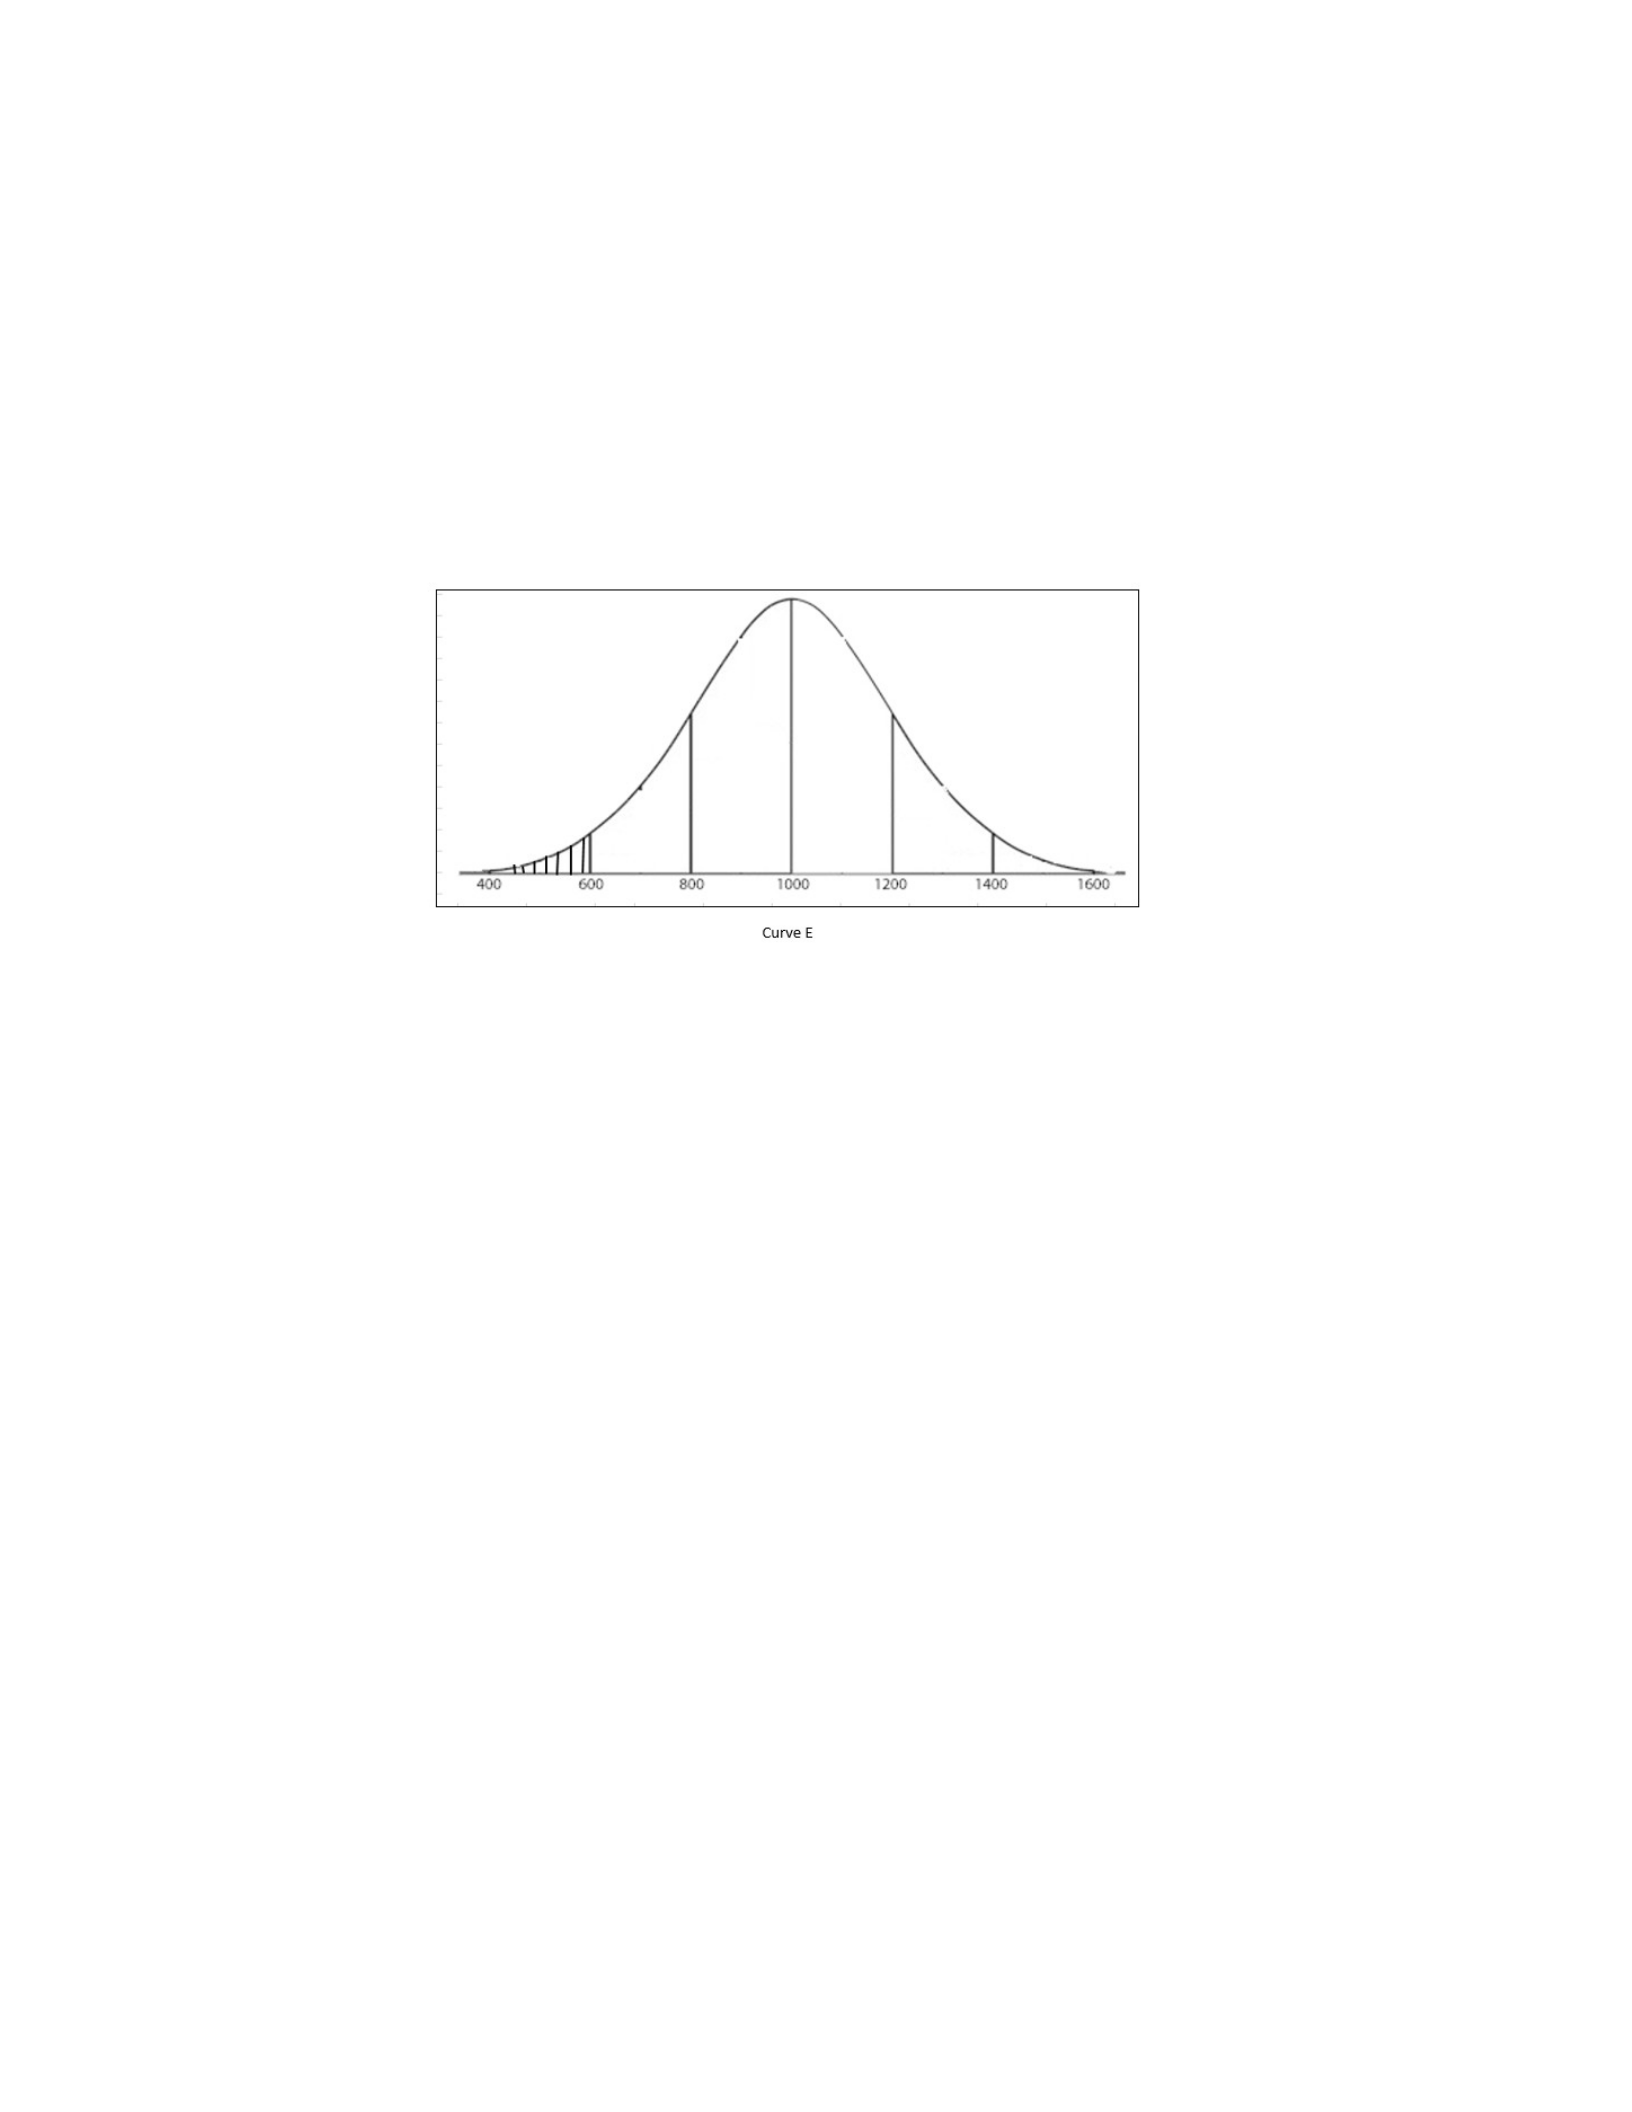
curve below.
Note: the Mean = 50, SD = 5.
RAW z T Percentile
40 -2 30 2.5
62.5 2.5 75 99.38
42.5 -1.5 35 6.68
55 1 60 84.13
5. (6 pts, 3 pts each) The following are the means and standard deviations of some well-
known standardized tests, referred to as Test A, Test B, and Test C. All three yield
normal distributions.
Page 4 of 10
EDUC 606
Test Mean Standard Deviation
Test A 300 75
Test B 250 4
Test C 40 12
a. (3 pts) A score of 275 on Test A corresponds to what score on Test B? _248.68___
b. (3 pts) A score of 400 on Test A corresponds to what score on Test C?55.96
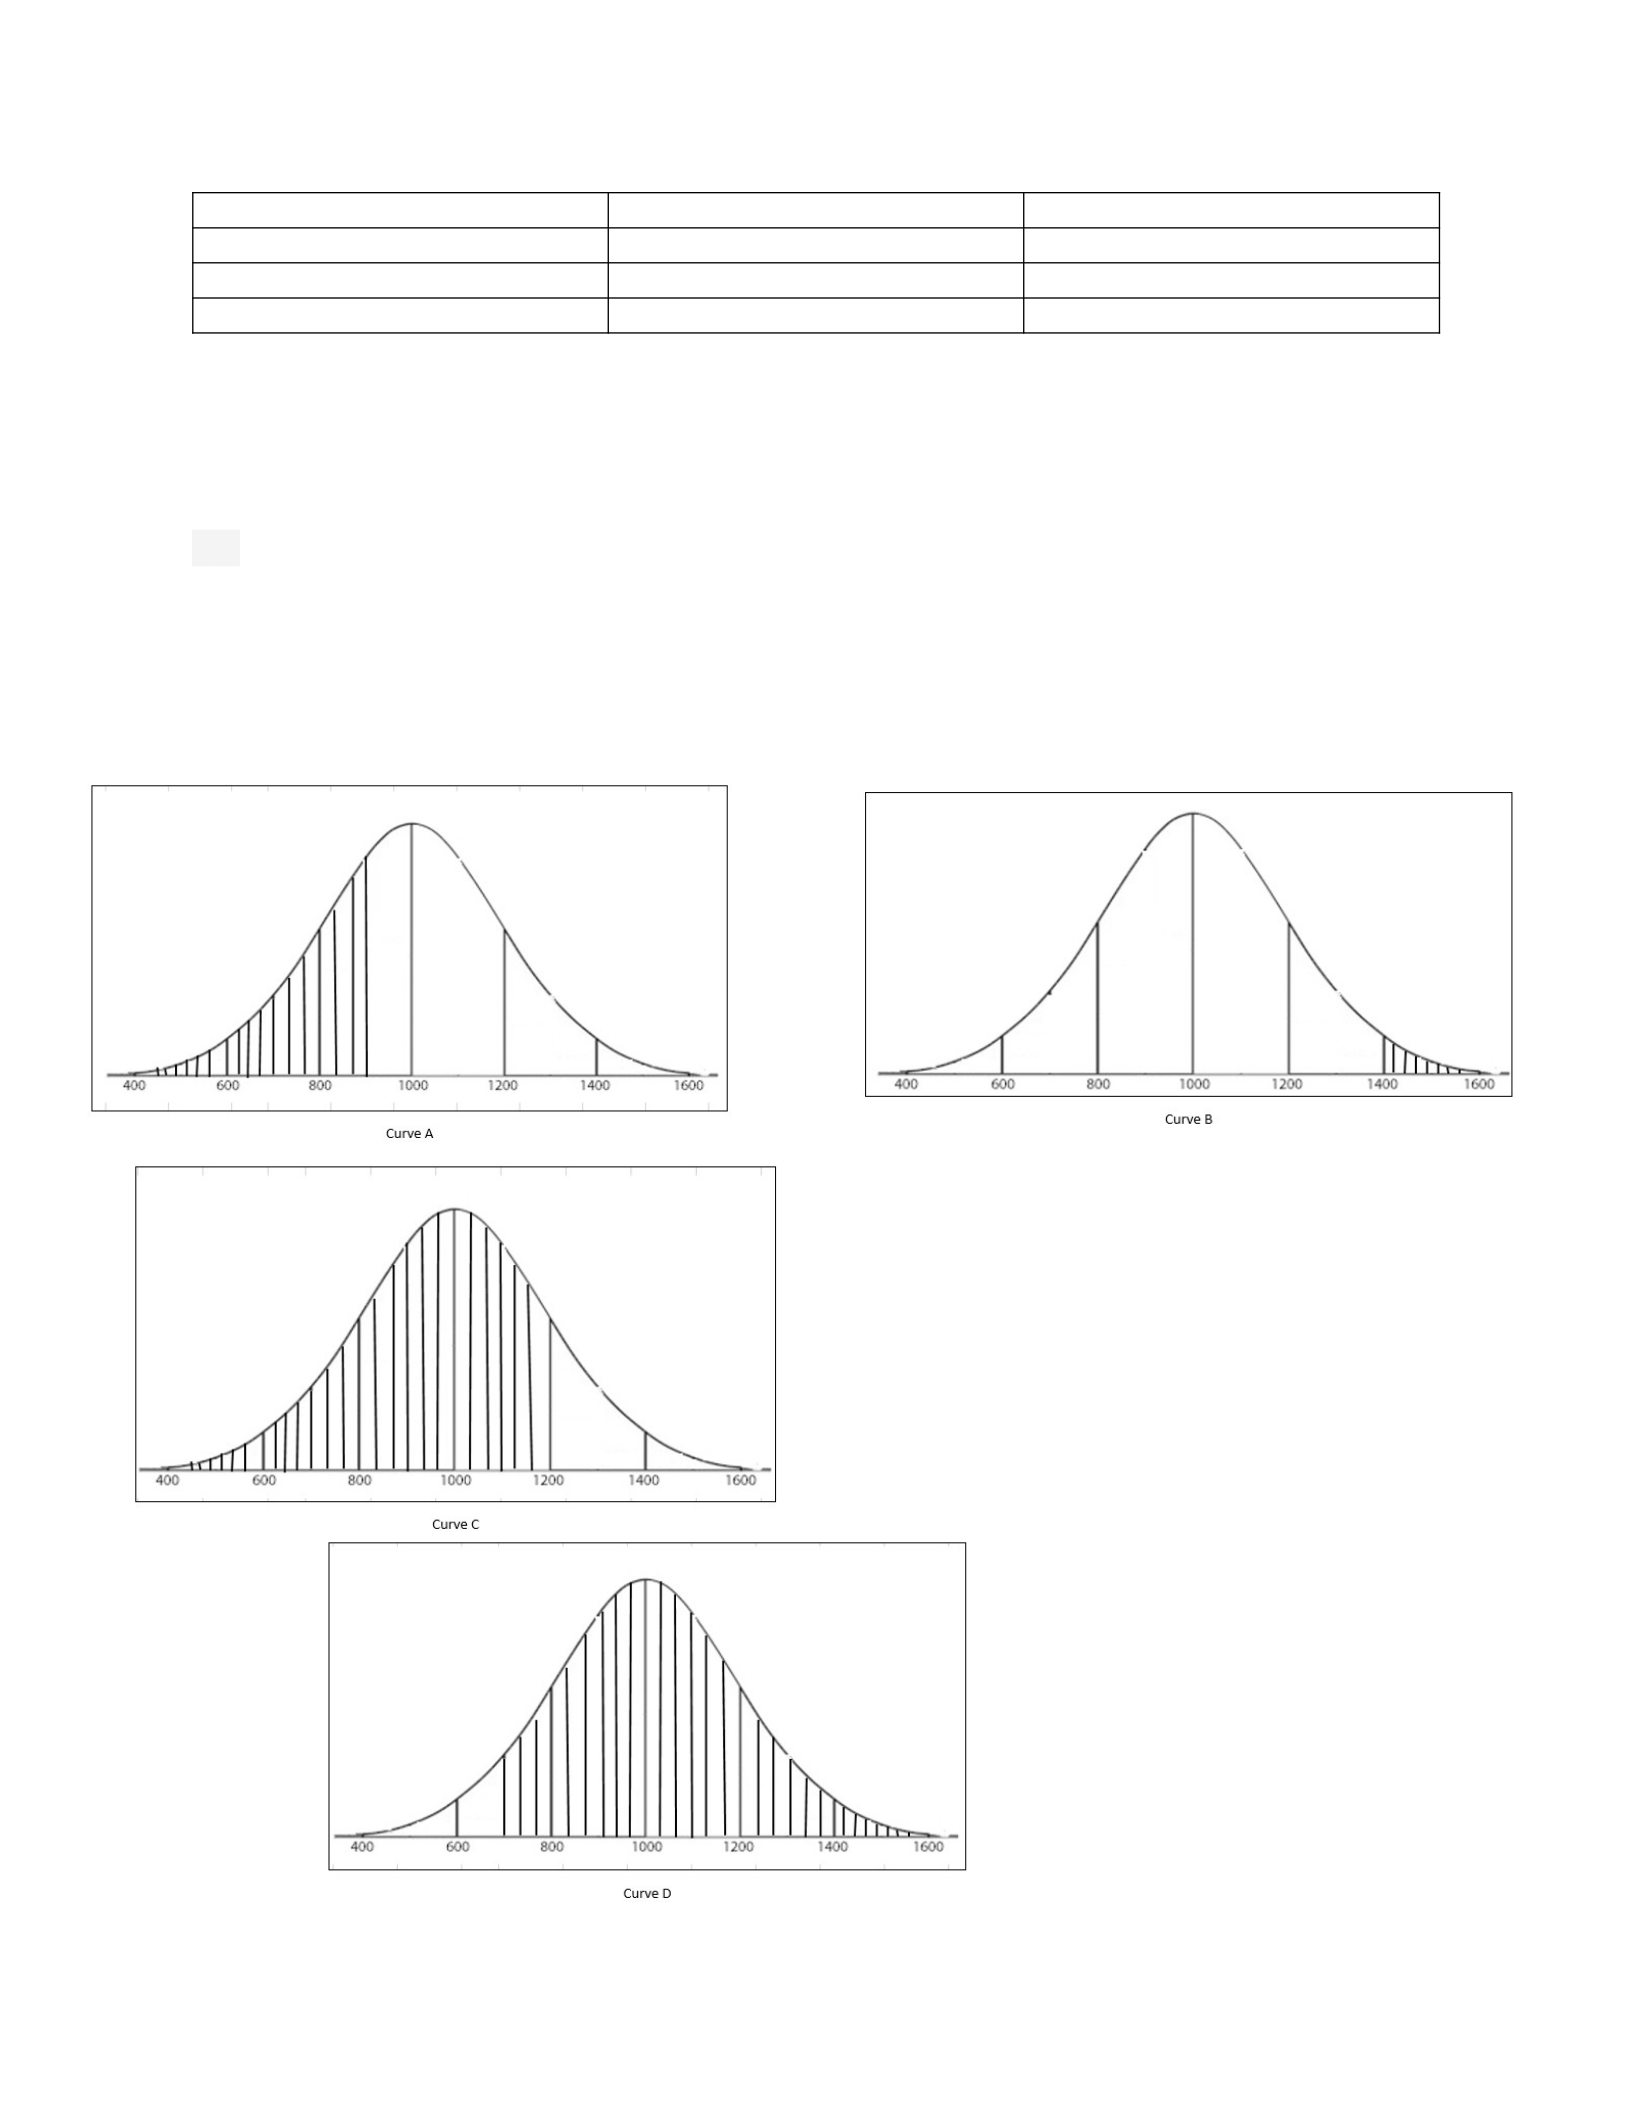
6. (12 pts, 2 pts each) The Graduate Record Exam (GRE) has a combined verbal and
quantitative mean of 1000 and a standard deviation of 200. Scores range from 200 to 1600
and are approximately normally distributed. For each of the following problems, indicate the
percentage or score called for by the problem and select the appropriate distribution curve
(from below) that relates to the problem.
Page 5 of 10
EDUC 606
Page 6 of 10
EDUC 606
a. (2 pts) What percentage of the persons who take the test score below 600?
2.3%
b. (2 pts) Type the curve best representing your answer: ___
E
c. (2 pts) What percentage of the persons who take the test score below 1200? ___
84.1
d. (2 pts) Type the curve best representing your answer: ___
C
e. (2 pts) Above what score do the top 2.27% of the test-takers score? ___
1400
f. (2 pts) Type the curve best representing your answer: ___
B
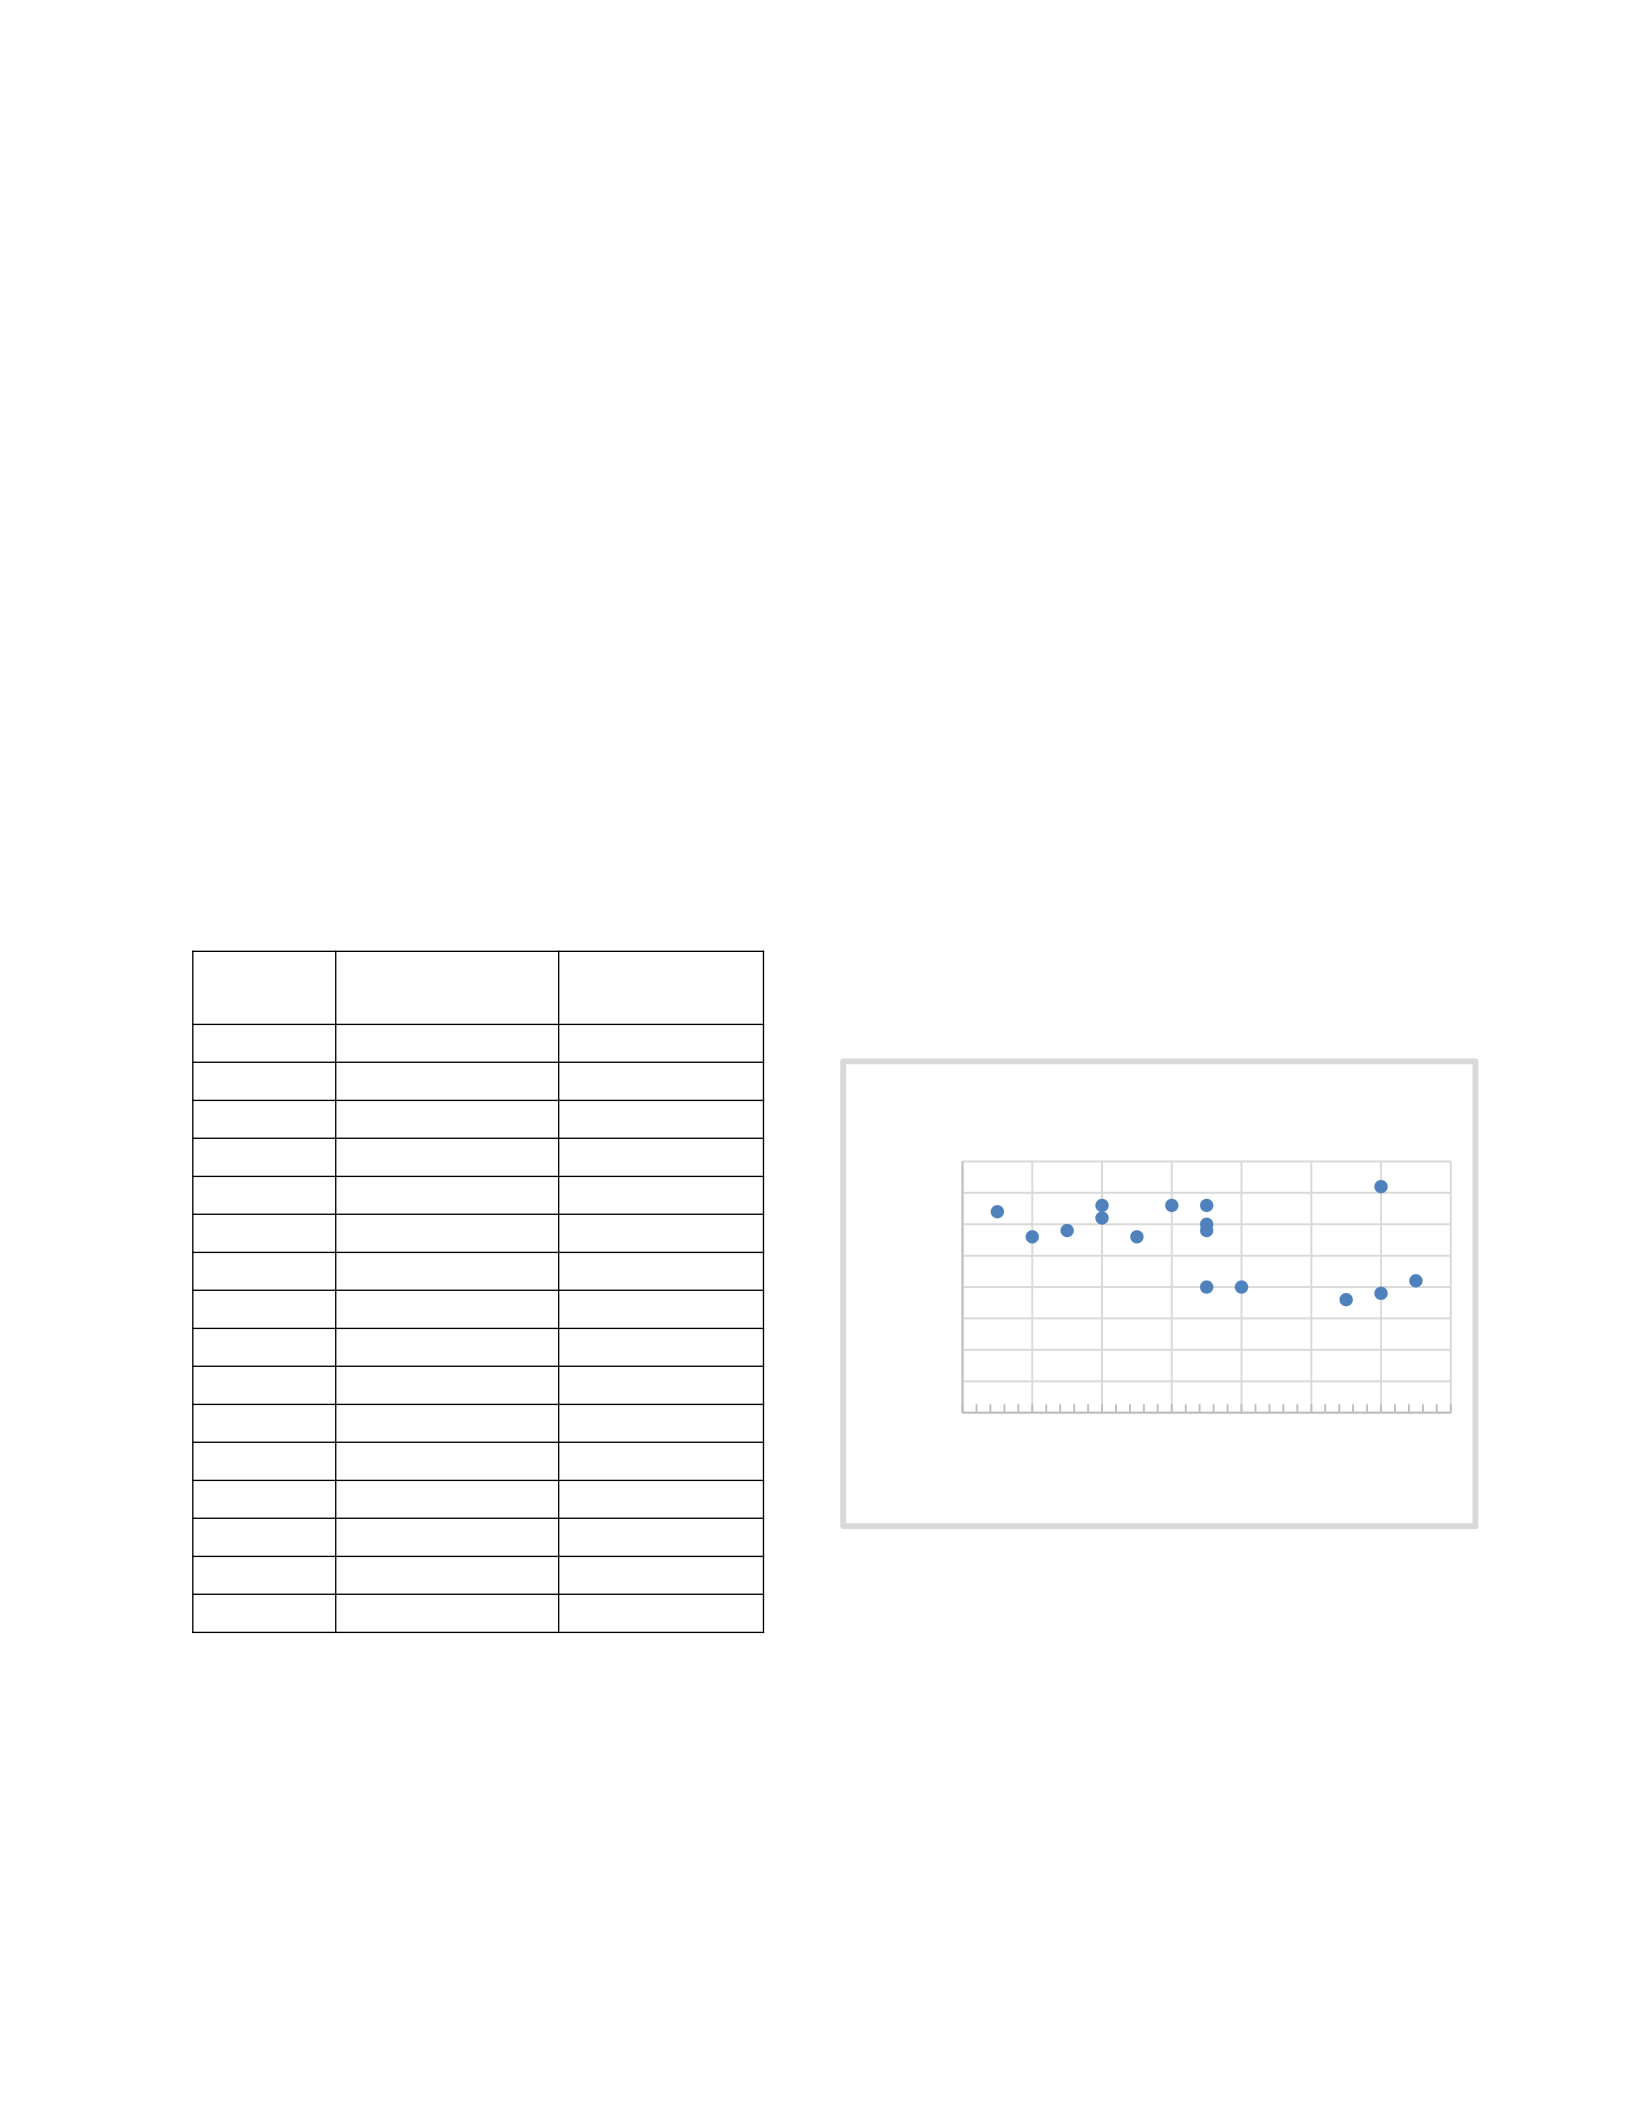
7. (14 pts, varied) Refer to the following data and scatterplots to respond to questions 7a-e.
Individua
l Years of School
Body Mass
Index
A 21 18
B 18 20
C 17 33
D 17 29
E 14 31
F 11 32
G 22 19
H 23 21
I 16 33
J 22 36
K 17 30
L 15 28
M 17 20
N 12 28
O 14 33
P 13 29
Page 7 of 10
10 12 14 16 18 20 22 24
0
5
10
15
20
25
30
35
40
Figure A
Years of School
Body Mass Index
EDUC 606
10 12 14 16 18 20 22 24
0
5
10
15
20
25
30
35
40
Figure B
Years of School
Body Mass Index
Page 8 of 10
EDUC 606
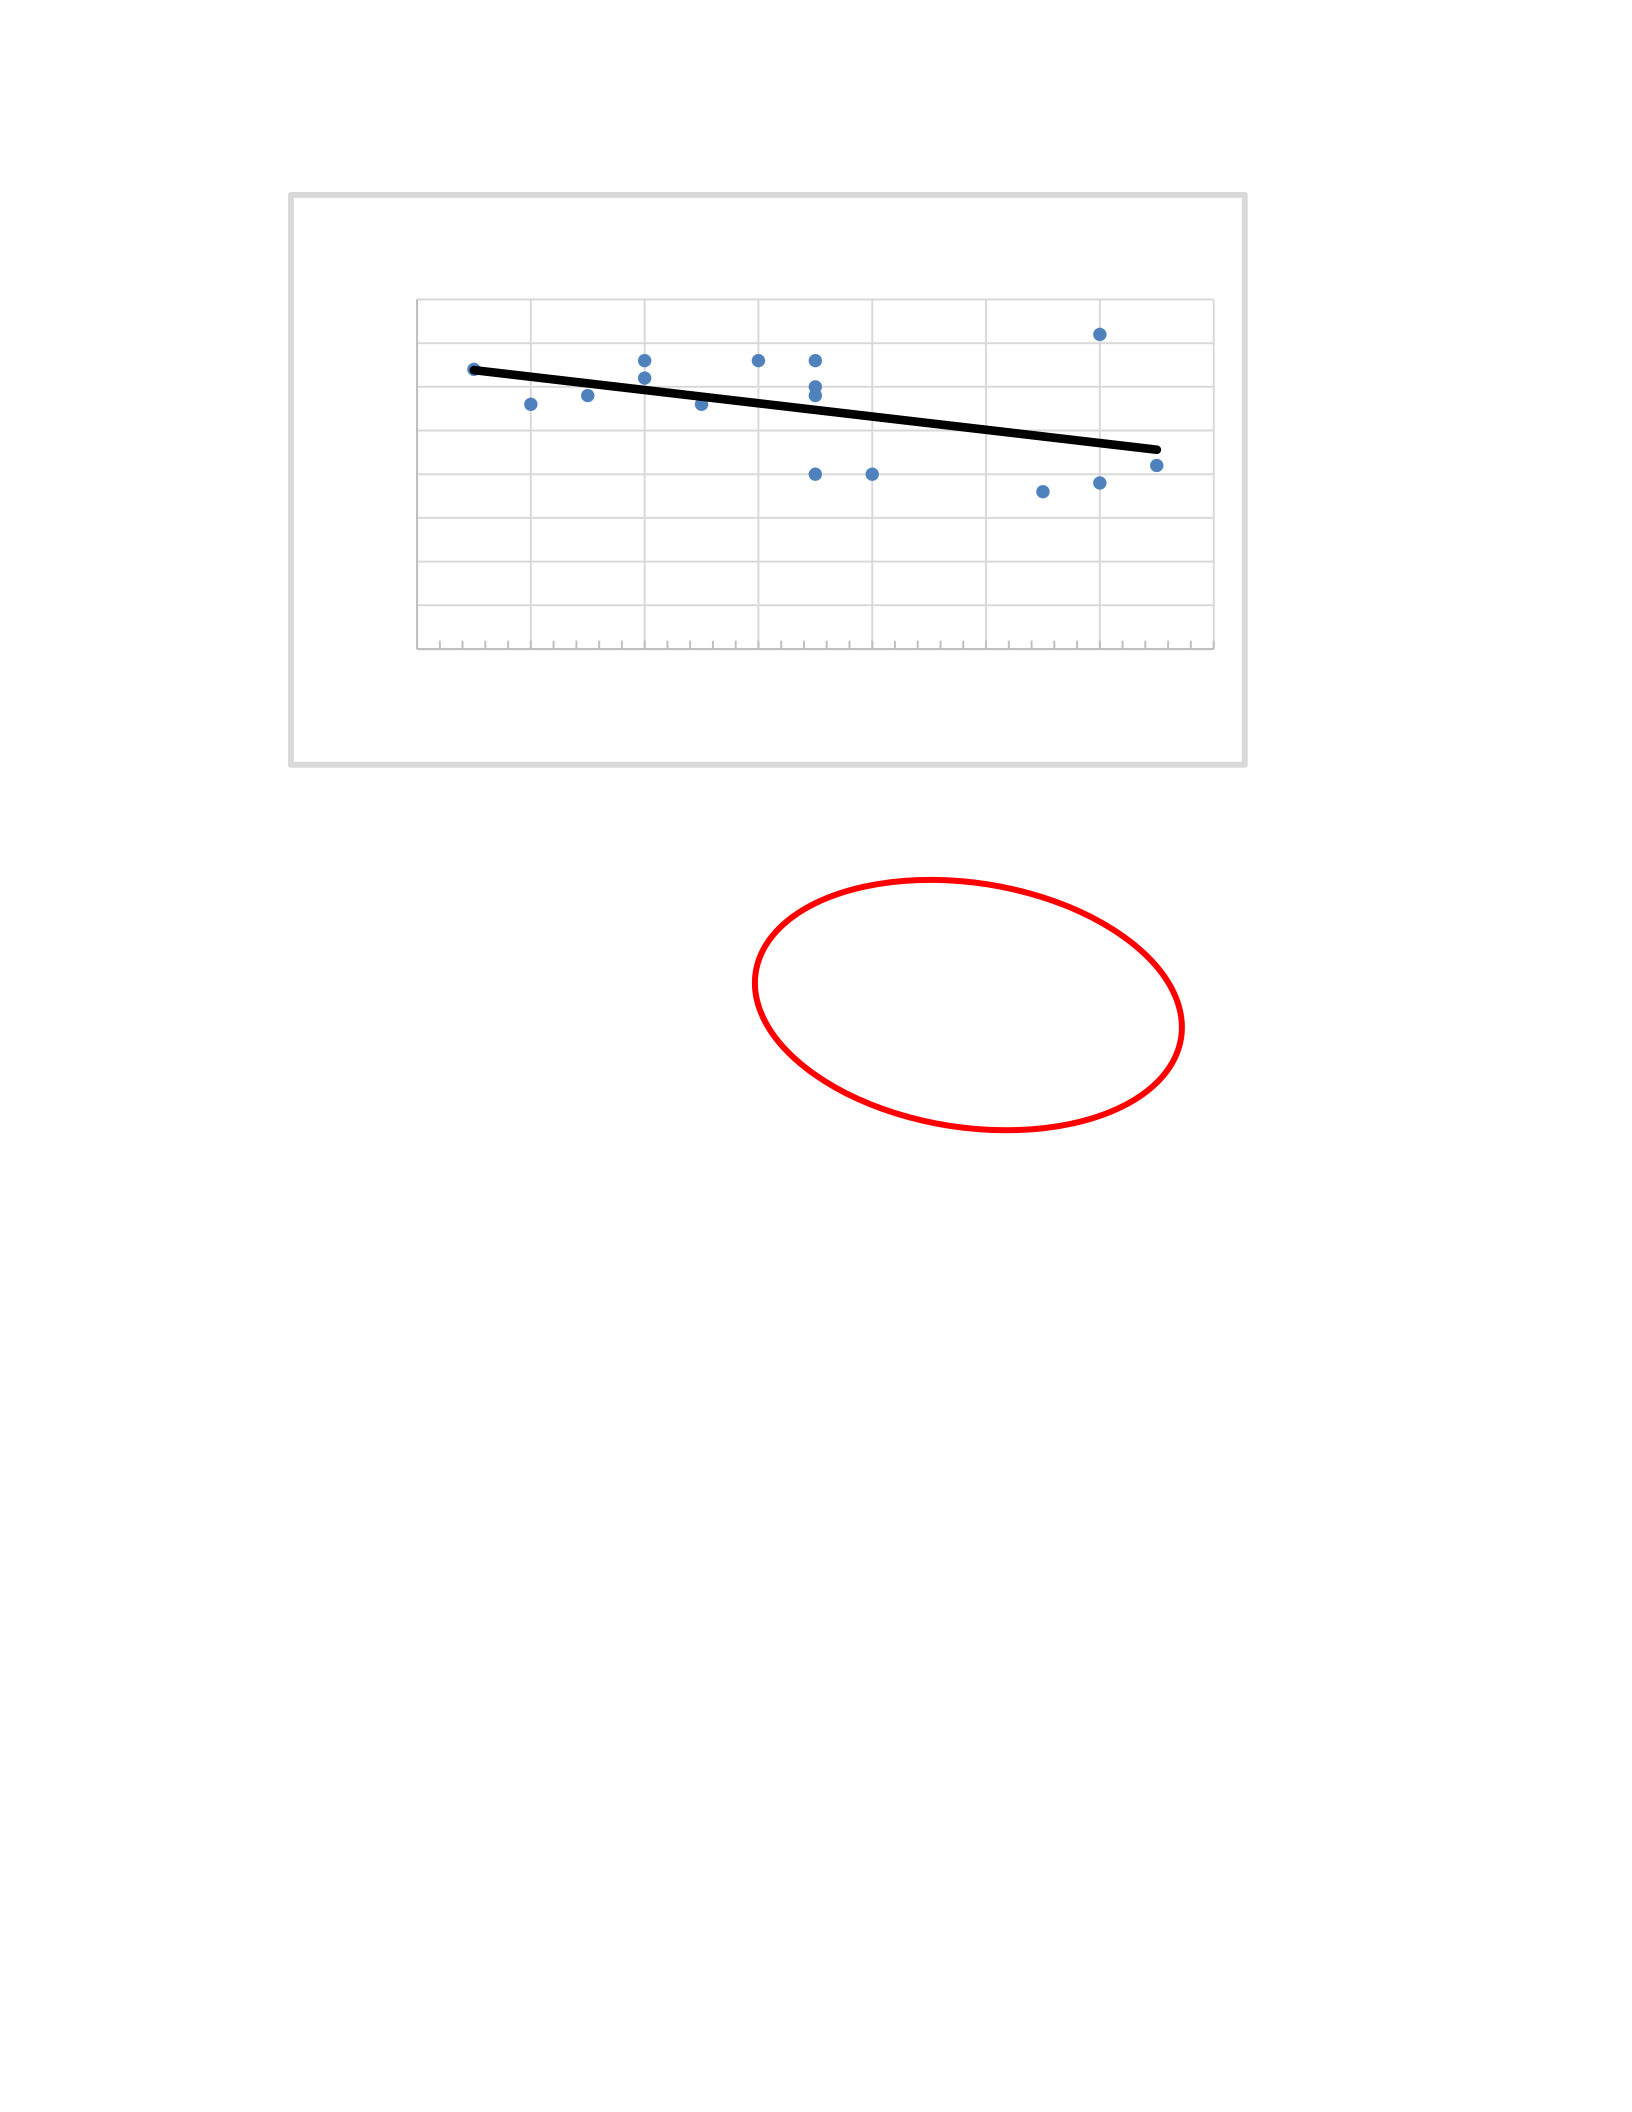
Figure A represents a scatterplot constructed from the data; Figure B represents a regression line
drawn through the scatterplot that “fits” the data points reasonably well; Figure C represents an
ellipse drawn around the data points.
a. (2 pts.) What is the overall direction of the correlation?Negative
b. (2 pts.) Estimate the strength of the correlation coefficient:Strong
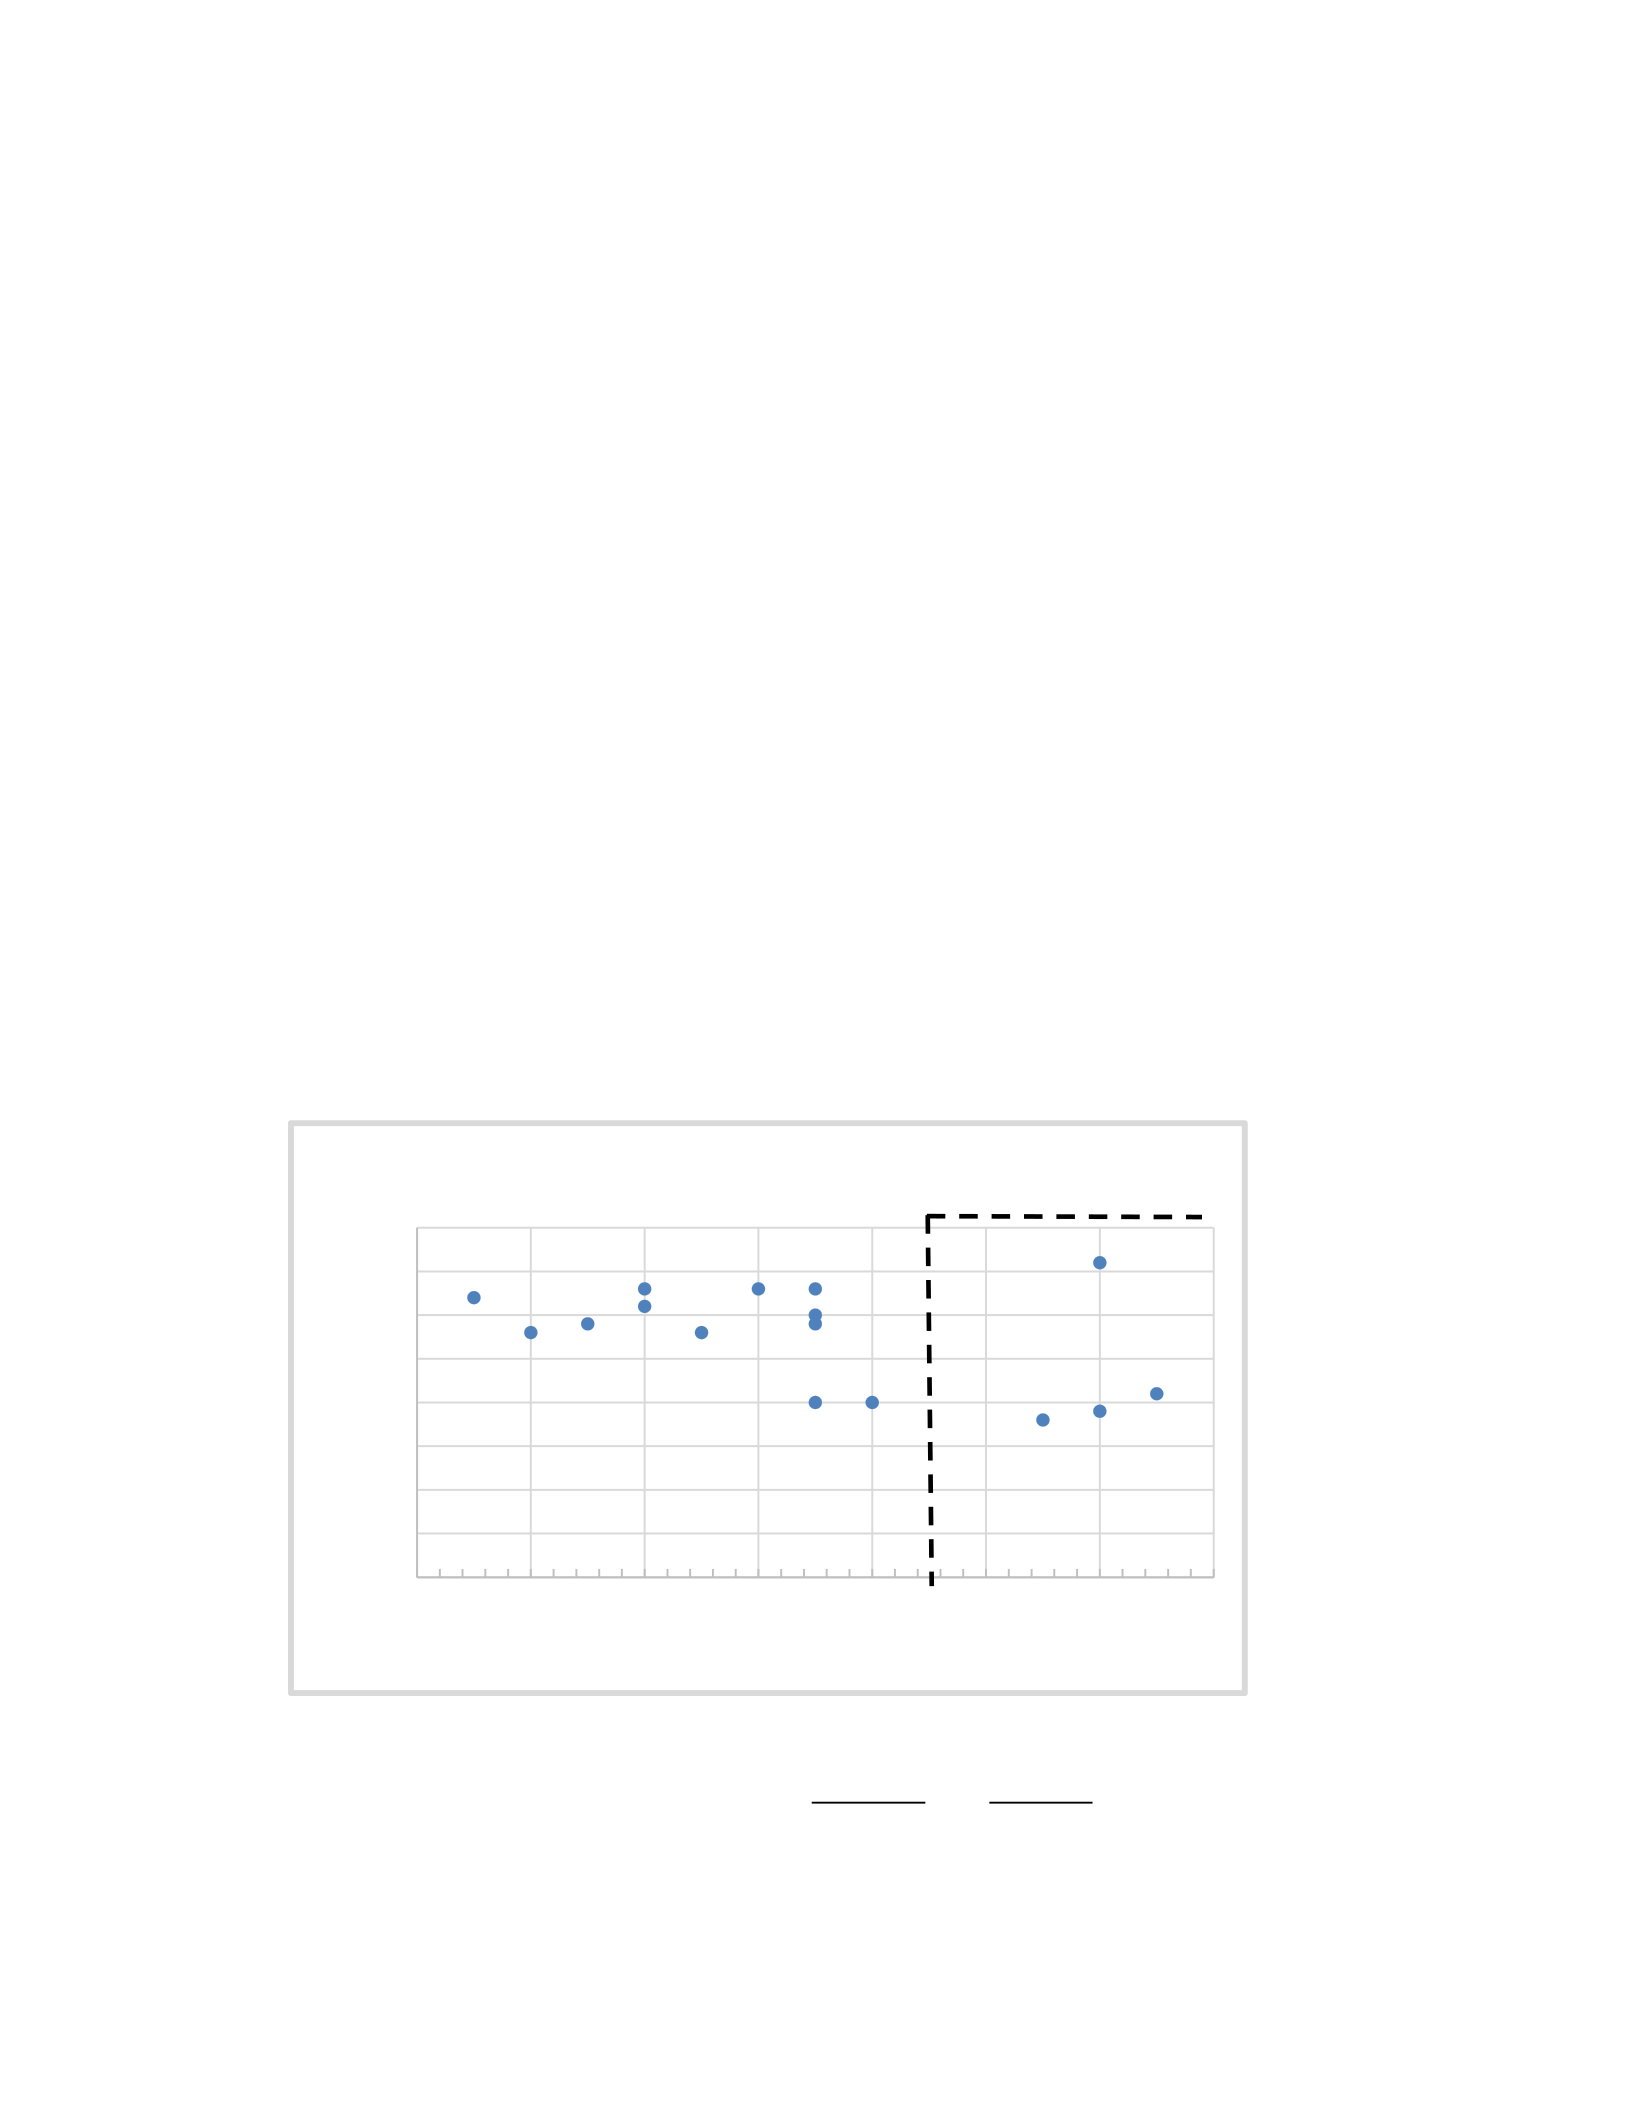
Consider Figure D (below).
10 12 14 16 18 20 22 24
0
5
10
15
20
25
30
35
40
Figure D
Years of School
Body Mass Index
c. (2 pts.) Using only the data points associated with the years of school above 16;
what effect does this have on the direction and strength of the correlation
coefficient?
Negative and Weak
Page 9 of 10

EDUC 606
d. (4 pts.) Explain why this is the case.
Since there is the same number of points that are pulling in oppostie
directions of each other makes it a negative effect in the small size of the
sample.
e. (4 pts.) Identify how likely it is that a causal relationship has been indicated.
The correlation between the BMI and Years of School is weak because it is such a
small sample. There isnt a rise or fall of BMI as the years in school increases.
Page 10 of 10

