


Assignment #3. /35
Name:
Tutorial Number:
Due the week of January 30th at the beginning of tutorial. Late assignments will not be
accepted. Answers for assignment questions will be provided in the tutorial only. Content for this
assignment can be found in your textbook, Chapter 4. Write using your own words.
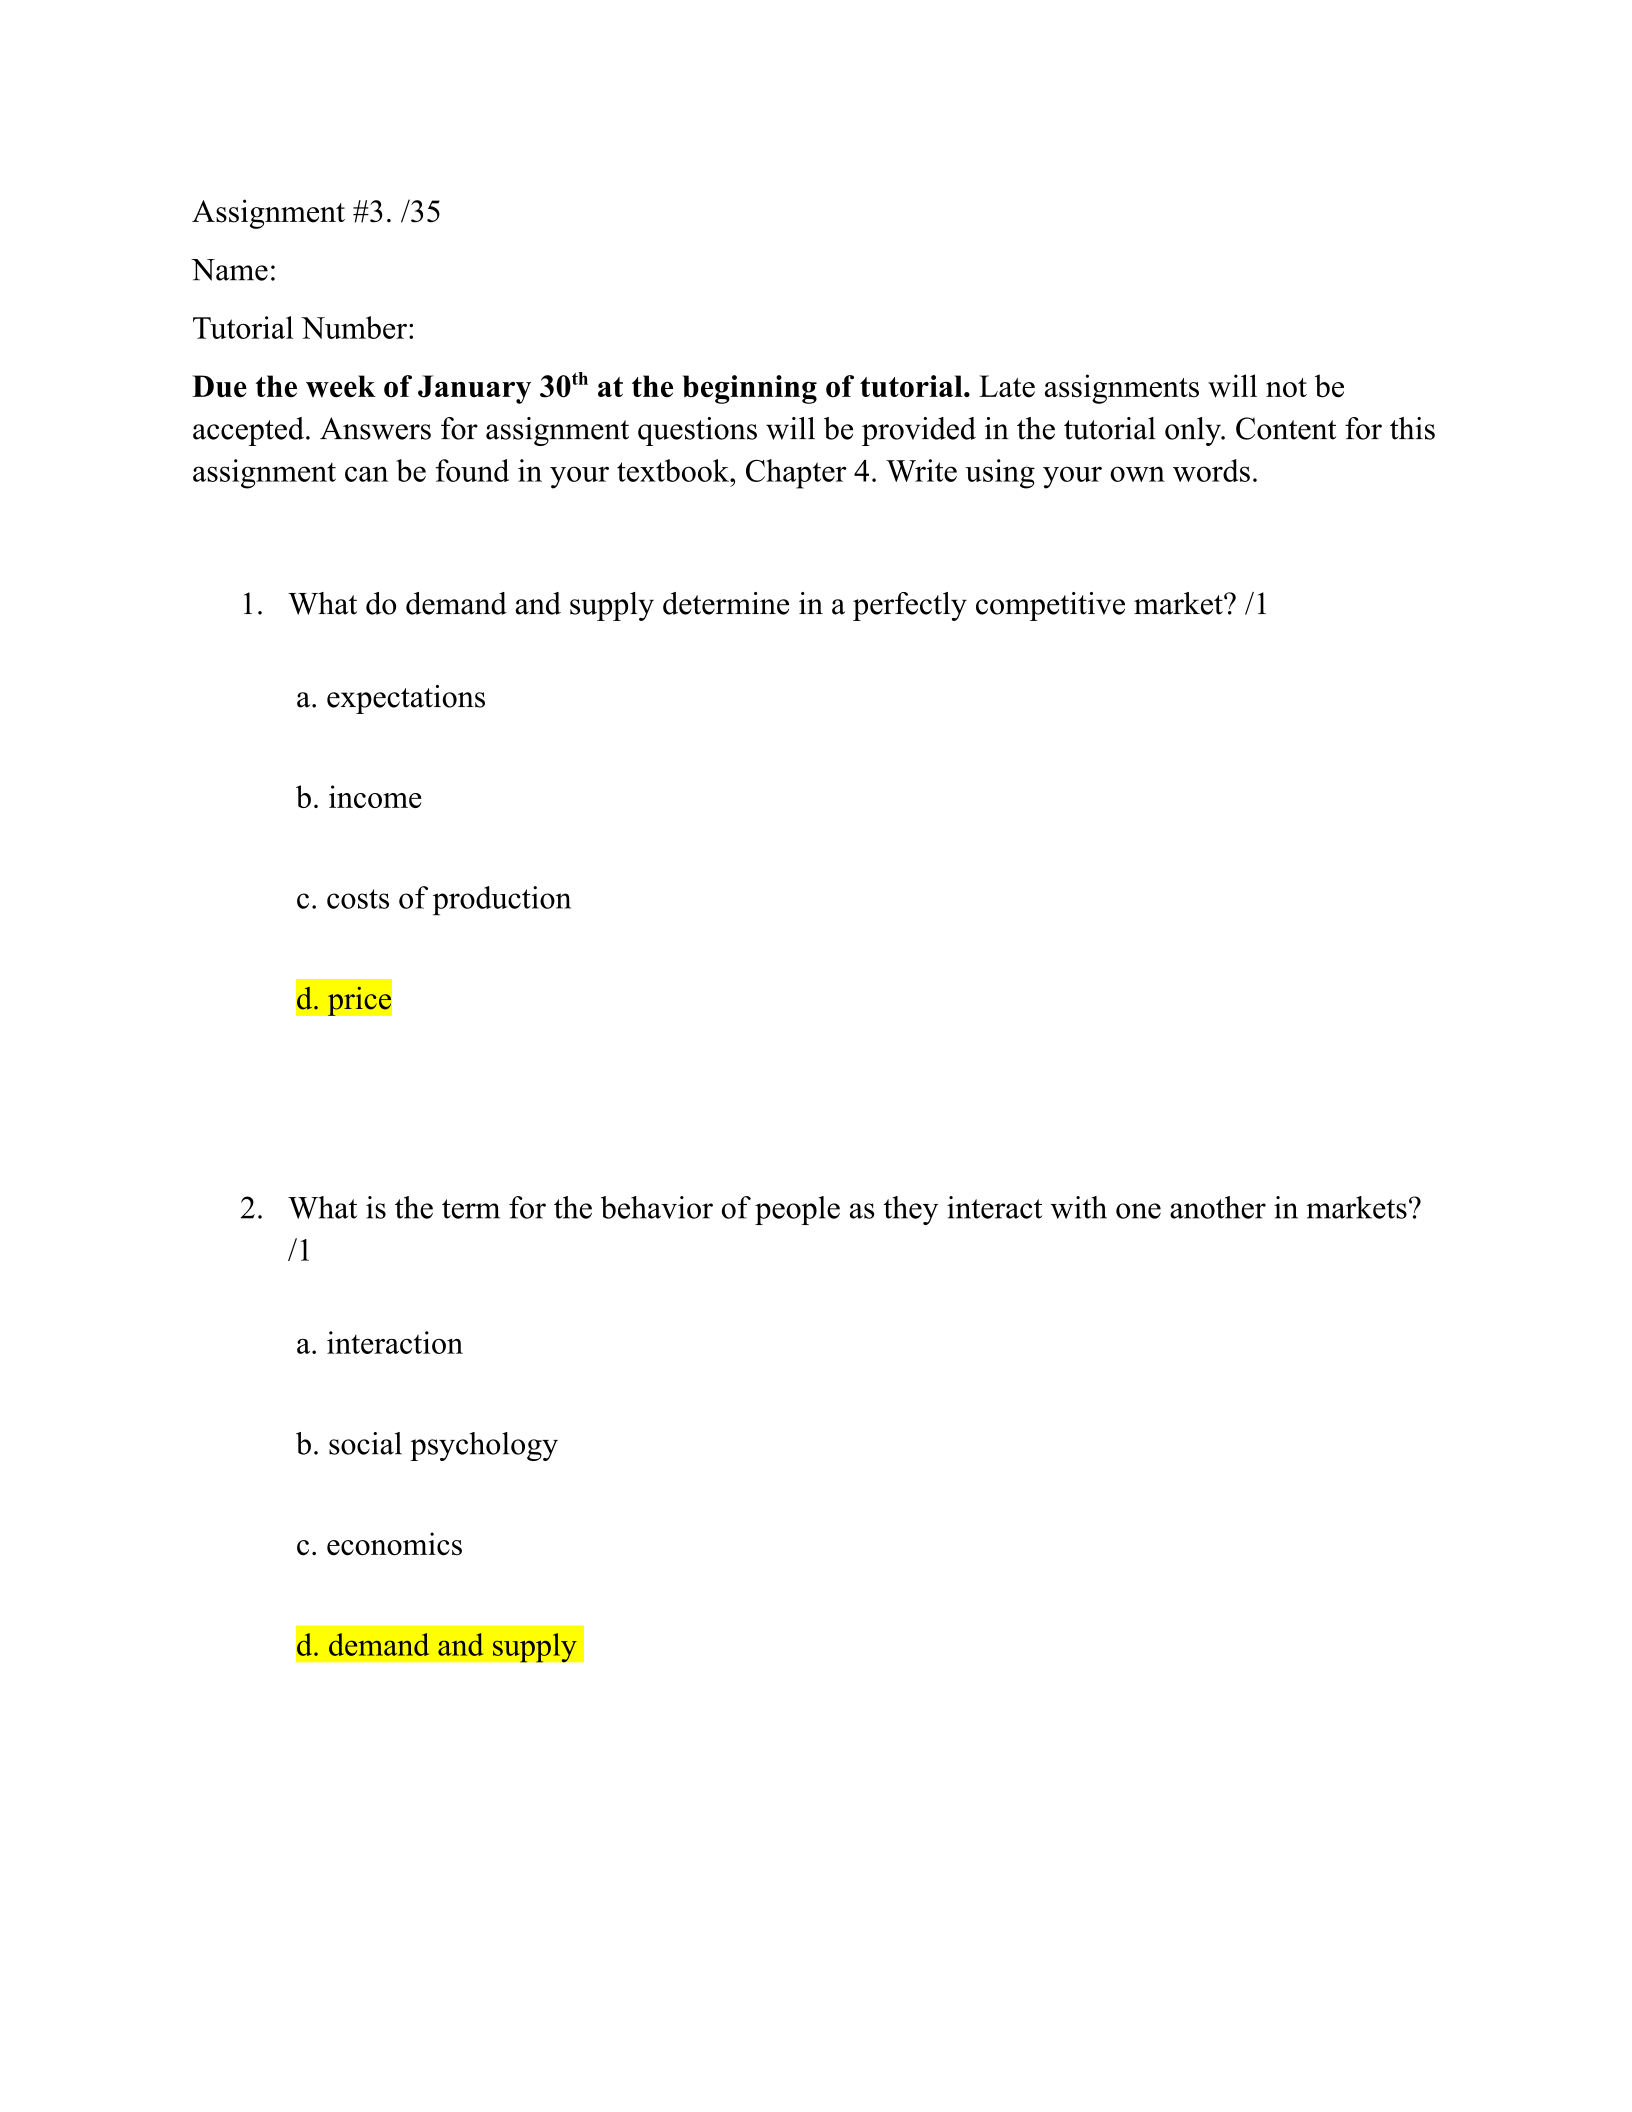
1. What do demand and supply determine in a perfectly competitive market? /1
a. expectations
b. income
c. costs of production
d. price
2. What is the term for the behavior of people as they interact with one another in markets?
/1
a. interaction
b. social psychology
c. economics
d. demand and supply

3. What is a market? /1
a. a group of people with common desires
b. a place where only buyers come together
c. a group of demanders and suppliers of a particular good or
service
d. a place where only sellers meet
4. In a free market, who determines how much of a good will be sold and the price at which
it is sold? /1
a. suppliers
b. the government
c. demanders
d. suppliers and demanders together
5. Market demand is given as Qd = 95– P. Market supply is given as Qs = 3P + 15. What
would result if the market price were $25? /1
a. a surplus of 20
b. a surplus of 40
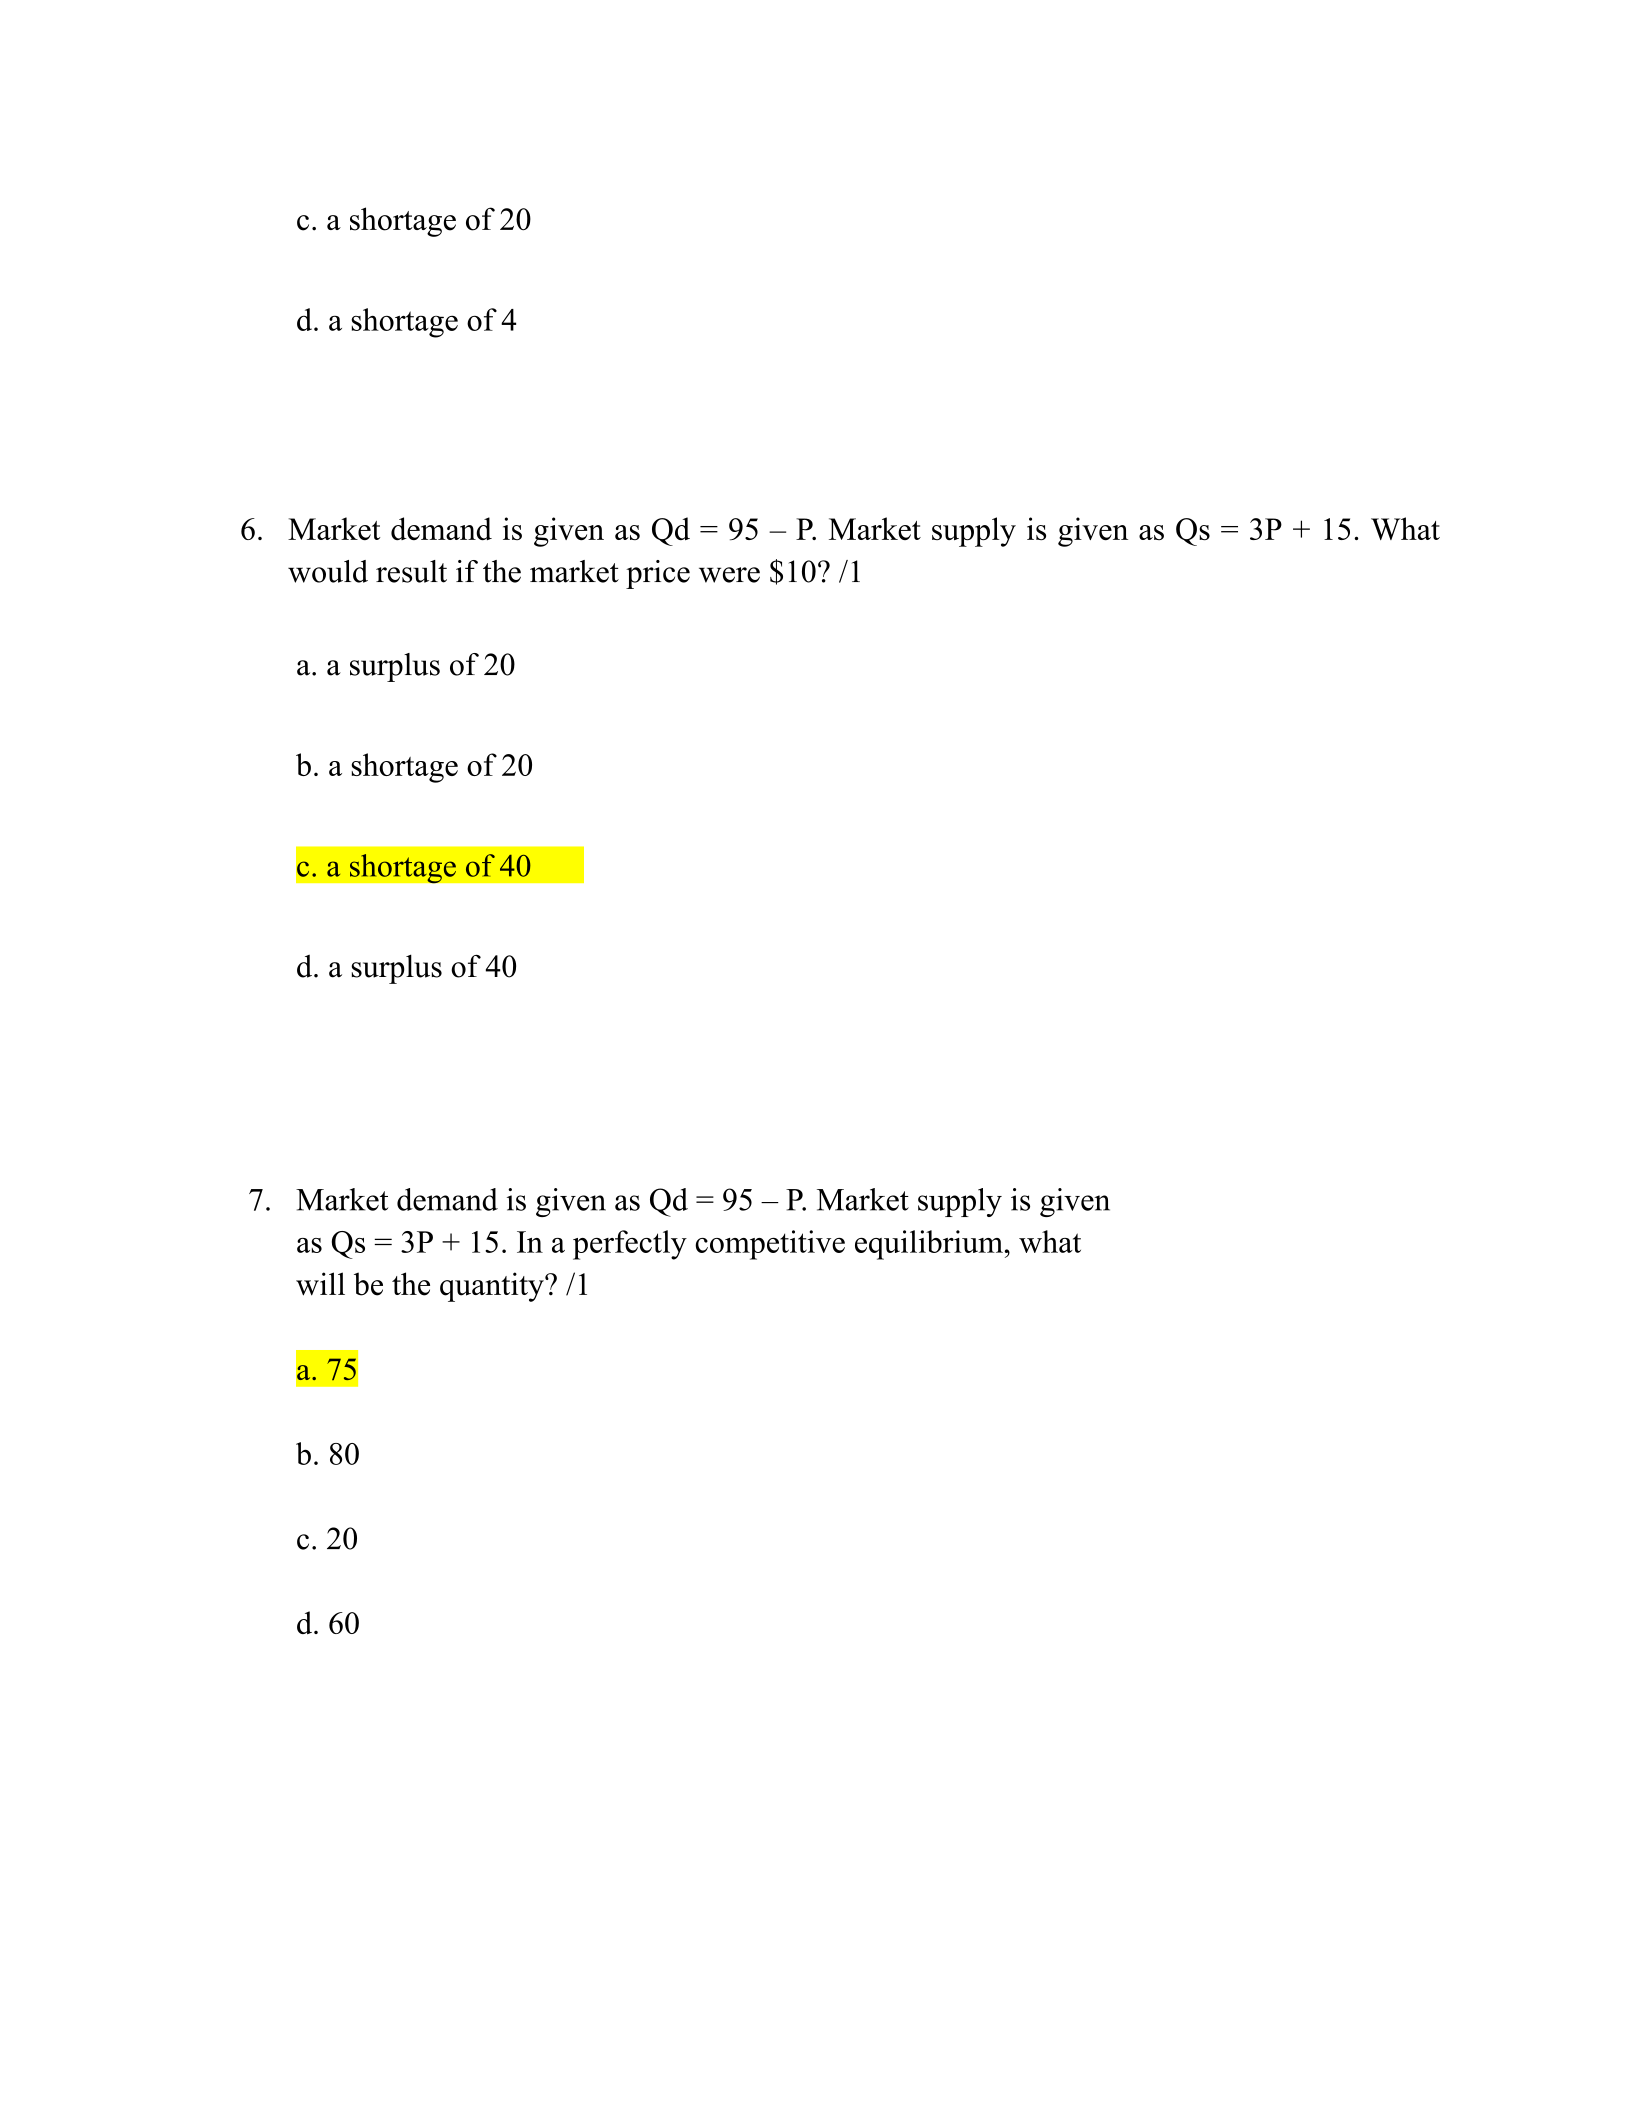
c. a shortage of 20
d. a shortage of 4
6. Market demand is given as Qd = 95 – P. Market supply is given as Qs = 3P + 15. What
would result if the market price were $10? /1
a. a surplus of 20
b. a shortage of 20
c. a shortage of 40
d. a surplus of 40
7. Market demand is given as Qd = 95 – P. Market supply is given
as Qs = 3P + 15. In a perfectly competitive equilibrium, what
will be the quantity? /1
a. 75
b. 80
c. 20
d. 60
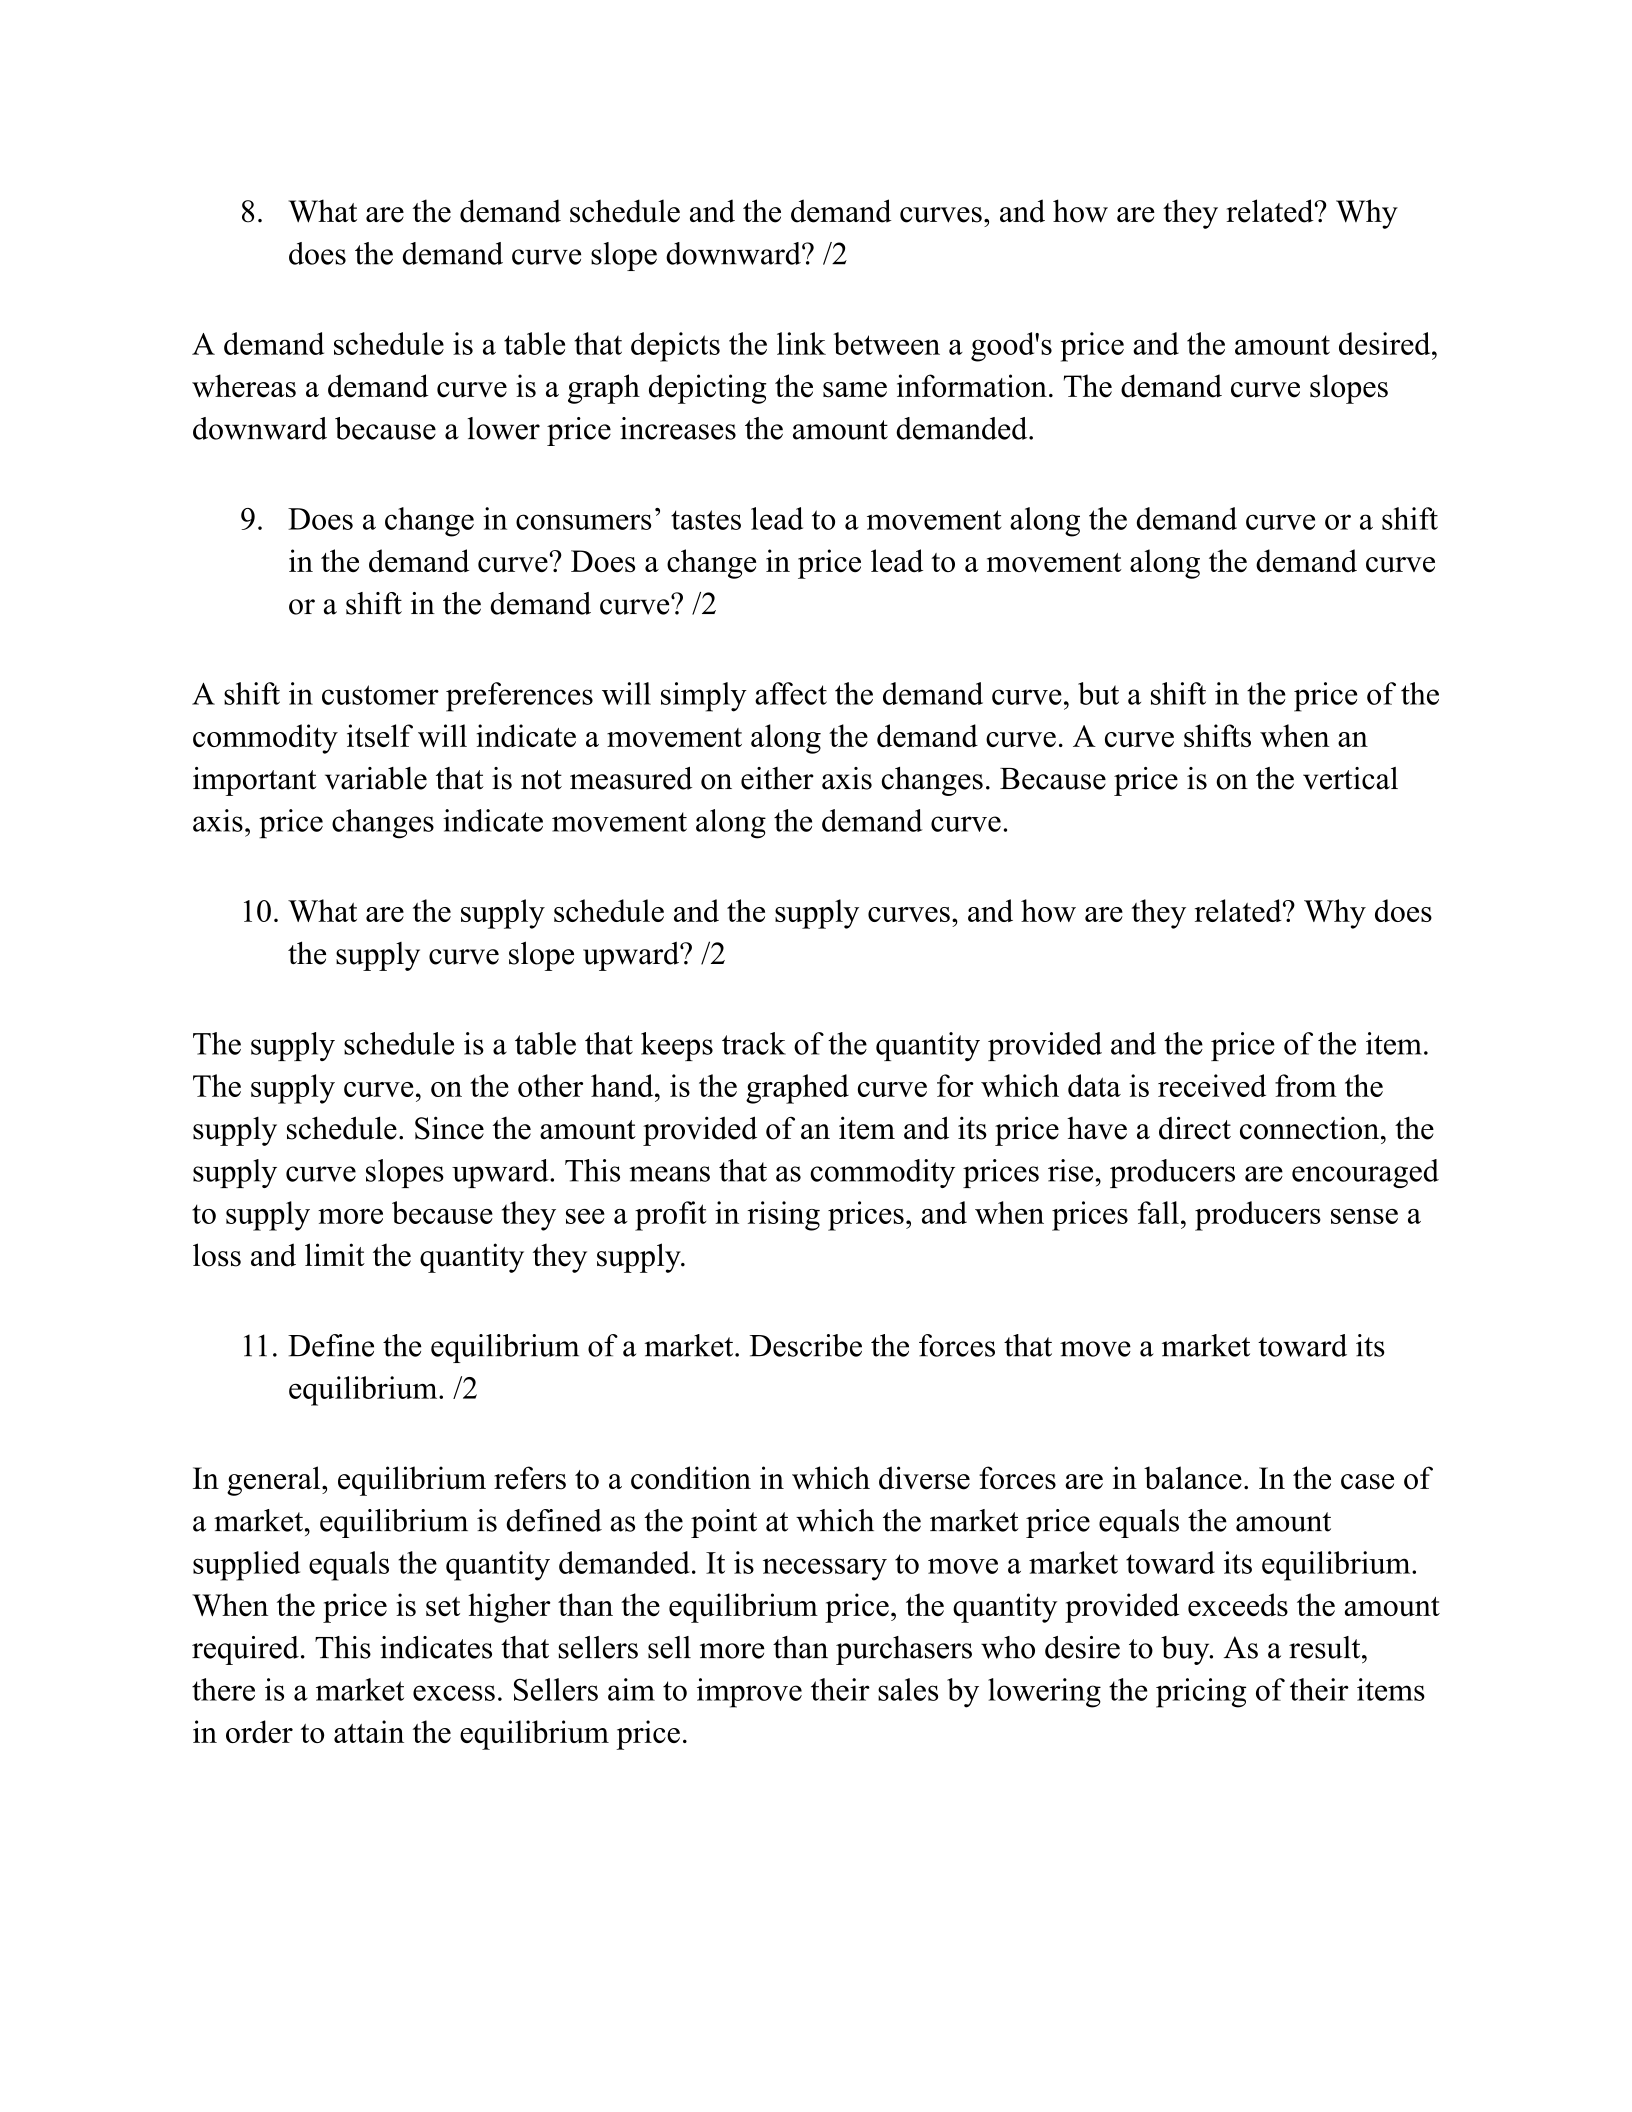
8. What are the demand schedule and the demand curves, and how are they related? Why
does the demand curve slope downward? /2
A demand schedule is a table that depicts the link between a good's price and the amount desired,
whereas a demand curve is a graph depicting the same information. The demand curve slopes
downward because a lower price increases the amount demanded.
9. Does a change in consumers’ tastes lead to a movement along the demand curve or a shift
in the demand curve? Does a change in price lead to a movement along the demand curve
or a shift in the demand curve? /2
A shift in customer preferences will simply affect the demand curve, but a shift in the price of the
commodity itself will indicate a movement along the demand curve. A curve shifts when an
important variable that is not measured on either axis changes. Because price is on the vertical
axis, price changes indicate movement along the demand curve.
10. What are the supply schedule and the supply curves, and how are they related? Why does
the supply curve slope upward? /2
The supply schedule is a table that keeps track of the quantity provided and the price of the item.
The supply curve, on the other hand, is the graphed curve for which data is received from the
supply schedule. Since the amount provided of an item and its price have a direct connection, the
supply curve slopes upward. This means that as commodity prices rise, producers are encouraged
to supply more because they see a profit in rising prices, and when prices fall, producers sense a
loss and limit the quantity they supply.
11. Define the equilibrium of a market. Describe the forces that move a market toward its
equilibrium. /2
In general, equilibrium refers to a condition in which diverse forces are in balance. In the case of
a market, equilibrium is defined as the point at which the market price equals the amount
supplied equals the quantity demanded. It is necessary to move a market toward its equilibrium.
When the price is set higher than the equilibrium price, the quantity provided exceeds the amount
required. This indicates that sellers sell more than purchasers who desire to buy. As a result,
there is a market excess. Sellers aim to improve their sales by lowering the pricing of their items
in order to attain the equilibrium price.
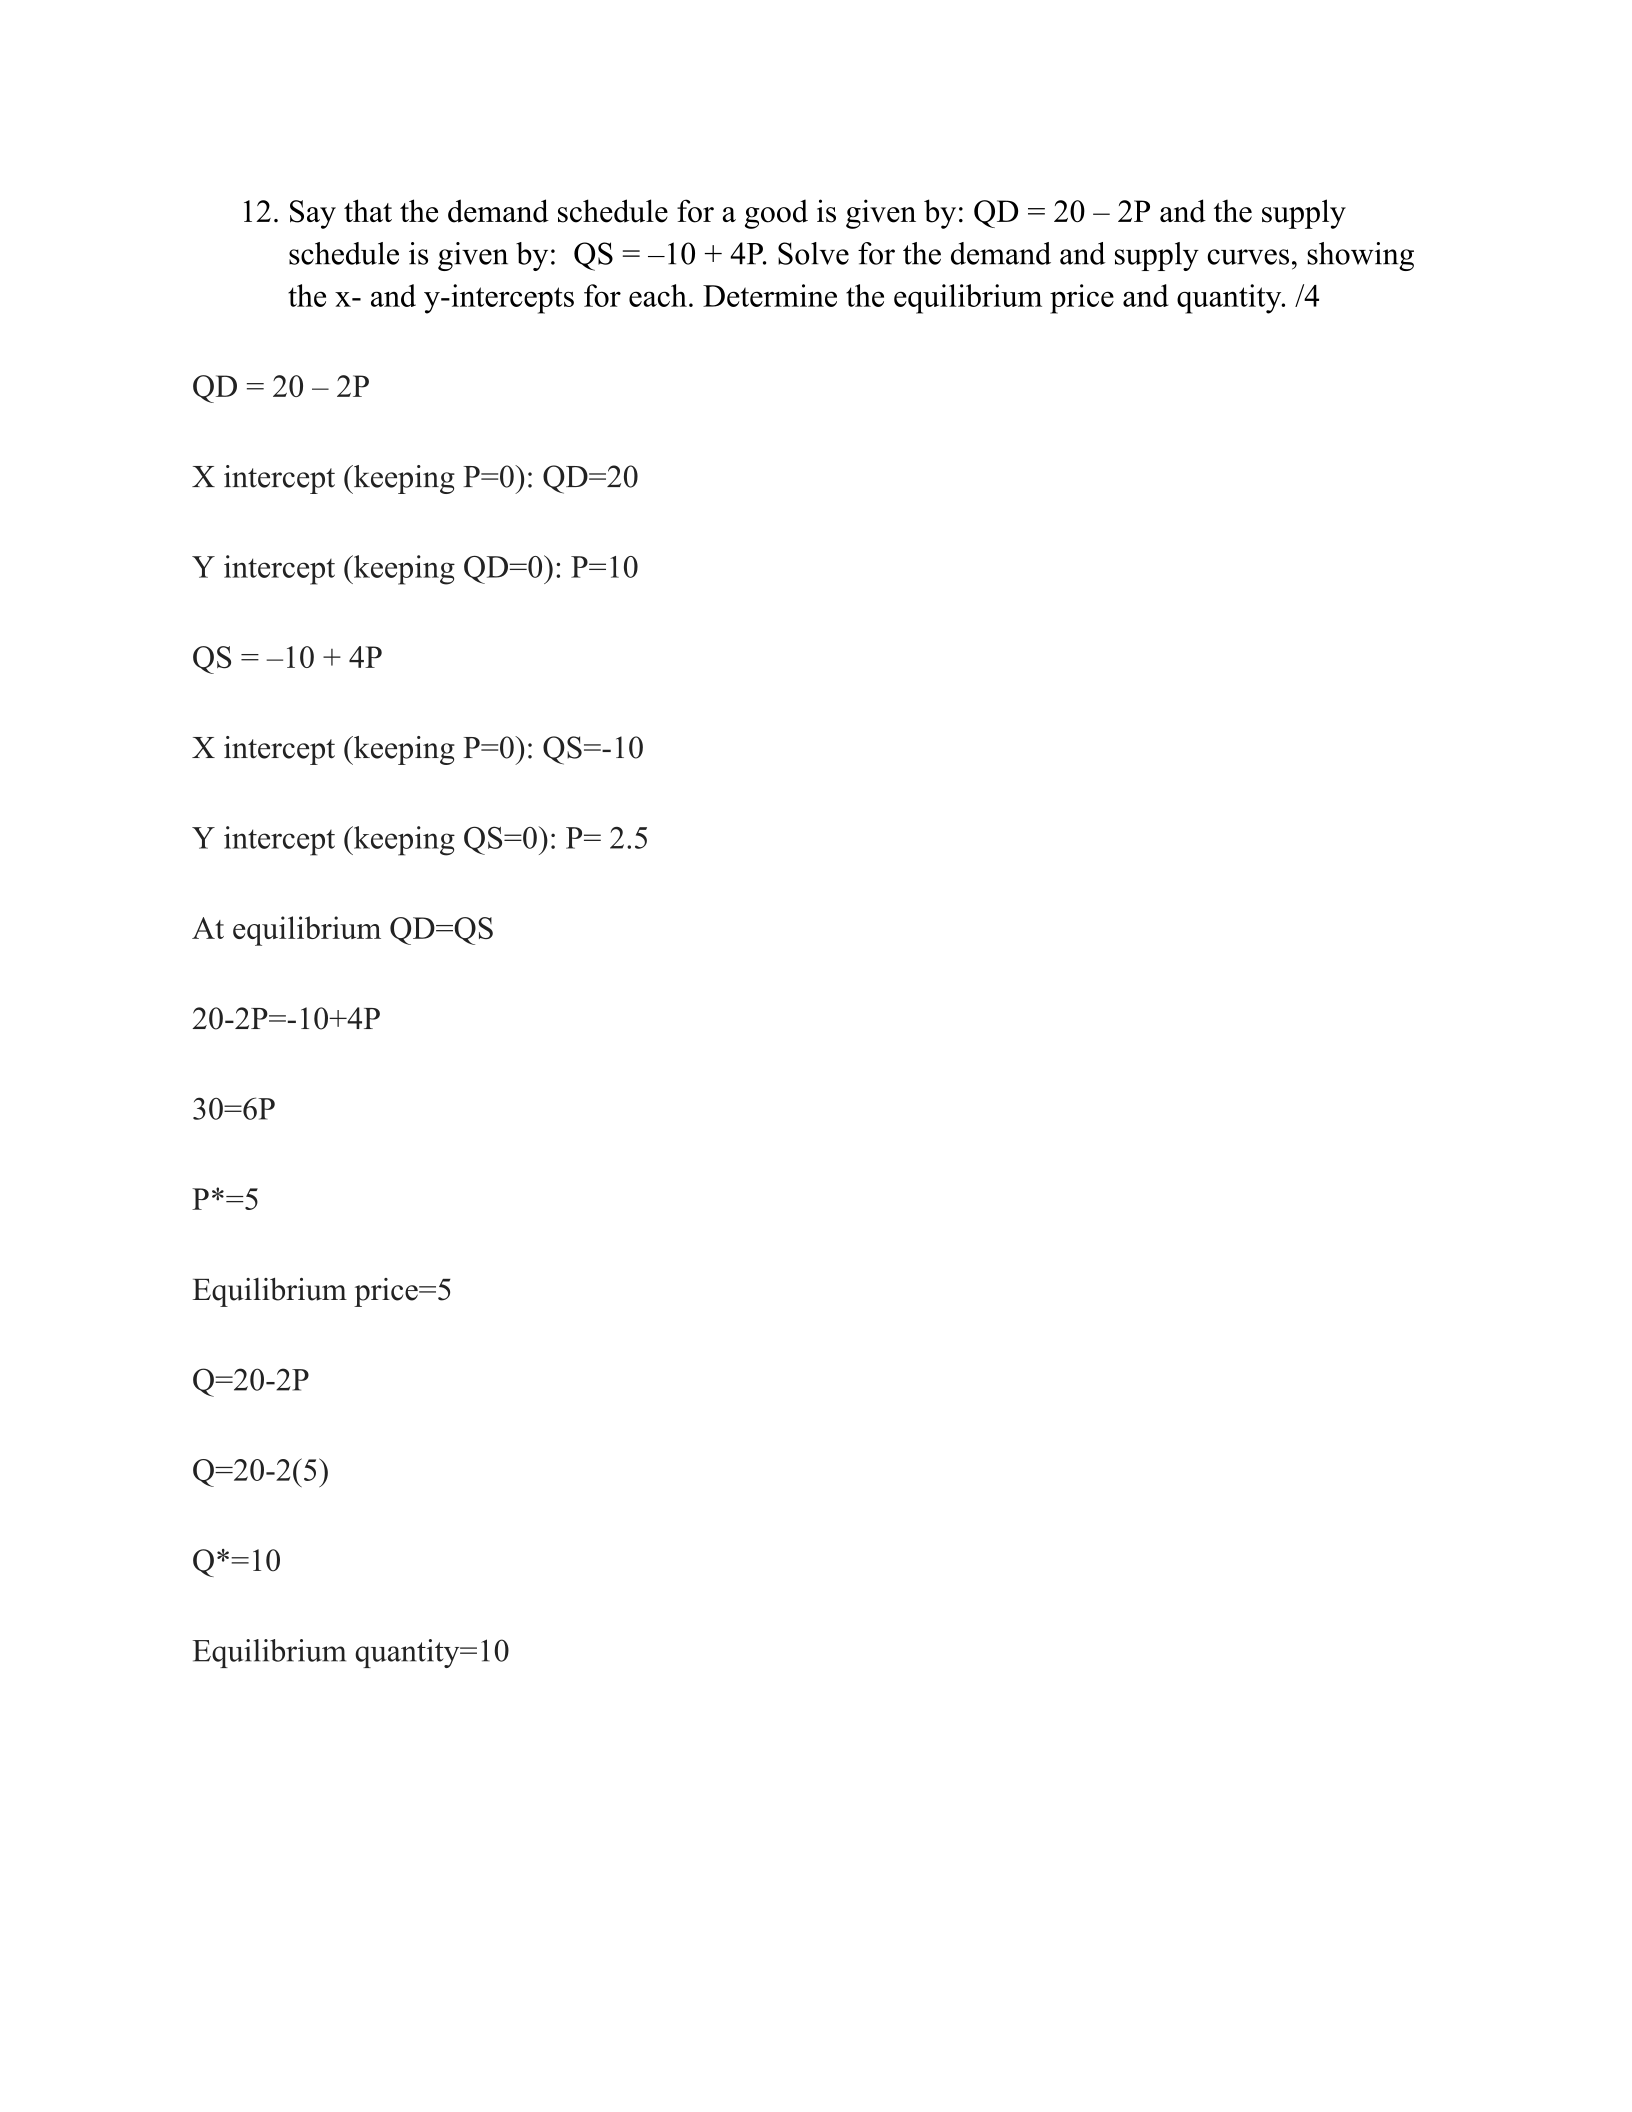
12. Say that the demand schedule for a good is given by: QD = 20 – 2P and the supply
schedule is given by: QS = –10 + 4P. Solve for the demand and supply curves, showing
the x- and y-intercepts for each. Determine the equilibrium price and quantity. /4
QD = 20 – 2P
X intercept (keeping P=0): QD=20
Y intercept (keeping QD=0): P=10
QS = –10 + 4P
X intercept (keeping P=0): QS=-10
Y intercept (keeping QS=0): P= 2.5
At equilibrium QD=QS
20-2P=-10+4P
30=6P
P*=5
Equilibrium price=5
Q=20-2P
Q=20-2(5)
Q*=10
Equilibrium quantity=10
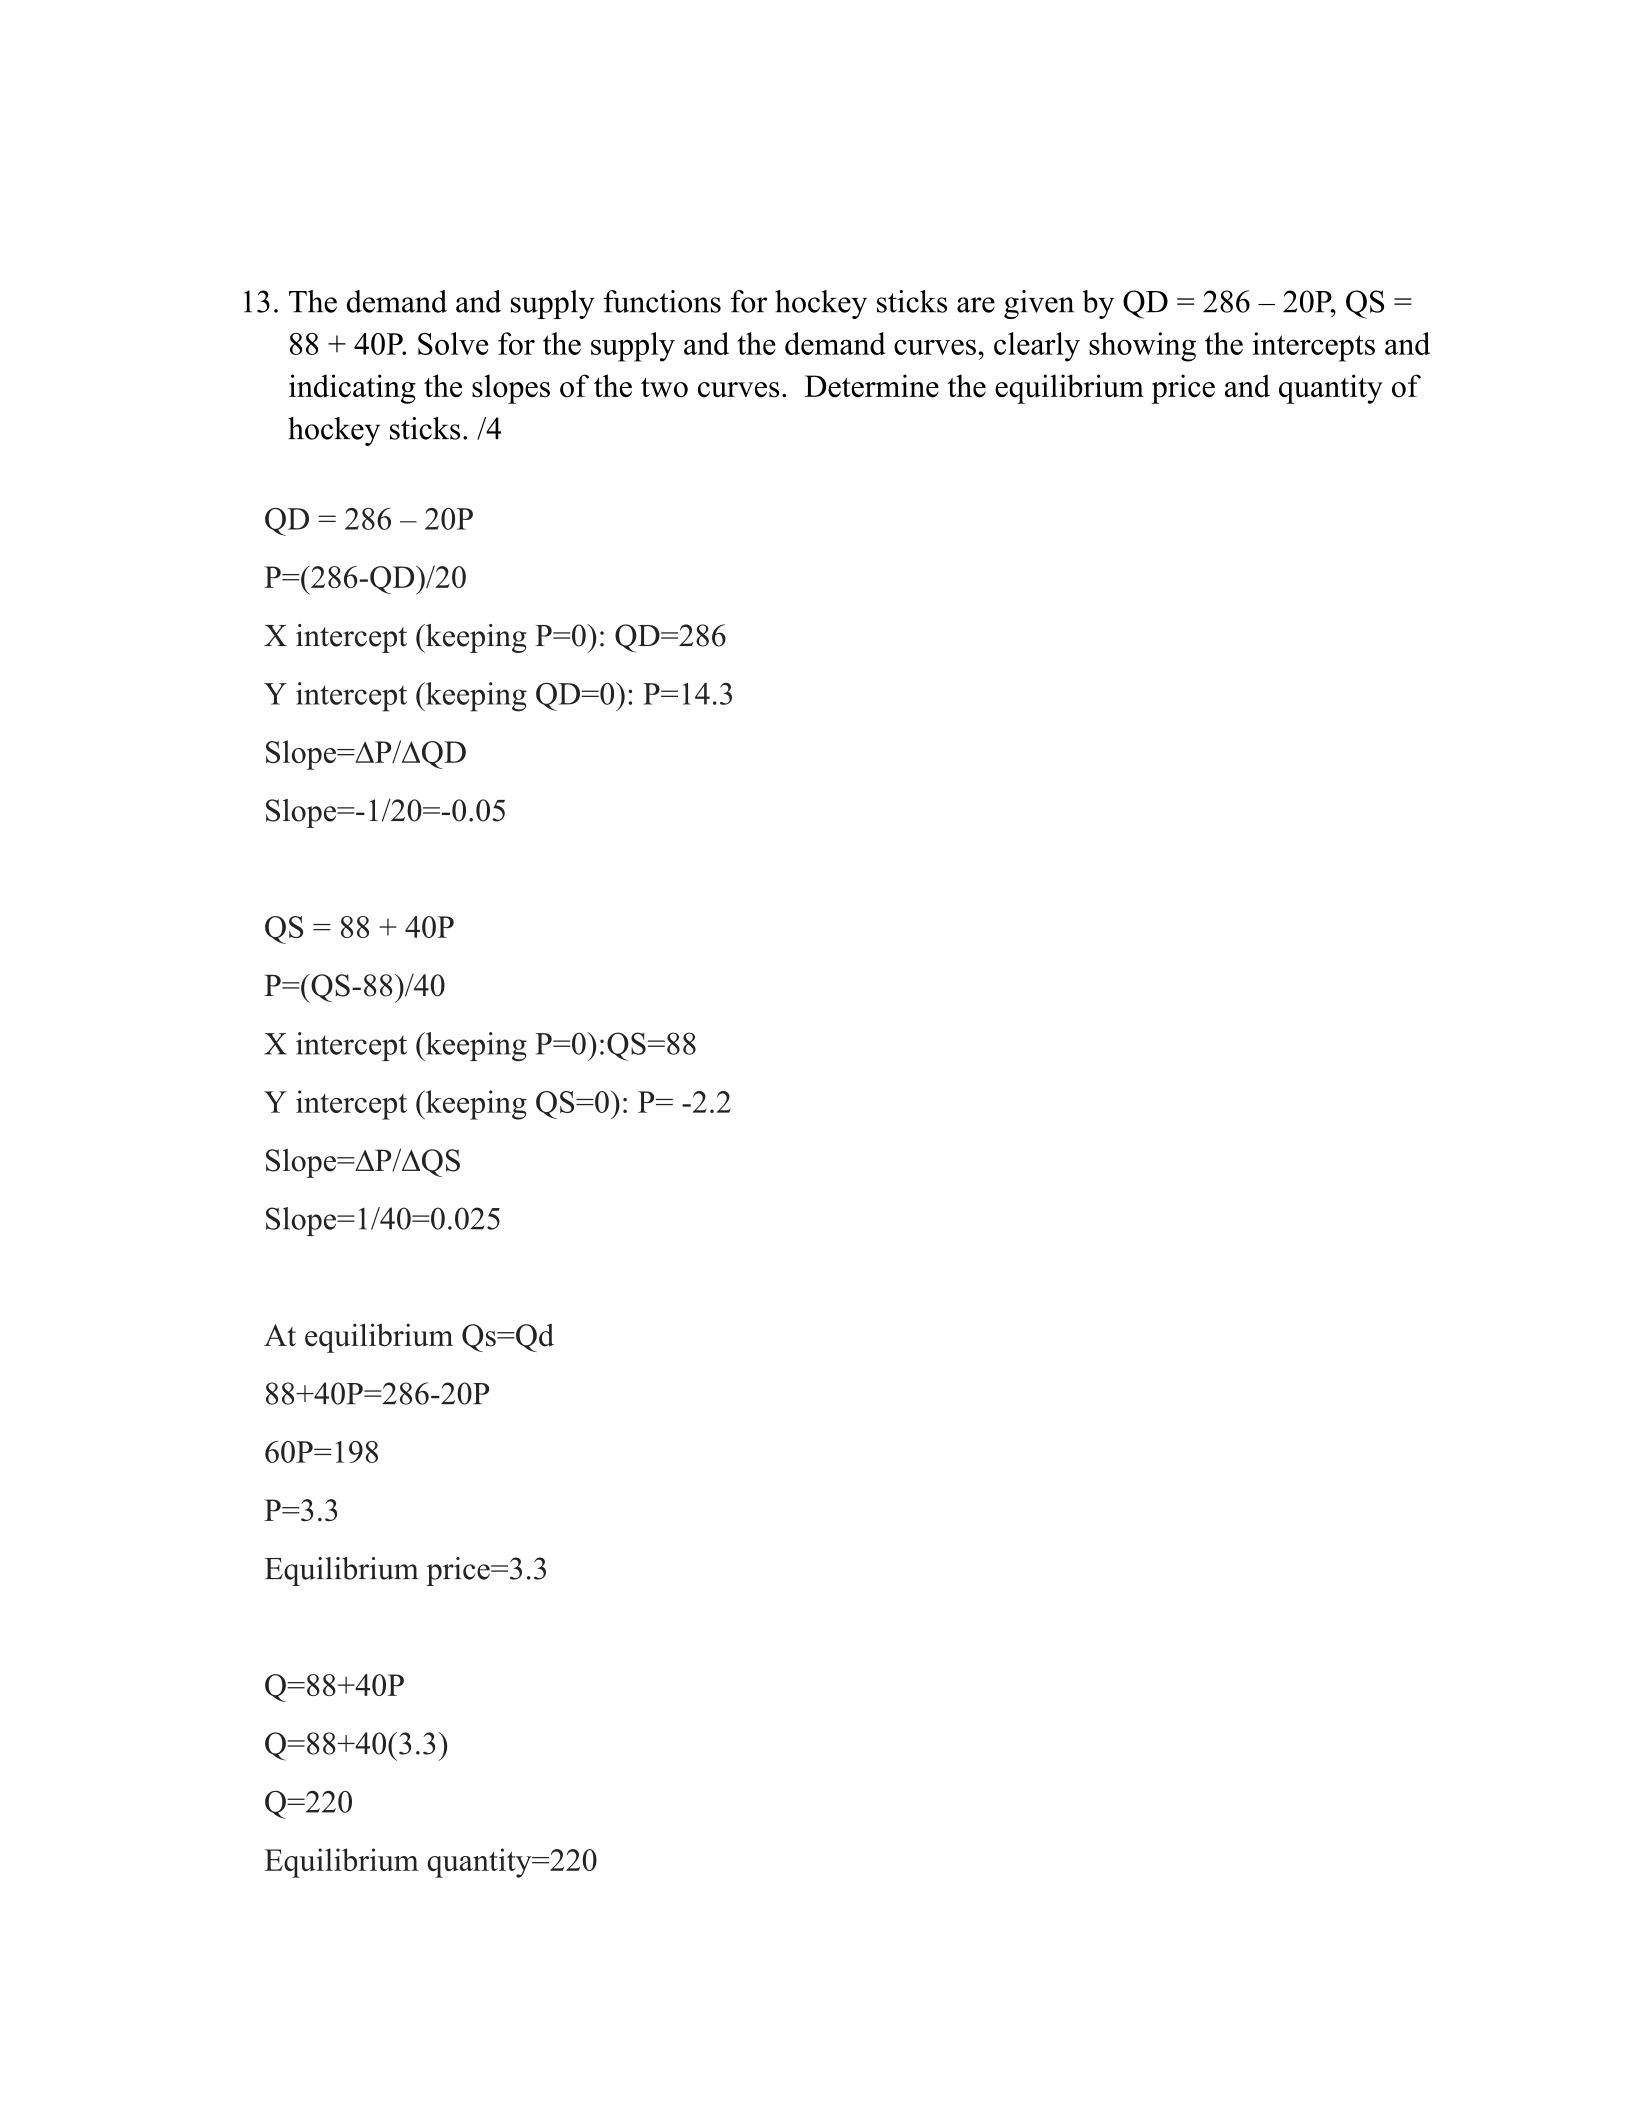
13. The demand and supply functions for hockey sticks are given by QD = 286 – 20P, QS =
88 + 40P. Solve for the supply and the demand curves, clearly showing the intercepts and
indicating the slopes of the two curves. Determine the equilibrium price and quantity of
hockey sticks. /4
QD = 286 – 20P
P=(286-QD)/20
X intercept (keeping P=0): QD=286
Y intercept (keeping QD=0): P=14.3
Slope=∆P/∆QD
Slope=-1/20=-0.05
QS = 88 + 40P
P=(QS-88)/40
X intercept (keeping P=0):QS=88
Y intercept (keeping QS=0): P= -2.2
Slope=∆P/∆QS
Slope=1/40=0.025
At equilibrium Qs=Qd
88+40P=286-20P
60P=198
P=3.3
Equilibrium price=3.3
Q=88+40P
Q=88+40(3.3)
Q=220
Equilibrium quantity=220
Powered by TCPDF (www.tcpdf.org)

