


Chapter 2
2. It should be noted that since each score is counted only once in the frequency distribution, this
means that the sum of the frequencies (F) formed by each score must be equal to N (the total
number of scores or observations).
4. As well as strip plots and dot charts, dot plots are also known as dot plots, which are graphs
that display data as dots on the x- and y-axes.
6. An example of a normal distribution is a statistical distribution where the data are distributed
around the mean symmetrically in the space of the distribution. It is commonly represented by
the bell curve, which is one of the most popular charts. This is because a normal distribution is
characterized by both a left and a right tail, also referred to as the tails of a normal distribution. A
score that is called an outlier score indicates that the score differs significantly from the mean of
the distribution by a significant amount. If the left tail exceeds the mean by a significant amount,
the difference between the two is referred to as a significant difference. The right tails of the
distribution is associated with a significant increase in the distribution.
8. A relative frequency proportion may be a more intuitive way to interpret a frequency than to
simply interpret the frequency itself. During the analysis, we will look at the number of times a
specific events occur in comparison to the total number of events over the course of the year.
10. It is important to keep in mind that to distinguish a positively skewed distribution
from a negatively skewed distribution, one must consider the shape and placement of the curve.
As can be seen from the graph, those with a positively skewed distribution have a short and high
curve, which indicates that there are many high scores (Cohen, 2014). A problem
can arise if an examination is too easy in terms of causing problems for the candidate. In
contrast, a negative skewed distribution, which is indicative of a low-test score (Cohen, 2014), is
characterized by a short and steep curve at the end, which indicates a low-test score (Cohen,
2014). The difficulty of an exam that was too challenging may indicate that the exam was too
difficult.
12. A typical score on an intelligence test usually falls in the middle of the distribution of test
scores, which follows an approximation of a normal distribution.
B. Bimodal means that you have 2 modes, which in a agility test you have 1 for males and the
other for females.
C. There was an asymmetrical pattern in the patient's memory score as a variable. It is common
for a patient's memory score to contain extremely low scores that have a low frequency within
the score. As a consequence, it would be reasonable to state that the memory score of the patient
had a negative value.
14. highly difficult
16. She is incorrectly claiming that she outperformed 90% of her classmates since the 10th
percentile marks indicate that 10% of the scores are below that score, yet 90% are above it, so
that she is incorrectly saying that she outperformed 90% of her classmates. It is for this reason
that Crystal scored lower than 90% of her classmates on the test.
B. When he compares Ernesto's score with the score of his opponent, there is some uncertainty
as to whether Ernesto's score is closer to the right tail or closer to the left tail. As a result, Ernesto
would be among the lowest scorers of all the students in the group if his score were on the left
tail. The fact remains, however, that if his score was on the right tail, he would be among the
highest scorers on the test. As a result, depending on where his score falls on the normal curve,
his claim may be accurate or incorrect, depending on how accurate or inaccurate the claim is.
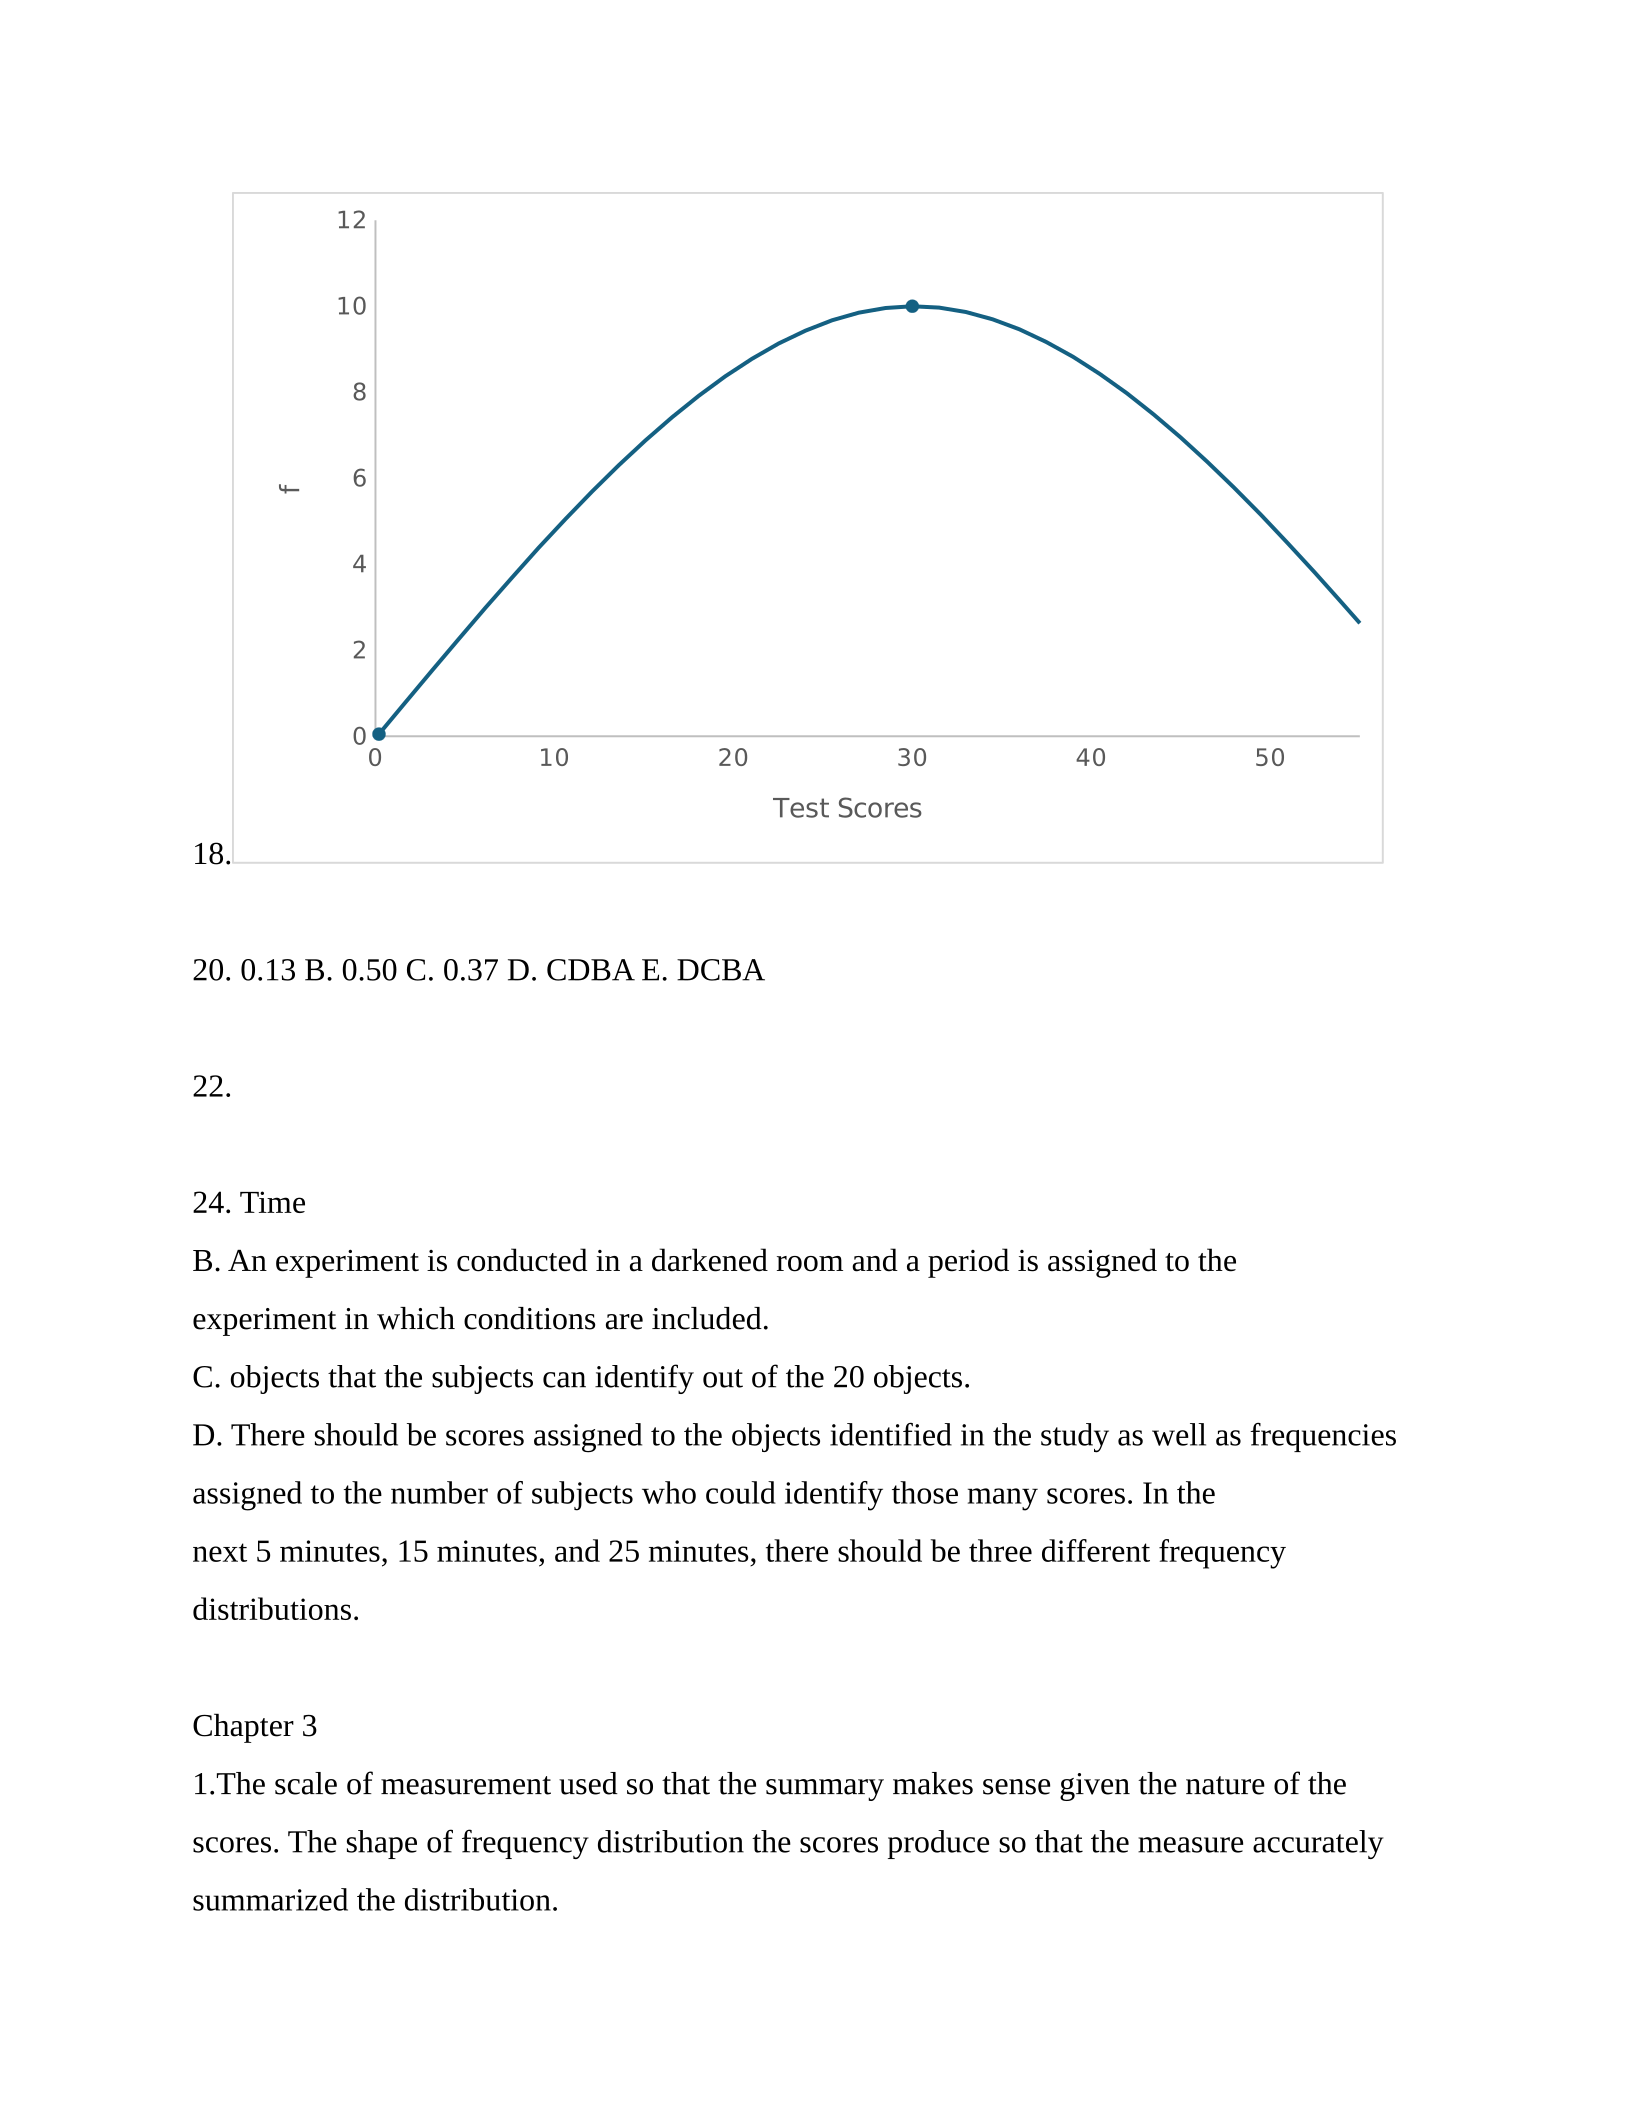
18.
0 10 20 30 40 50
0
2
4
6
8
10
12
Test Scores
f
20. 0.13 B. 0.50 C. 0.37 D. CDBA E. DCBA
22.
24. Time
B. An experiment is conducted in a darkened room and a period is assigned to the
experiment in which conditions are included.
C. objects that the subjects can identify out of the 20 objects.
D. There should be scores assigned to the objects identified in the study as well as frequencies
assigned to the number of subjects who could identify those many scores. In the
next 5 minutes, 15 minutes, and 25 minutes, there should be three different frequency
distributions.
Chapter 3
1.The scale of measurement used so that the summary makes sense given the nature of the
scores. The shape of frequency distribution the scores produce so that the measure accurately
summarized the distribution.
2. The median is typically a better measure of central tendency.
3. A mean is the only measure that considers the entire dataset, as opposed to the other
two measures, which consider a portion of it. Furthermore, one of the most significant
characteristics of mean is that it is the only measure of the three that can be subjected to further
mathematical treatment compared to the others.
B. The way in which the central tendency in this kind of case is measured by the mean is not
appropriate in this case. In a series, all the values tend to influence the mean, since the mean also
tends to be affected by all the values in the series. This occurs when there is an extreme tail at the
extreme end of the series and the mean tends to pull toward that tail. It should be noted that
whenever this happens, the mean no longer represents the series as effectively as it used to.
4. The number, which indicates distance from the mean. The sign, which indicates direction from
the mean.
5. In general, the mean is the best way to predict the score that an individual is likely to achieve
based on their own character. In order to predict the value of the average, central score, we treat
all scores as though they were the mean score, and we treat all scores as though they were the
mean score. Therefore, a sample's mean score can be used to predict any scores that might be
found in that sample by comparing it to that sample's mean.
6. 58 B. If the number of observations is odd then the median is the middle term of the
data. Therefore, the median of the data is 58.
7. 13 B. The missing score is 13 which is equal to the actual mean of the rest of the score.
8. -5 It’s the farthest from the mean. B. -5 s in the tail where the lowest frequency occur.
C. The person with 0, because everyone in the sample score around the mean, which is the
highest frequency. D. The person with highest raw score is +3, because the raw score +3 is far
above the mean.
9. There is a symbol in the diagram, which represents the average score in a population, as well
as the sum of the deviations around the average score that is equal to zero. This is the center of
the distribution in the diagram.
10. A bar graph is made when the independent variable is a discrete variable. B. Variables that
take a finite number of values are known as discrete variables. Qualitative variables are discrete.
Sometimes quantitative variables can be discrete too. C. Line graphs are made when the
independent variables are continuous variables. In other words, while working with intervals or
ratios, one should be using a line graph. D. Variables raking an infinite number of values are
known as continuous variables.
11. 20 B. 35. C. ^y
12.
13. Age and the nature of texting appear to be negatively related, as there seems to be a negative
correlation between them. Because the researcher claims that slowing down with age is a result
of the body's aging process, slower speed is attributed to this. B. In the study conducted by the
researcher, it was found that there is no difference in the speed at which men and women text.
The results indicate that there is no correlation between texting speed and gender differences in
any way whatsoever. An illustration of the situation would be shown on a line graph as a
horizontal line which shows how the situation would be depicted on a line graph. Consequently,
there is no correlation between the speed at which a text message is sent and the gender of the
recipient when it comes to the speed at which it is sent.
Chapter 4
1. When it comes to the calculation of variability, it is important to consider it since without it, a
measure of central tendency cannot provide an accurate representation of how the data are
distributed.
2. A measure of central tendency allows us to determine where the centre of the distribution is
located, whereas a measure of variability allows us to determine how much each score differs
from the next, or how wide the distribution is, by determining how much each score differs from
the next. There are three aspects of a data set that can be communicated by evaluating the
variability of the data.
3. The variance of the sample can be defined as the average of the squared deviations of the
scores around the sample mean. B. A sample standard deviation can normally be calculated by
taking the square root of the sample variance and dividing that by the sample standard deviation.
In simple terms, a sample variance can be defined by adding up the square roots of the sample
standard deviations.
4. To determine whether the measure of central tendency used is the most appropriate
measure for that data, it is necessary to assess its variability. When there is a great deal of
variability, the measure of central tendency used to estimate the variability becomes less
descriptive. B. The mean of the data is less useful if the variance of the data is high, because it is
less descriptive of the data. There are several reasons why this is true, including that a high
level of variability indicates a wide spread of data. The degree of difference between the actual
score values and each other is the degree to which the actual scores differ from one another.
5. They are the formulas to compute variance of the scores.
6. Since the value of a sample from the population is usually smaller than the value
of the population, the variance and standard deviation estimates of the population are always
larger than the values describing a sample from the population.
7. 4.1 B. 10 C. 2.64 D. 1.46 6.745
8. The standard deviation of Demetrius' scores is higher because he has a higher score of
inconsistency. A higher standard deviation indicates a greater degree of variability in the data.
B. The best way to describe Andrew is to describe him as a 60 student rather than a 60 student
who is a 60 student. It is evident that he has a very low level of variability in his scores as
compared to Demetrius, indicating a much higher level of consistency in his performance.
C. Due to a lower standard deviation, Andrew's scores can be predicted with greater accuracy.
D. In the next exam, Demetrius has a greater chance of doing extremely well or extremely
poorly. His grades are more variable due to the higher variability of his scores.
9. Considering the central limit theory, the mean of the sample equals the mean of the population
according to the central limit theory. The relationship should, therefore, remain the same as I
would expect it to be for the foreseeable future. B. The results from the analysis indicate that
there is some inconsistency in the results, since based on we would expect 0.82, 1.26, and 0.82
respectively for each. As a result, the sample size and the number of participants in each
conditions will be the same as well.
10. The results of an experiment are usually summarized by computing the mean and standard
deviation for each condition in order to summarize the results. If the standard deviations are
small and the scores in the conditions are similar, then there is a stronger relationship between
the scores in the two conditions, which is more consistent and more significant.
11. The symbol for the true population variance is and the true population standard
deviation is. B. Biased estimators of variance and standard deviation are the estimators of
the true population variance and standard deviation such that they are divided by N and
not which happens in case of unbiased estimators. C. Unbiased estimators of variance
and standard deviation are the estimators of the true population variance and standard deviation
such that they are divided by and not N in order to avoid too small results that one may
arrive at, by dividing the sum of squared deviation by N. D. The use of unbiased estimators
should be chosen if N is small, since the amount of bias in the biased estimate of variance
equation is very great when N is small. Suppose that N is ten and that there is a 10% bias in the
result.
12. A flat line graph for the distribution of means seems to indicate that the distribution of means
has a unimodal shape if the line graph for the distribution of means has a 2D shape. Due to the
fact that the means are equal, then it can be said that the means are equal. Looking at the
line graph, it can be seen that all the scores are very close to each other, showing a very good
correlation. B. From the known information, it can be concluded that the mean score for the men
is and the standard deviation for the men is . C. The average scores of the
population are given as 14, so when we take this into account, we can expect the average of the
population by taking into account the sample average, and so here the researcher used the sample
mean of 14 to predict the average for the population.
Powered by TCPDF (www.tcpdf.org)

