


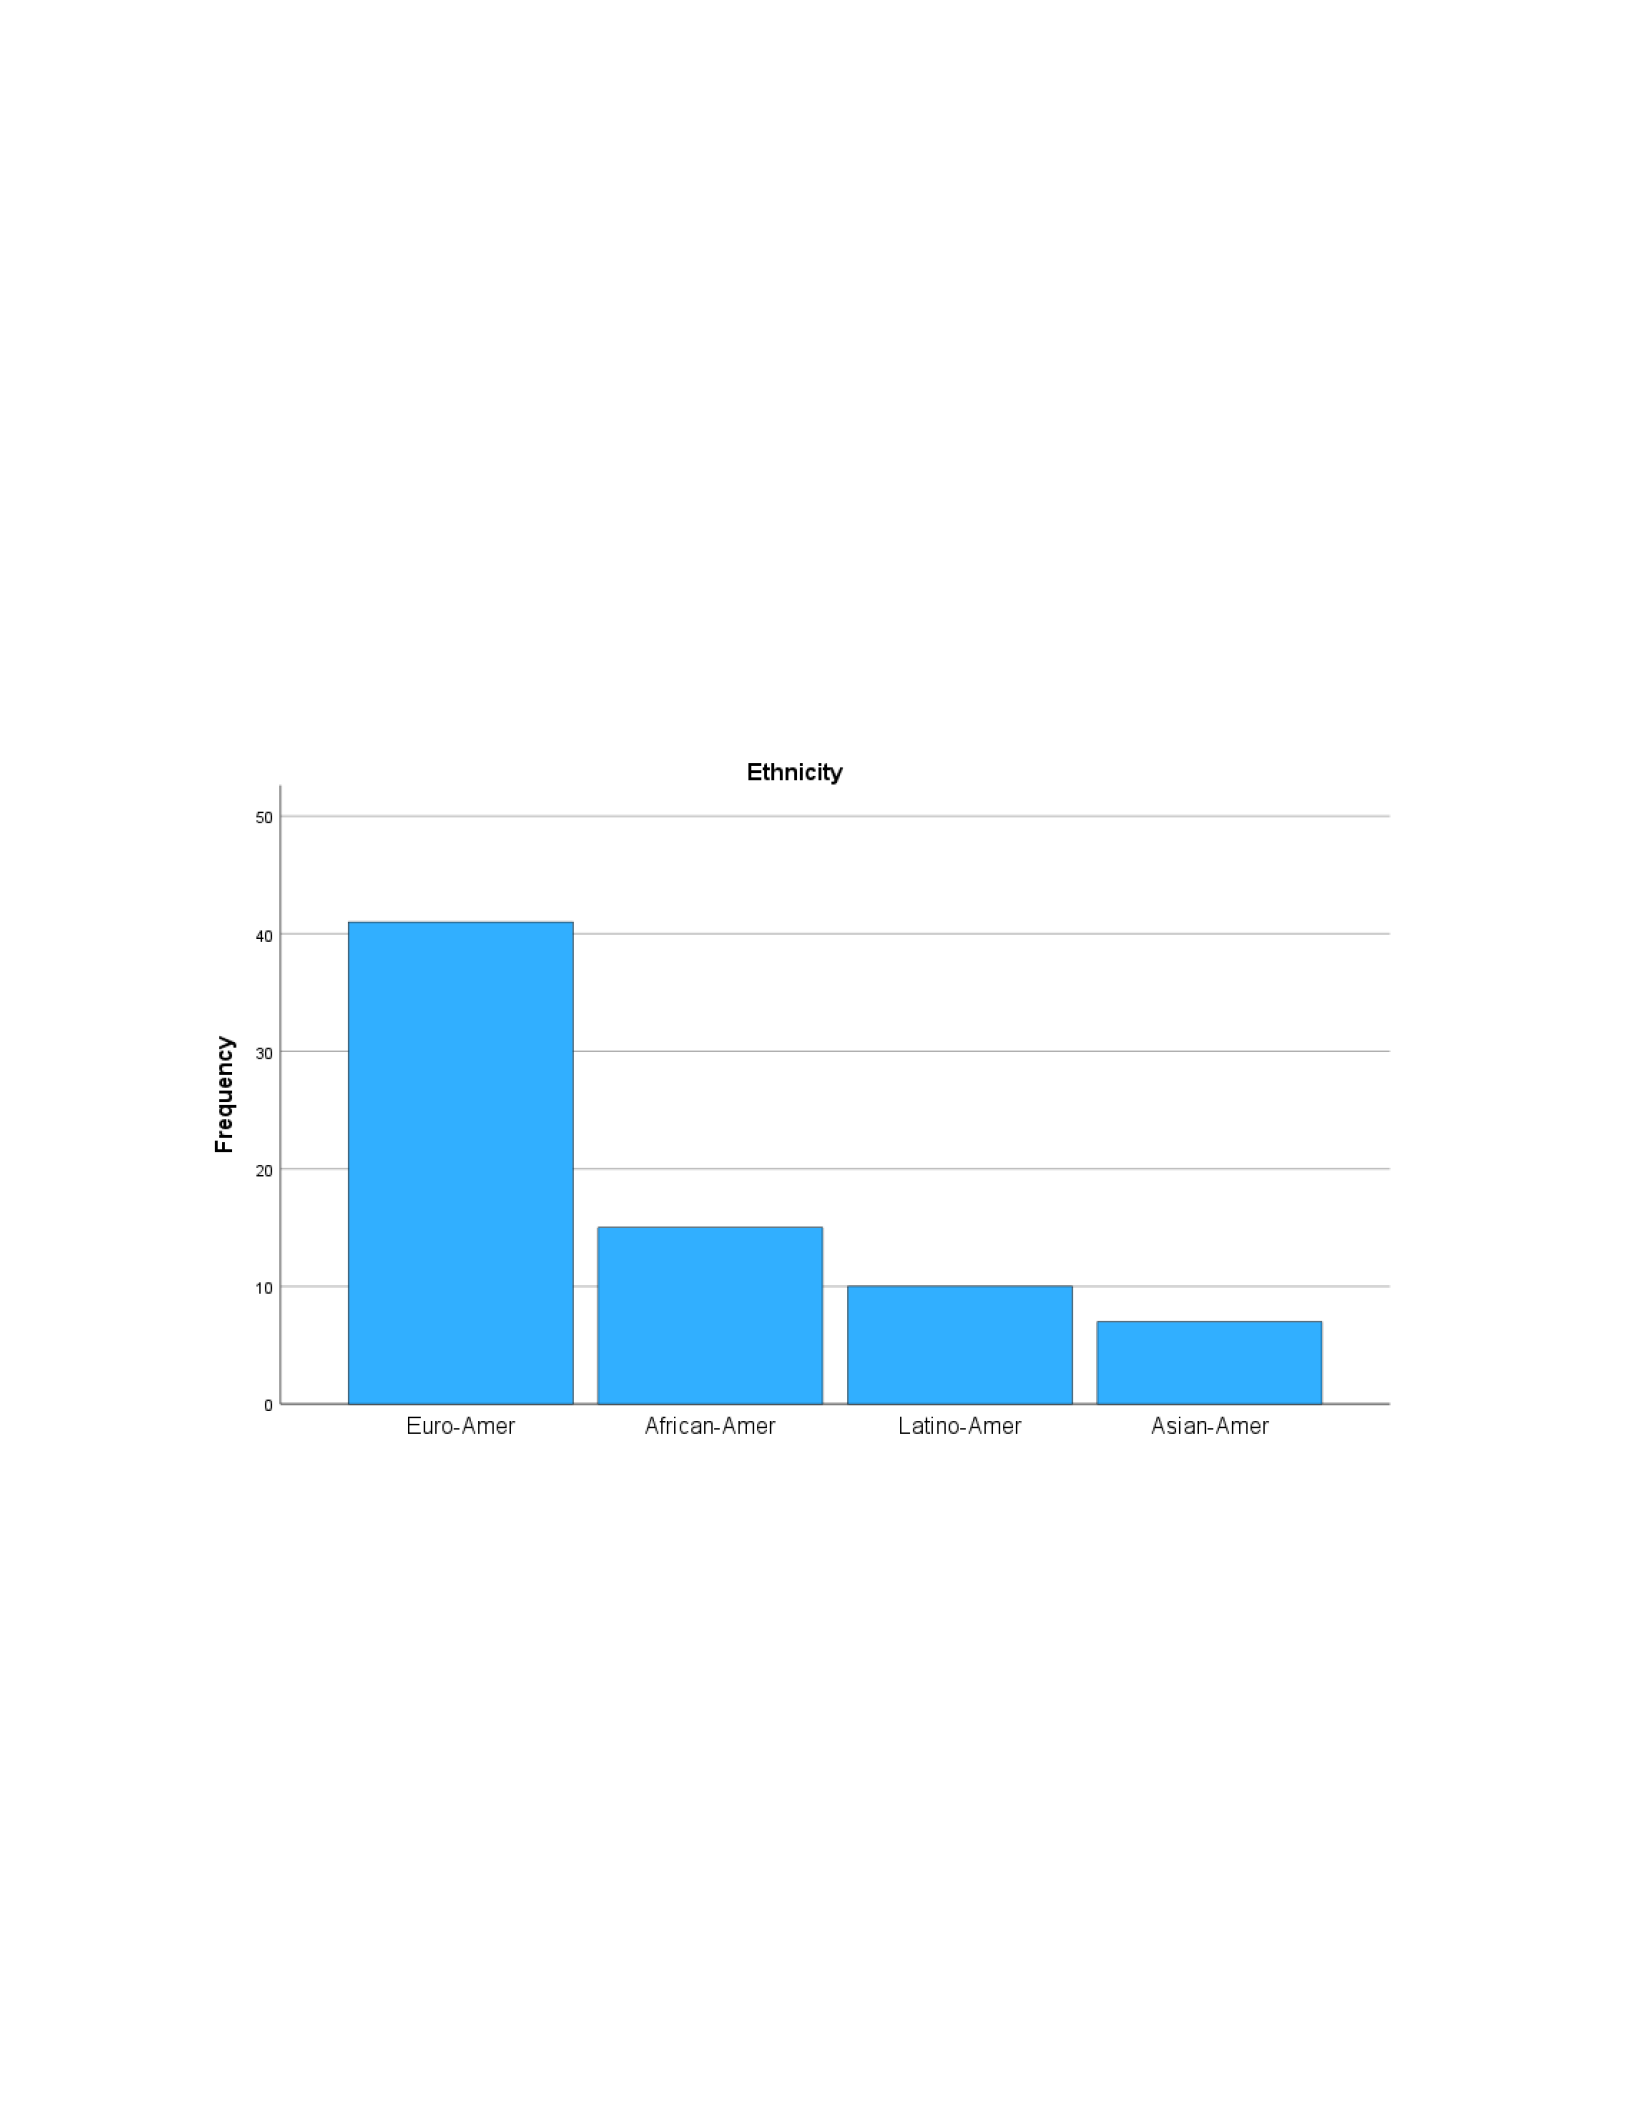
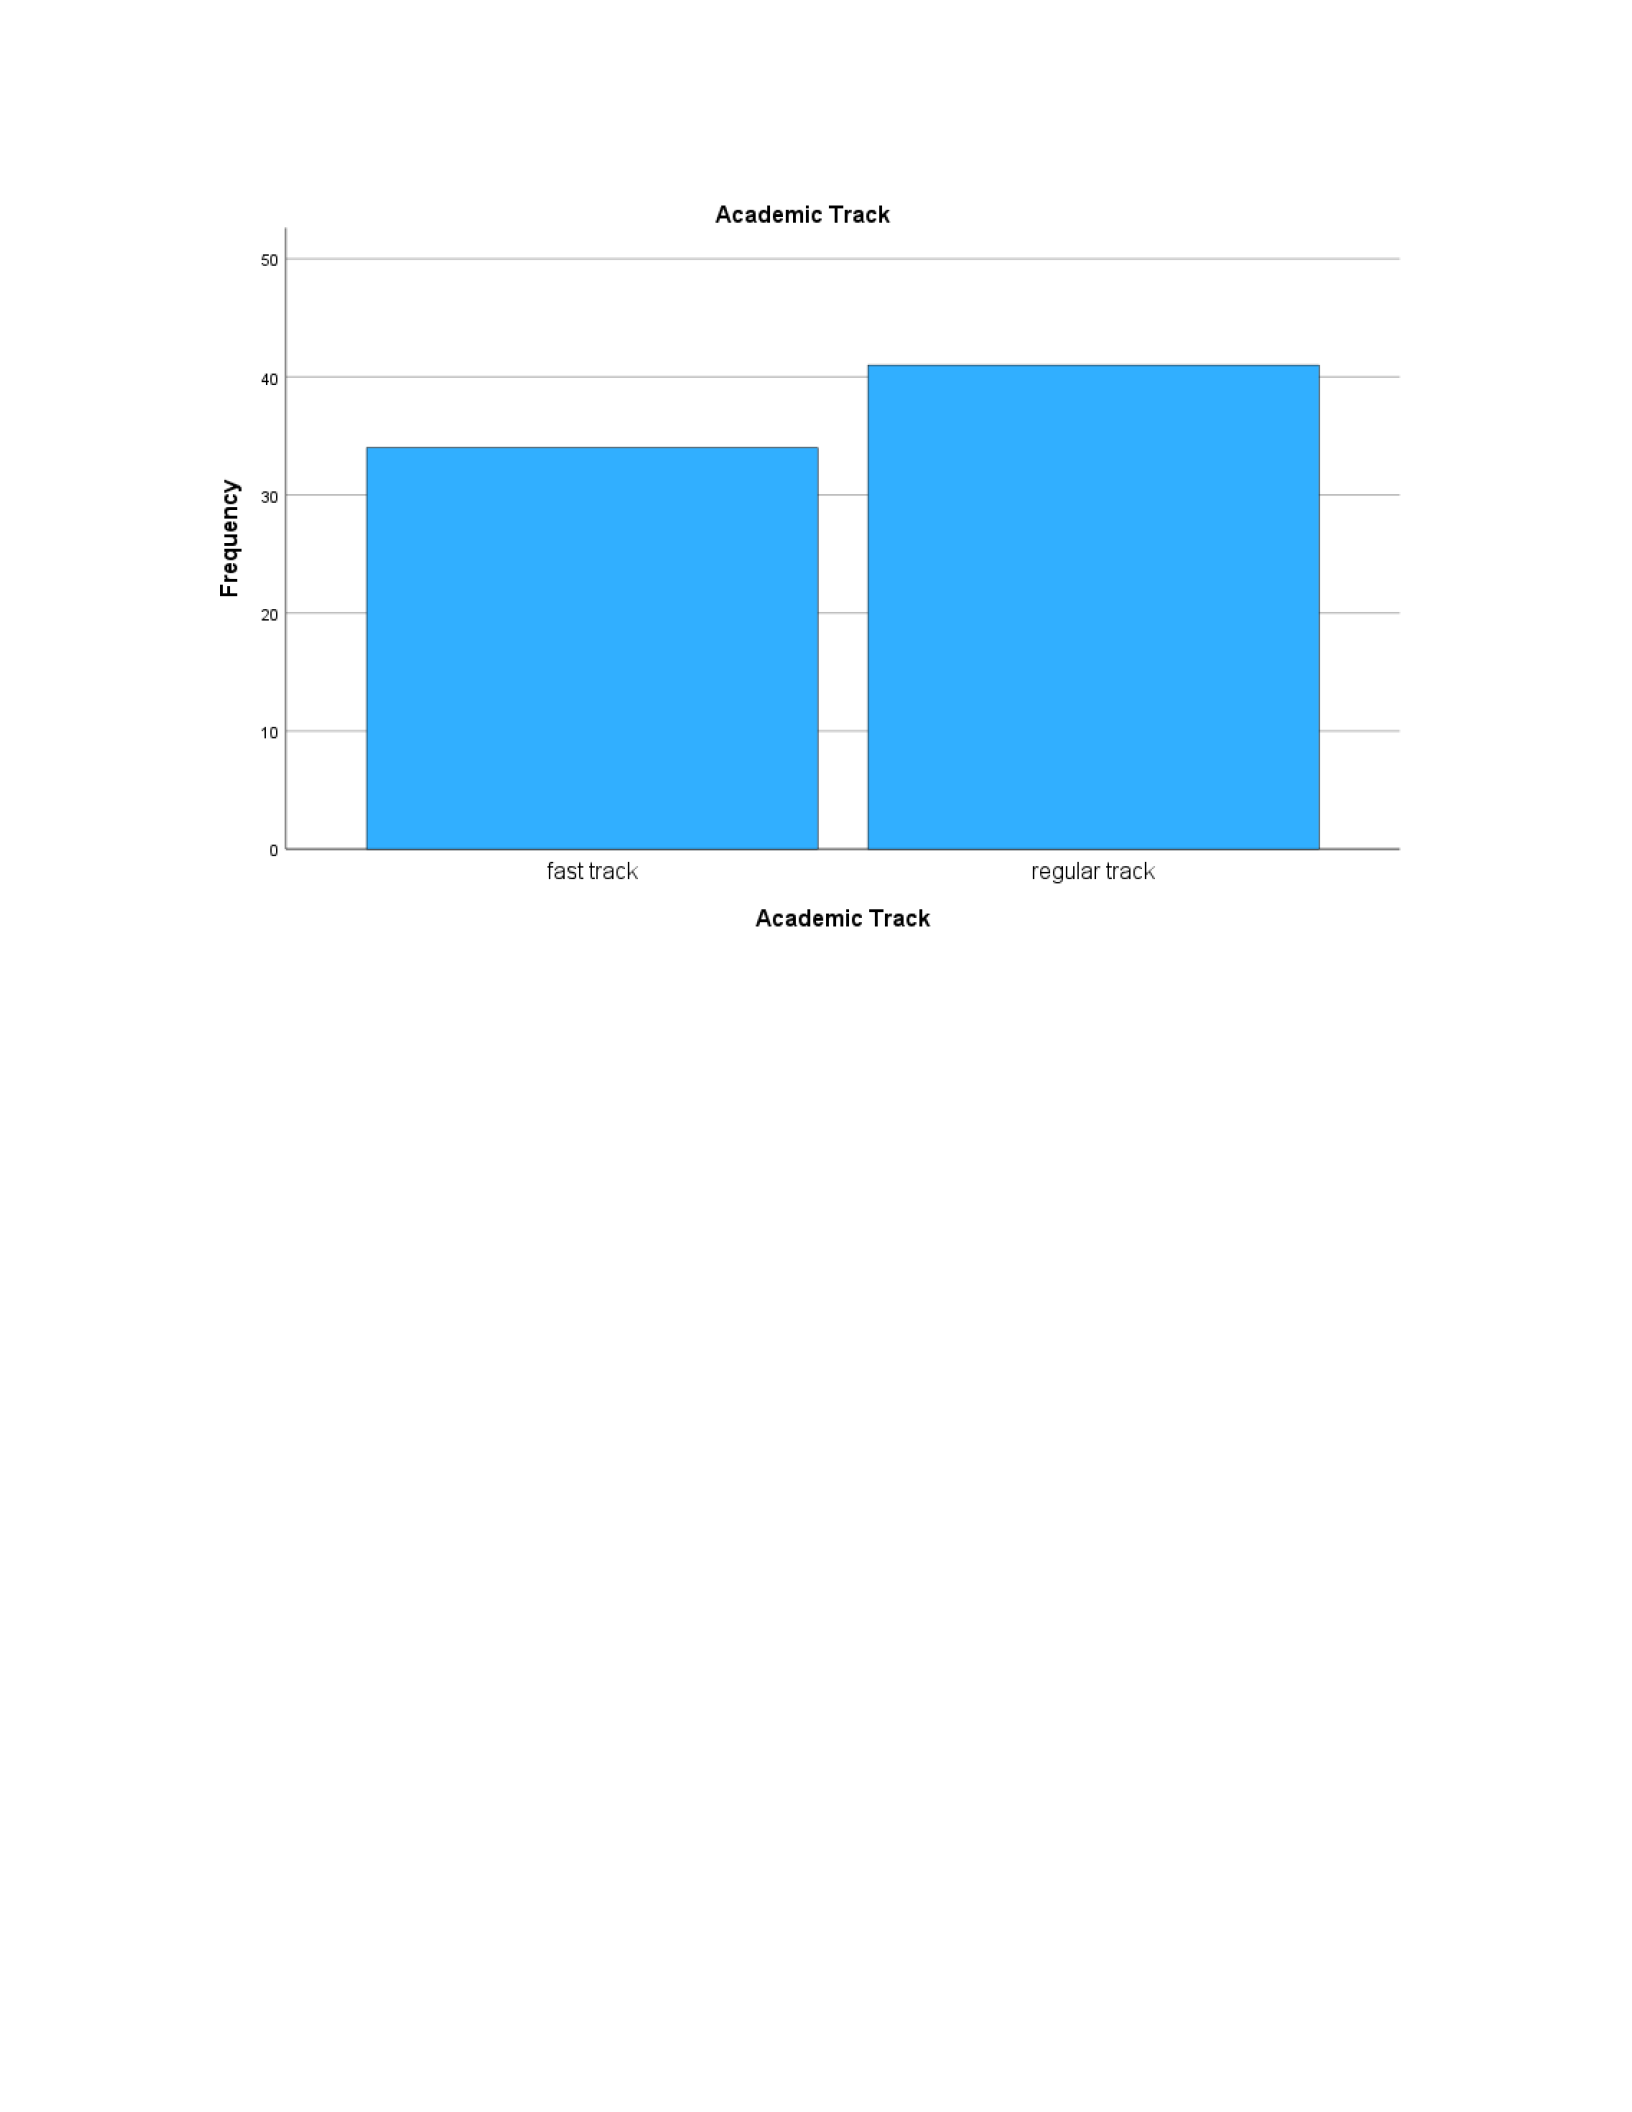
3.1. Create bar charts. Discuss why you did or did not create a bar chart for each variable.
According to Morgan et al. (2020), we use bar charts for any data that is considered nominal. In
the data we are provided we can see that the academic track and ethnicity are nominal. The term
“nominal’ is used when we are describing categories such as ethnicity or education levels, because these
variables are non-numerical. Since mother’s education, and math achievement are ordinal, we will not
create a bar chart for these variables.
Figure 1
Bar Graph- Ethnicity
Figure 2
Bar Graph- Academic Track
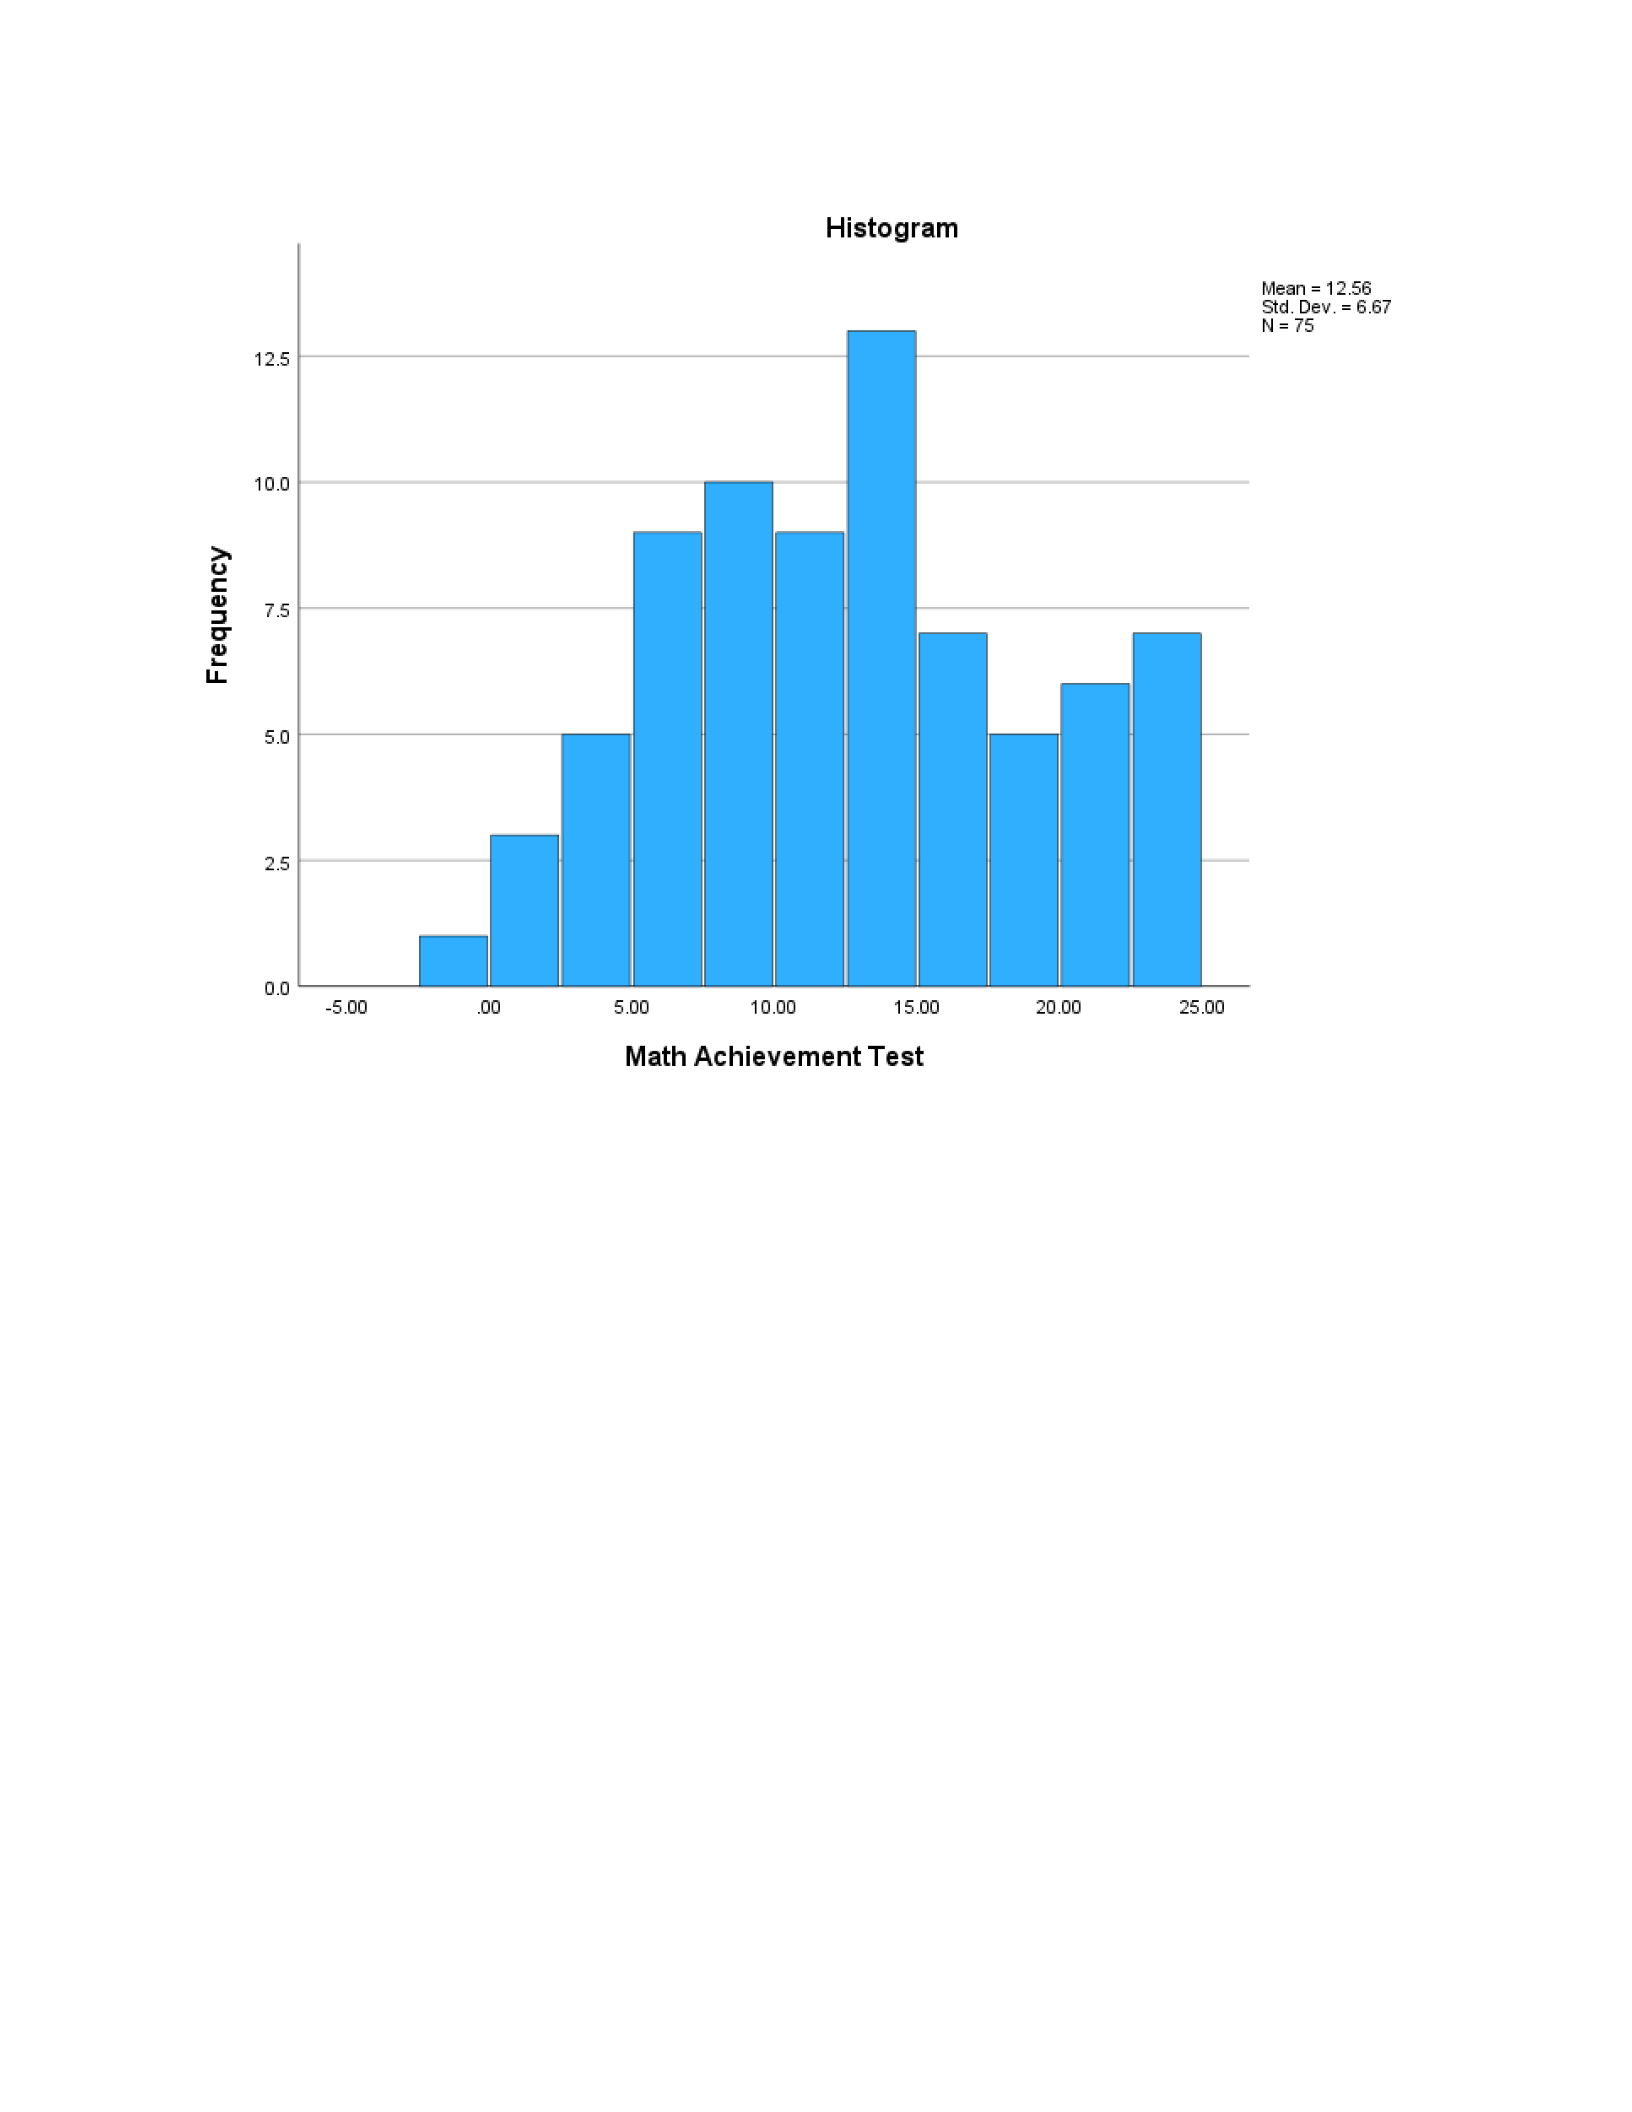
3.2. Create histograms. Discuss why you did or did not create a histogram for each variable.
Histograms are used for variables that are considered “continuous”, not nominal or dichotomous
data, but can also be used with data that is “non-continuous” as long as the “underlying variable is
conceptualized as continuous” (Morgan et al., 2020 p. 55. In our data, math achievement is the only
variable that is considered to be “continuous”, which is reason that it is the only variable with a histogram
made. Furthermore, academic track, mother’s education, and ethnicity do not appear to have underlying
factors when we conceptualize them as continuous, making them not appropriate choices for histograms.
Figure 3
Histogram- Math Achievement
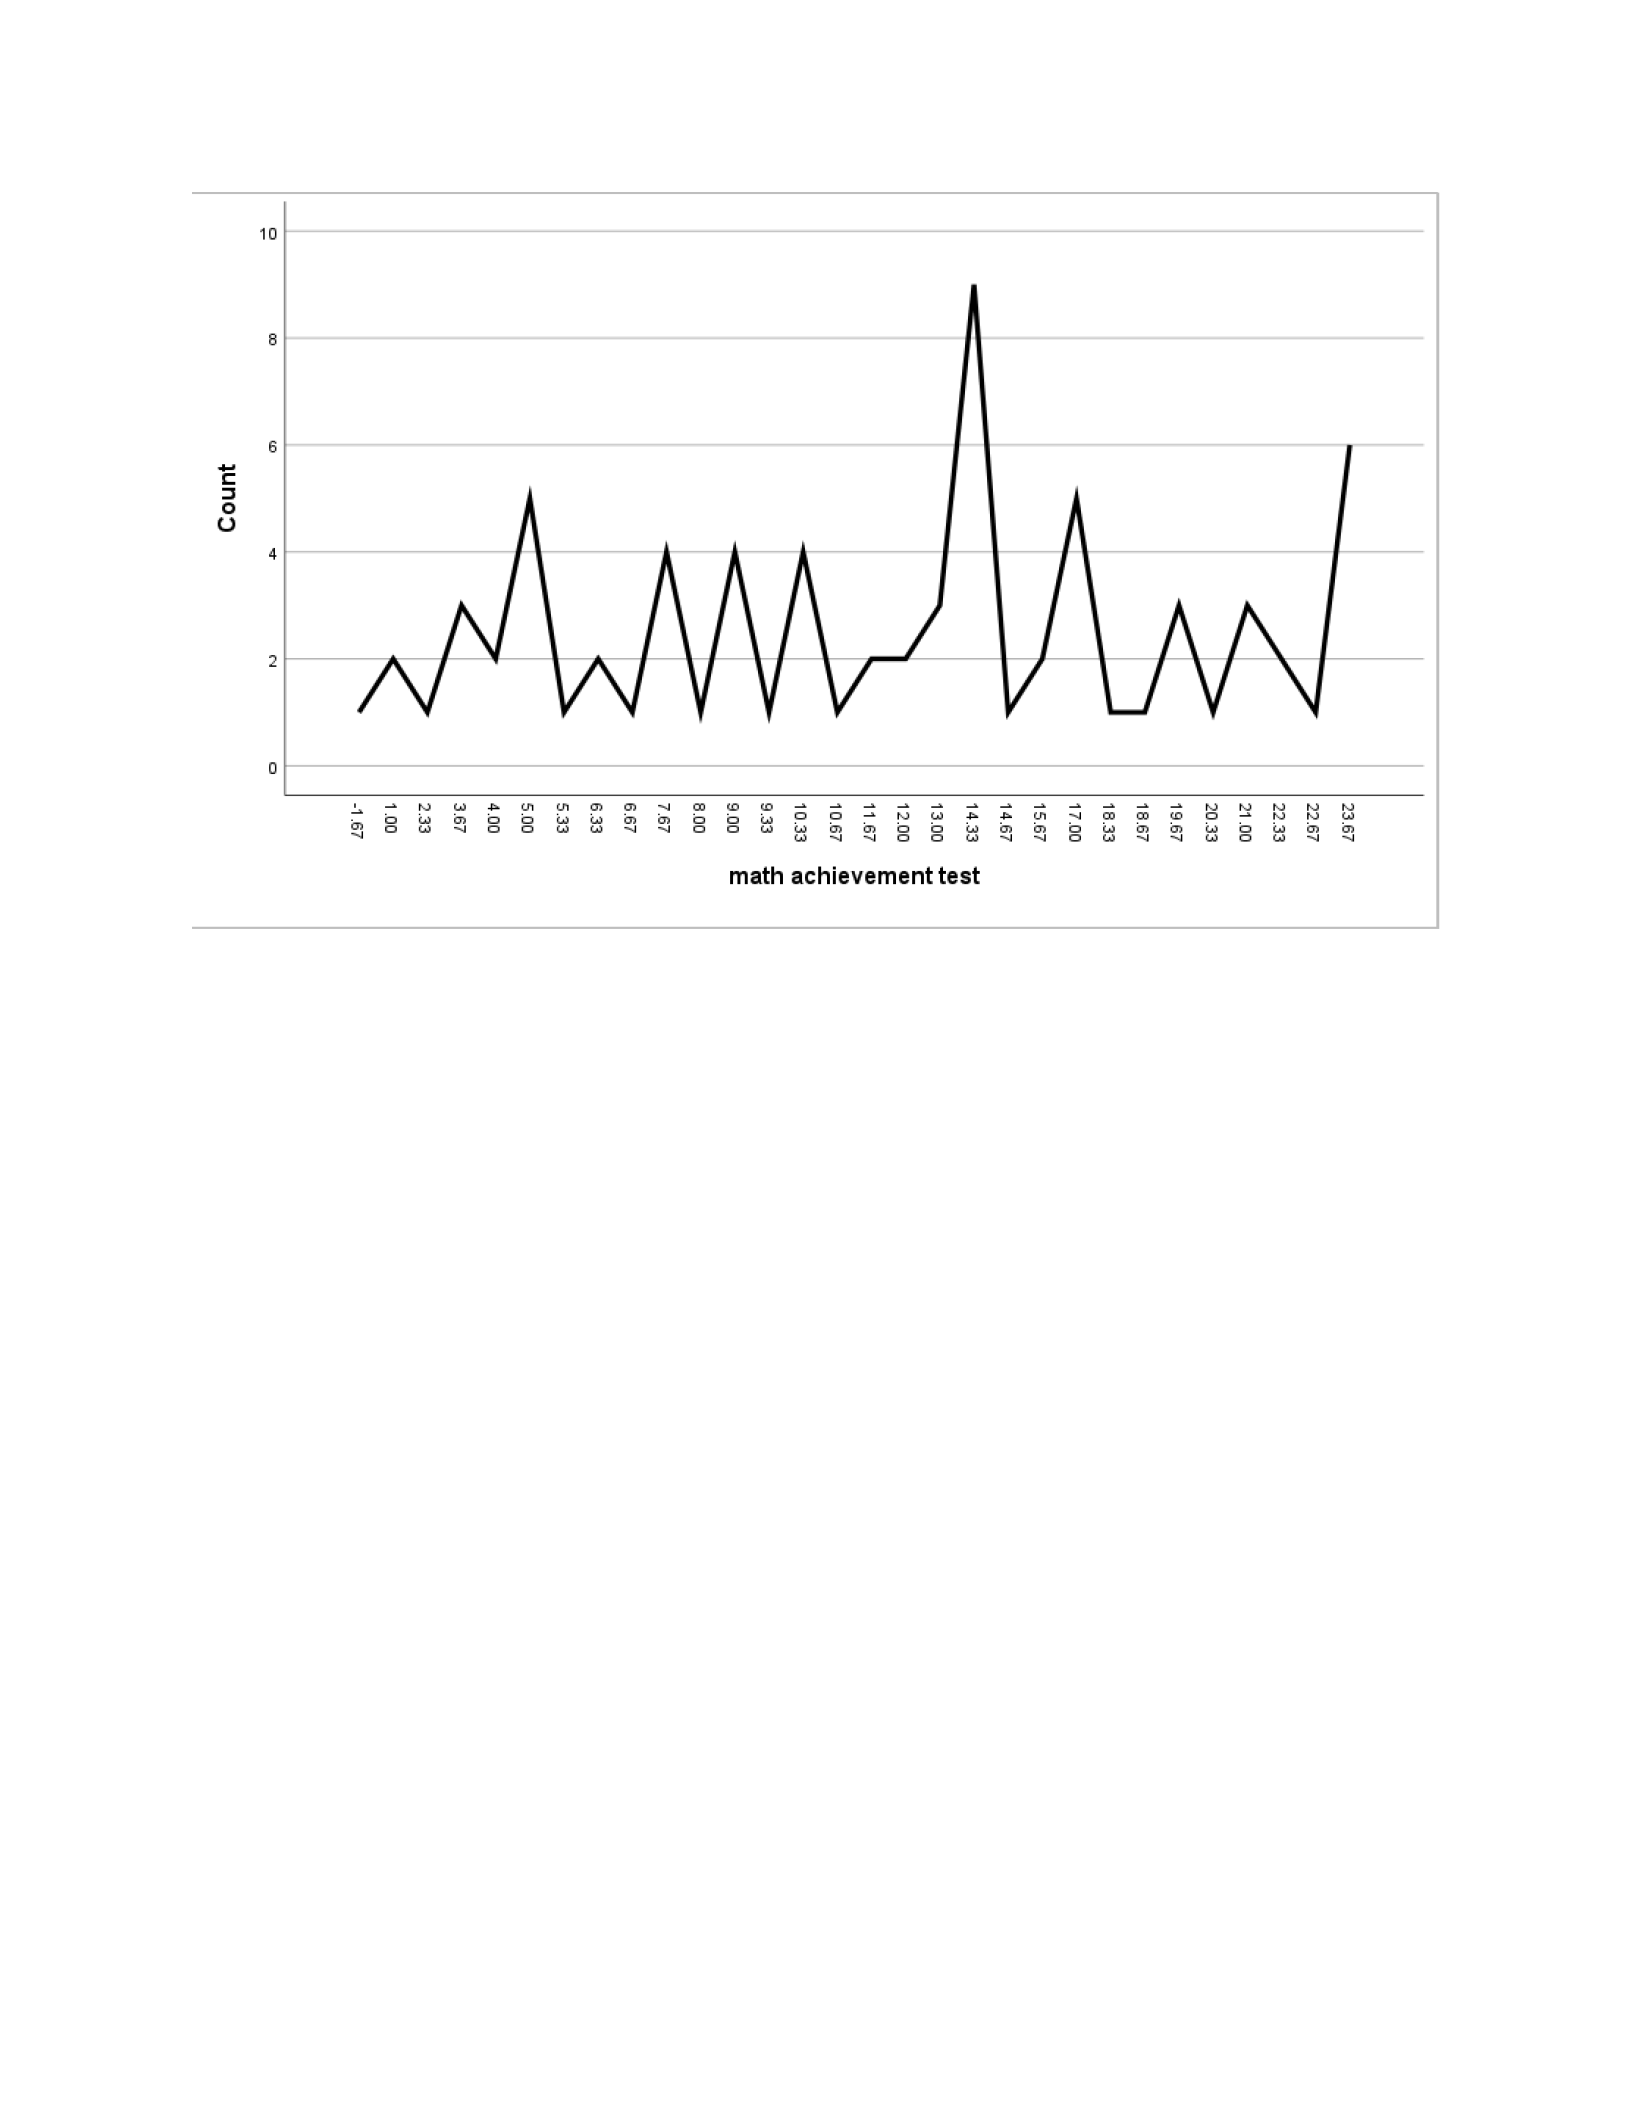
3.3. Create frequency polygons. Discuss why you did or did not create a frequency polygon for each
variable. Compare the plots in Extra SPSS Problems 3.1, 3.2, and 3.3.
According to our textbook, frequency polygons are used with normally distributed data because
the data is being shown as continuously increasing across the graph (Morgan et al., 2020). This links
points between different categories and is best used with normal data but could also be used with ordinal
data. Math achievement is the only variable that shows continuous growth across the graph.
Figure 4
Frequency Polygon- Math Achievement
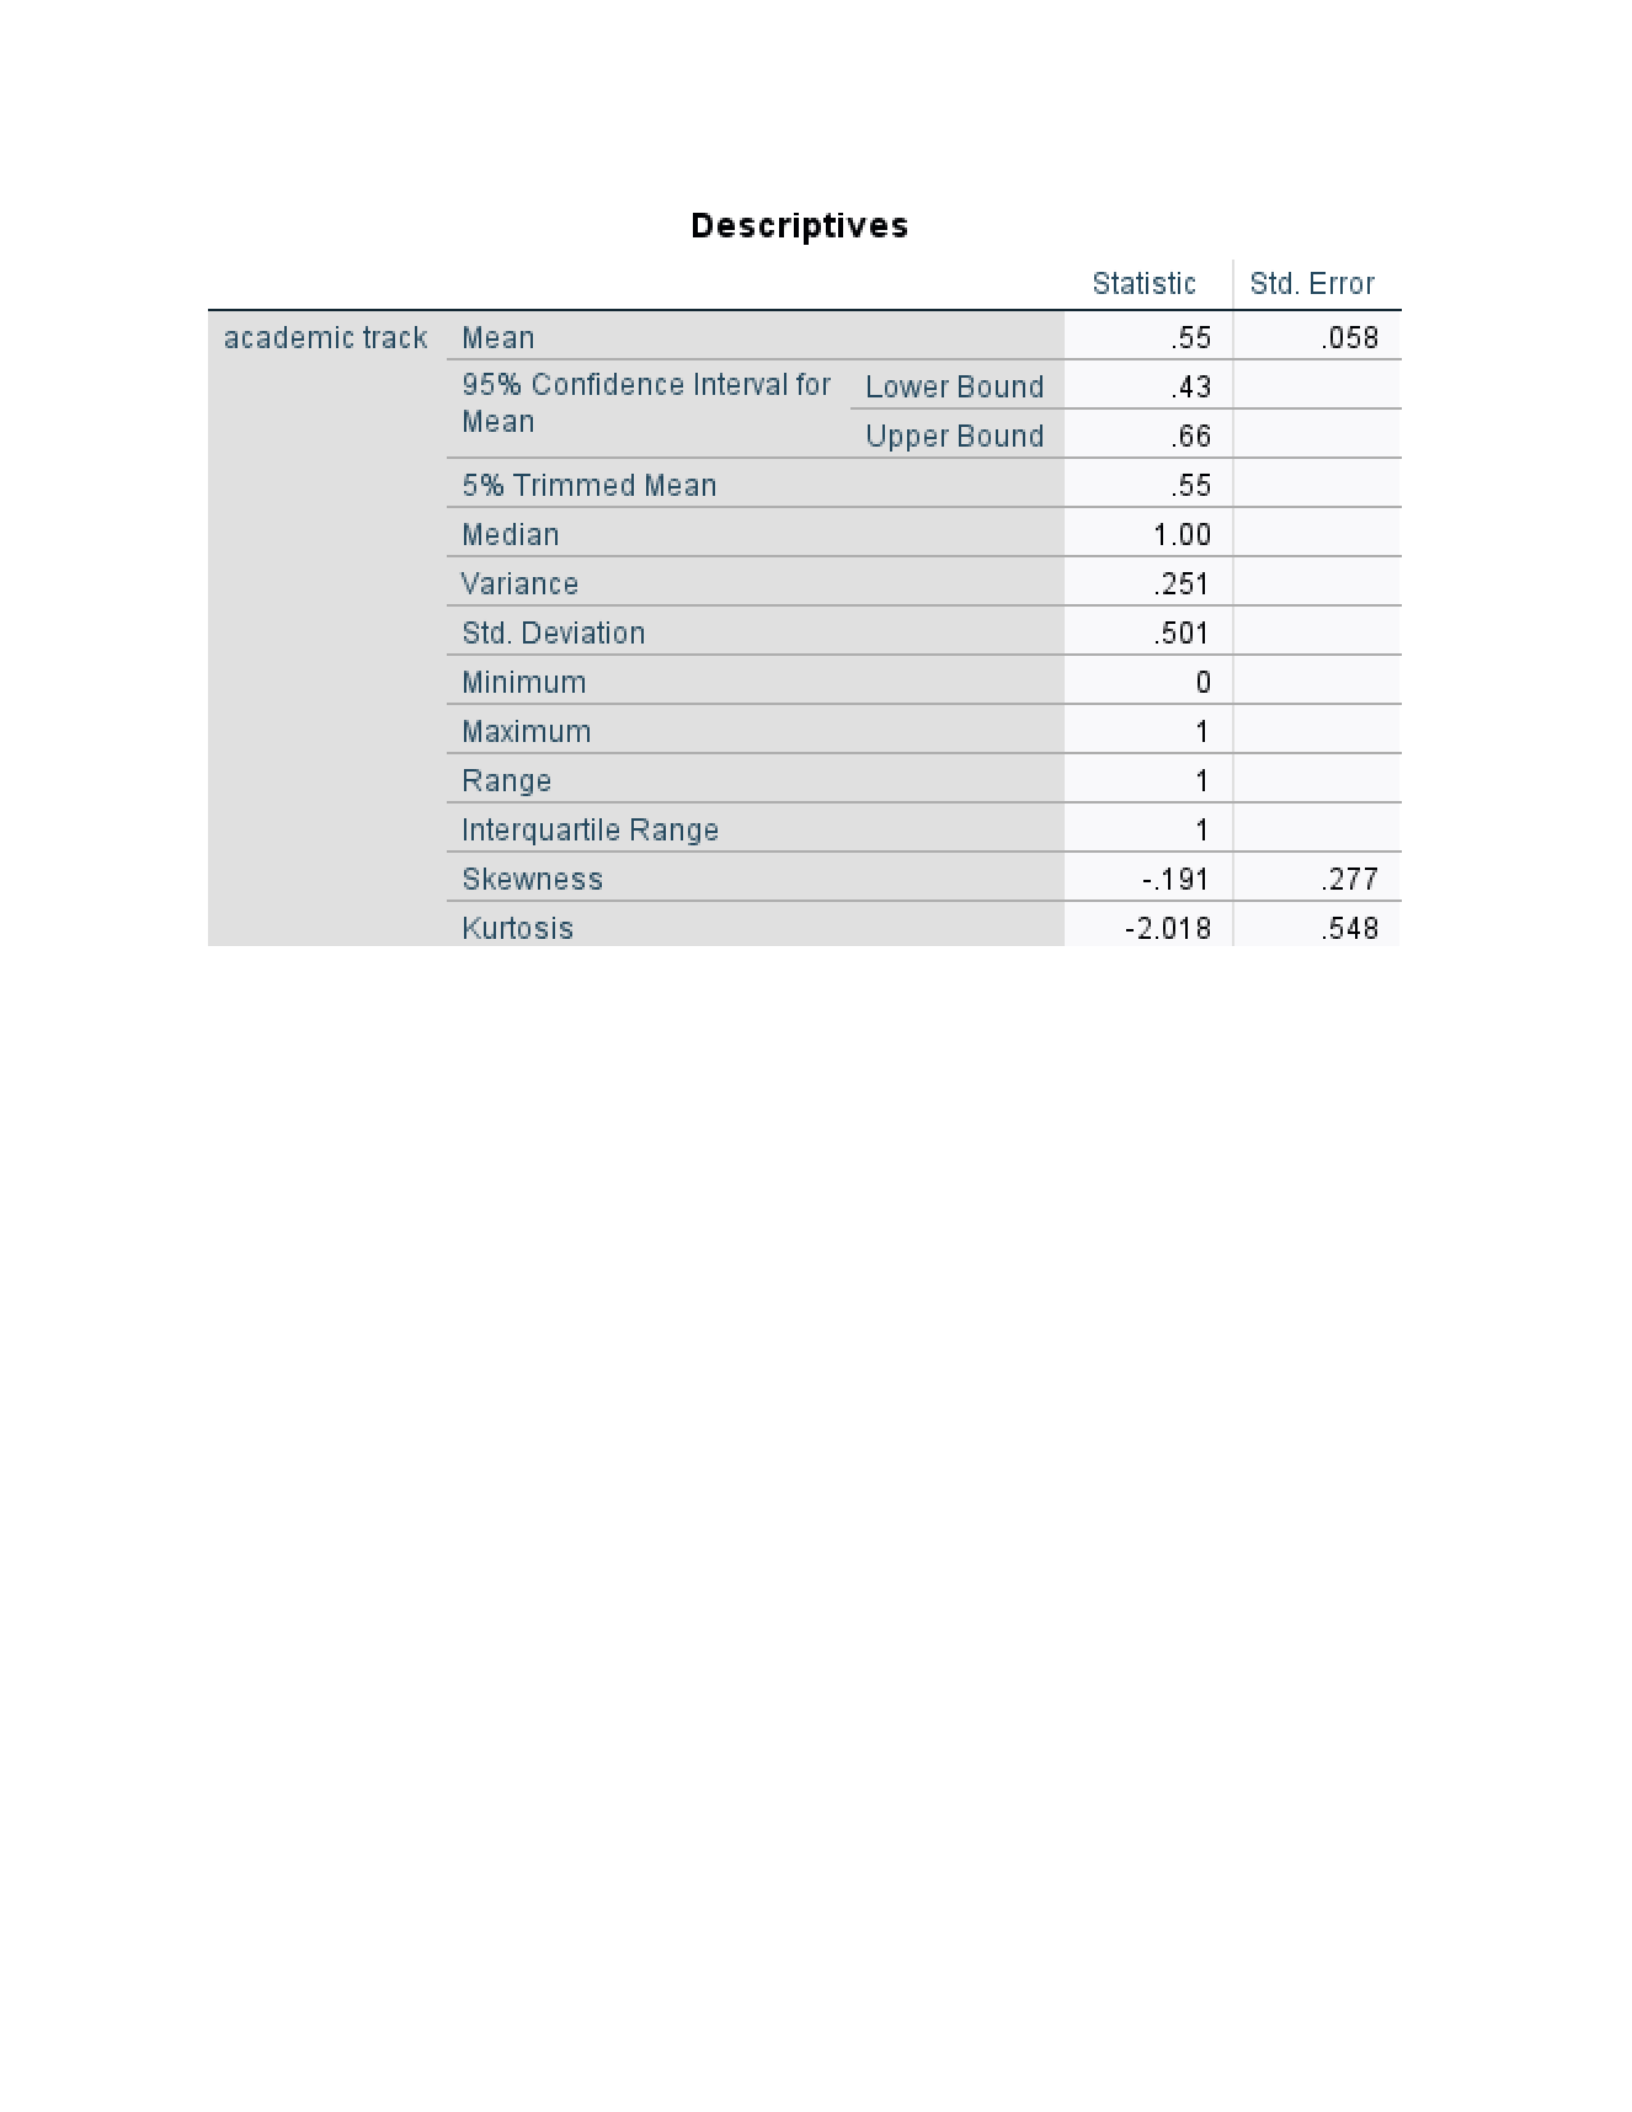
3.4. Compute the range, standard deviation, and skewness. Discuss which measures of variability
are meaningful for each of the four variables.
When pertaining to variability in range, the data does not matter for nominal variables, always
matters for dichotomous variables, to some extent matters for ordinal variables and matters for normal
variables (Morgan et al., 2020). For instance, the range for mother’s education and ethnicity do not
matter, matters for academic track and somewhat matters for math achievements. Relating to standard
deviation, data for nominal or dichotomous variables, somewhat matters for ordinal data and always
matters for variables considered normal (Morgan et al., 2020). For example, the standard deviation is
considered insignificant in the terms of mother’s education, ethnicity and academic track. Lastly, in
dealing with skewness, variables considered to be nominal or dichotomous do not matter but it does for
ordinal and nominal variables (Morgan et al., 2020). To put simply, skewness does not matter when it
comes to mother’s education, ethnicity and academic track, but does matter when it comes to math
achievements.
Figure 5
Range, Standard Deviation, & Skewness- Mother’s Education
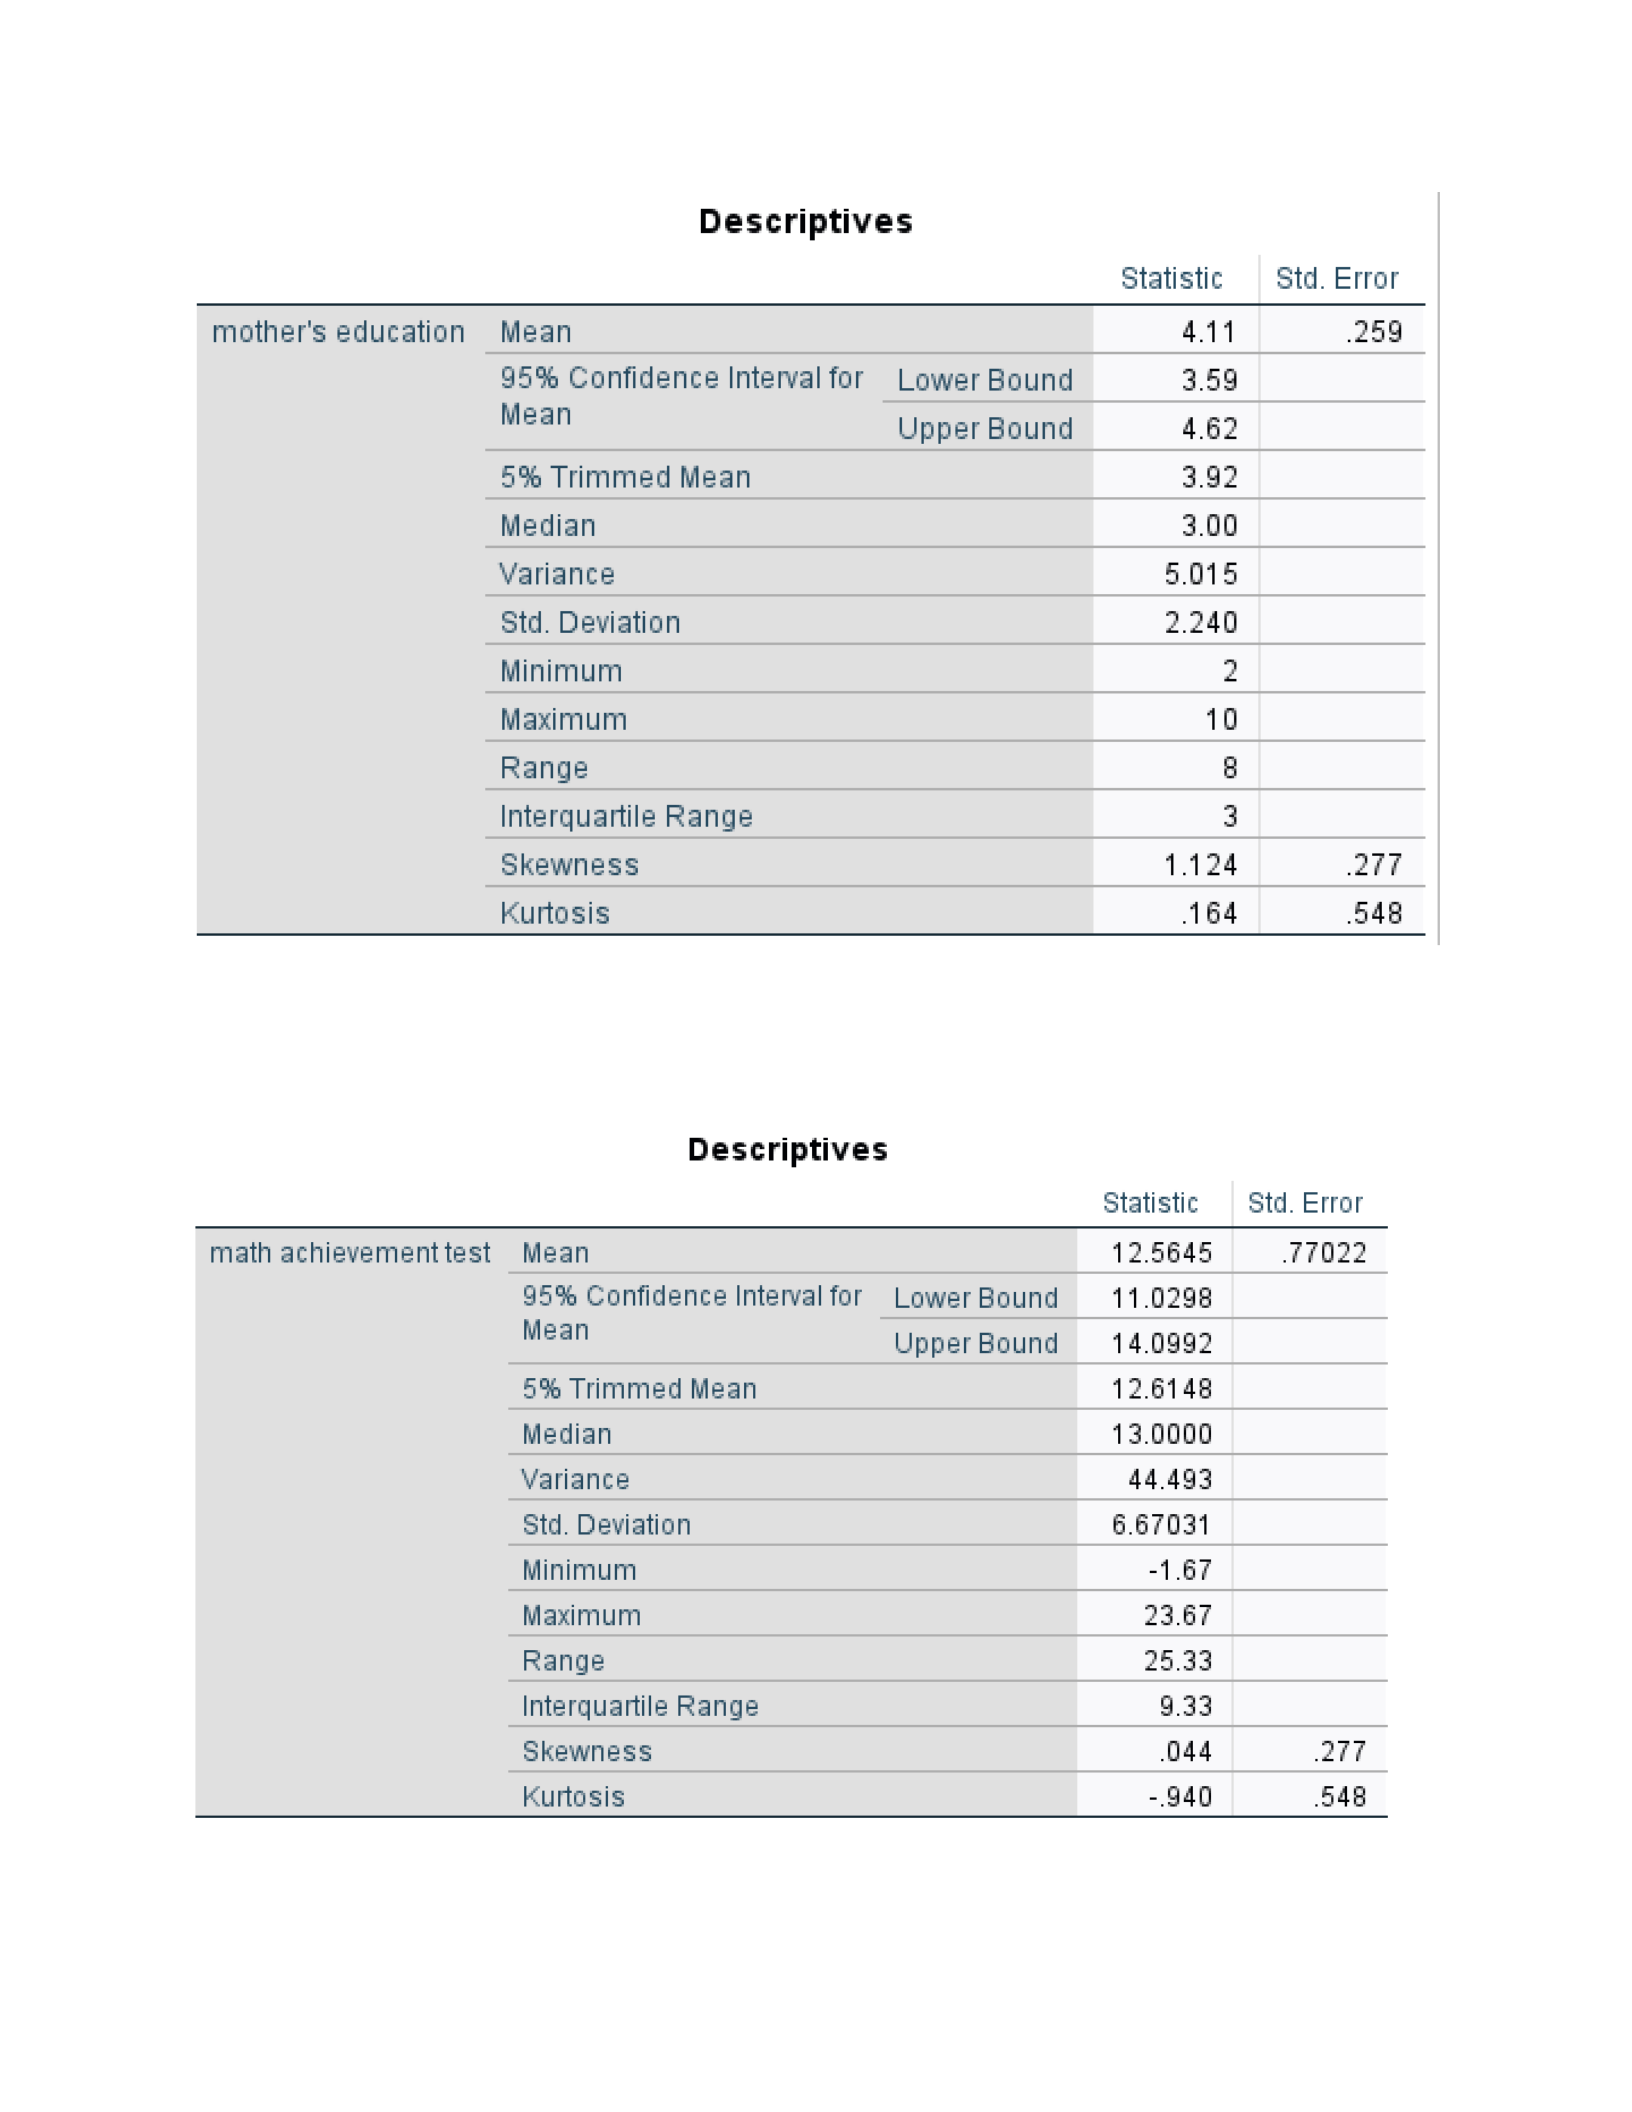
Figure 6
Range, Standard Deviation, & Skewness- Math Achievements
Figure 7
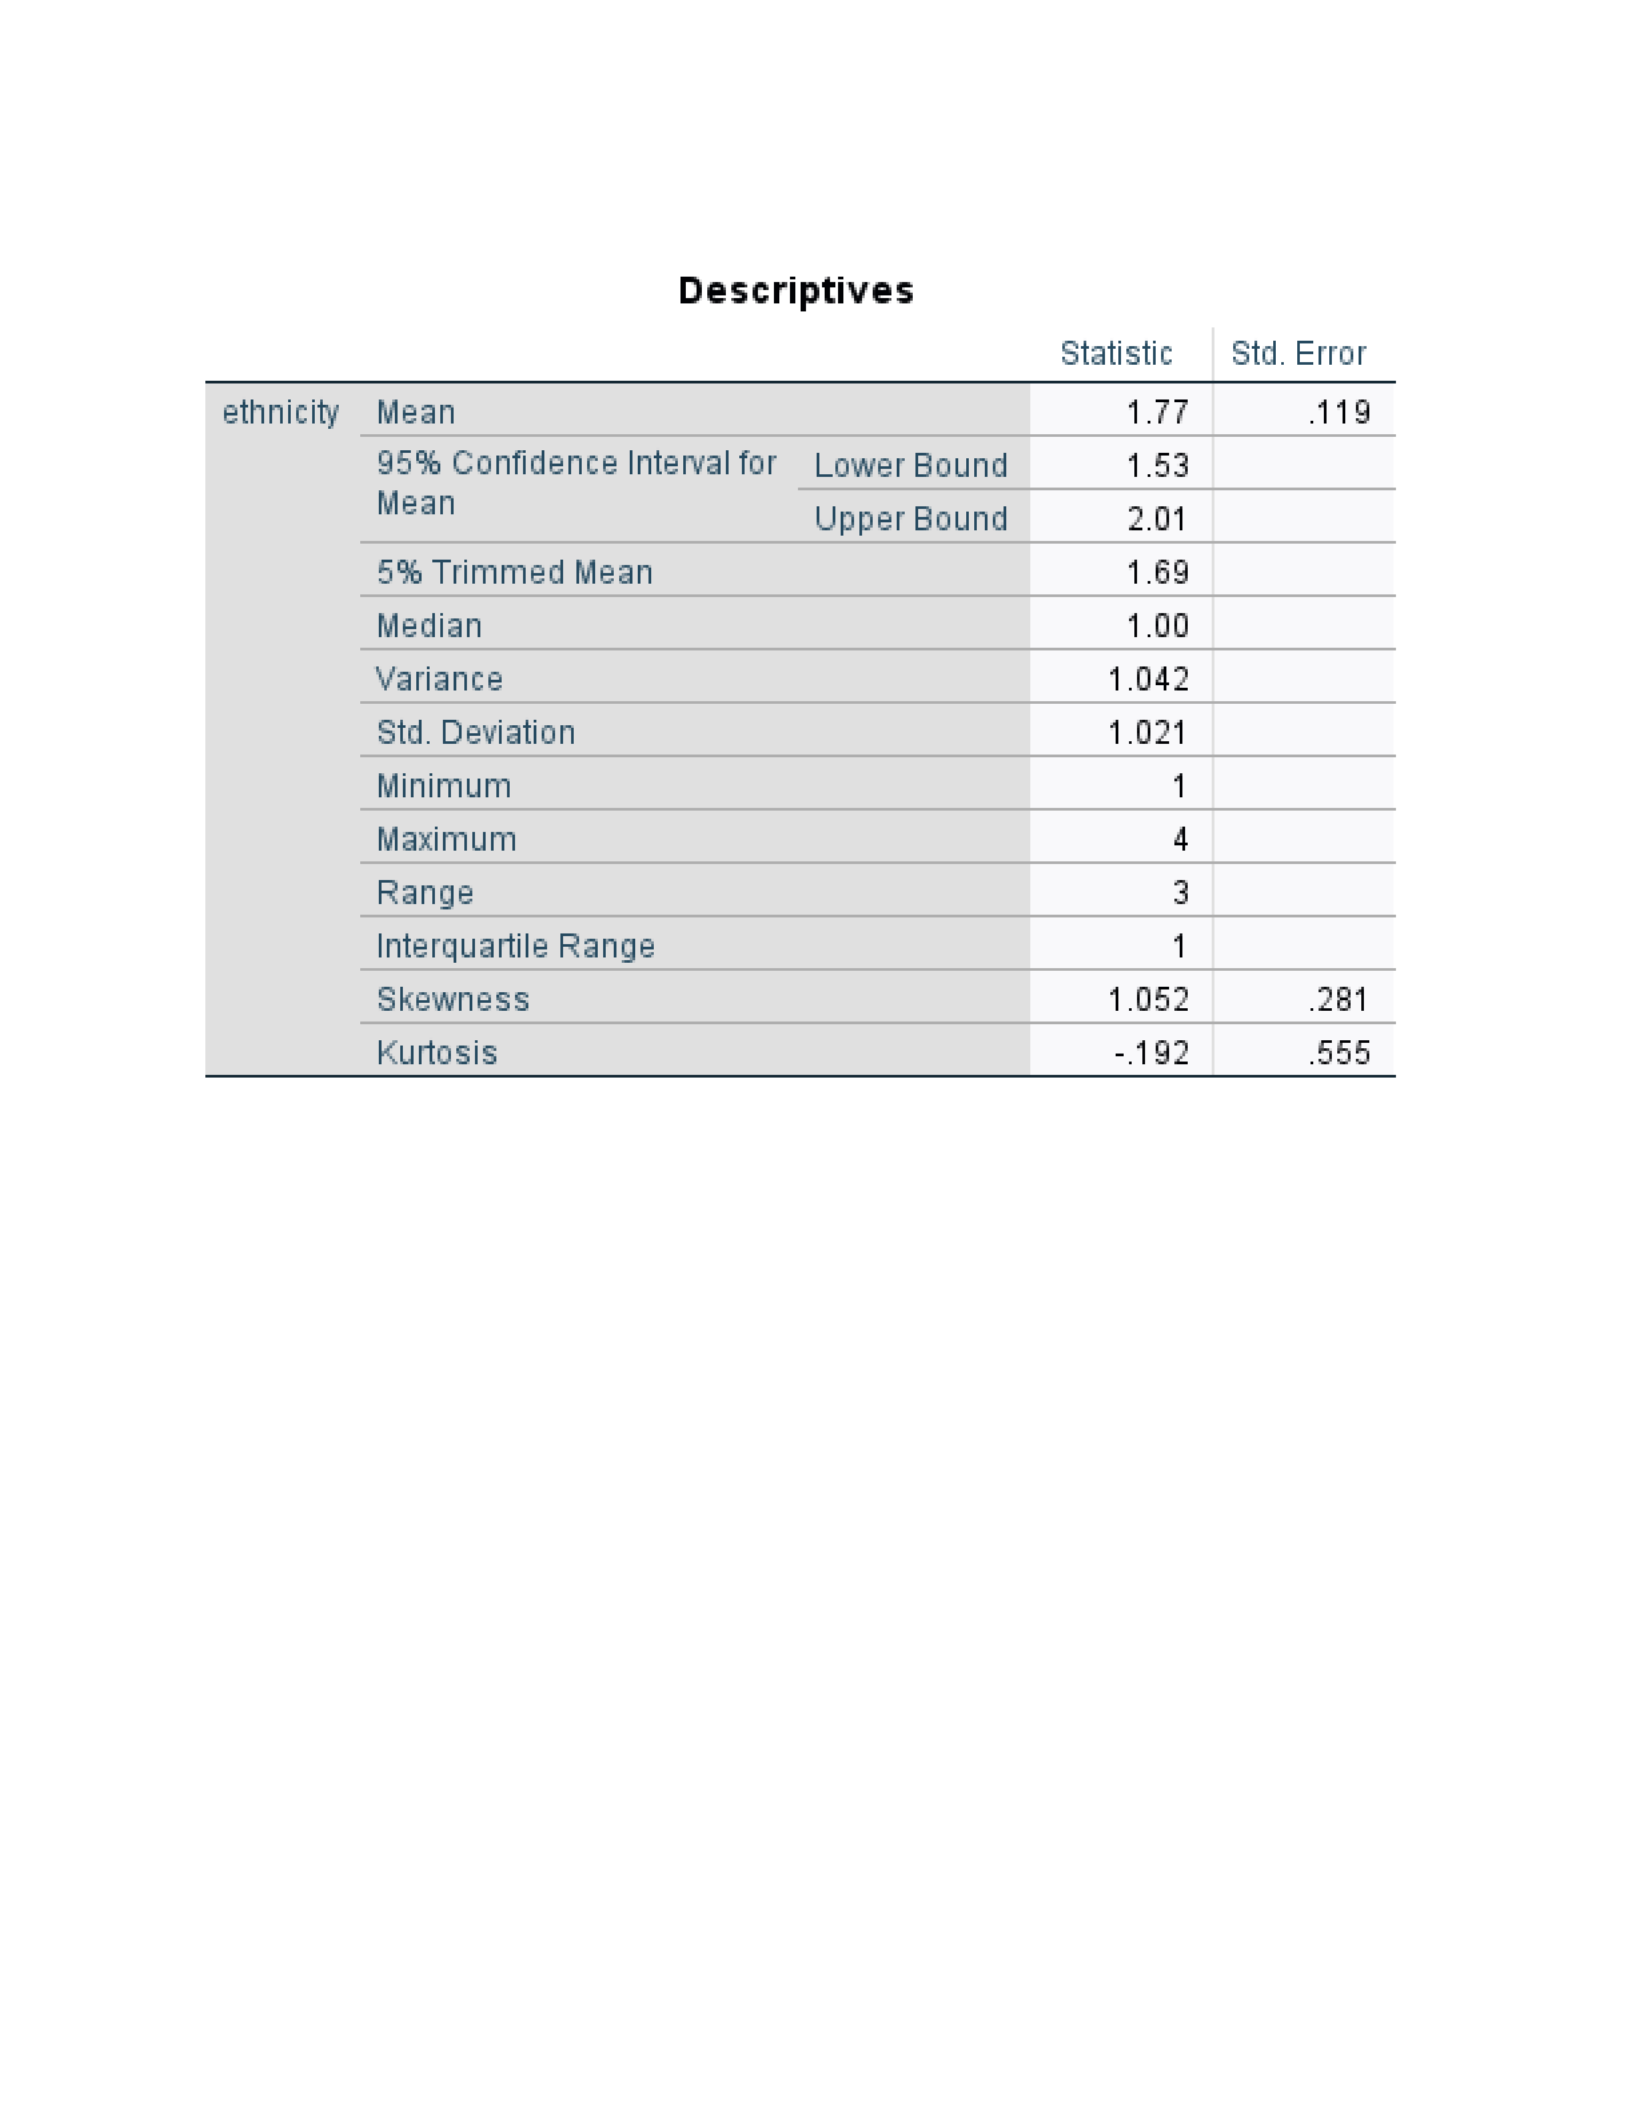
Range, Standard Deviation, & Skewness- Ethnicity
Figure 8
Range, Standard Deviation, & Skewness- Academic Track
3.5. Compute the mean, median, and mode. Discuss which measures of central tendency are
meaningful for each of the four variables.
Based on these four variables, the measures of central tendency are considered meaningful.
According to Morgan et al., the mean is not relevant when it pertains to nominal variables, slightly
relevant for dichotomous variables, somewhat relevant for any ranked ordinal variables and is relevant for
normal variables. This simply means that the mean has no significance on the mother’s education or
ethnicity, is somewhat significant for the academic track and is considered significant for the math
achievement tests.
Our textbook tells us that the median is not relevant when it comes to nominal variables,
occasionally relevant for dichotomous variables, relevant when it comes to ordinal variables and
somewhat relevant to normal variables (Morgan et al., 2020). This means that the median has no
significance on the mother’s education or ethnicity, but does have significance when it comes to the
academic track and math achievement variables.
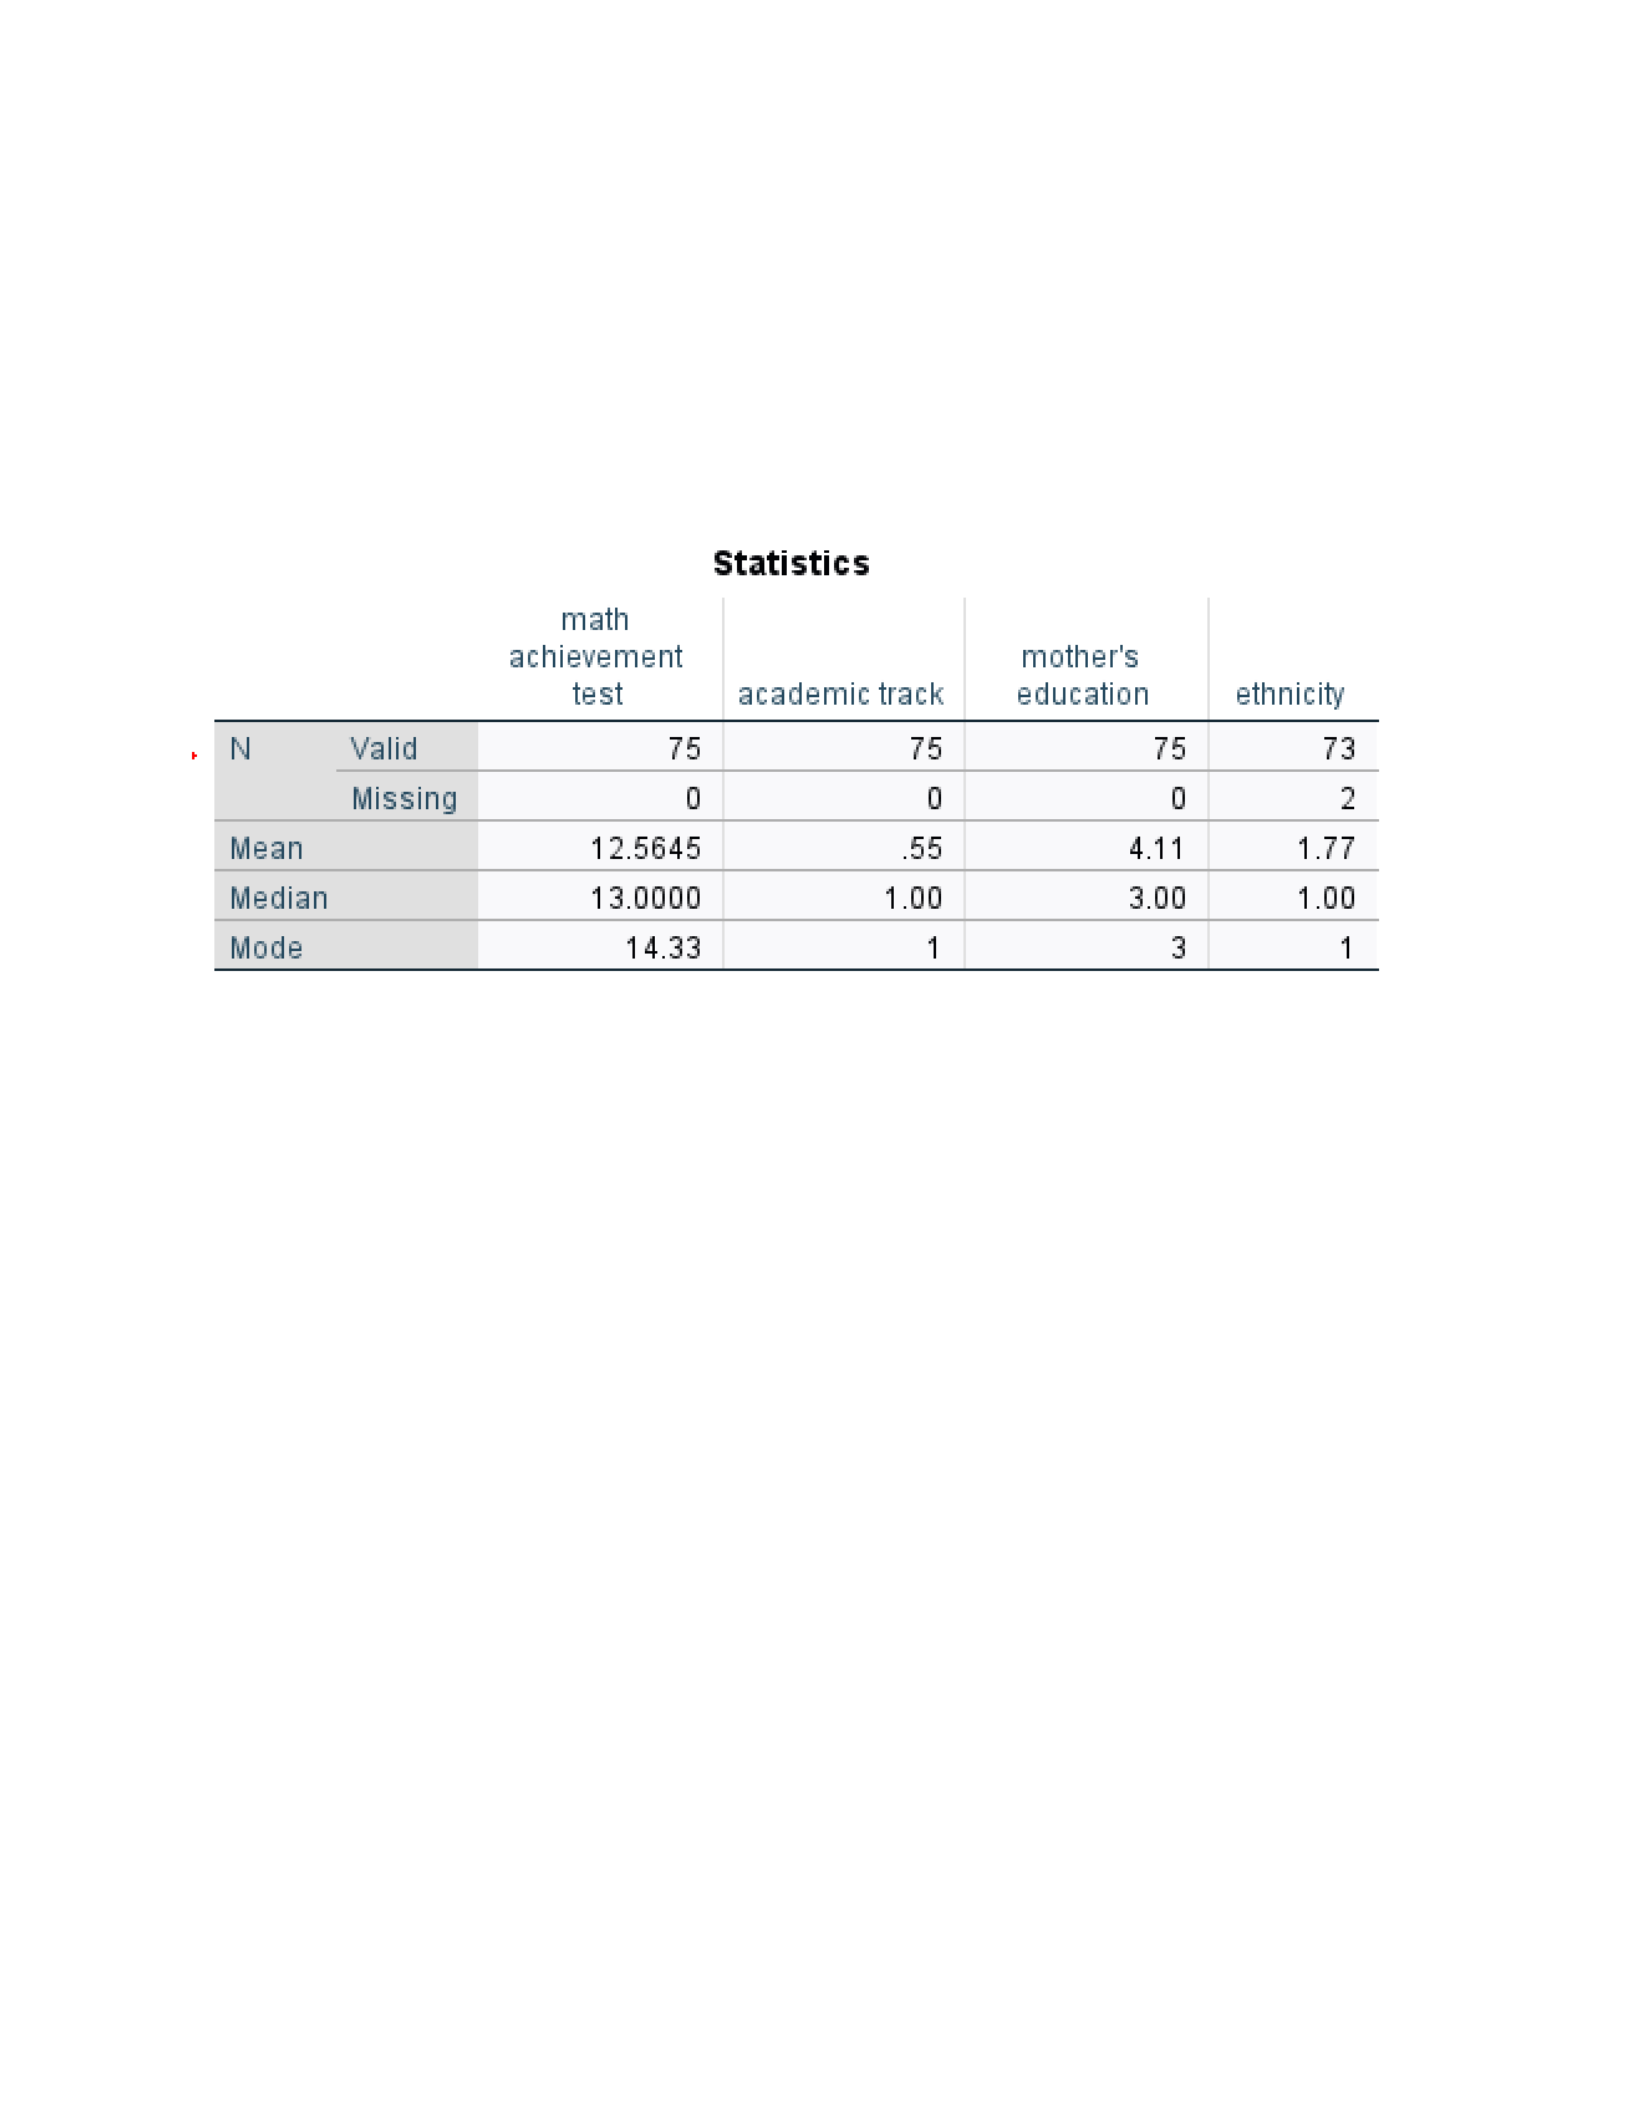
When pertaining to mode, there is significance for nominal or dichotomous variables, some
significance for ordinal or normal variables. The mode is significant for mother’s education, academic
track, and ethnicity and is slightly significant for the math achievement variable.
Figure 9
Statistics- Mean, Median, & Mode

Reference
Morgan, G. A., Barrett, K. C., Leech, N. L., & Gloeckner, G. W. (2020). IBM SPSS for
introductory statistics: Use and interpretation. Routledge.

