


Page 1 of 14
George Mason University
Department of Civil, Environmental and Infrastructure Engineering
CEIE 340 Water Resources Engineering
May 14th, 2014
FINAL EXAM
Name:_____________________________________________ Date: _____________________
Signature:_____________________________________________________________________
* This exam is closed book and closed notes. No computer or cell phones are allowed. The use of
calculator is permitted.
______________________________________________________________________________
Part 1) Concepts and theory (each question 3pts, total 30pts)
Indicate whether each statement below is TRUE or FALSE:
[ ] The D-8 algorithm is commonly used to determine flow direction and automatically
delineate watersheds. Its procedure is based on the calculation of the direction of steepest descent
from each neighboring cell from a DEM.
[ ] Based on a Flow Accumulation raster cell value, we can directly determine the upstream
drainage area by multiplying its value by the raster pixel area.
[ ] Basic assumptions of the unit hydrograph method are that: 1) Rainfall excess of equal
durations are assumed to produce hydrographs with equivalent time base regardless of the
intensity of the rain; and 2) Direct runoff ordinates for a storm of given duration are assumed
directly proportional to rainfall excess volumes. Thus, twice the rainfall produces doubling of
hydrographs ordinates.
[ ] The Green-Ampt method is developed to calculate evapotranspiration considering the
land-use cover.
[ ] Low Impact Development (LID) strategies are designed to reduce the impact of land use
change on watershed runoff and water quality. A typical example can be the National Flood
Insurance Program.

CEIE 340 – Final exam
Page 2 of 14
[ ] IDF curves are developed based on statistical analyses of rainfall records and are
available based on a specific region of interest.
[ ] The main objective of flood routing methods in hydrologic analyses is to calculate the
movement of the flood wave in reservoirs or channels associated with change in time and
attenuation.
[ ] The HEC-HMS model is designed to calculate hydraulics of open channel flow.
[ ] The Unit Hydrograph can be designed either based on recorded stream flow or based on
empirical methods such as the Bulletin 17B and the Snyder.
[ ] Methods for calculating runoff based on rainfall and watershed characteristics are
especially useful in engineering projects where there is no gaged record of stream flow.
Part II) Methods and applications (60pts)
1) [10 pts] Determine the soil infiltration capacity using the Horton Equation given that the soil
initial infiltration rate is equal to 3.5 in/hr and the final capacity is 0.6 in/hr for the following
times: t=10 min, 15 min, 30 min, 1hr, 2 hr, and 6 hr. You may assume a time constant k =
0.32/hr.

CEIE 340 – Final exam
Page 3 of 14
2) [10 pts] Using the Rational method, calculate the runoff discharge of a property (600 m x
1200 m) where 40% of the land cover is industrial and 60% is forest and slope of 3%. The design
requires a 10 year return period and duration of 1 hour.
3) [10pts] Given the following moments calculated from an annual peak flow record, calculate:
Mean: 7,650 (cfs)
Mean of Log 10 data: 4.70
Standard Deviation: 2143 (cfs)
Standard deviation of Log 10 data: 0.213
Weighted Skewness of Log 10 data: -0.4
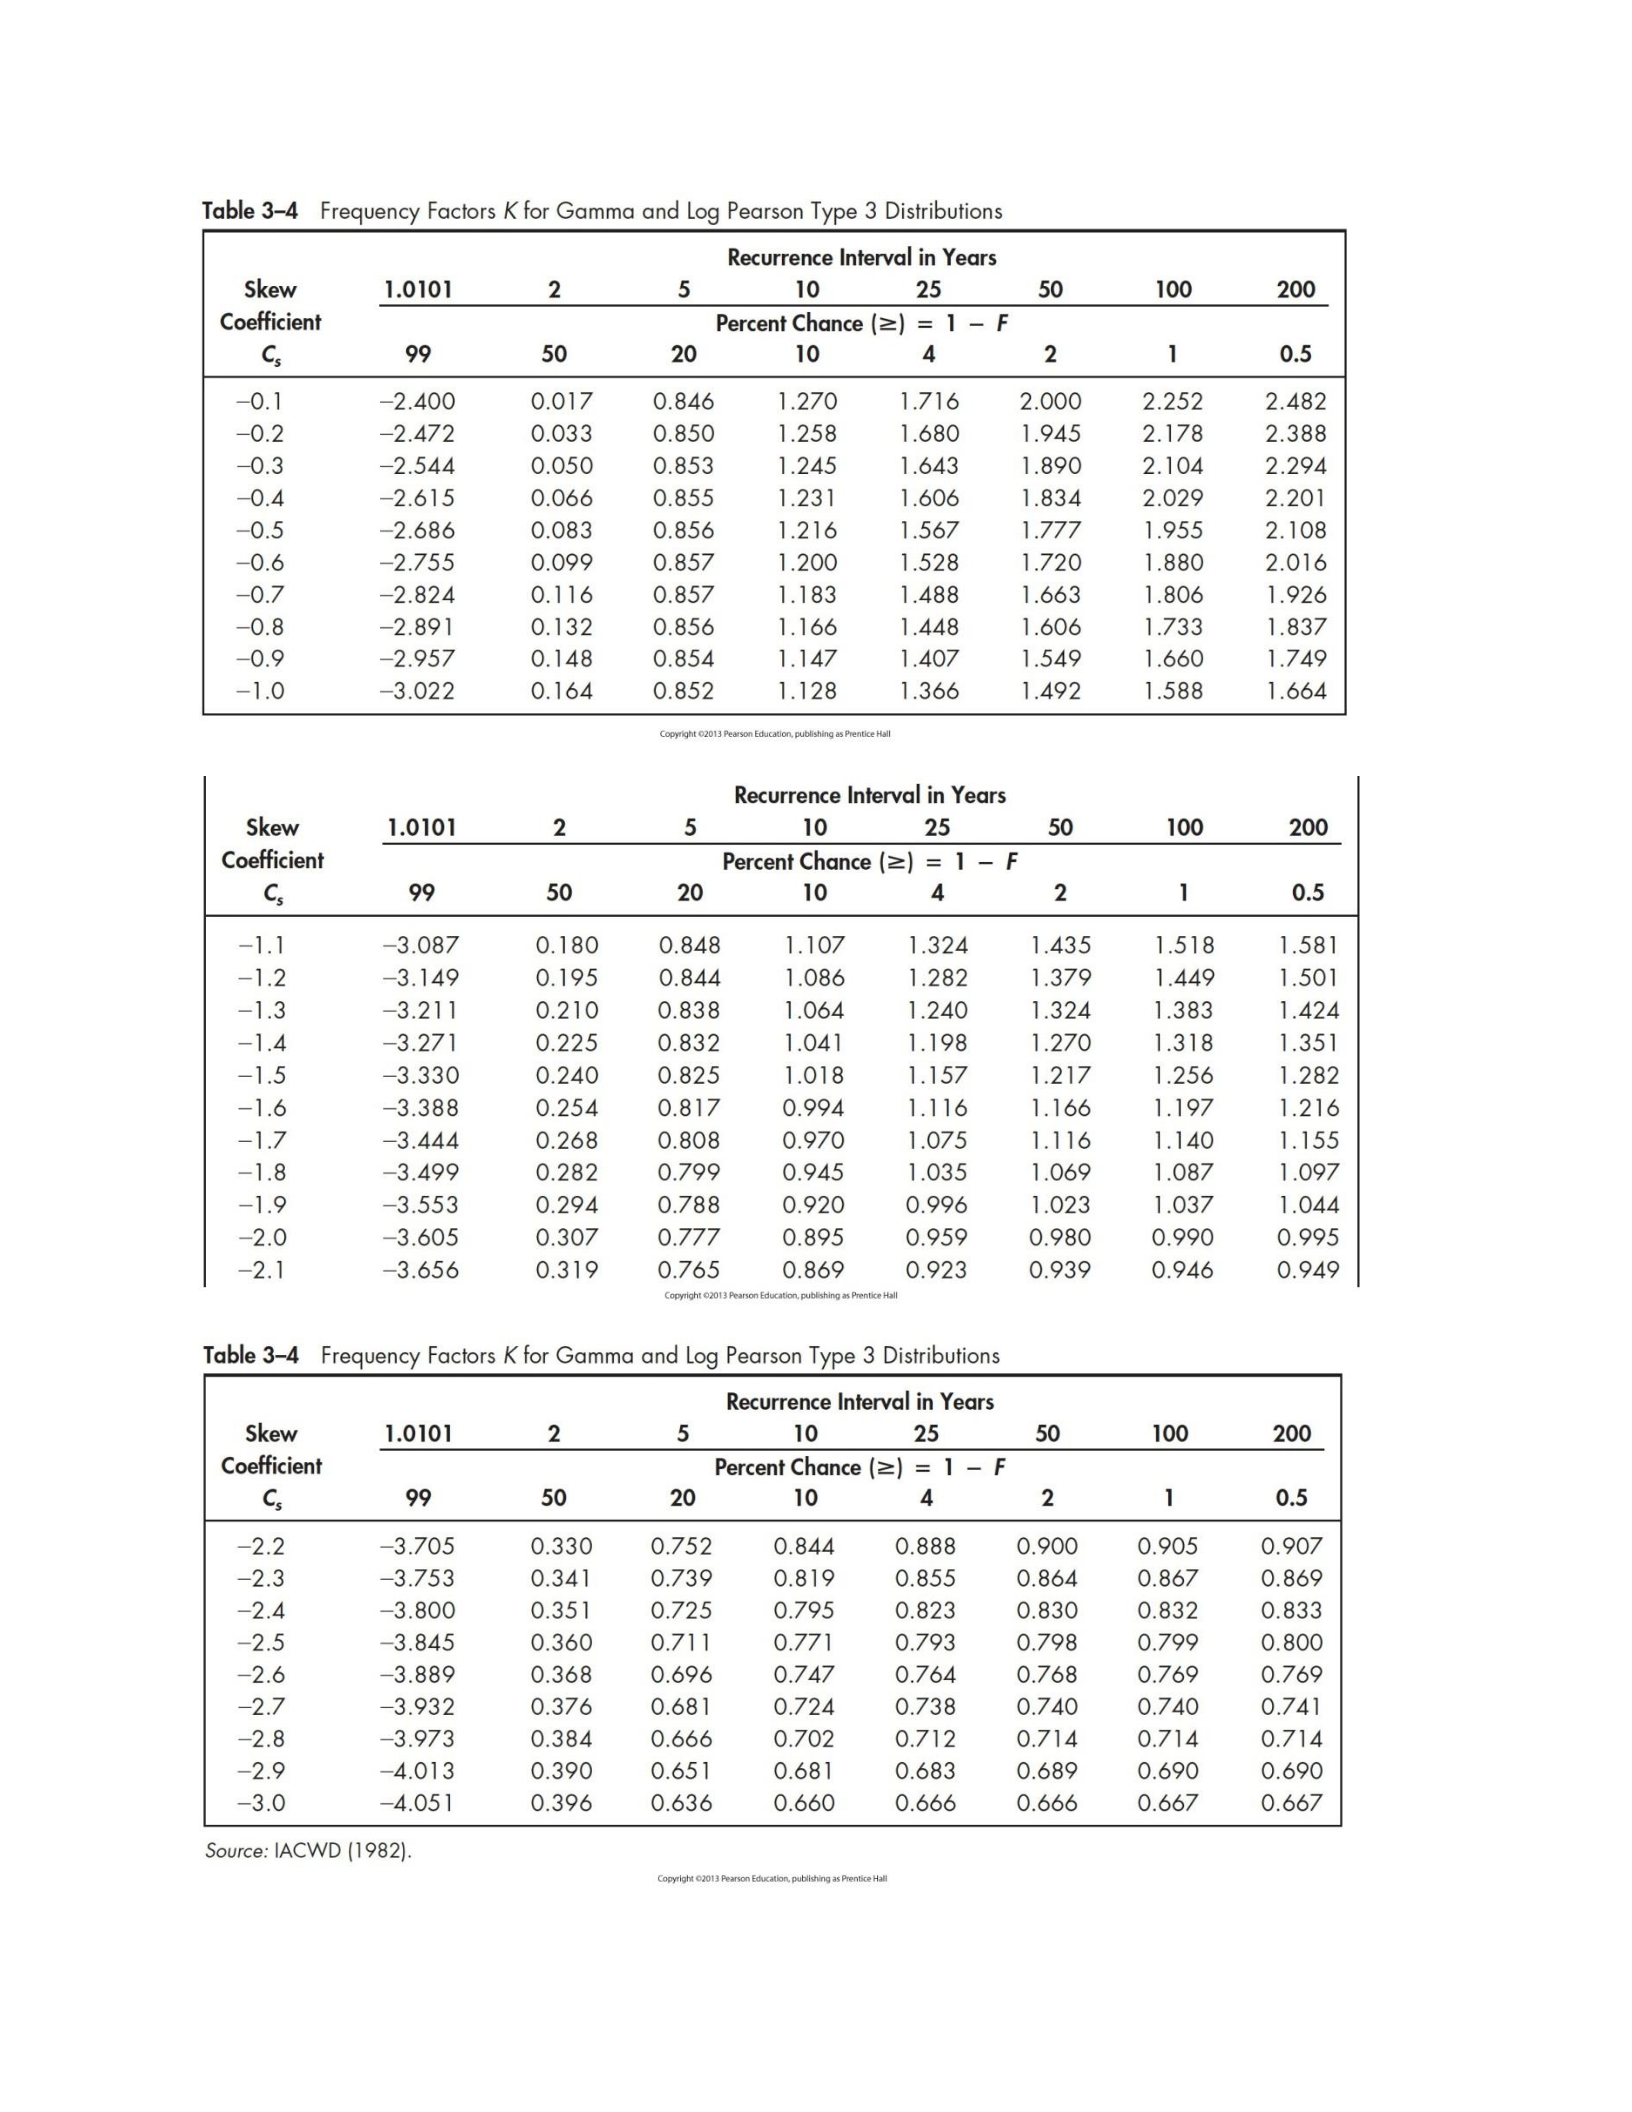
a) [5pts] What is the 50 year expected maximum annual flow based on the normal
distribution?
b) [5pts] What is the 100 year expected maximum annual flow based on the log-Pearson
type III distribution?

CEIE 340 – Final exam
Page 4 of 14
4) (10pts) Given the rainfall excess table below and the 1 hour unit hydrograph represented in the
table below:
a) Plot the storm hyetograph
b) Derive the storm hydrograph for the watershed using the hydrograph convolution method.
Table: Recorded Rainfall
Time (hr)
Precipitation (in/hr)
1
0.5
2
1.5
3
2.0
4
1.0
Table: Unit hydrograph
Time (hr)
Q (cfs)
0
0
1
450
2
750
3
1200
4
400
5
0

CEIE 340 – Final exam
Page 5 of 14
5) [10pts] Apply the storage outflow method to route a flood hydrograph trough a reservoir. The
reservoir storage outflow table was already developed by your engineering team (provided
below) and the initial water level in the reservoir before the flood event is 548 m.
Table 1: Reservoir Storage-outflow
Elevation (m)
Area (m2)
Storage (m3)
Head (m)
Outflow (cfs)
2S/t + O, (cfs)
548
200,000
648,000
0
0
340
550
330,000
1,214,000
2
45
580
552
430,000
1,974,000
4
178
1130
554
550,000
2,954,000
6
450
2536
Table 2: Hydrograph routing
Time (hrs)
Inflow (cfs)
2S/t - O, (cfs)
2S/t + O, (cfs)
Outflow (cfs)
0
35
1
75
2
280

CEIE 340 – Final exam
Page 6 of 14
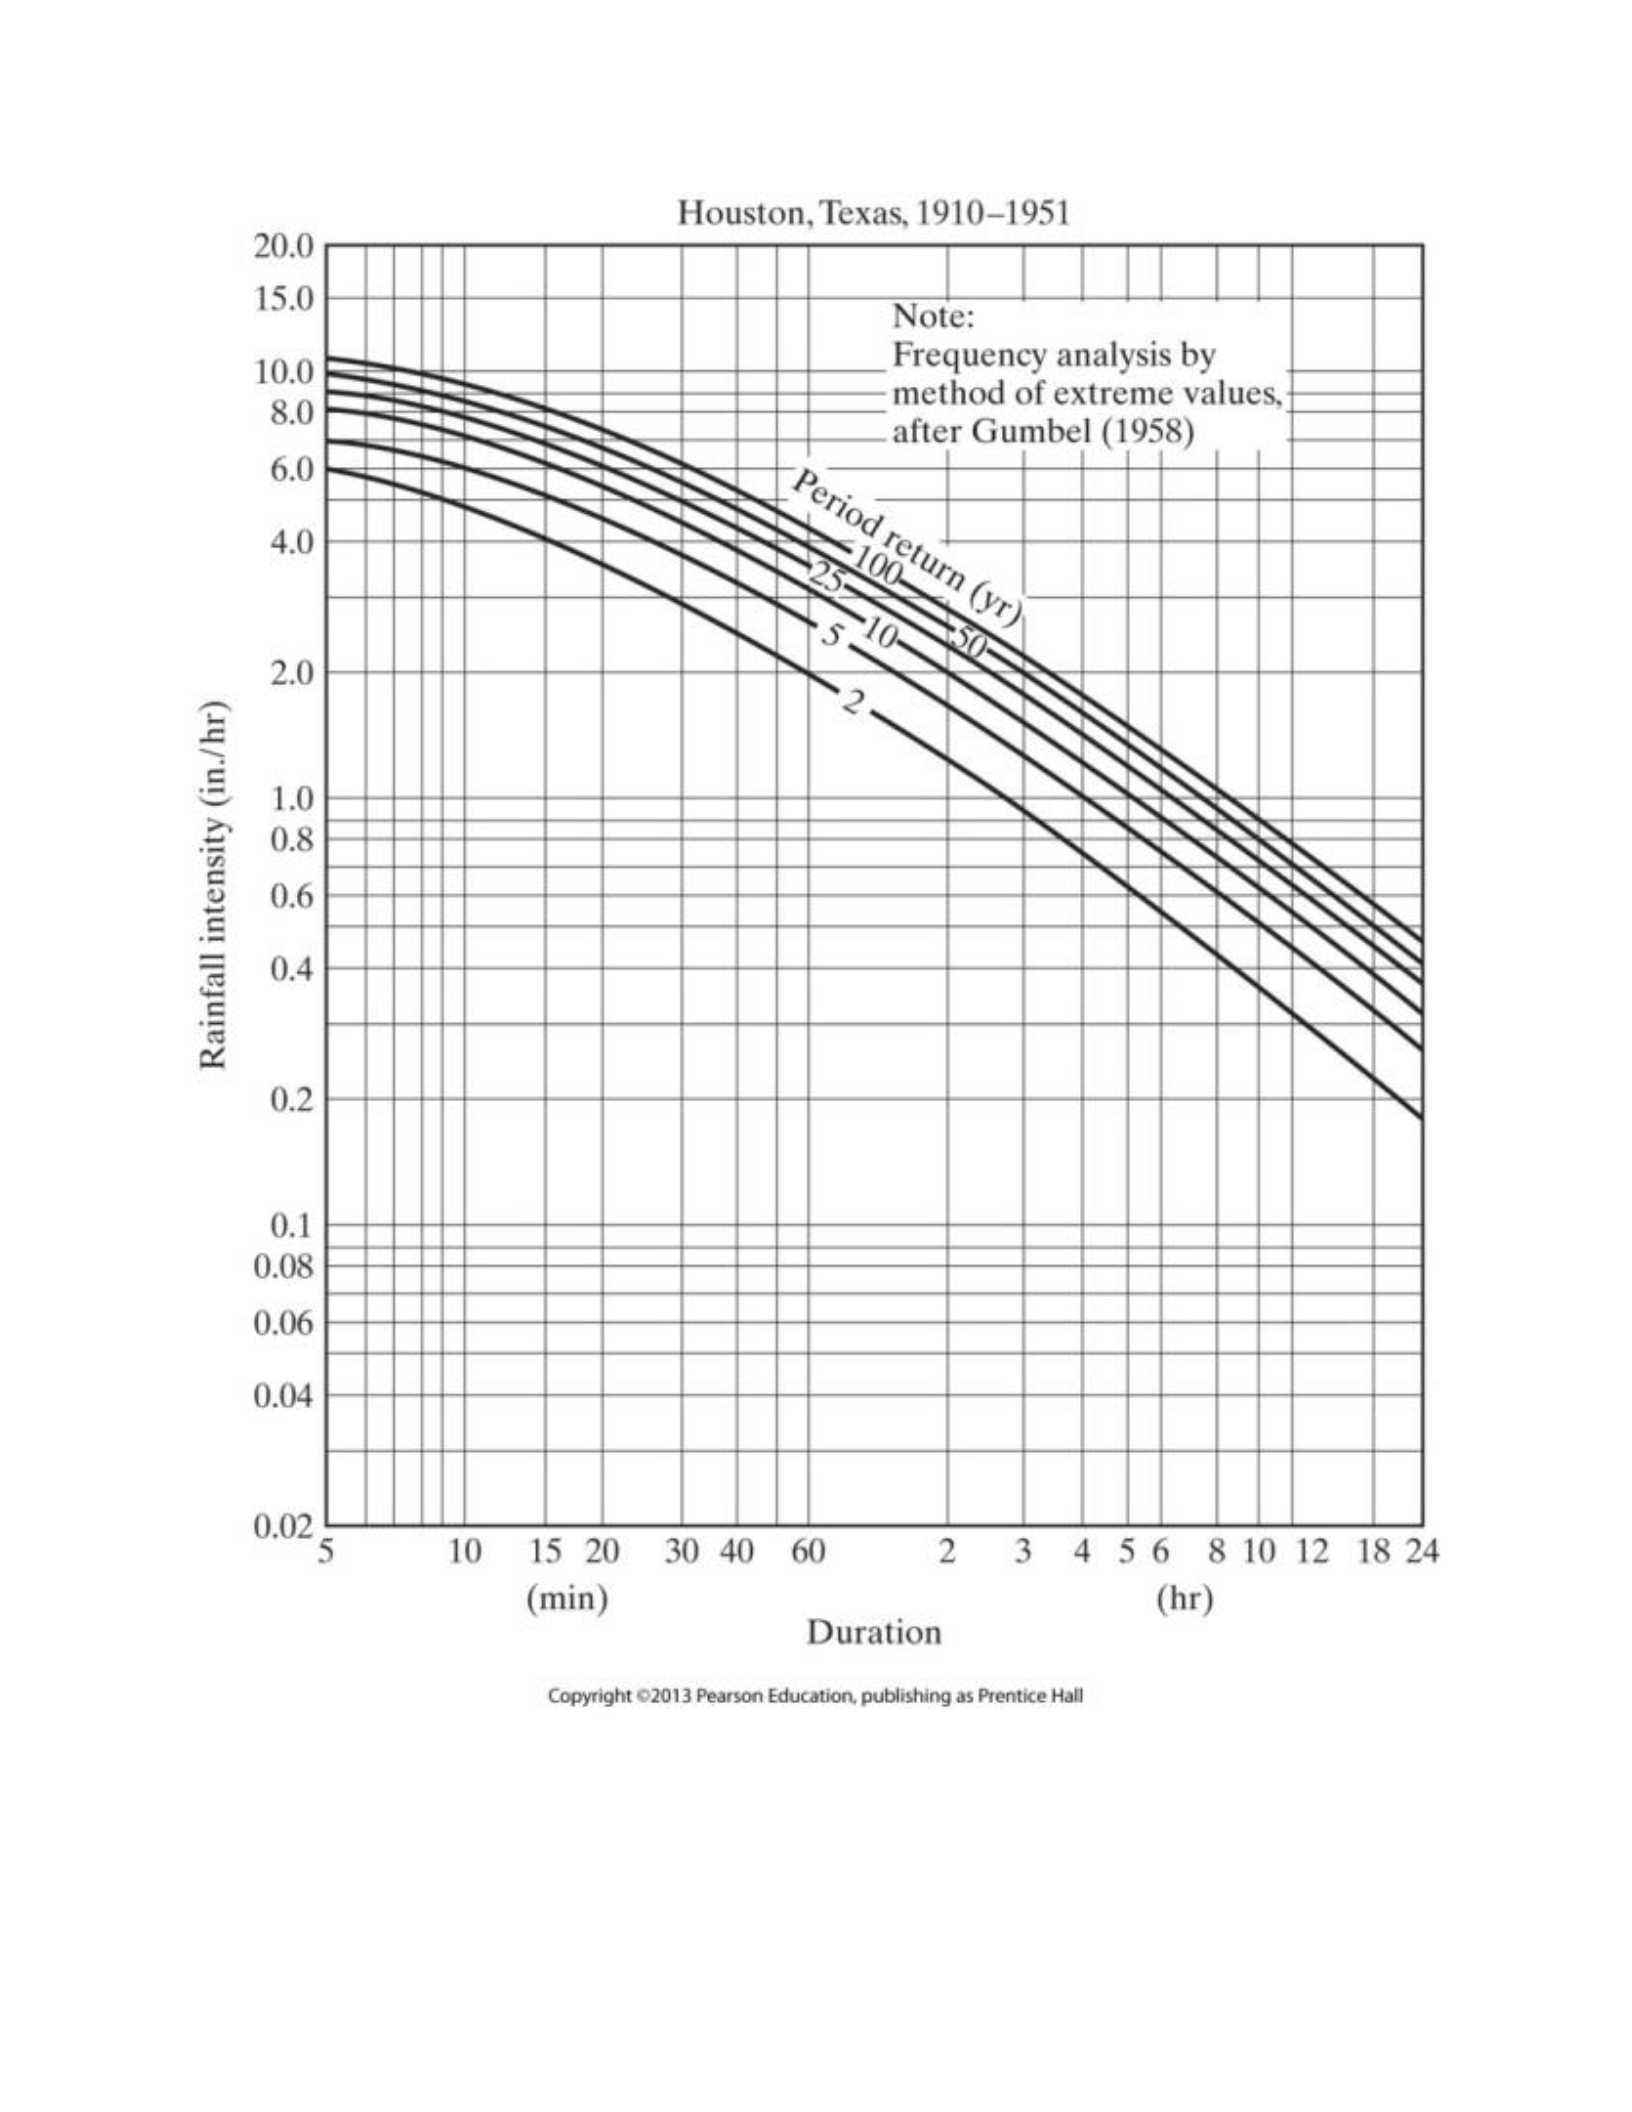
6) [10pts] Your engineering company has been selected to design a bridge improvement project.
The County requires that bridge renovation designs account for a peak flow representing a 100
years design storm for 2 hours. (use the Houston TX curves)
a) Determine the effective precipitation using the SCS method.
b) Plot the unit hydrograph for this watershed based on the SCS method.
Table: Land use and soil spatial information
Land use
Soil Type
Area (mi2)
Industrial districts
A
5
Residential (1/4 acre lot)
D
7
Streets - gravel
A
2
Commercial
C
11
Average slope = 3 %
Length to divide: 3.4 miles

CEIE 340 – Final exam
Page 7 of 14
Part III) Supporting material
Table 1 : Conversion factors for length, area, volume and discharge units
Multiply English units
By
To obtain metric units
Inches (in)
2.54
centimeters (cm)
Feet (ft)
0.3048
meters (m)
Miles (mi)
1.6093
kilometer (km)
Acres (ac)
0.4047
hectares (ha)
Acres (ac)
4047
square meters (m2)
Square miles (mi2)
2.59
square kilometers (km2)
Cubic feet (ft3)
0.0283
cubic meters (m3)
Acre-feet (ac-ft)
1,234
cubic meters (m3)
Gallons (gal)
3.785
liters (l)
Flow (cubic feet per second cfs)
0.0283
m3/s
Flow ac-ft/year
3.91X10⁻⁵
m3/s
Flow million gallons/day (mgd)
0.04381
m3/s
Ac-ft = 43,560 ft3
Miles (mi)
5280
Feet
Horton Infiltration Equation
(
)
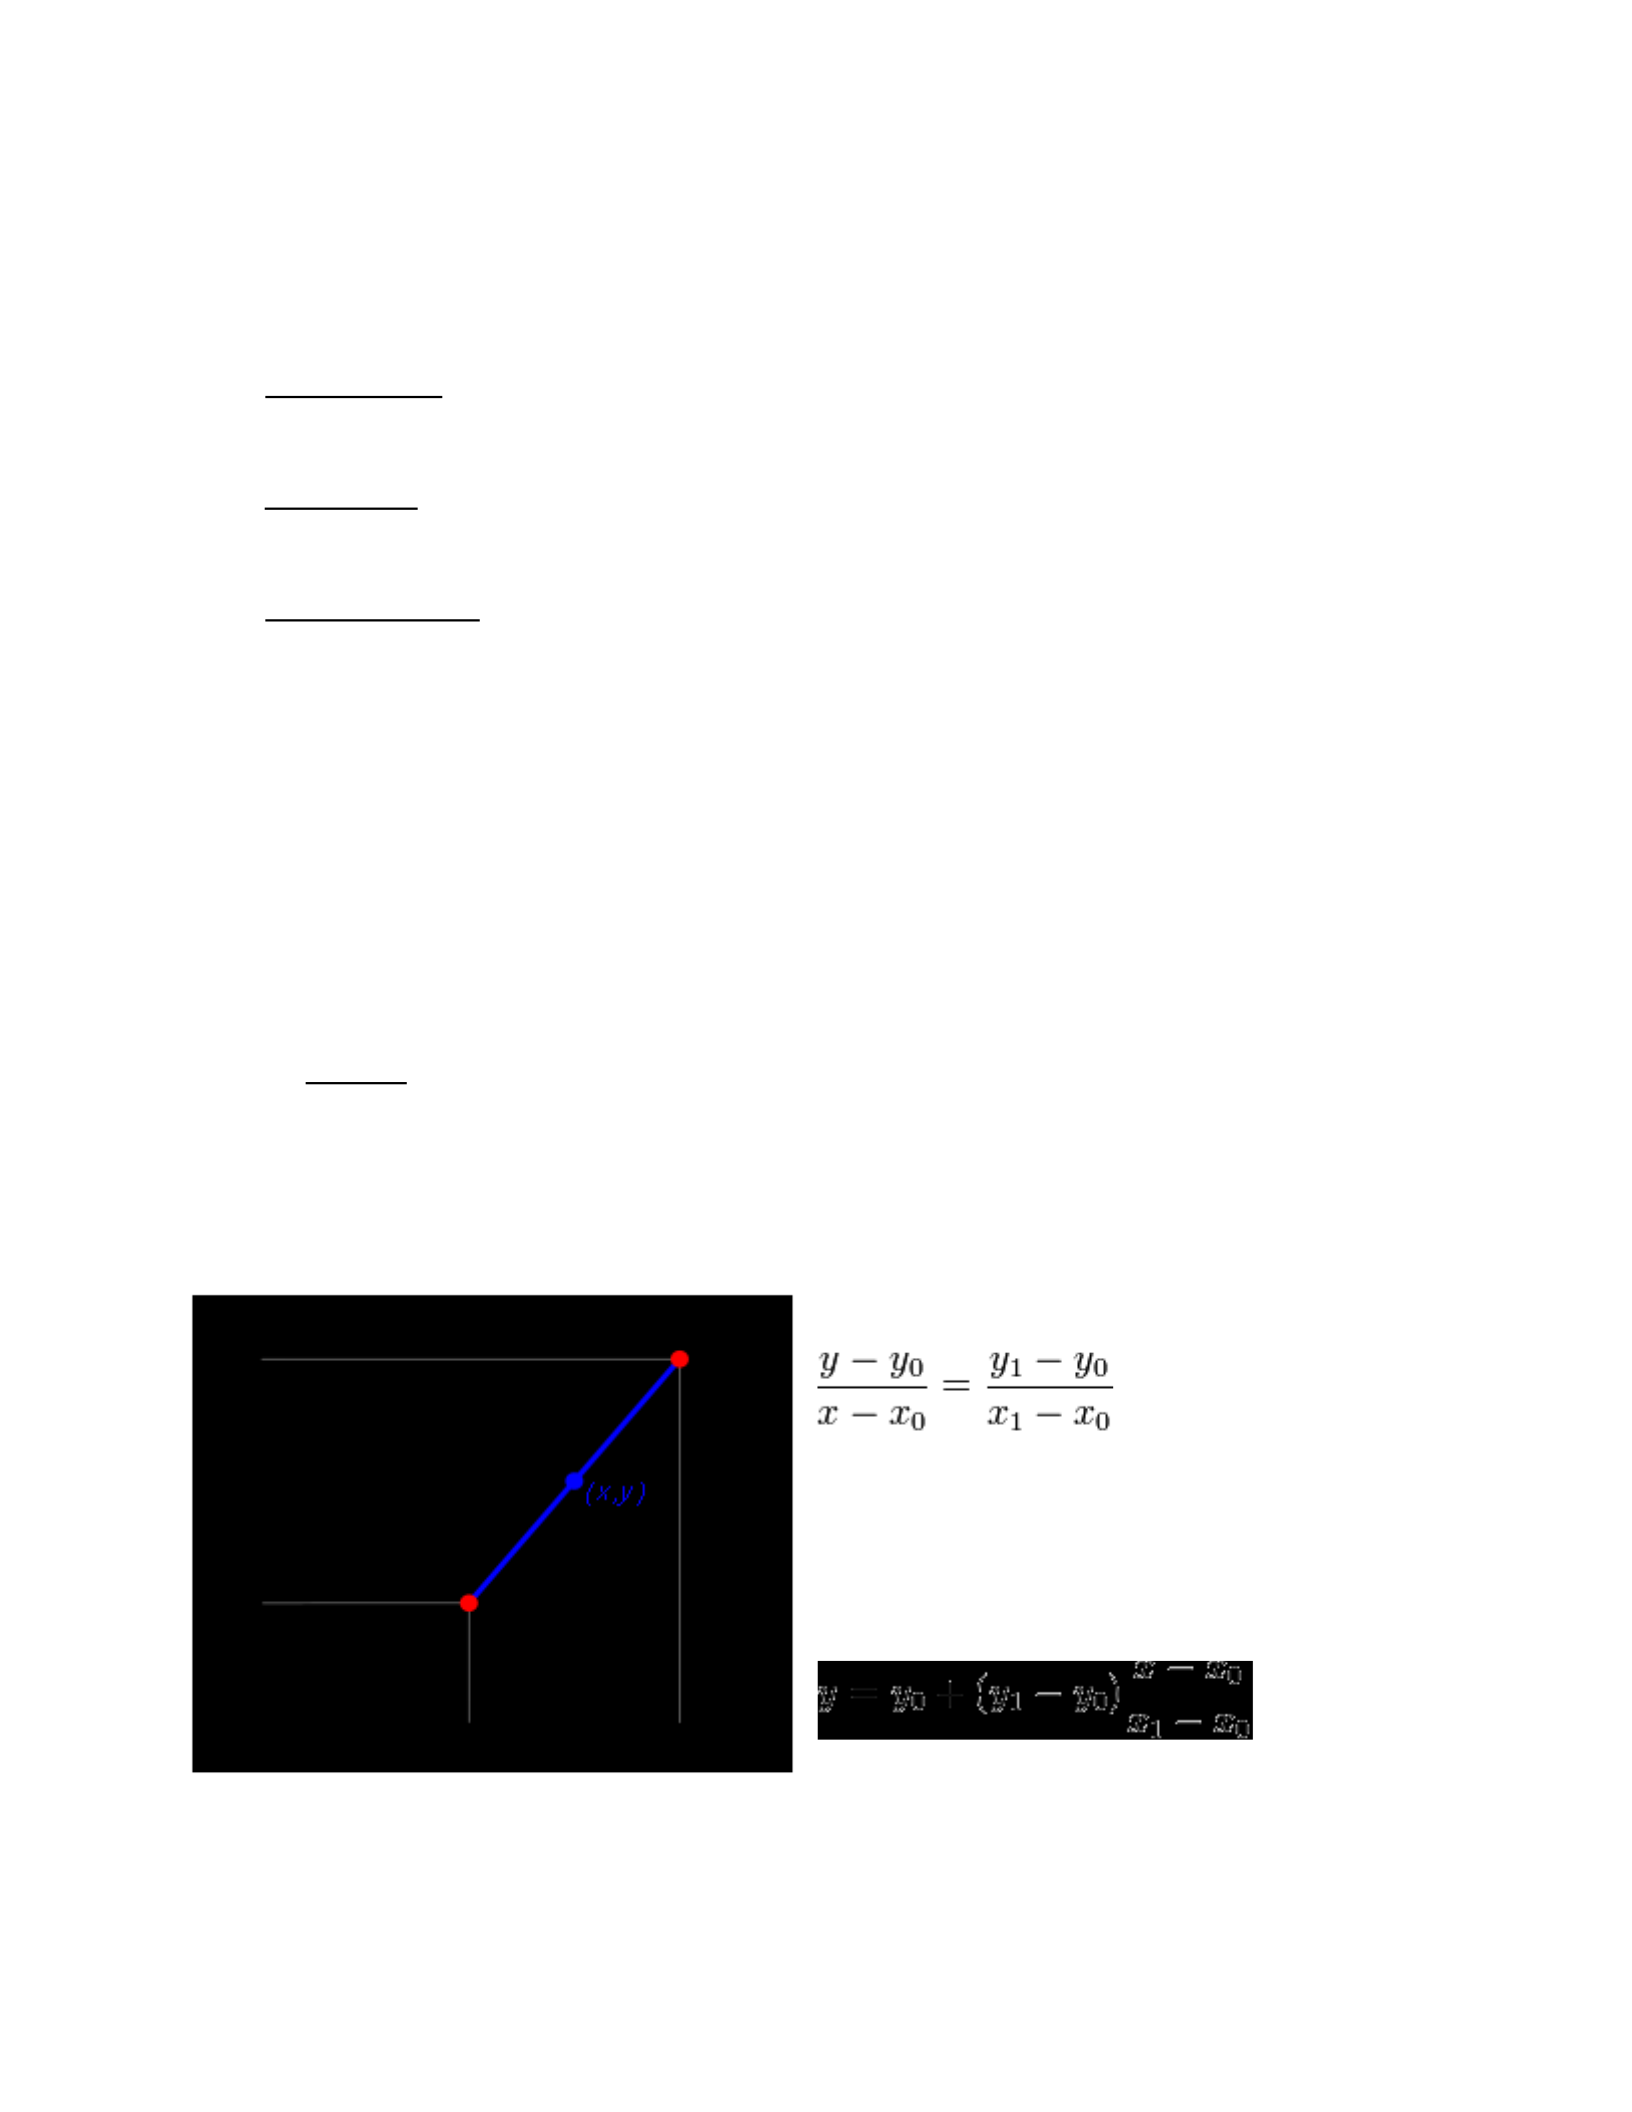
Reservoir Routing Equation
( )
( )
( )
Where:
f = infiltration capacity (in/hr)
f0 = initial infiltration capacity (in/hr)
fC = final capacity (in/hr)
k = empirical constant
CEIE 340 – Final exam
Page 9 of 14
Rational Method
Where:
Q: peak flow (cfs)
C: dimensionless runoff coefficient
I: rainfall intensity in inches per hour
A: drainage area in acres
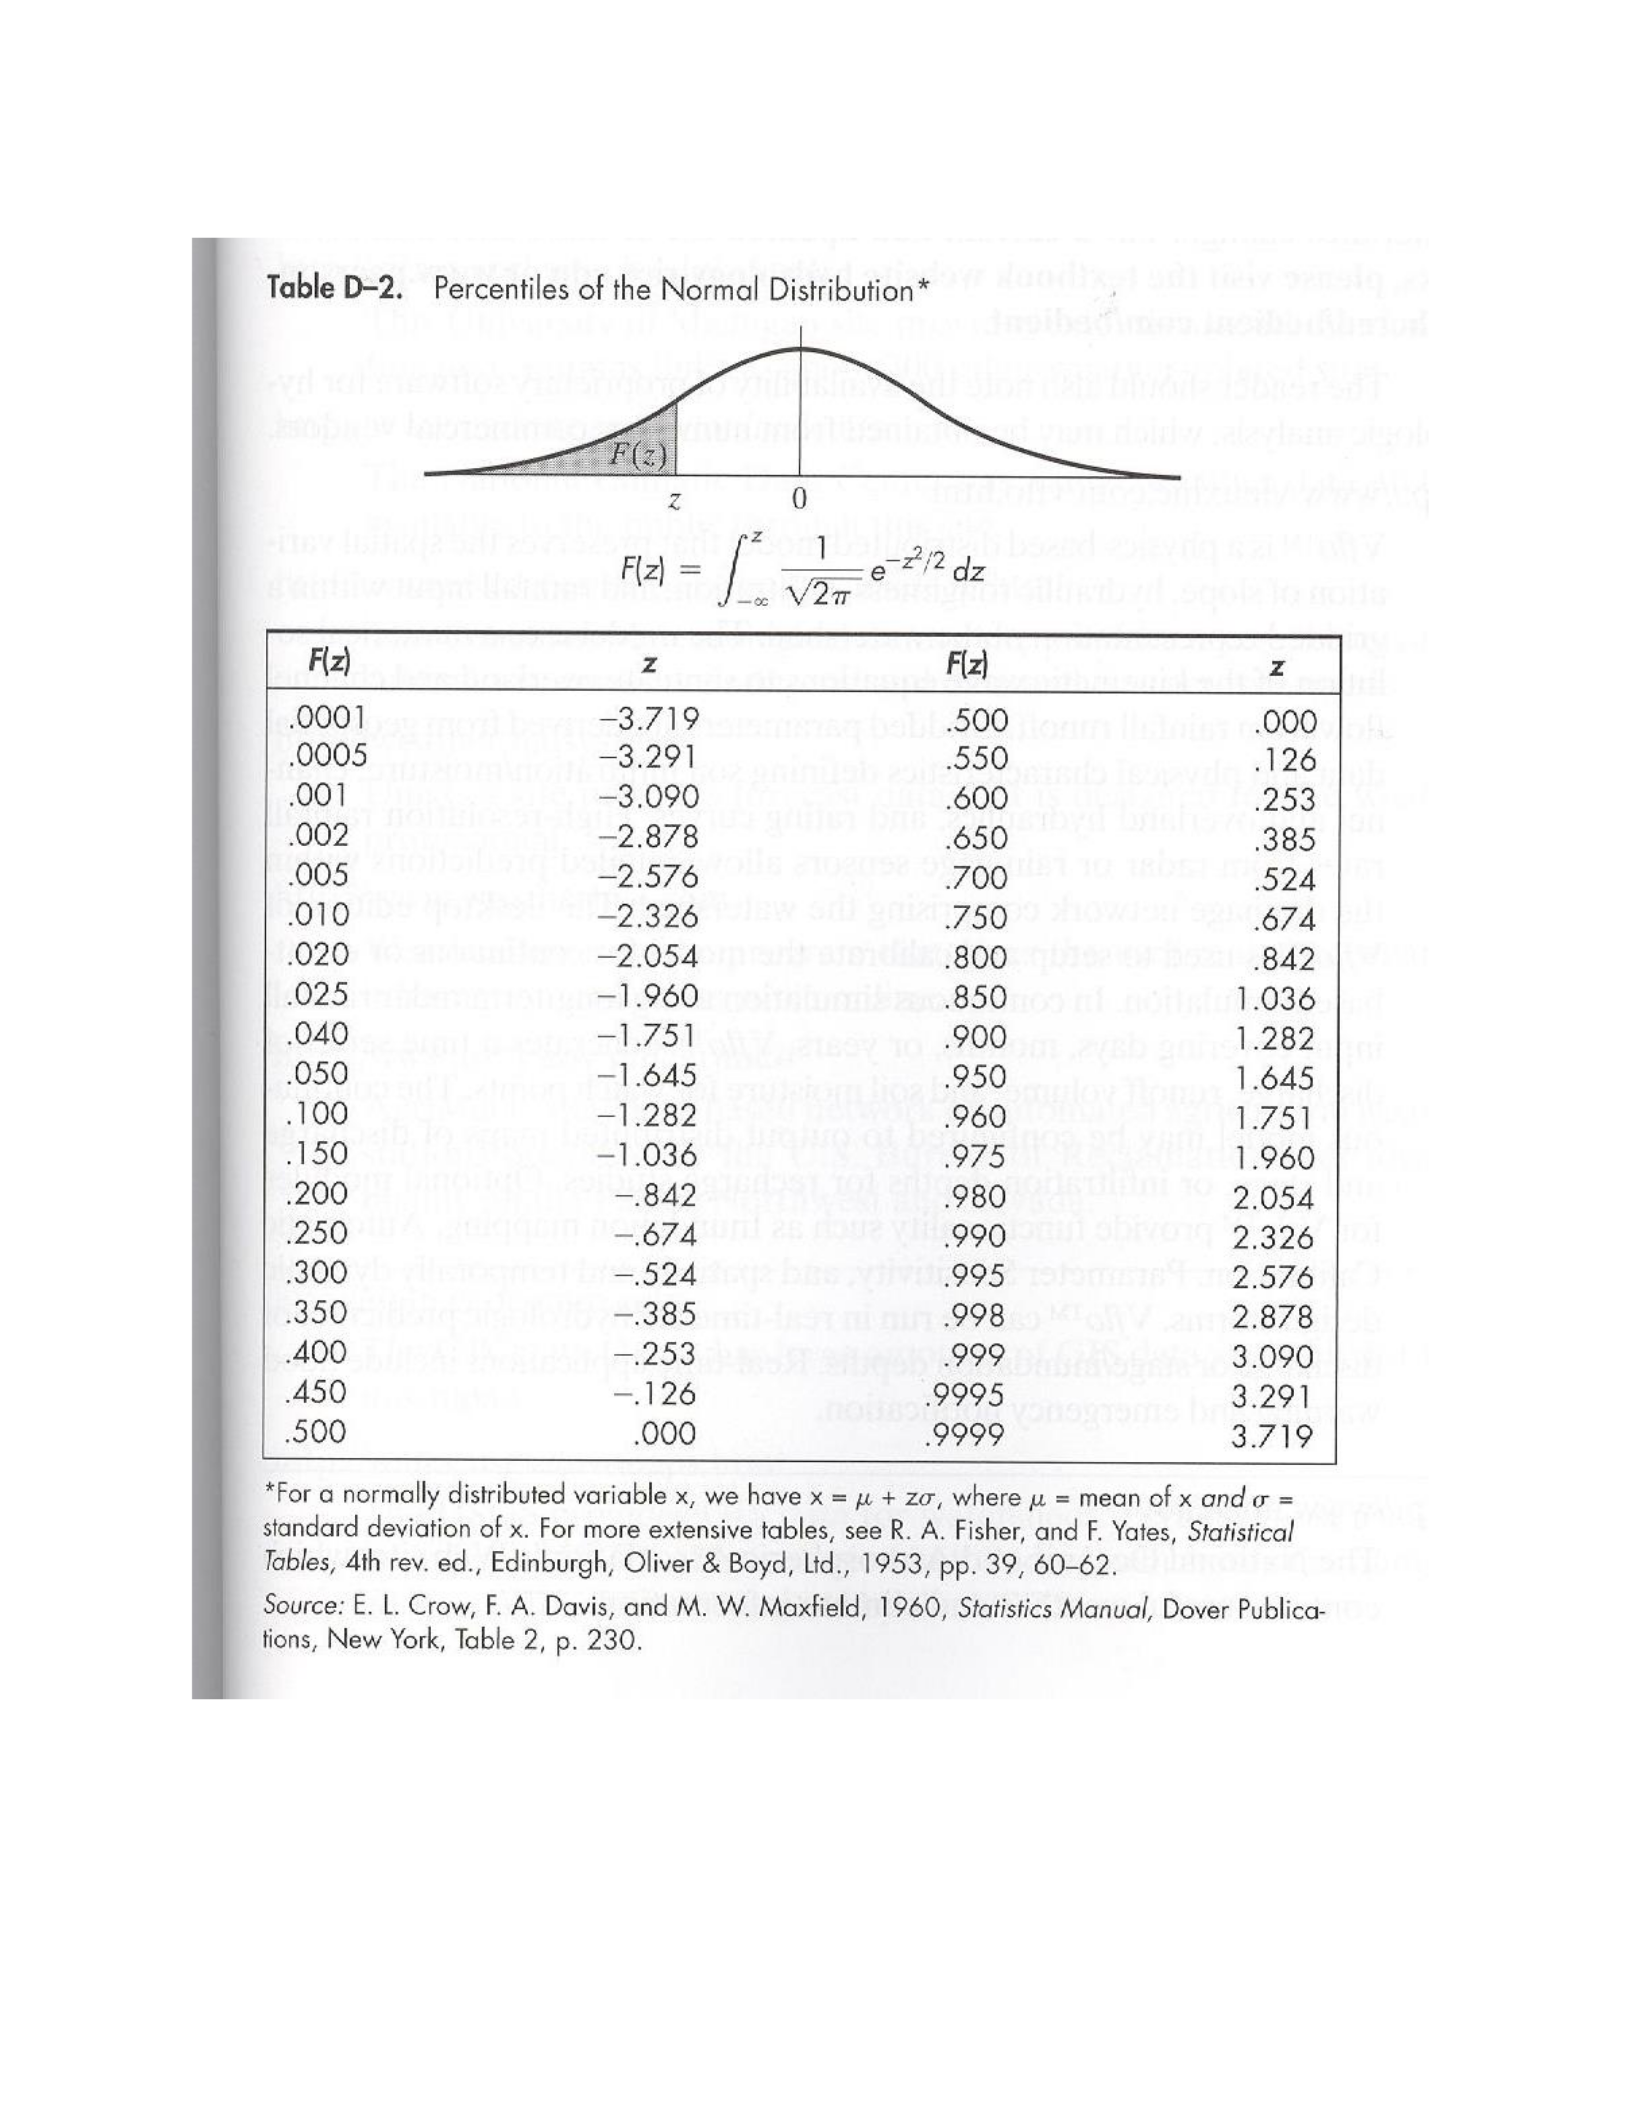
Table: Runoff Curve Numbers

CEIE 340 – Final exam
Page 10 of 14
SCS Method Equations
( )
𝑝 𝐿 ( )
9 √𝑦
𝑝
𝑝
B = 1.67 Tr
where:
Pe: Effective precipitation
P: Total precipitation
tp: lag time (hr)
Tr: Time of rise (hrs)
D: Rainfall duration (hrs)
L: length to divide (ft)
Y: average watershed slope (percent)
S: potential maximum retention (dimensionless)
A: area (mi2)
B: Time of fall (hrs)
CN is Runoff curve number (dimensionless number from 0 to 100)*
• Land use
• Antecedent soil moisture
• Other factors affecting runoff in the watershed
CEIE 340 – Final exam
Page 11 of 14
CEIE 340 – Final exam
Page 12 of 14
Rainfall
intensity
(in./hr)
20.0
15.0
10.0
8.0
6.0
4.0
p
o
o
eee
Ra
&
e
&
O01
0.08
0.06
0.04
0.02
5
10
Houston,
Texas,
1910-1951
Note:
Frequency
analysis
by
method
of
extreme
values,
after
Gumbel(1958)
Fe,
og,
ery,
NG
SM
4
2.
15
20 30
40 60
2 3
456
810
12
1824
(min)
(hr)
Duration
Copyright
©2013
Pearson
Education, publishing
as
Prentice
Hall
CEIE 340 – Final exam
Page 13 of 14

CEIE 340 – Final exam
Page 14 of 14
Table: Land use “C ” Value Coefficients
Business, industrial and commercial . . . . . . . . . . . . . . . 0.90
Apartments . . . . . . . . . . . . . . . . . . . . . . . . . . . . . . . . . . . 0.75
Schools . . . . . . . . . . . . . . . . . . . . . . . . . . . . . . . . . . . . . . 0.60
Residential - lots of 10,000 sq. ft. . . . . . . . . . . . . . . . . . 0.50
- lots of 12,000 sq. ft. . . . . . . . . . . . . . . . . . . 0.45
- lots of 17,000 sq. ft. . . . . . . . . . . . . . . . . . . 0.45
- lots of ½ acre or more . . . . . . . . . . . . . . . . 0.40
Parks, cemeteries and unimproved areas . . . . . . . . . . . . 0.34
Paved and roof areas . . . . . . . . . . . . . . . . . . . . . . . . . . . 0.90
Cultivated areas . . . . . . . . . . . . . . . . . . . . . . . . . . . . . . . 0.60
Pasture . . . . . . . . . . . . . . . . . . . . . . . . . . . . . . . . . . . . . . 0.45
Forest . . . . . . . . . . . . . . . . . . . . . . . . . . . . . . . . . . . . . . . 0.30
Steep grass slopes (2:1) . . . . . . . . . . . . . . . . . . . . . . . . . 0.70
Shoulder and ditch areas . . . . . . . . . . . . . . . . . . . . . . . . 0.50
Lawns . . . . . . . . . . . . . . . . . . . . . . . . . . . . . . . . . . . . . . . 0.20
Source:VDOT
Binomial Distribution
Where:
Px(X=x) denotes the probability that an event will occur x times in N trials
(𝑋 ) !
! ( )! ( )

