CEIE 340 – Midterm exam 1
Page 1 of 8
George Mason University
Department of Civil, Environmental and Infrastructure Engineering
CEIE 340 Water Resources Engineering
October 9th, 2014
Mid Term Exam #1
Name:_____________________________________________ Date: _____________________
Signature:_____________________________________________________________________
* This exam is closed book and closed notes. No computer or cell phones are allowed. The use of
calculator is permitted.
______________________________________________________________________________
Part I) Concepts and theory (each question 3pts, total 30pts)
Indicate whether each statement below is TRUE or FALSE:
[ ] One of the most impacted components of the water cycle by urbanization is the
infiltration.
[ ] Although we can find high potential for evapotranspiration in the US southwest the
actual volume of water evapotranspirated every year is very low if compared to the Florida
region.
[ ] The main advantage of measuring rainfall using Radar networks such as NEXRAD over
rain gages is that besides giving you a direct measurement of rainfall it also provides the
“spatial” advantage.
[ ] A common effect of urbanization on watershed runoff is the increased time of
concentration.
[ ] One advantage of using the D-8 method to calculate flow direction and flow
accumulation over an area is that you can easily identify streams and watersheds. Also, by using
the flow accumulation raster you can calculate the drainage area in anywhere inside the raster
extent.
[ ] A Digital Elevation Model (DEM) is a raster file that among other information also
contains data regarding land use.
CEIE 340 – Midterm exam 1
Page 2 of 8
[ ] The Thiessen polygons method is a common method used to interpolate precipitation
data over time.
[ ] Two common methods to develop a unit hydrograph for ungagged basins are the Snyder
and the SCS.
[ ] The temperature is the only environmental factor affecting potential evapotranspiration.
[ ] Both the ɸ - Index and the Green-Ampt are common methods in engineering to estimate
water infiltration.
______________________________________________________________________________
Part II) Methods and applications (60pts)
Your engineering company has been selected to perform a major floodplain mapping project in
Houston as part of the National Flood Insurance Program (NFIP). As part of your tasks you have
been asked to:
1) Precipitation Design
a) [5 pts] The community measured a rainfall event that caused some flooding in the
vicinity and asked you to calculate its return period. Their rain gage measured 9 inches of
rainfall over a period of 6 hours. What is expected the return period for this event?
b) [10 pts] Develop a storm hyetograph based on the SCS type II method for 6 hours
duration and a 100 year design storm.
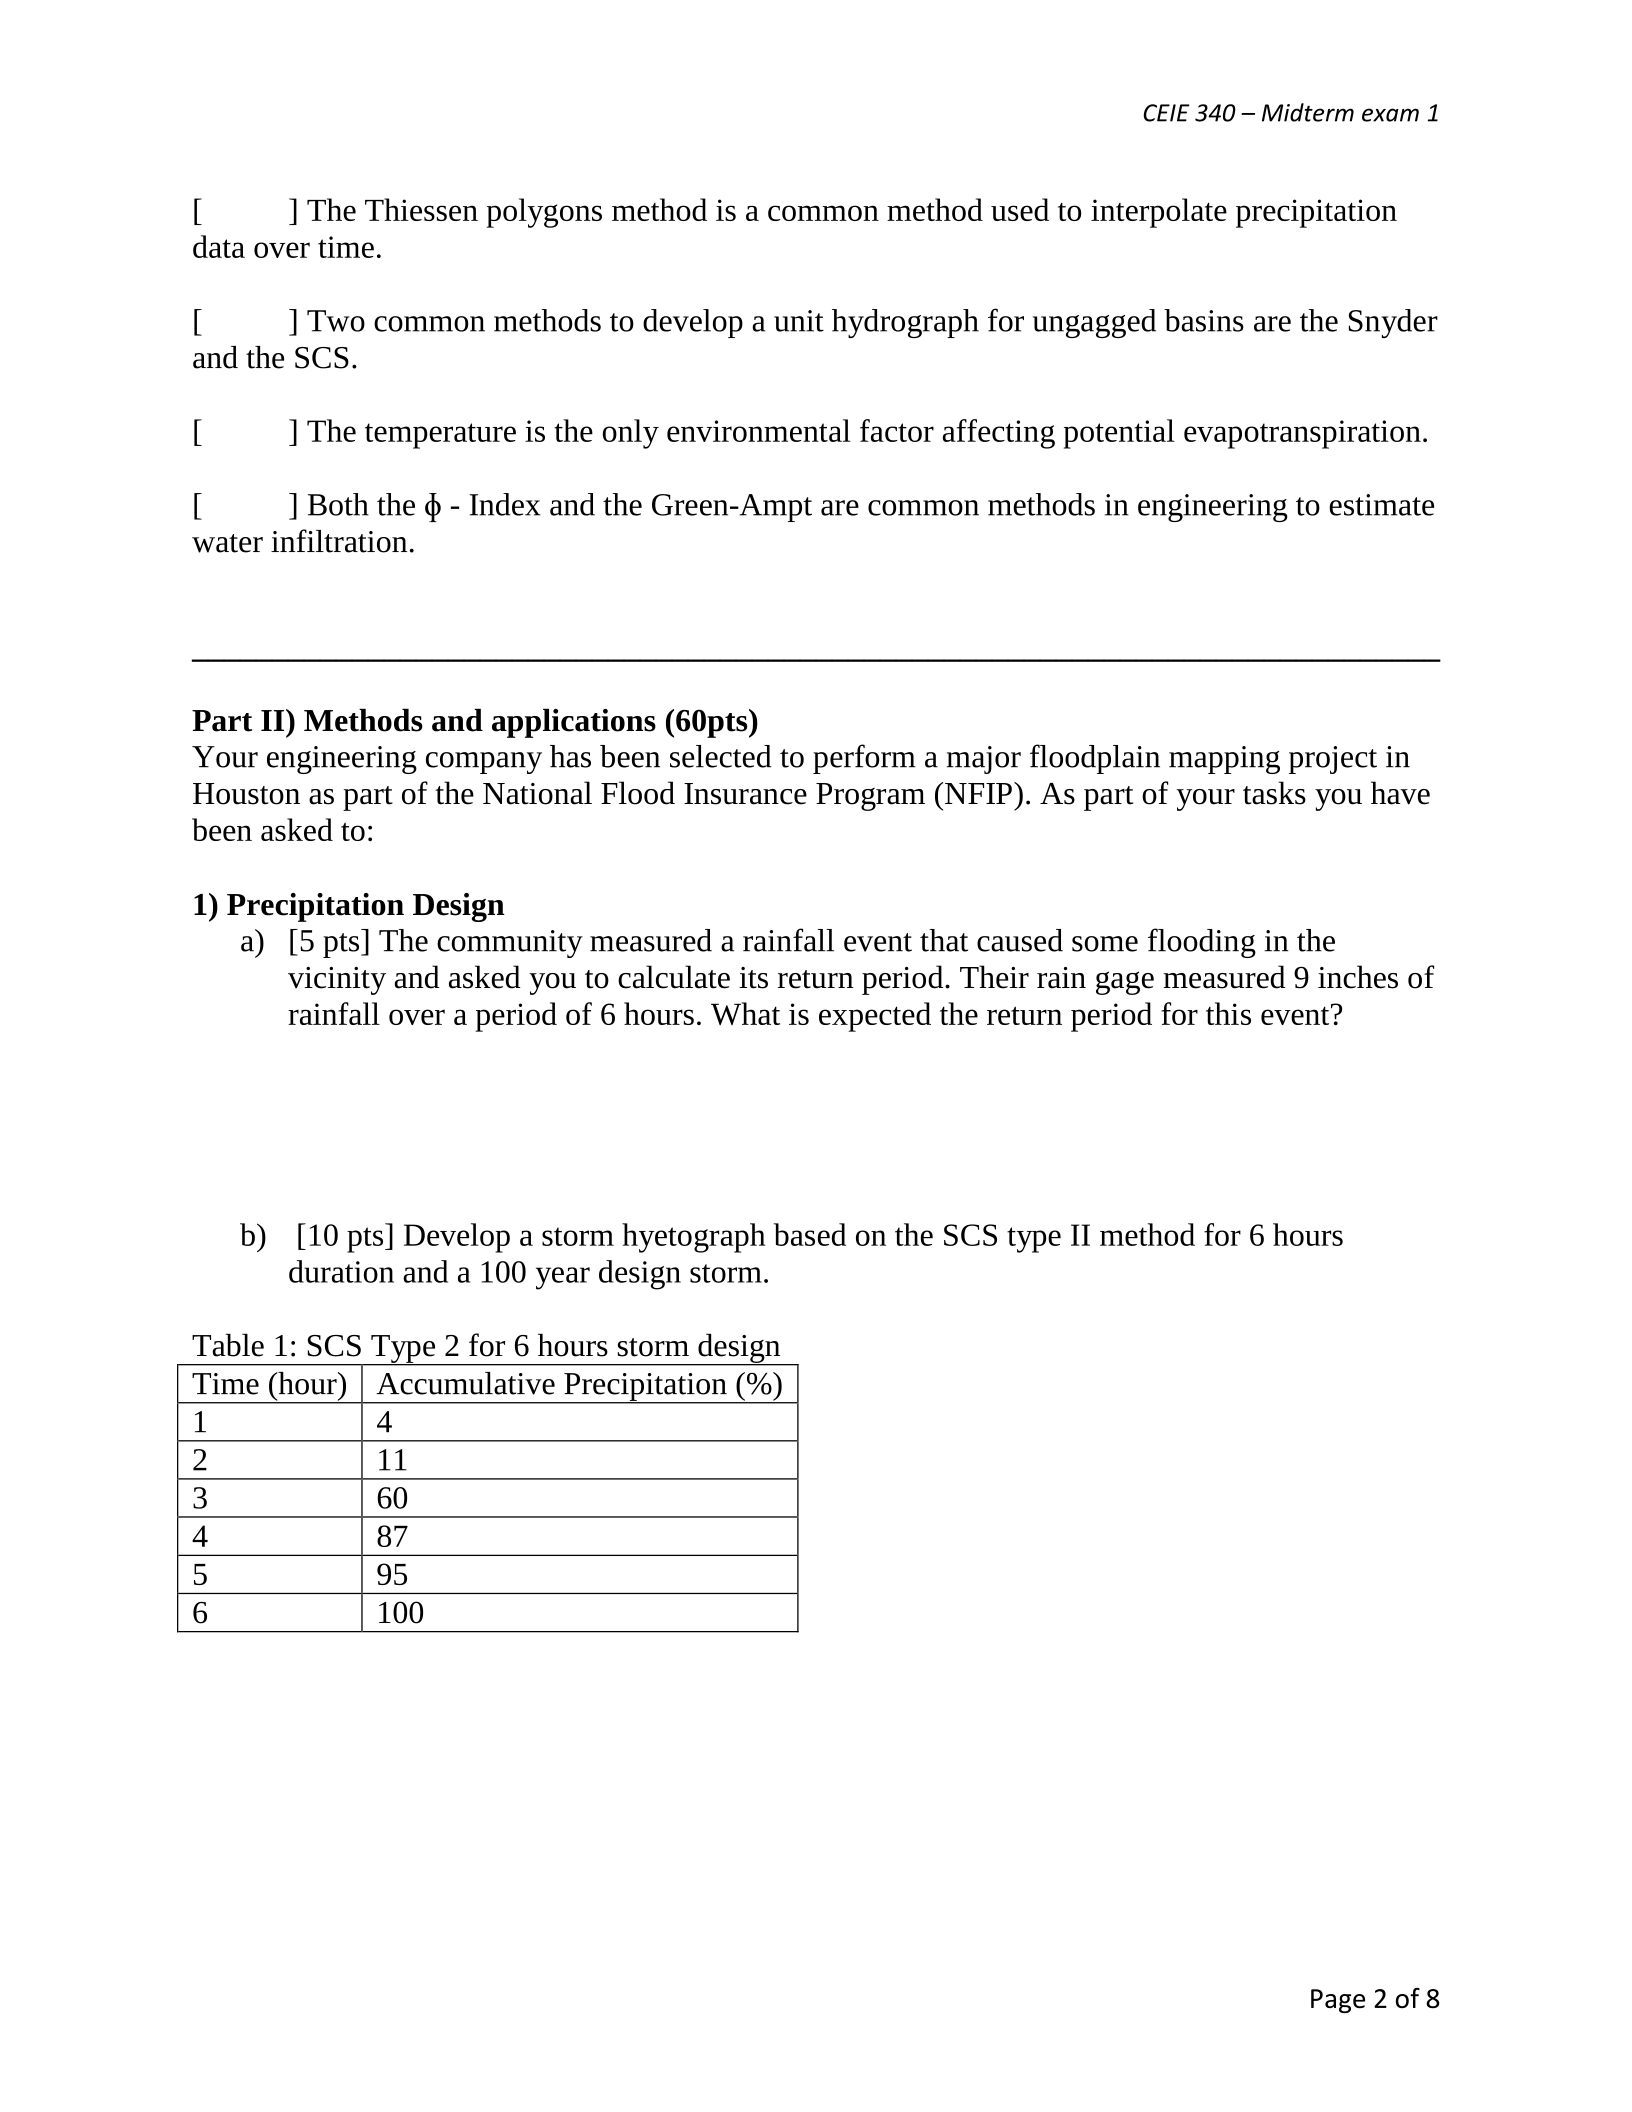
Table 1: SCS Type 2 for 6 hours storm design
Time (hour)
Accumulative Precipitation (%)
1
4
2
11
3
60
4
87
5
95
6
100
CEIE 340 – Midterm exam 1
Page 3 of 8
2) Infiltration and losses
a) [5 pts] Determine the soil infiltration capacity using the Horton Equation given that the
soil initial infiltration rate is equal to 3.8 in/hr and the final capacity is 0.8 in/hr for the
following times: t=1hr, 2hr, 3hr, 4hr, 5hr and 6 hr. You may assume a time constant k =
0.38/hr.
b) [5 pts] Given the precipitation event from the table below calculate the actual infiltration
for this event.
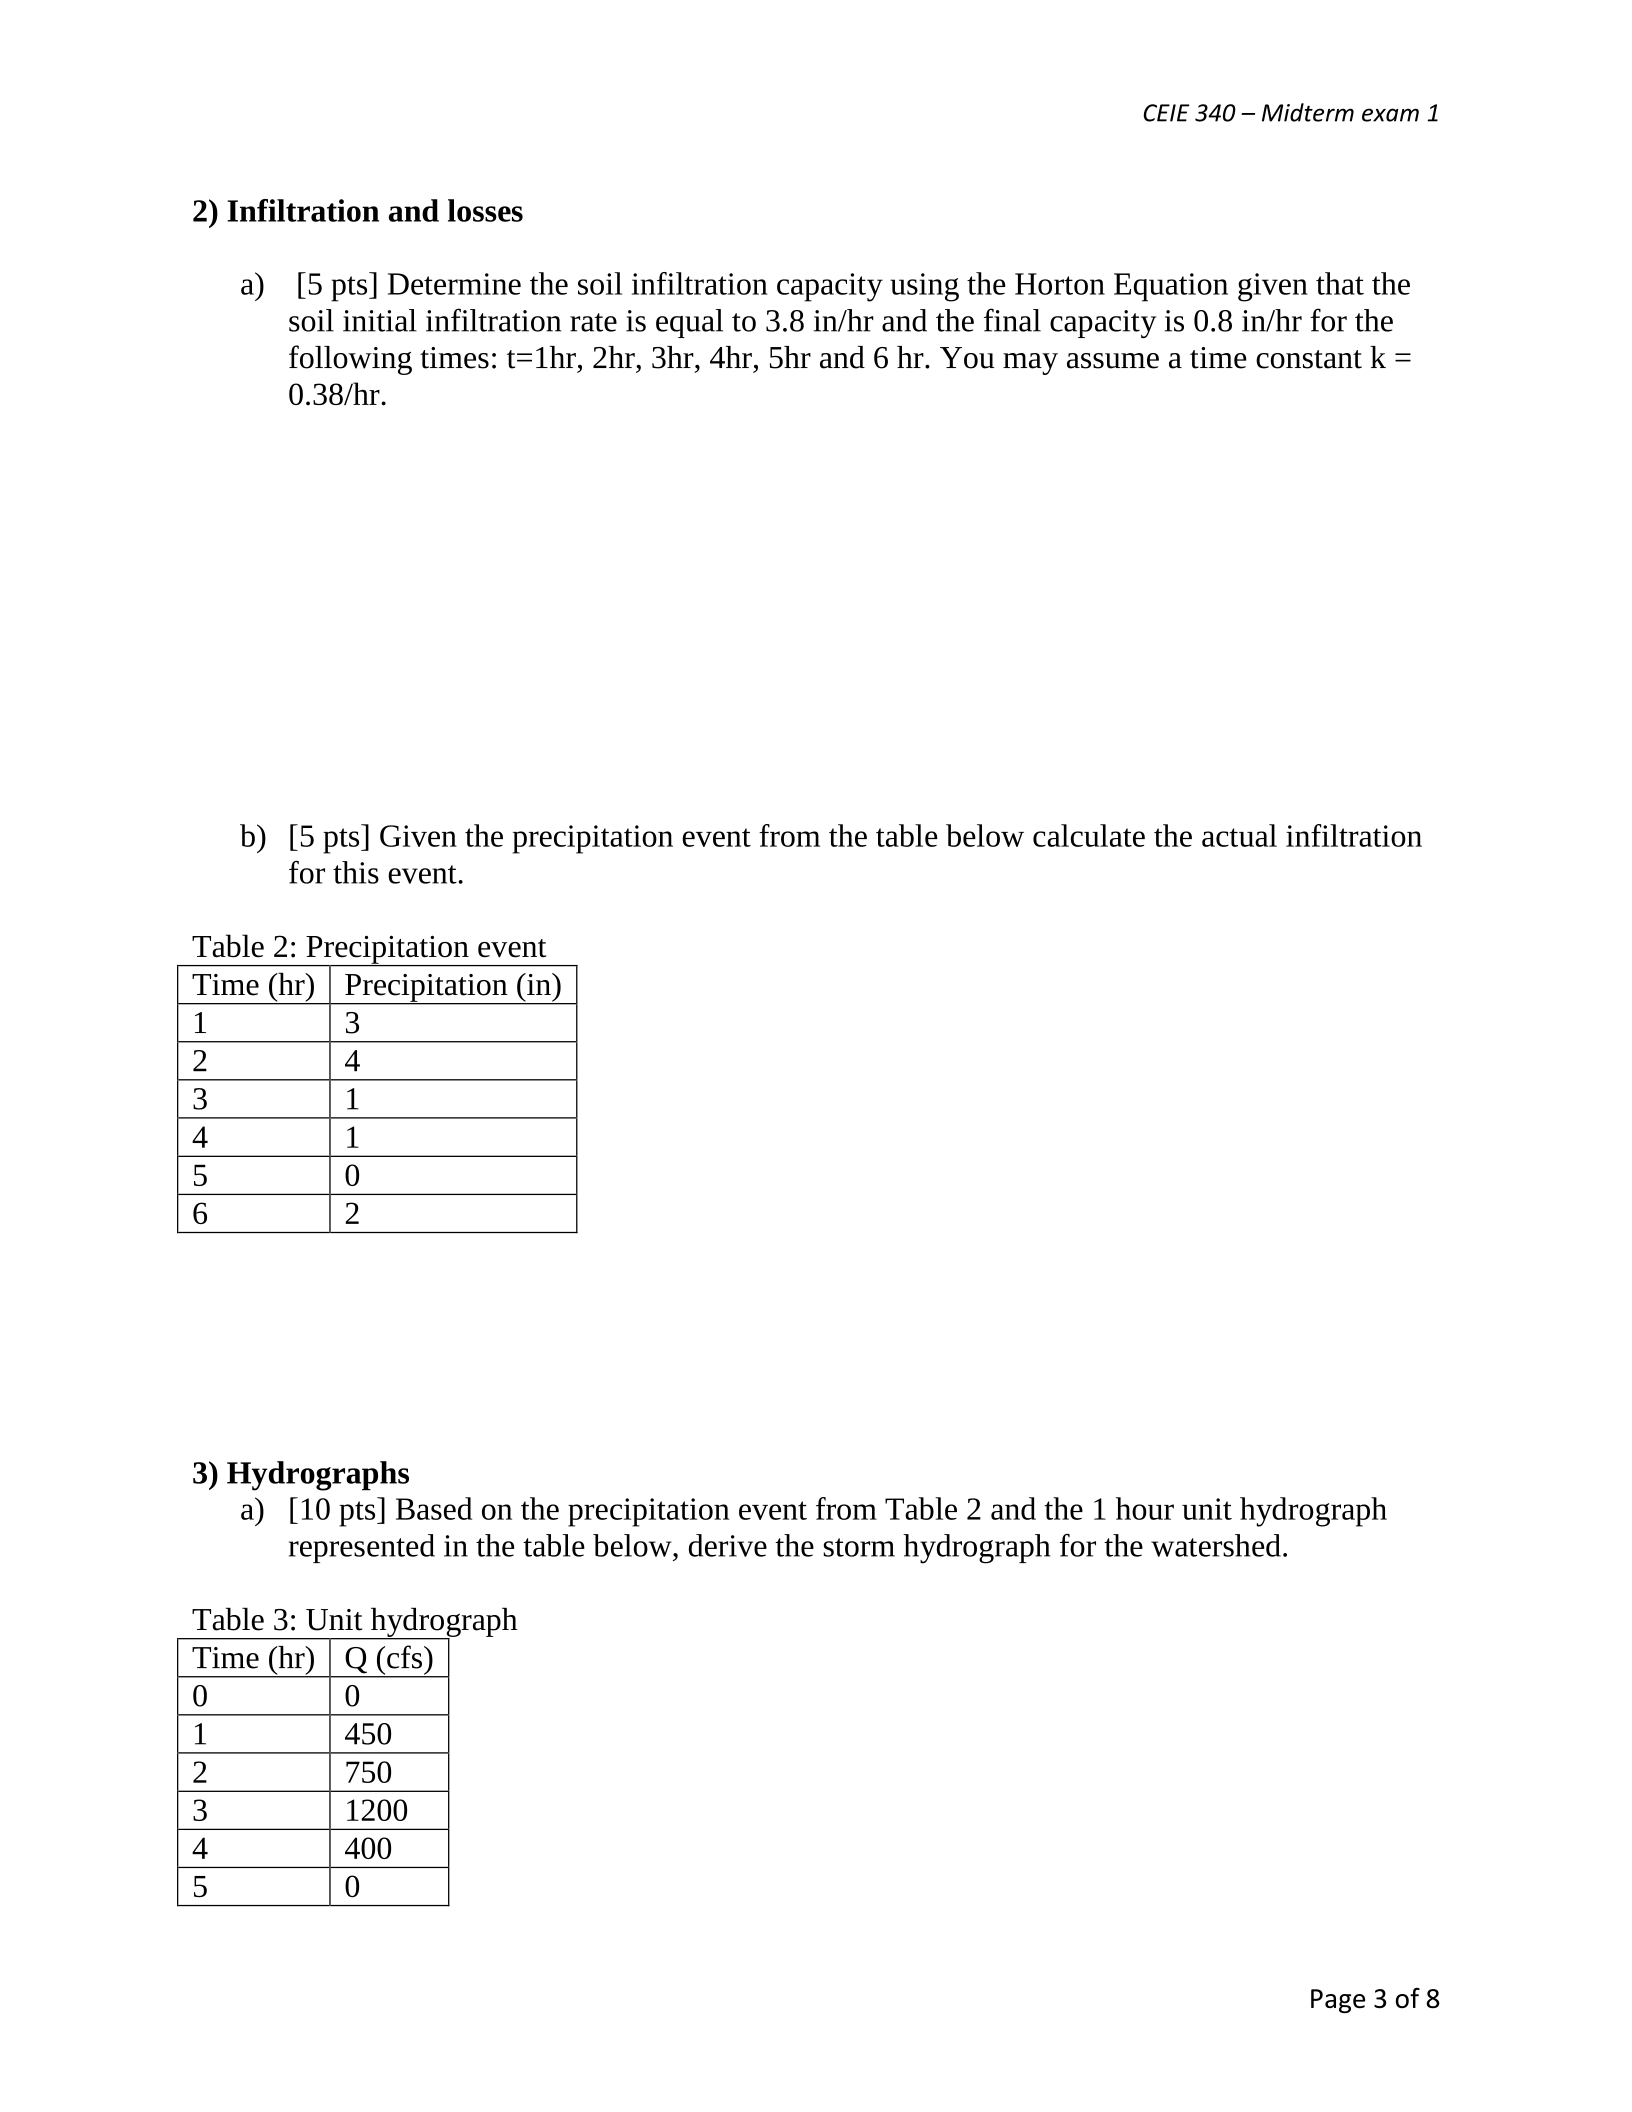
Table 2: Precipitation event
Time (hr)
Precipitation (in)
1
3
2
4
3
1
4
1
5
0
6
2
3) Hydrographs
a) [10 pts] Based on the precipitation event from Table 2 and the 1 hour unit hydrograph
represented in the table below, derive the storm hydrograph for the watershed.
Table 3: Unit hydrograph
Time (hr)
Q (cfs)
0
0
1
450
2
750
3
1200
4
400
5
0
CEIE 340 – Midterm exam 1
Page 4 of 8
4) Hydrological design
a) [10 pts] Considering a design storm with duration of 24 hours and return period of 100
years: Calculate the effective precipitation based on the SCS method for the watershed
conditions below:
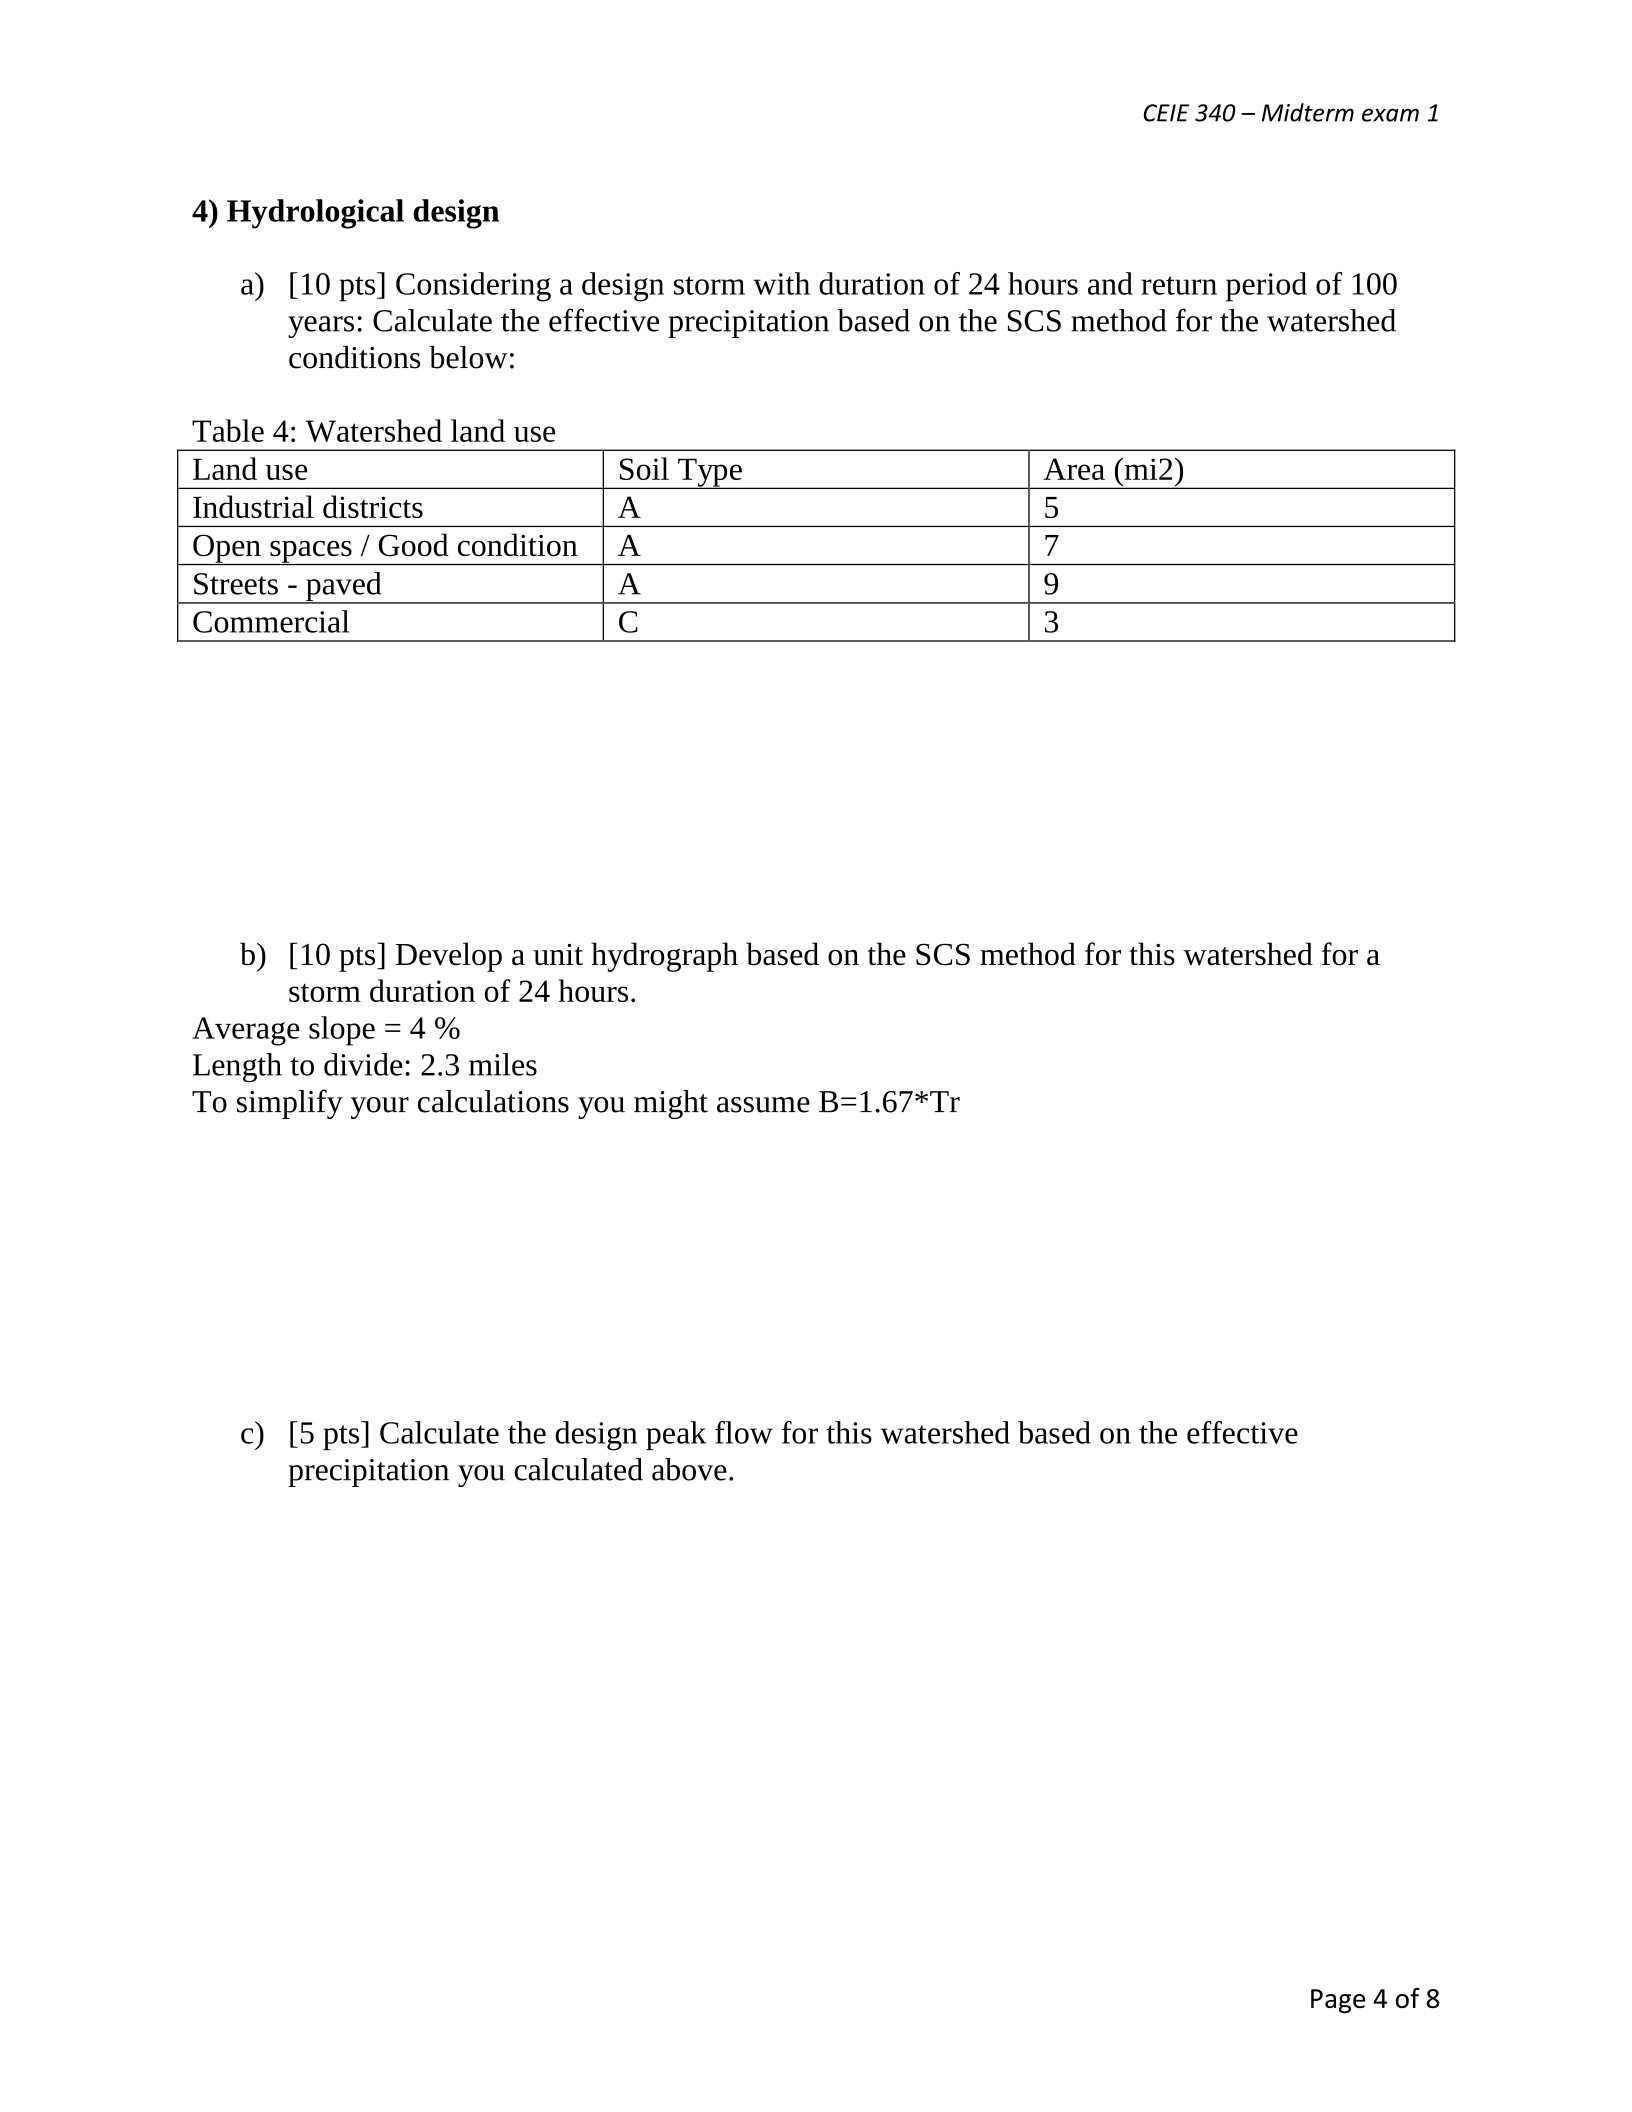
Table 4: Watershed land use
Land use
Soil Type
Area (mi2)
Industrial districts
A
5
Open spaces / Good condition
A
7
Streets - paved
A
9
Commercial
C
3
b) [10 pts] Develop a unit hydrograph based on the SCS method for this watershed for a
storm duration of 24 hours.
Average slope = 4 %
Length to divide: 2.3 miles
To simplify your calculations you might assume B=1.67*Tr
c) [5 pts] Calculate the design peak flow for this watershed based on the effective
precipitation you calculated above.
CEIE 340 – Midterm exam 1
Page 5 of 8
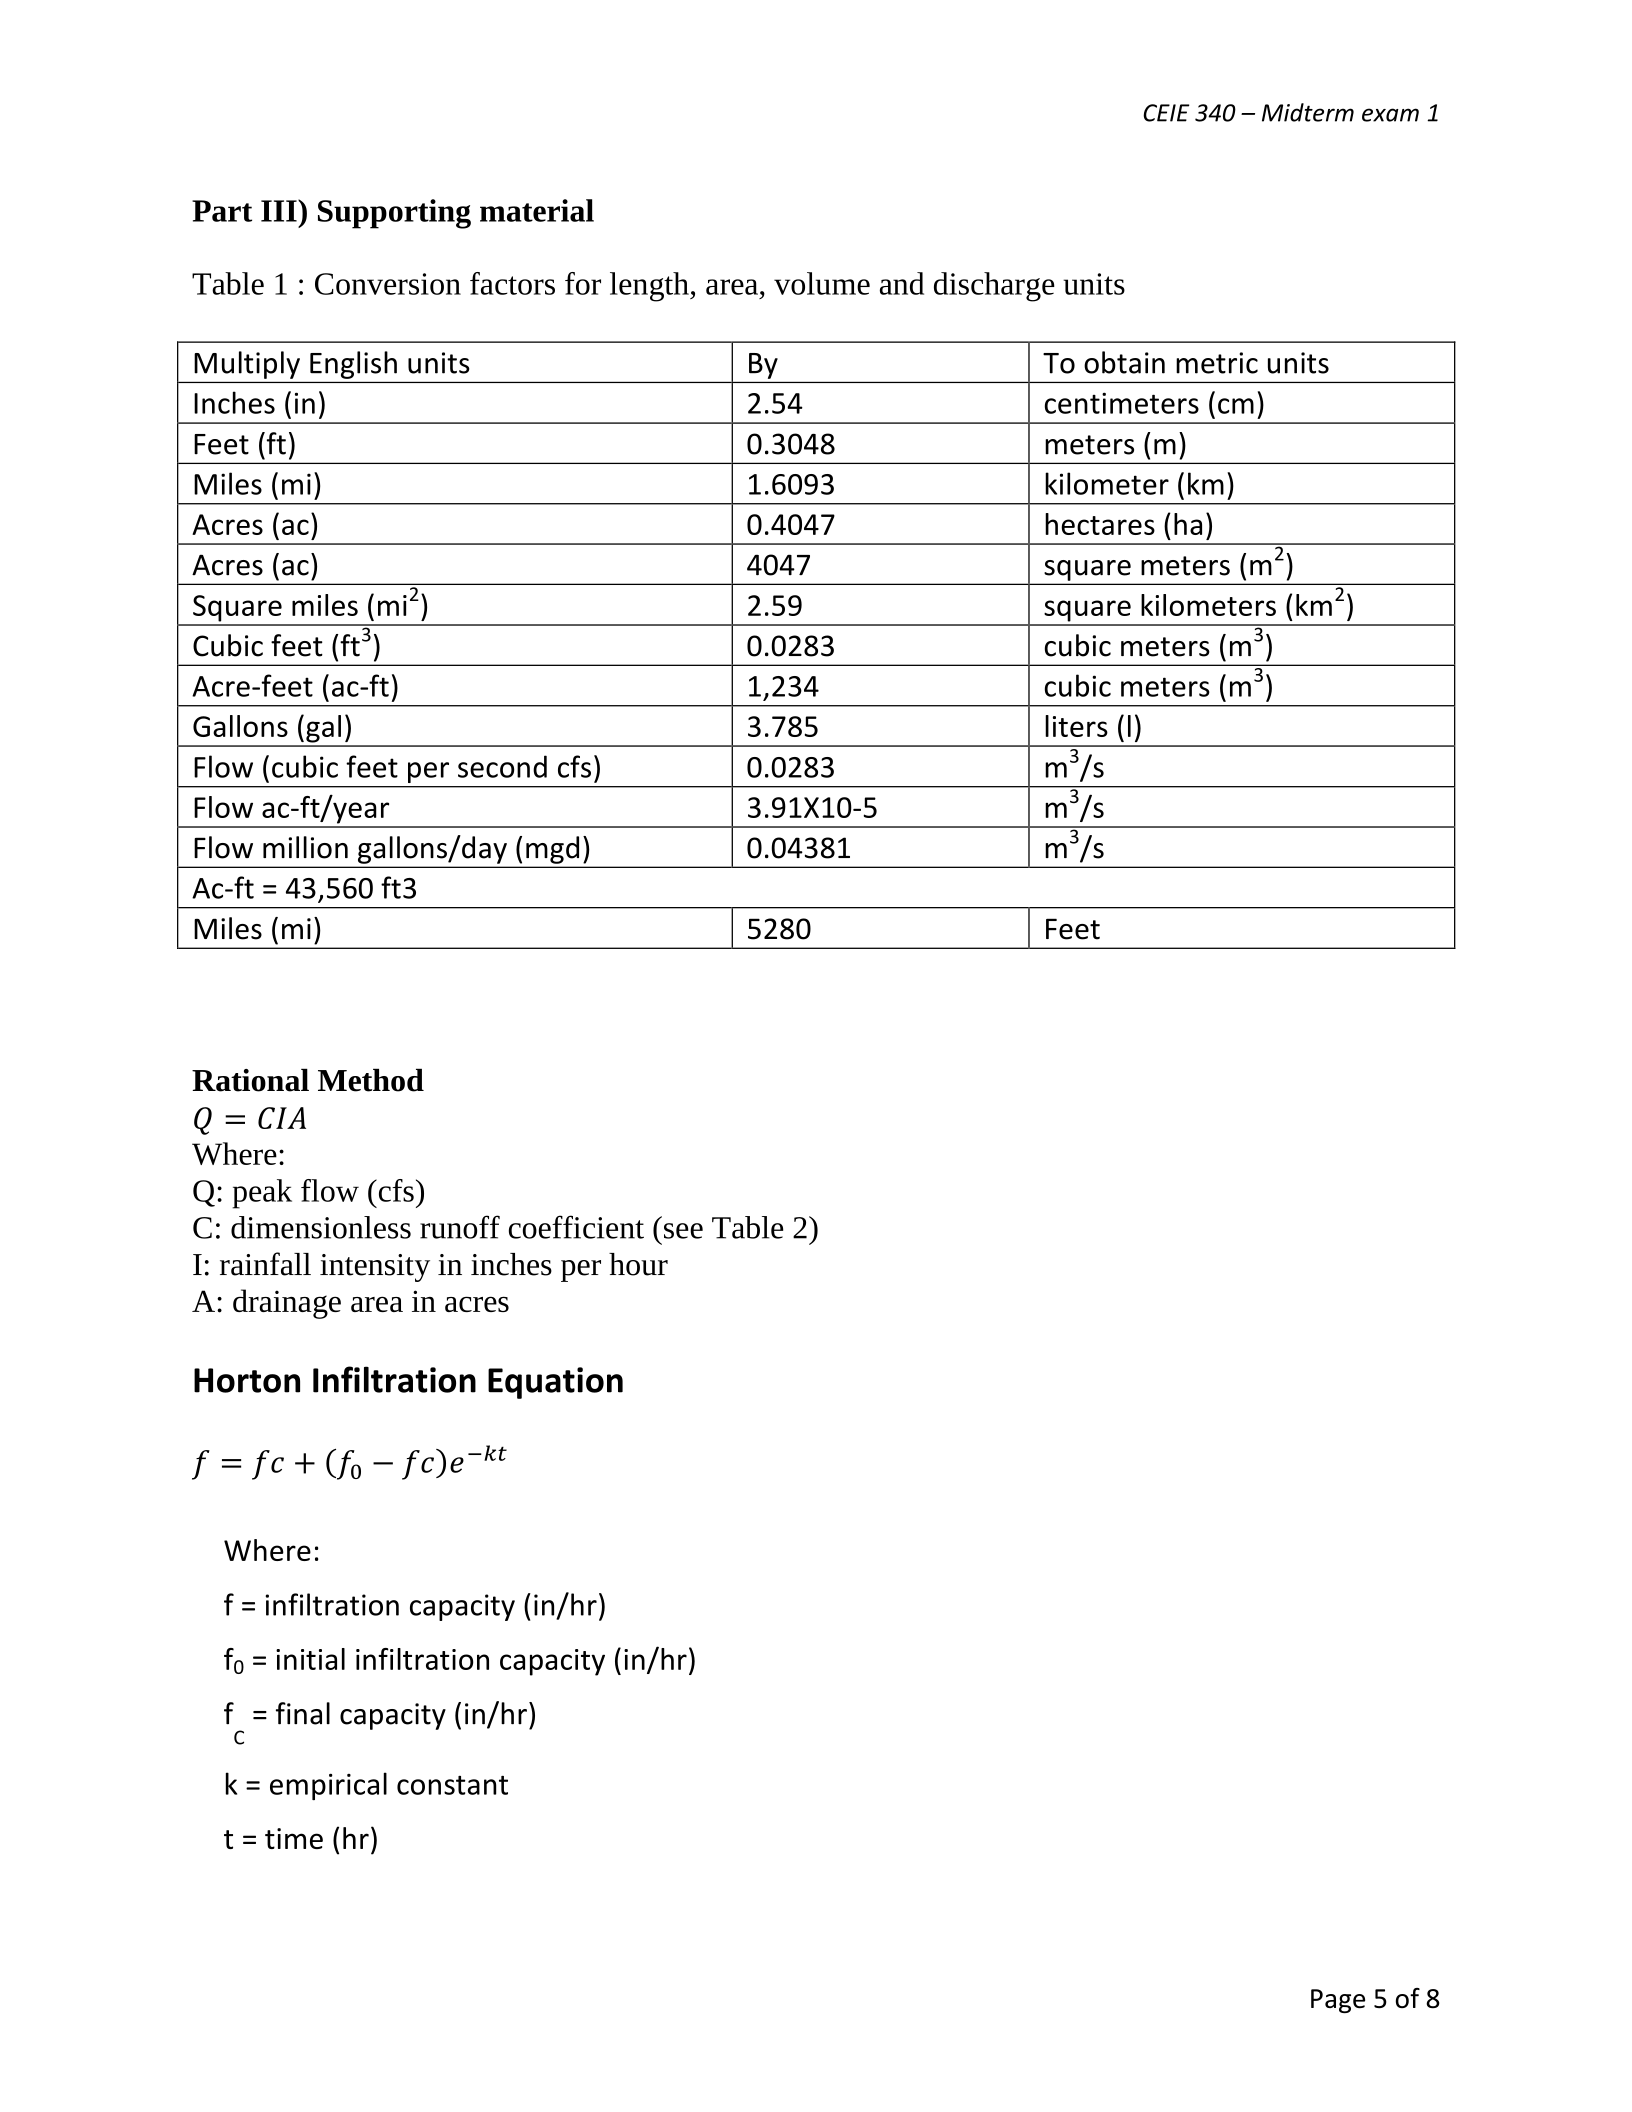
Part III) Supporting material
Table 1 : Conversion factors for length, area, volume and discharge units
Multiply English units
By
To obtain metric units
Inches (in)
2.54
centimeters (cm)
Feet (ft)
0.3048
meters (m)
Miles (mi)
1.6093
kilometer (km)
Acres (ac)
0.4047
hectares (ha)
Acres (ac)
4047
square meters (m2)
Square miles (mi2)
2.59
square kilometers (km2)
Cubic feet (ft3)
0.0283
cubic meters (m3)
Acre-feet (ac-ft)
1,234
cubic meters (m3)
Gallons (gal)
3.785
liters (l)
Flow (cubic feet per second cfs)
0.0283
m3/s
Flow ac-ft/year
3.91X10⁻⁵
m3/s
Flow million gallons/day (mgd)
0.04381
m3/s
Ac-ft = 43,560 ft3
Miles (mi)
5280
Feet
Rational Method
𝑄 = 𝐶𝐼𝐴
Where:
Q: peak flow (cfs)
C: dimensionless runoff coefficient (see Table 2)
I: rainfall intensity in inches per hour
A: drainage area in acres
Horton Infiltration Equation
𝑓 = 𝑓𝑐 + (𝑓
0− 𝑓𝑐)𝑒−𝑘𝑡
Where:
f = infiltration capacity (in/hr)
f0 = initial infiltration capacity (in/hr)
fC = final capacity (in/hr)
k = empirical constant
t = time (hr)

CEIE 340 – Midterm exam 1
Page 6 of 8
SCS Method Equations
𝑃𝑒 =(𝑃 − 0.2𝑆)2
𝑃 + 0.8𝑆
𝑡𝑝 =𝐿0.8(𝑆 + 1)0.7
1900√𝑦
𝑆 = 1000
𝐶𝑁 −10
𝑄𝑝 =484𝐴
𝑇𝑟
𝑇𝑟 =𝐷
2+𝑡𝑝
𝑉𝑜𝑙 = 𝑄𝑝 𝑇𝑟
2+𝑄𝑝 𝐵
2
where:
Pe: Effective precipitation
P: Total precipitation
tp: lag time (hr)
Tr: Time of rise (hrs)
D: Rainfall duration (hrs)
L: length to divide (ft)
Y: average watershed slope (percent)
S: potential maximum retention (dimensionless)
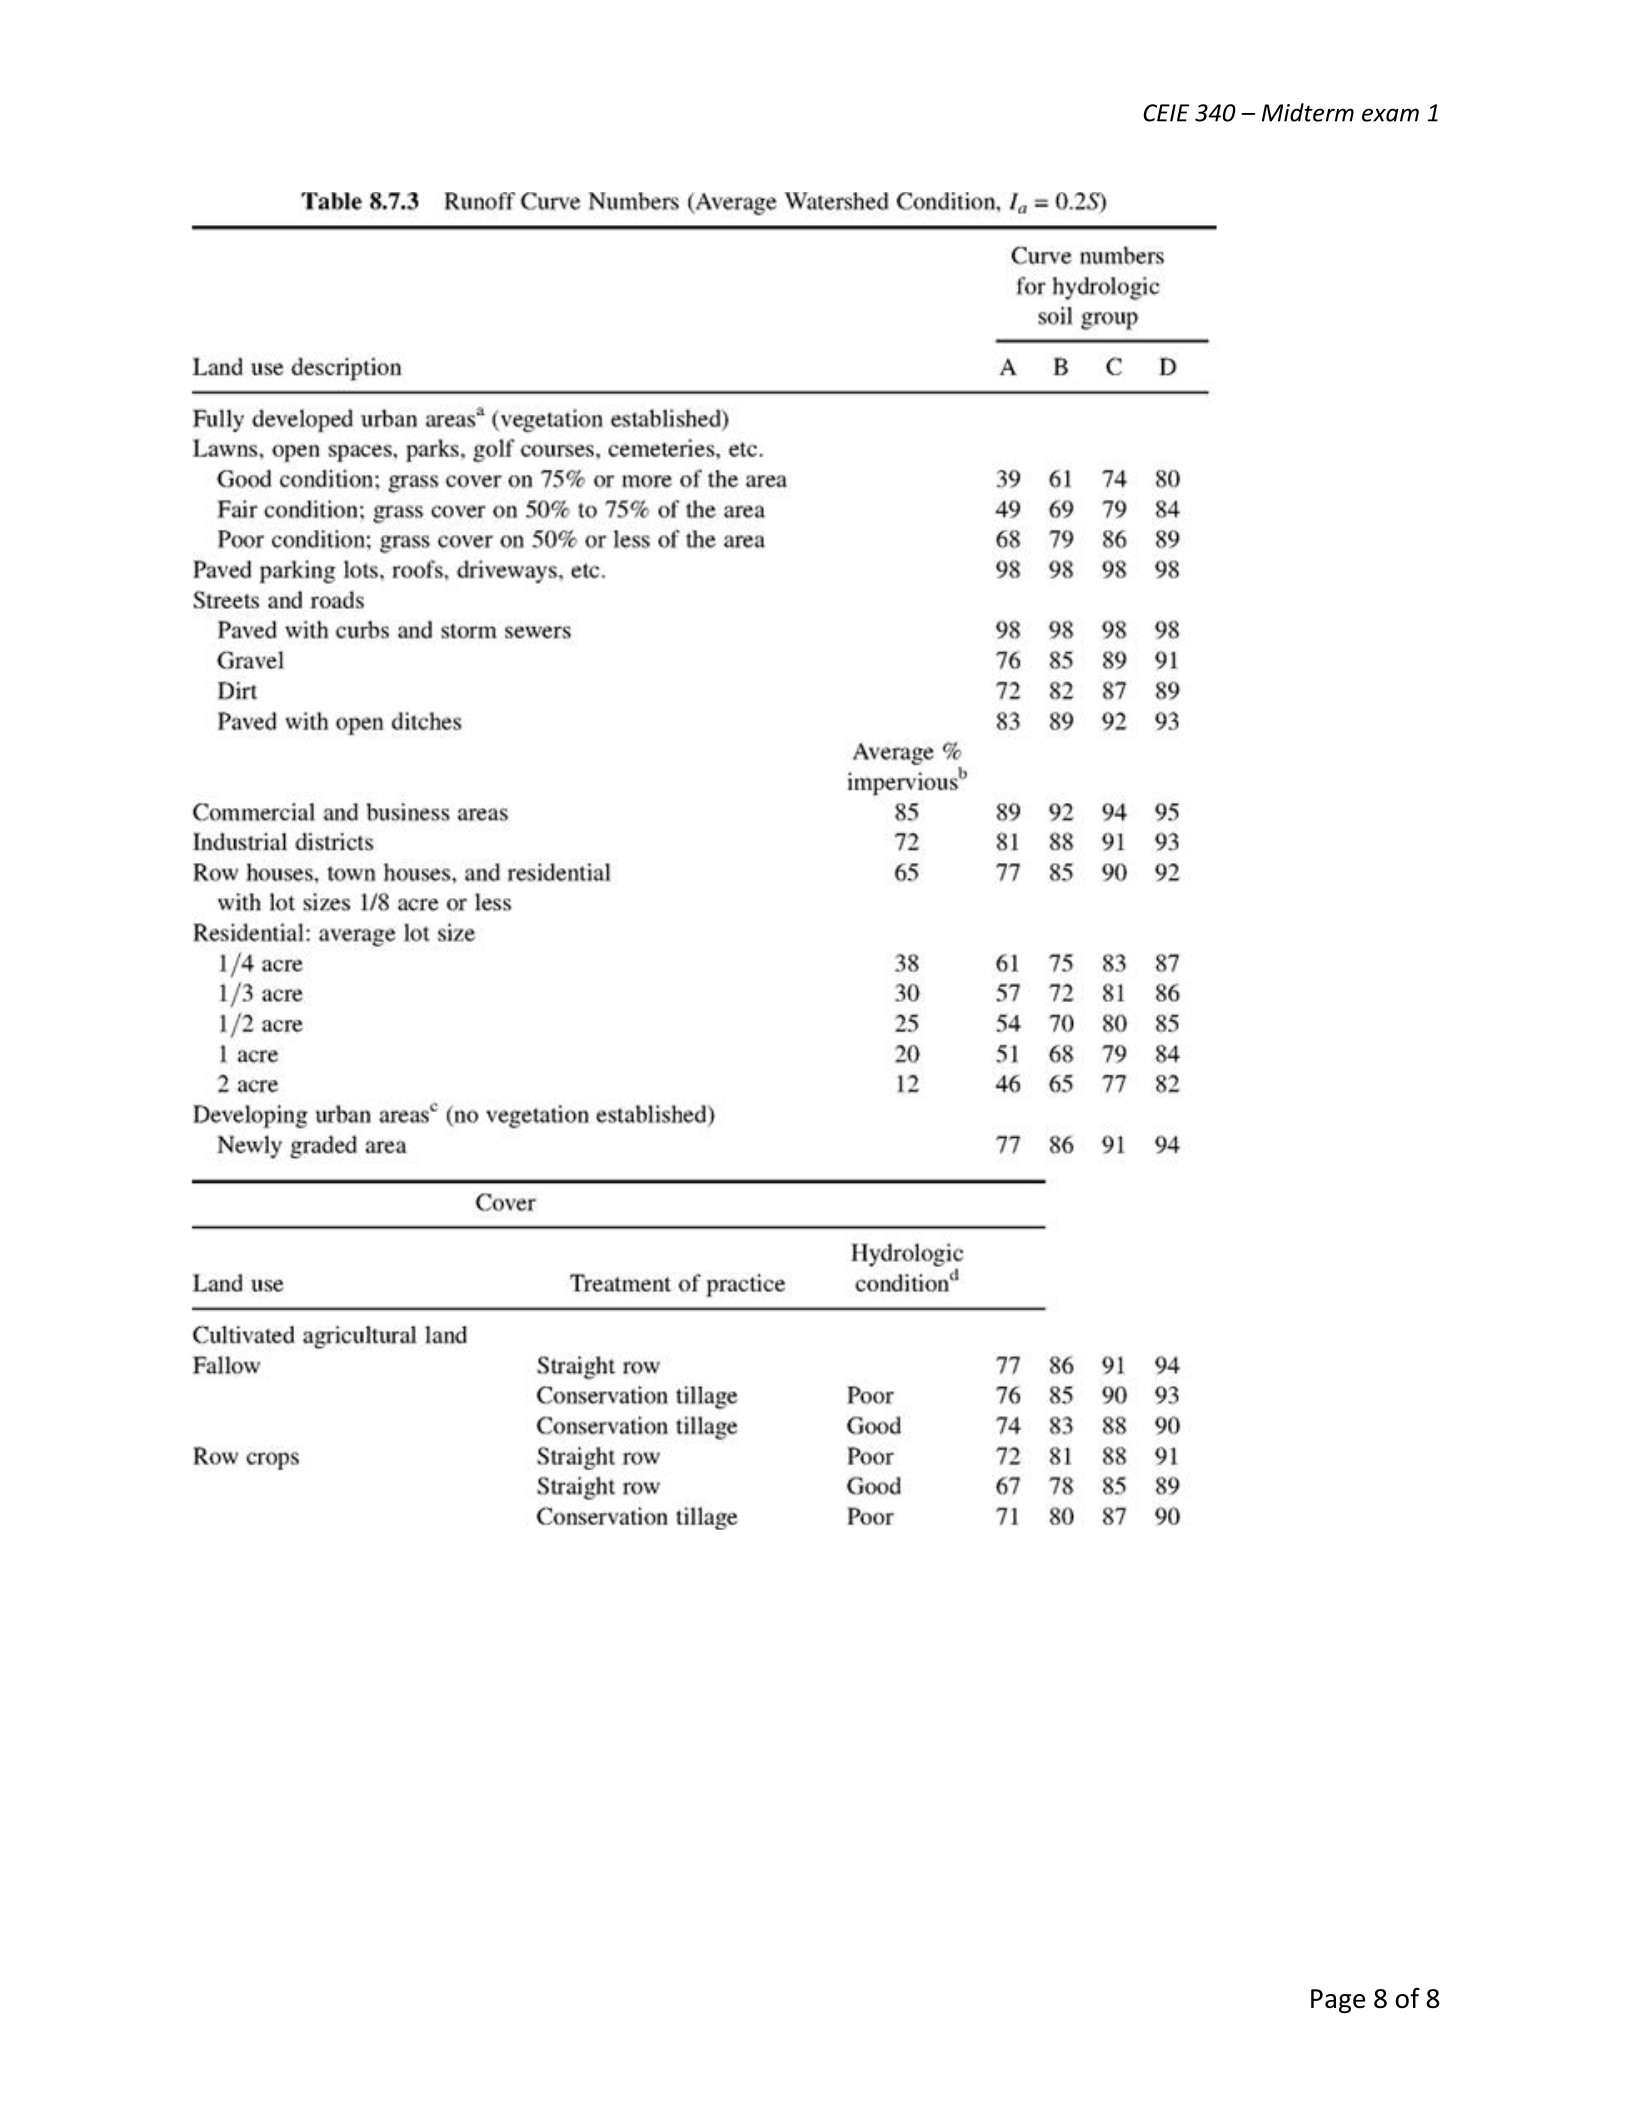
A: area (mi2)
B: Time of fall (hrs)
CN is Runoff curve number

Rainfall
intensity
(in./hr)
20.0
15.0
10.0
8.0
6.0
4.0
»
S
er
no
0.6
S
z
S
&
01
0.08
0.06
0.04
0.02
10
Houston,
Texas,
1910-1951
Note:
Frequency
analysis
by
method
of
extreme
values,
after
Gumbel
(1958)
=
’m
Sr)
15
20 30 40 60
2 3
456
810
12 18
24
(min)
(br)
Duration
Copyright
©2013
Pearson
Education,
publishing
as
Prentice
Hall
CEIE 340 – Midterm exam 1
Page 7 of 8