


Demand
When we talk about the “demand” for a product, we mean more than
the desire to simply have or to own the item. In order for demand to be
counted in the marketplace, desire must be coupled with the ability and
willingness to pay for it. Only those people with demand—the desire, ability,
and willingness to buy a product—can compete with others who have
similar demands.
Demand is a microeconomic concept. Microeconomics is the part of
economic theory that deals with behavior and decision making by individual
units, such as people and firms. Collectively, our microeconomic concepts
help explain how prices are determined and how individual economic
decisions are made.
An Introduction to Demand
In a market economy people and firms act in their own best interests to
answer the basic WHAT, HOW, and FOR WHOM questions. Demand is
central to this process, so an understanding of the concept of demand is
essential if we are to understand how the economy works.
Demand Illustrated
Fortunately, the concept of demand is easy to understand because it
involves only two variables—the price and quantity of a specific product at a
given point in time. For example, we might want to know how many people
would want to see a movie on a given afternoon if the price was $5. Or we
might want to know how many would want to view it if the price was $10. The
answers would depend on a number of things, including the number of
people living in the area, the number and types of other movies that were
playing at the same time, and of course the popularity of the movie itself. But
in the end, everything would be measured in terms of prices and quantities.
The Individual Demand Schedule
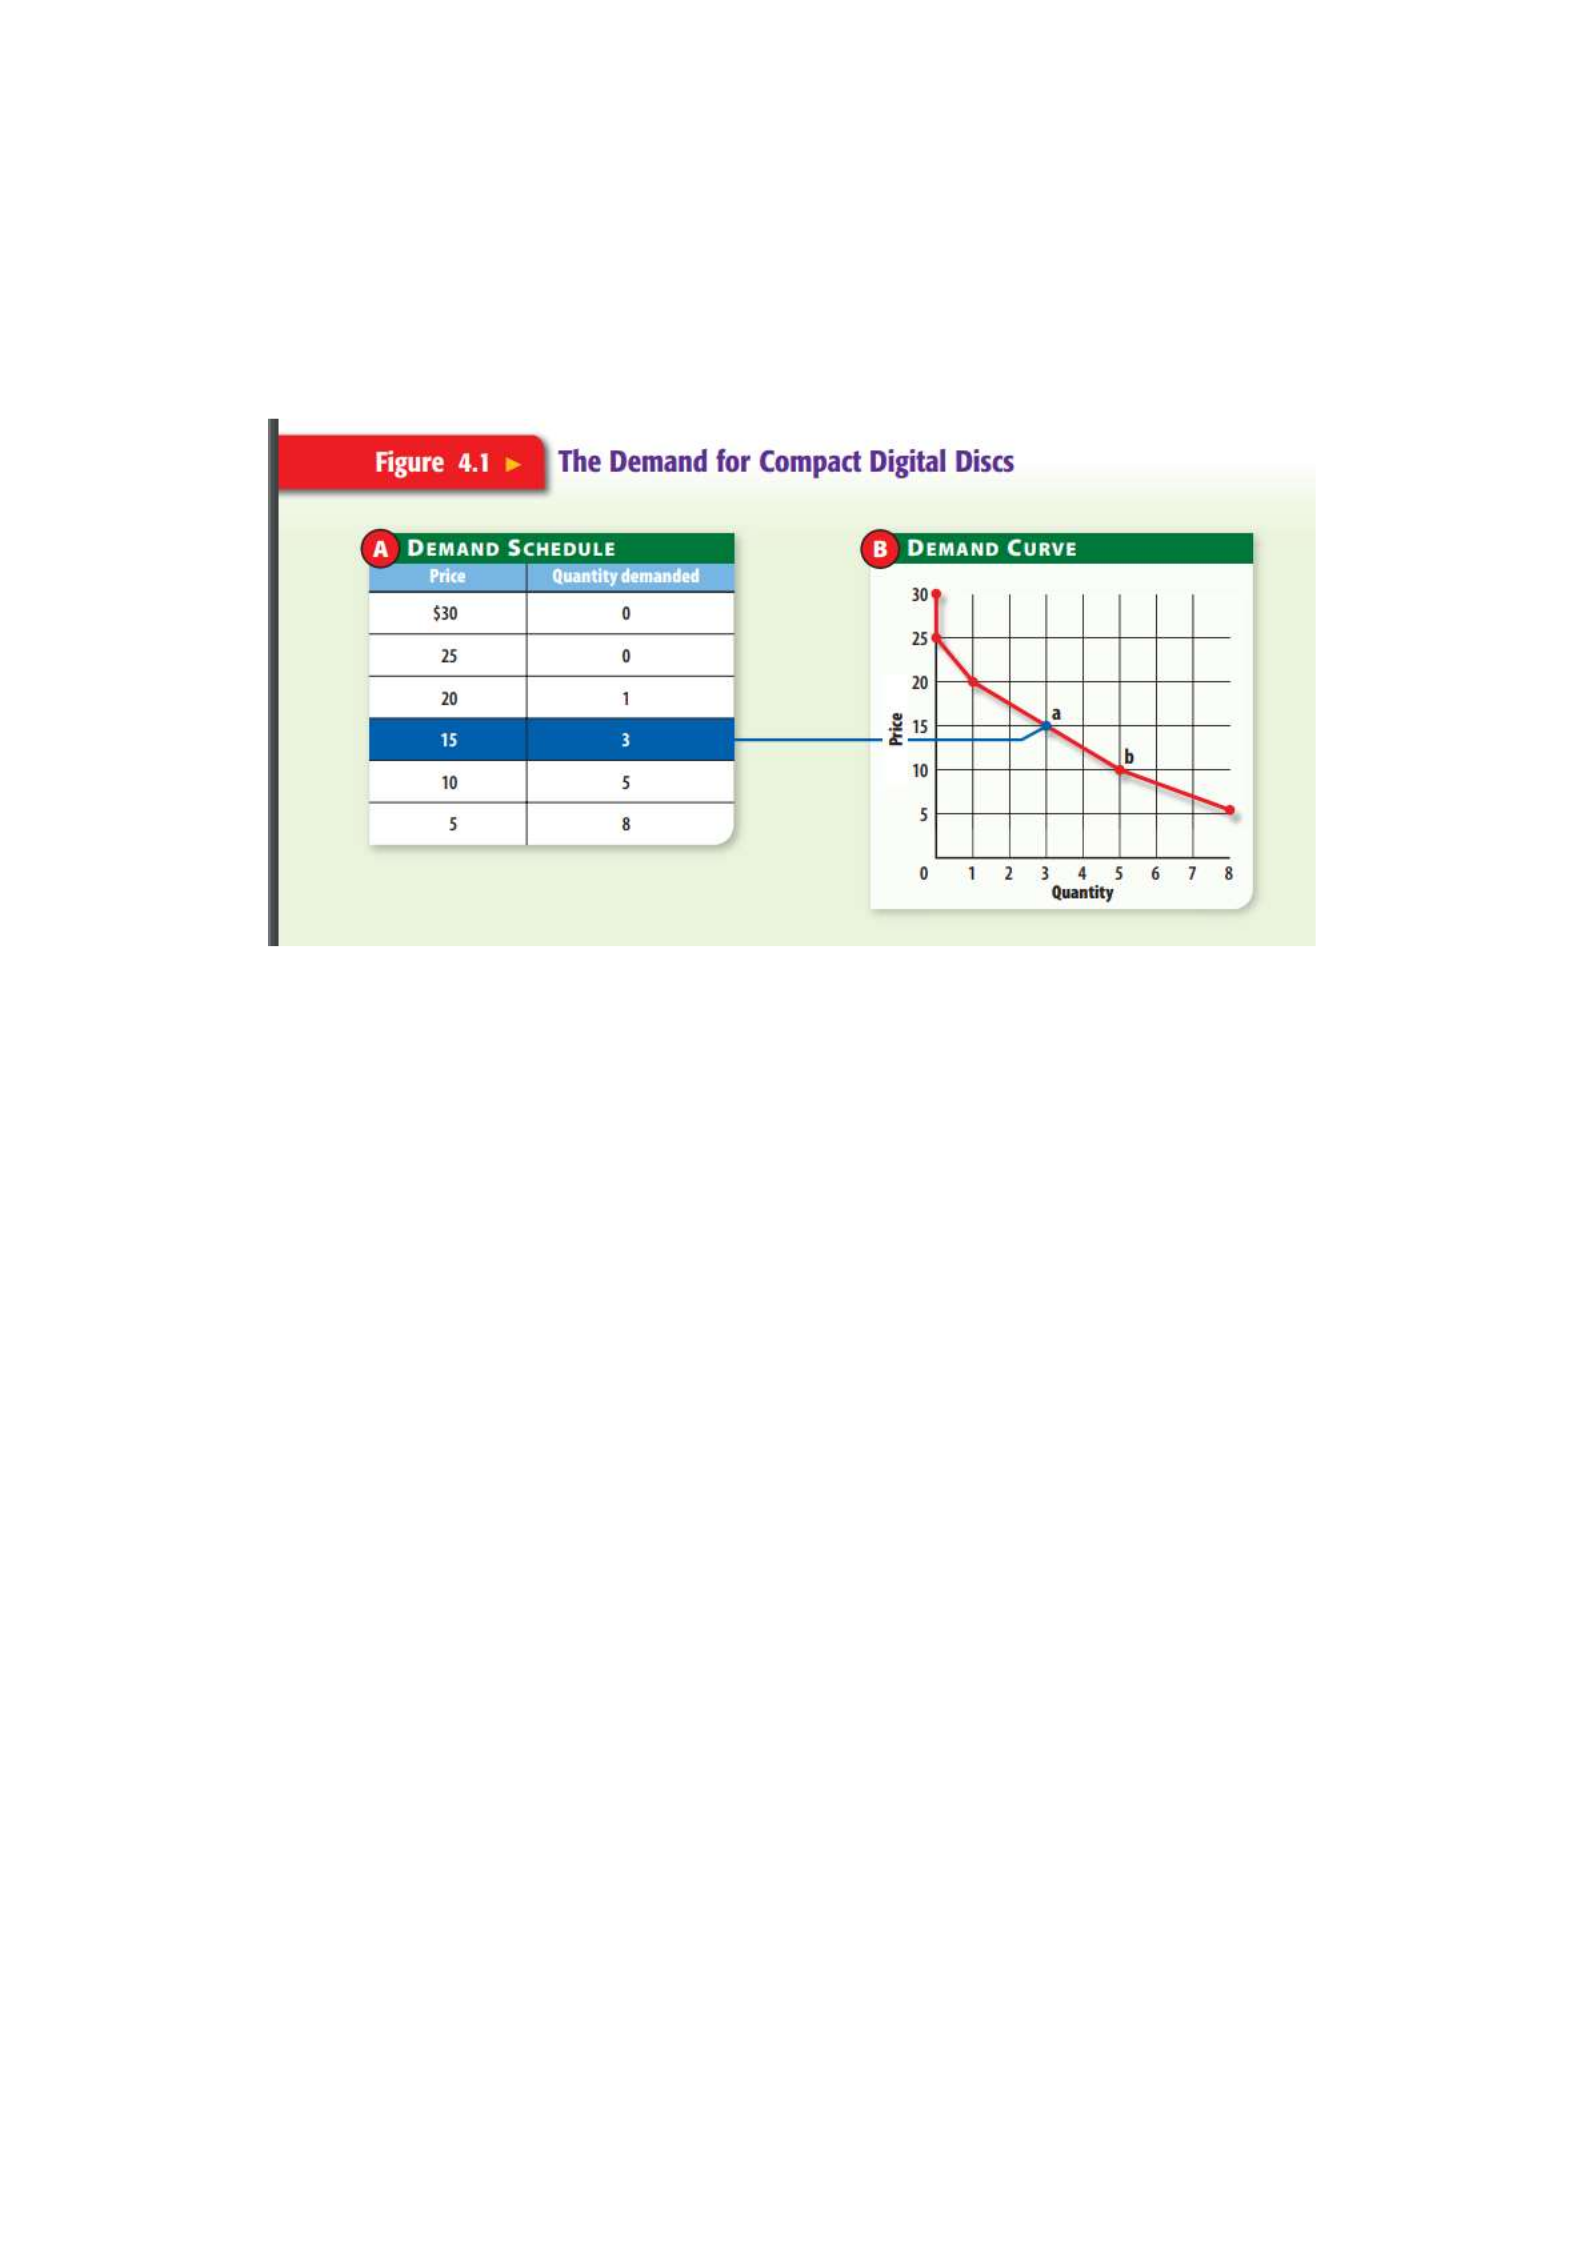
To see how an economist would analyze demand, look at Panel A in
Figure 4.1. It shows the amount of a product that a consumer, whom we’ll
call Mike, would be willing and able to purchase over a range of possible
prices that go from $5 to $30. The information in Panel A is known as a
demand schedule. The demand schedule shows the various quantities
demanded of a particular product at all prices that might prevail in the
market at a given time.
As you can see, Mike would not buy any CDs at a price of $25 or $30, but
he would buy one if the price fell to $20, and he would buy three if the price
was $15, and so on. Just like the rest of us, he is generally willing to buy more
units of a product as the price gets lower.
The Individual Demand Curve

The demand schedule in Panel A of Figure 4.1 can also be shown
graphically as the downward-sloping line in Panel B. All we have to do to is to
transfer each of the price-quantity observations in the demand schedule to
the graph, and then connect the points to form the curve. Economists call
this the demand curve, a graph showing the quantity demanded at each and
every price that might prevail in the market. For example, point a in Panel B
shows that Mike purchased three CDs at a price of $15 each, while point b
shows that he will buy five at a price of $10. The demand schedule and the
demand curve are similar in that they both show the same information—one
in the form of a table and the other in the form of a graph.
The Law of Demand
The prices and quantities in Figure 4.1 point out a feature of demand:
for practically every good or service that we might buy, higher prices are
associated with smaller amounts demanded. Conversely, lower prices are
associated with larger amounts demanded. This is known as the Law of
Demand, which states that the quantity demanded varies inversely with its
price. When the price of something goes up, the quantity demanded goes
down. Likewise, when the price goes down, quantity demanded goes up.
Why We Call it a ‘Law’
Expressing something as a “law” may seem like a strong statement for
a social science like economics to make, but there are two reasons why
economists prefer to do so. First, the inverse relationship between price and
quantity demanded is something that we find in study after study, with
people almost always stating that they would buy more of an item if its price
goes down, and less if the price goes up. Second, common sense and simple
observation are consistent with the Law of Demand. This is how people

behave in everyday life—they normally buy more of a product at lower prices
than they do at higher ones. All we have to do is to note the increased
purchases at the mall whenever there is a sale. This is why economics is a
social science: because it is the study of the way we behave when things
around us change.
The Market Demand Curve
So far we have discussed a particular individual’s demand for a
product. Sometimes, however, we are more concerned with the market
demand curve, the demand curve that shows the quantities demanded by
everyone who is interested in purchasing the product. Figure 4.2 shows the
market demand curve D for Mike and his friend Julia, the only two people
whom (for simplicity) we assume to be willing and able to purchase CDs. To
get the market demand curve, all we do is add together the number of CDs
that Mike and Julia would purchase at every possible price. Then, we simply
plot the prices and quantities on a separate graph. To illustrate, point a in
Figure 4.2 represents the three CDs that Mike would purchase at $15, plus
the three that Julia would buy at the same price. Likewise, point b represents
the quantity of CDs that both would purchase at $10. The market demand
curve in Figure 4.2 is very similar to the individual demand curve in Figure
4.1. Both show a range of possible prices that might prevail in the market at
a given time, and both curves are downward sloping. The main difference
between the two is that the market demand curve shows the demand for
everyone in the market.
Demand and Marginal Utility
Economists use the term utility to describe the amount of usefulness or
satisfaction that someone gets from the use of a product. Marginal utility—

the extra usefulness or additional satisfaction a person gets from acquiring
or using one more unit of a product—is an important extension of this
concept because it explains so much about demand.
The reason we buy something in the first place is because we feel that
the product is useful and will give satisfaction. However, as we use more and
more of a product, we encounter diminishing marginal utility, the principle
which states that the extra satisfaction we get from using additional
quantities of the product begins to decline. Because of our diminishing
satisfaction, we usually are not willing to pay as much for the second, third,
fourth, and so on, as we did the first unit. This is why our demand curve is
downward-sloping, and this is why Mike and Julia won’t pay as much for the
second CD as they did for the first. Diminishing satisfaction happens to all
of us at some time. For example, when you buy a drink because you are
thirsty, you get the most satisfaction from the first purchase. Since you are
now less thirsty, you get less satisfaction from the second purchase, and
even less from the next, so you are not willing to pay as much for the second
and third purchases.

