


1
EXPERIMENTAL TESTS OF RAPID ECO-EVOLUTIONARY
DYNAMICS IN A PLANT- HERBIVORE SYSTEM
CHAPTER ONE: A GENERAL INTRODUCTION TO THE
STUDY OF RAPID ECO-EVOLUTIONARY DYNAMICS
ABSTRACT
In this introductory chapter I first briefly review the historical
development of the ‘new’ field of eco-evolutionary dynamics and
summarize current theoretical and empirical findings. I then present
the objectives of my dissertation and how these aim to address
outstanding questions in this emerging field of study.
BACKGROUND
Interactions between Ecology and Evolution
Ecology and evolutionary biology are fields that share a long and
complex history with periods of either strong integration or
independent development (Collins 1986). It has long been recognized
that ecology and evolution influence one another. For example, Darwin
(1859) described how ecological interactions, especially competition,
shapes the selective environments in which species evolve, and how
evolution will impact extinction and species distributions. Few
biologists would argue that evolution and ecology do not interact at
least on long timescales. As the fields of population ecology and

2
population genetics developed in the 1920s, they also grew apart
(Collins 1986). Population ecologists often ignored evolution, since
evolution was perceived to have little

3
impact, and population geneticists focused on how the ecological
environment causes evolution (Ford 1964). The classic evolutionary
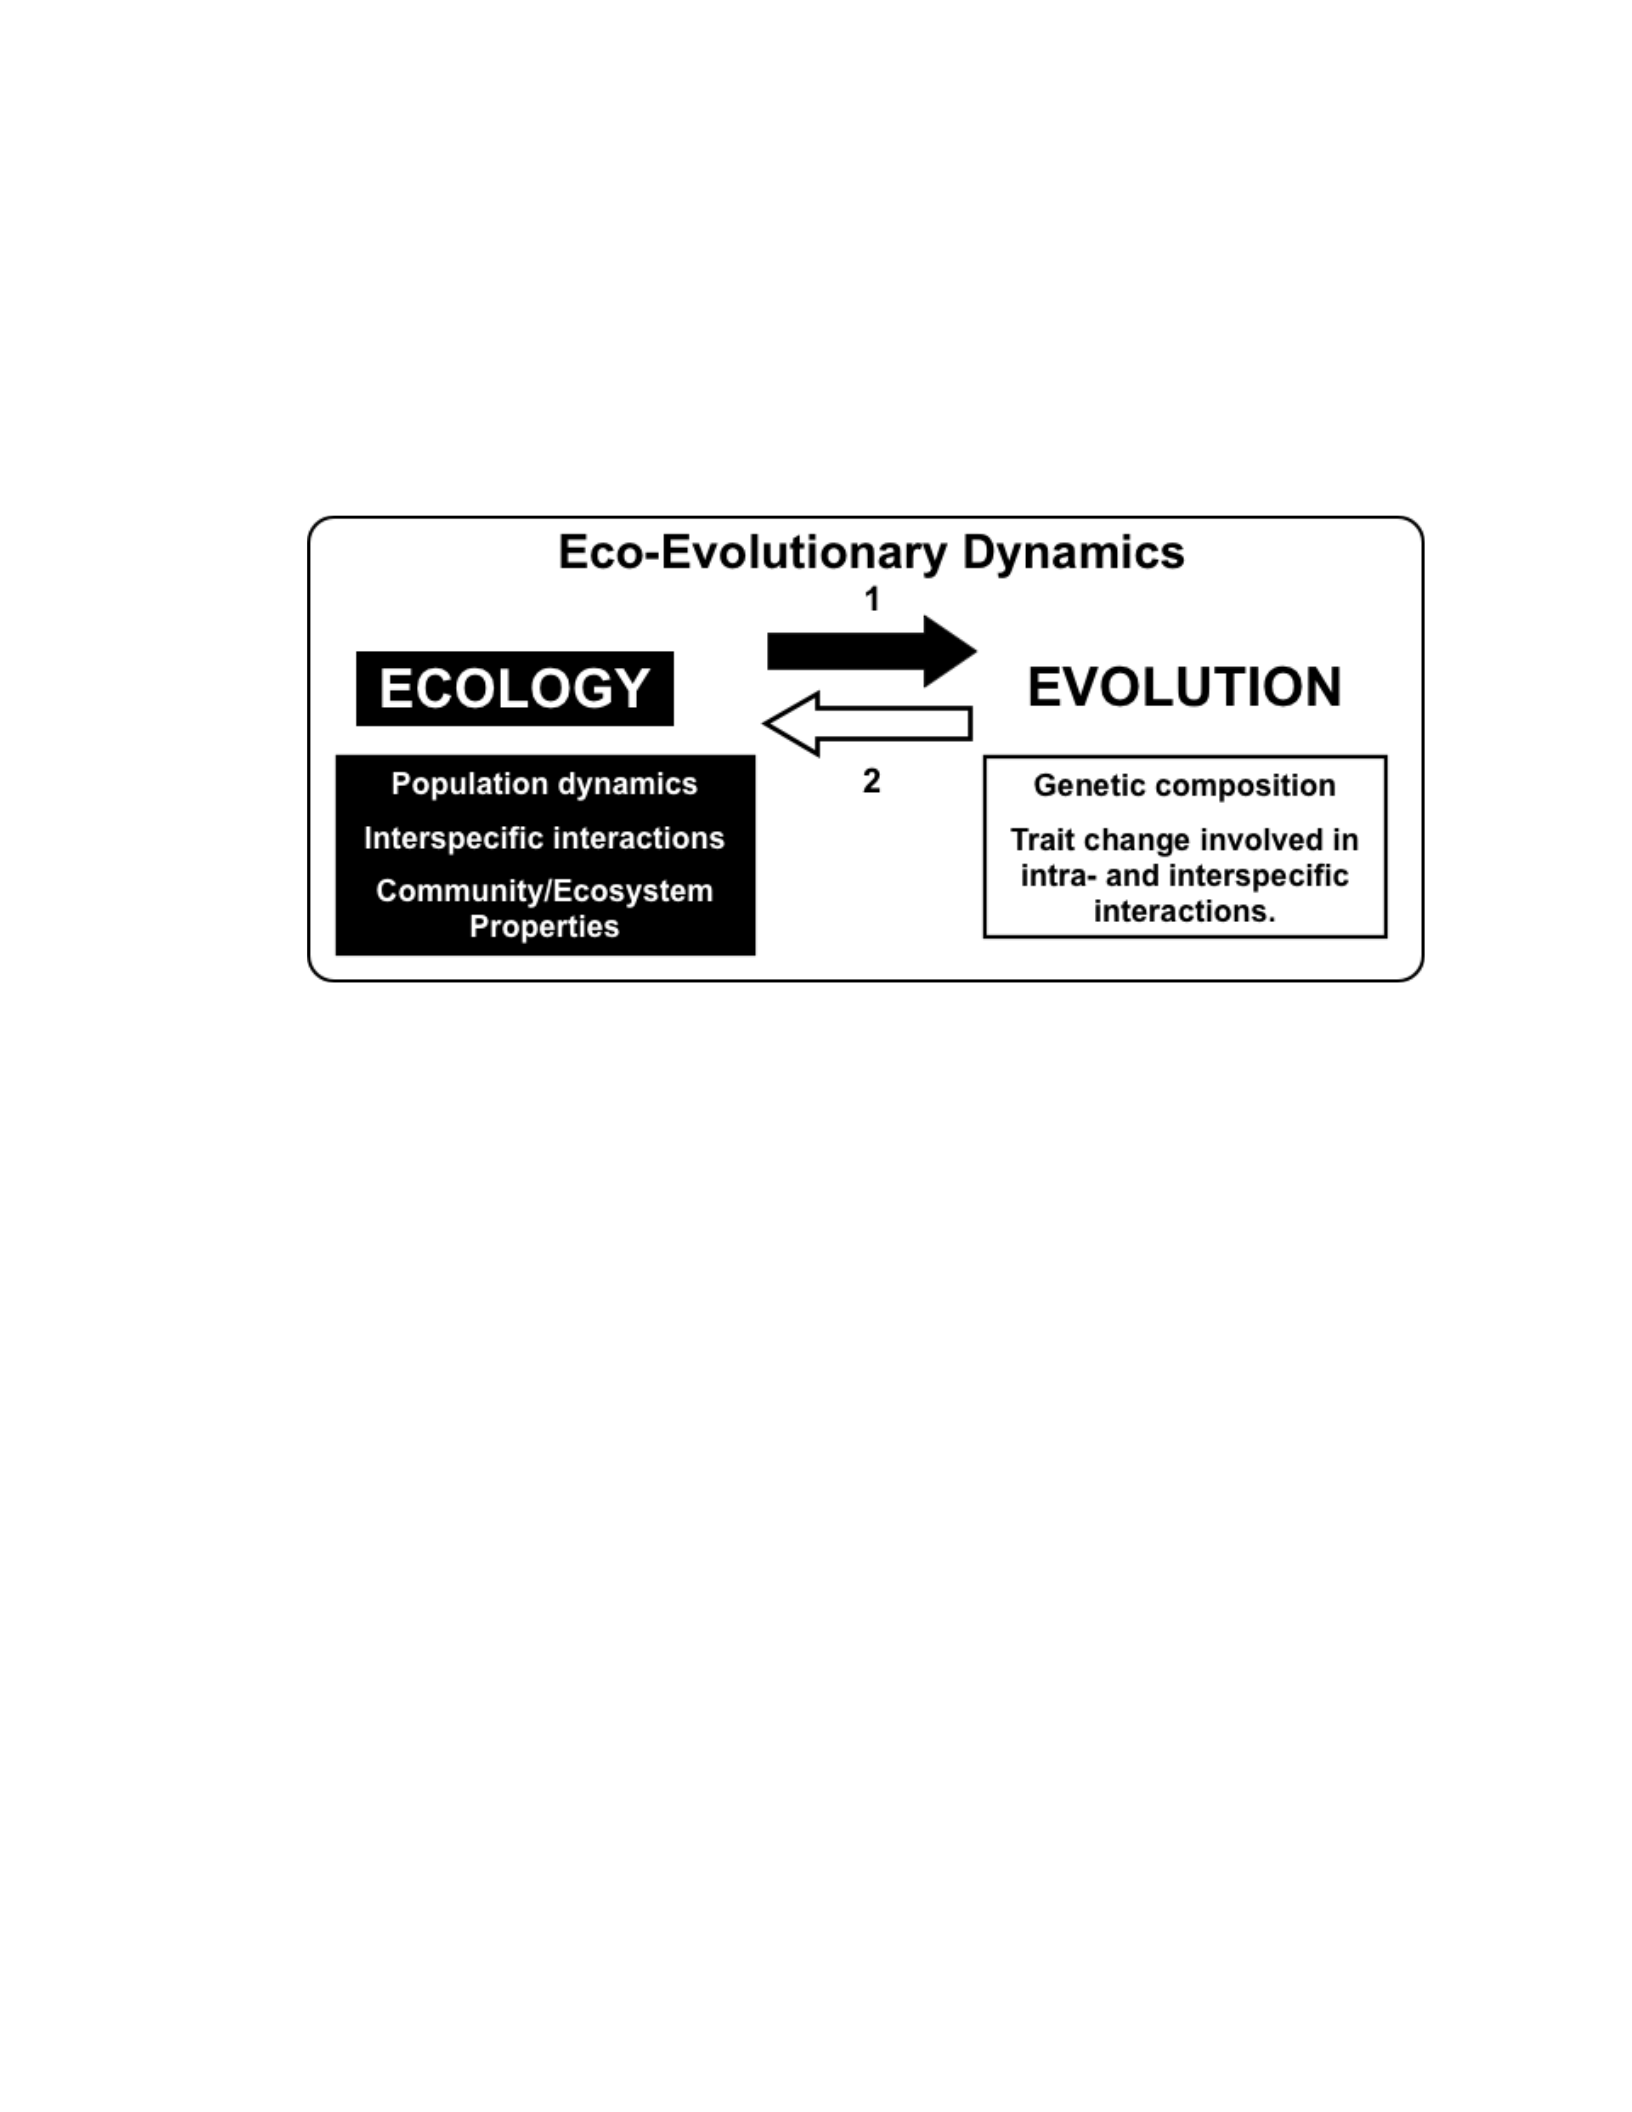
paradigm was established where ecology caused evolution (arrow 1 in
Fig. 1.1). The alternate causal pathway, where evolution impacts
ecology (arrow 2 in Fig. 1.1), was recognized but usually relegated to
long-term effects. For example speciation will impact species diversity
(Sax and Gaines 2003, Pelletier et al. 2009). This separation is still
enduring today as population genetics and population ecology are still
largely studied separately (Levins et al. 2003, Lewontin et al. 2003,
Hairston et al. 2005, Saccheri and Hanski 2006, Pelletier et al. 2009).
Two common assumptions in the ecological literature often
exclude any possible impact that evolution might have on short-term
population dynamics, dynamics occurring within a few dozen
generations or within 100 years (Thompson 1998, Hairston et al.
2005). First, populations are assumed to be genetically homogeneous
(Cappuccino and Price 1995, Sibly and Hone 2002, Hairston et al.
2005). Yet, within population genetic variation in ecologically
important traits has been demonstrated repeatedly since the 1960s
(Ayala 1968, Berry et al. 1978). Moreover, such variation can
significantly influence population dynamics in the laboratory (Schlager
1963, Leips et al. 2000) and in nature (Hanski and Saccheri 2006,
Hazell et al. 2006). Another, common assumption is that evolution

4
occurs on a much slower (and thus separate) timescale than short-
term ecological processes. Even if genetic variation is considered,
evolution is ignored because it is perceived to be too slow to have an
effect (Slobodkin 1980,

5
Endler 1991, Cappuccino and Price 1995, Hairston et al. 2005, Pelletier
et al. 2009). Thus most ecological studies assume that evolution is not
occurring and utilize non-evolving trait values in their models.
This assumption has now been challenged by dozens of studies
documenting rapid evolutionary changes in nature occurring on
‘ecological timescales’, sometimes within a few generations (Dyer
1968, Thompson 1998, Hendry and Kinnison 1999, Bone and Farres
2001, Reznick and Ghalambor 2001, Ashley et al. 2003). Rapid
evolution has been documented in many ecologically important traits
such as life-history traits, foraging traits, morphological traits,
phenology, and enemy resistance traits and has been documented in
many major taxonomic groups including fish, arthropods, microbes,
mammals, vascular and non-vascular plants, lizards, amphibians, and
mollusks. These findings have led some researchers to reexamine how
evolution and ecology interact given that the arbitrary distinction of
ecological and evolutionary time is no longer valid.
Rapid Eco-Evolutionary Dynamics
Although biologists have been studying the interactions between
ecology and evolution the reason this topic is currently receiving
renewed interest is that it focuses primarily on interactions occurring
on short timescales that have traditionally been overlooked (reviewed

6
in Hairston et al. 2005, Fussmann et al.
2007, Johnson and Stinchcombe 2007, Pelletier et al. 2009, Schoener
2011).

7
This current field of study is called ‘Eco-Evolutionary Dynamics’ and
emphasizes the reciprocal and concurrent interactions between
ecology and evolution and is the focus of my dissertation. Eco-
evolutionary dynamics differs from other sub- categories of
evolutionary-ecology because it focuses not on how the ecological
environment causes evolution, i.e. ecological genetics (Ford 1964), but
on how genetic variation and rapid evolution impact ecology
(population dynamics, community structure, ecosystem functioning…).
Yet the ultimate goal of eco- evolutionary dynamics is to study how
evolutionary and ecological dynamics causally influence each other at
the same time and how this might alter both ecological and
evolutionary outcomes (full cyclical causality, Fig. 1.1; Bull et al. 2006,
Kokko and Lopez-Sepulcre 2007, Ezard et al. 2009, Pelletier et al.
2009).
Previous Studies of Eco-Evolutionary Dynamics
Theoretical studies, investigating eco-evolution dynamics, date
back at least 50 years (Pimentel 1961) and since then have diversified
into different approaches, based on very different biological
assumptions (reviewed in Bergelson et al. 2001, Abrams 2005, Day
2005, Fussmann et al. 2007). Eco- evolutionary dynamic models allow
ecological and evolutionary processes to interact and assess how such

8
interactions influence ecological and evolutionary dynamics. Such eco-
evolutionary dynamics have been shown to influence the trajectory of
growth of single populations (Anderson and King 1970), the density
and stability of victim-exploiter systems (Pimentel 1961, Fussmann et
al. 2003,

9
Bull et al. 2006, Duffy and Sivars-Becker 2007), the structure of multi-
species communities (Loeuille and Leibold 2008), and even ecosystem
processes (Loeuille et al. 2002). Overall these theoretical studies, by
comparing models with and without evolution, overwhelmingly
demonstrate that eco-evolutionary dynamics can qualitatively and
quantitatively alter ecological and evolutionary outcomes (Day 2005,
Fussmann et al. 2007). Yet, empirical studies of such interactions are
still very rare and most of this body of theory remains untested
(Fussmann et al. 2007).
One sub-discipline of eco-evolutionary dynamics, called
‘Community Genetics,’ (Antonovics 1992) explores how genetic variation,
mostly in plants, influences the structure and composition of arthropod
communities they support, how it influences competition with other
plant species, and ecosystem fluxes (Agrawal 2003, Johnson and
Agrawal 2005, Whitham et al. 2006, Hughes et al. 2008, Bailey et al.
2009). These studies show the strong influence of intraspecific
genetically based variation and suggest that if evolution changed the
frequency of plant genotypes then evolutionary dynamics would
influence ecological dynamics (Johnson et al. 2009). A similar approach
consists of post-hoc comparisons of the ecological properties of
populations thought to have undergone recent evolutionary
diversification. Such studies assess how evolution has altered life

10
history traits (Reznick and Bryga 1996), population dynamics (Hanski
and Saccheri 2006), community structure (Post et al. 2008) and
ecosystem processes (Bassar et al. 2010). These two empirical
approaches

11
however have yet to quantify the impact of evolution as it occurs and
thus could miss dynamic aspects of the eco-evolutionary interactions.
Empirical studies have also studied try to explain ecological
changes using models that include evolutionary change (Anderson and
May 1982, Tuda 1998, Sinervo et al. 2000, Hairston et al. 2005, Duffy
and Sivars-Becker 2007, Ezard et al. 2009). In such studies, rapid
evolution is usually strongly correlated and ecological predictions are
usually significantly improved by including evolutionary dynamics. For
example, an ecological model correctly predicted the start date of
epidemic parasitic outbreaks in natural Daphnia populations but failed
to predict their termination (Duffy et al. 2005). An evolutionary-
ecological model where susceptibility evolved, correctly predicted the
date of termination (Duffy and Sivars-Becker 2007). Although these
observational studies establish the generality of evolutionary-
feedback, they remain correlational and only suggest causality.
The Experimental Approach in Eco-Evolutionary Dynamics
The experimental approach quantifies the causal impact of rapid
evolution as populations evolve compared to populations that cannot.
This approach addresses the limitations of the methods above since
they tract evolution as it occurs and can establish causality. Pimentel
first used this approach to show how the population dynamics of a

12
parasitoid wasp were changed as its housefly host evolved resistance
compared to a non-evolving control (Pimentel et al.

13
1963, Pimentel and Al-Hafidh 1965, Pimentel 1968). By replacing the
control housefly population every generation, he prevented the
evolution of resistance. Rapid evolution within a few years in the host
reduced the parasitoid’s population size and variance even though
host population size was held constant. This experimental approach
has only been attempted a handful of times (Bohannan and Lenski
1999, Fussmann et al. 2003, Agashe 2009, Terhorst et al. 2010).
Some experimental systems have quantified the full feedback cycle,
where both ecological and evolutionary dynamics influence each other
concurrently. In Yoshida et al.’s (2003) study of rotifers and algae in
chemostats, rapid evolution in algae caused the predator-prey
population dynamics to change from being 1/4 out-of-phase to being
perfectly out-of-phase. This was caused by a change in the frequency
of resistant algal clones that increased the density of algae while
reducing that of the rotifer predator (evolution impacting ecology).
Then because of frequency and density-dependent clonal selection the
faster growing, but less defended algal clone, increased in frequency
leading to increased predation and lower algal density resetting the
cycle (ecology impacting evolution; Shertzer et al. 2002, Yoshida et al.
2003, Yoshida et al. 2004). These empirical studies demonstrate how
evolutionary dynamics and genetic variation influence the dynamics
and outcome of short-term ecological phenomena and argue

14
convincingly for causality, but only under carefully controlled
laboratory conditions.

15
DISSERTATION OBJECTIVES
My overall objective was to develop a study system wherein I
could manipulate rapid evolution experimentally, altering its
occurrence and rate. I could then use this system to experimentally
assess the conditions under which eco-evolutionary dynamics are
occurring, dissect how they operate, quantify their impact, and
eventually determine their importance compared to other ecological
processes. Although much progress is being made in the study of eco-
evolutionary dynamics many outstanding questions remain that my
dissertation aims to address.
Plant-herbivore interactions are thought to be one of the most
common and important ecological interactions, generating much of the
species and phenotypic diversity in nature as well as having immense
economic importance (Ehrlich and Raven 1964, Futuyma and Agrawal
2009). Yet none of the experimental model systems used in eco-
evolutionary dynamics, where evolution is manipulated, to my
knowledge utilize a plant-herbivore system (except one study of
herbivorous spider mites but it was not framed in this context Agrawal
2000). All other studies use predator-prey (Fussmann et al. 2003,
Yoshida et al. 2003, Terhorst et al. 2010) or host-parasitoid systems
(Pimentel 1968, Tuda 1998, Bohannan and Lenski 2000) exclusively.
The eco-evolutionary dynamics in plant-herbivore systems could

16
differ greatly from those observed in predator-prey or host-parasitoid
interactions. Herbivore dynamics, especially those of pest species can
often be in non-

17
equilibrium states (Wallner 1987, Karley et al. 2004). Also insect
herbivores usually have a weaker impact on plant population dynamics
than do predators on predator-prey dynamics because herbivores do
not necessarily kill their host. The magnitude of impact of insect
herbivores on plant population dynamics has been debated for years
(Crawley 1989) and only in the last decade have a dozen or so studies
found support for this (Maron and Crone 2006). Finally, it is important
to study eco-evolutionary dynamics in plant-herbivore systems
because of the immense economic importance these processes might
have if they alter our ability to accurately predict pest population
dynamics and pest evolution. Thus my first objective was to develop a
plant-herbivore system to study eco- evolutionary dynamics. My first
chapter describes the selected study system, consisting of a local
aphid-mustard population. I then genetically characterized the aphid
population by identifying neutral genetic variation that could be used
to identify and track aphid clones. My next objective was to
ecologically characterize the clones and identify ecologically relevant
trait variation that could be manipulated in order to prevent or induce
rapid evolution in future experiments.
Chapter 2 addressed my second objective, which was to quantify the
impact of rapid evolution on concurrent ecological dynamics (arrow 2 in
Fig. 1.1). This aspect of eco-evolutionary dynamics has received less

18
attention than the impact of ecology on evolution (Bull et al. 2006,
Ezard et al. 2009, Pelletier et al. 2009). In order to establish causality I
utilized the experimental

19
approach where evolution itself is manipulated and its impact on
ecological dynamics quantified directly. Since this has never been
done using plant- herbivores I did so under partially controlled
laboratory conditions. This experiment will help determine whether
rapid evolution can impact short-term ecological dynamics. Previous
investigations of eco-evolutionary dynamics study periods representing
dozens of generations since they mostly use very fast reproducing
microorganisms (Bohannan and Lenski 2000, Fussmann et al. 2003,
Yoshida et al. 2003, Terhorst et al. 2010). I will explore the impact of
even faster bouts of rapid evolution. My experiments focus on a single
growing season of the host (5-6 aphid generations or less), which could
have important implications for pest management in agricultural
systems
To my knowledge all experimental test of eco-evolutionary
dynamics, where evolution is manipulated, have been conducted
under highly controlled and simplified laboratory environments
(Fussmann et al. 2007). Although laboratory experiments establish the
potential impact of rapid evolution, field experiments are crucial
because ecological context can influence both ecological and
evolutionary processes (Holt 2005). Experiments conducted in the wild
within realistic communities encompass more realistic levels of biotic
and abiotic variation as well as gene flow. These confounding factors

20
could impose different selective pressures, altering the rate or
direction of evolution itself, or they could interfere with the manner in
which rapid evolution impacts population dynamics,
e.g. by altering the strength of density regulation (Saccheri and Hanski
2006). All

21
of these problems imply that eco-evolutionary dynamics should ideally
be studied in the wild since non-intuitive results could occur that differ
significantly from predictions based only upon laboratory experiments.
Even strong laboratory results could be overwhelmed by
environmental variation in nature.
An important issue to consider is the source of the study
population. To properly study the importance of eco-evolutionary
dynamics it is important to use genotypes that actually interact in
nature. Some studies (for an example see Agashe 2009) magnify the
genetic variation in their experimental populations by using genotypes
from multiple independent populations. If more genetic variation is
used than is commonly found in wild populations, then the
experimental populations might evolve more quickly which could
overestimate the importance of eco-evolutionary dynamics. To avoid
such a bias I only collected genotypes from a single population where
the experiments were conducted. Thus my third goal, the focus of
Chapter 3, is to address whether eco-evolutionary dynamics have
significant impacts in the wild in the face of environmental variation using
a local population. If eco-evolutionary dynamics have strong impacts in
nature this has important implications for the study of population
dynamics since evolution is traditionally not considered in these
studies. For example I know of no pest population dynamic models

22
that incorporate pest evolution within the growing season.
Experimental studies quantifying interspecific evolutionary-
feedback have only been attempted in the laboratory (Fussmann et al.
2007) and those in nature

23
have been observational or focus on genetic variation and not
evolution per se. It thus remains an open issue whether rapid evolution
can have interspecific impacts in plant-herbivore systems. Chapter 3
will also address my fourth objective, which is to experimentally determine
whether aphid rapid evolution significantly impacts their host plant’s
fitness. This objective will be addressed in all experiments but
especially in Chapter 3 since a field experiment permits more accurate
quantification of host fitness.
Many ecological forces have strong influences on ecological
dynamics (e.g. interspecific competition, population density…).
Ecologists should focus their limited resources on understanding and
quantifying important drivers of ecological dynamics. Recent studies
and many reviews claim that rapid evolution should be included in this
list (Thompson 1998) yet very few studies have addressed this
question explicitly (Johnson and Stinchcombe 2007). In community
genetics only a few experiments quantify the relative importance of
genotypic variation versus other ecological forces such as habitat
variation and induced plant resistance (Johnson and Agrawal 2005,
McGuire and Johnson 2006). The only eco-evolutionary dynamic study
that compares the relative impact of evolution itself compared to
ecological processes, is a correlation approach proposed by Hairston
(2005). Thus my fifth goal is to experimentally test the relative impact of

24
rapid on population growth rate compared to that of intraspecific density
(Chapter 4).

25
Eco-evolutionary dynamics are defined as the reciprocal
interactions between short-term ecological and evolution dynamics
timescales (Kokko and Lopez-Sepulcre 2007). My objectives thus far
have focused on quantifying the less studied half of that interaction,
how rapid evolution impacts ecology. Yet much more complicate
dynamics are possible if both arrows of causality are occurring
concurrently (Fig. 1.1). Ecological changes induced by rapid evolution
could alter future bouts of evolution by changing the selective
environment experienced by the target organism. Thus my sixth and
final objective is to assess both arrows of causality in the same
experiment and determine whether both ecological and evolutionary
dynamics are influencing each other (Chapter 4). If such an interaction is
occurring this implies that much more complex dynamics are possible
in this system and would put into question models that do not couple
ecological and evolutionary changes together.
Importance of Eco-Evolutionary Dynamics
The growing interest in eco-evolutionary dynamics stems from
its potential implications for many aspects of biology. Theoretical
studies suggest that such a process could greatly alter not only
evolutionary but also ecological interactions, dynamics, and outcomes.
Acquiring a better understanding of this process should improve our

26
understanding and our predictive ability (Duffy and Sivars- Becker
2007, Pelletier et al. 2009). Given the ever increasing examples of
rapid evolution, considering evolutionary-ecological interactions as a
working

27
hypothesis (Thompson 1998) might also provide important insight into
many applied issues, e.g. disease epidemics (Real et al. 2005),
fisheries management (Law 2000), bio-control (Hufbauer and Roderick
2005), and conservation biology (Ashley et al. 2003).
28
Figure 1.1: Diagram of Eco-Evolutionary Dynamics
Diagram representing eco-evolutionary dynamics illustrating the cyclical
causality between evolution and ecology dynamics.

29
LITERATURE CITED
Abrams, P. A. 2005. 'Adaptive Dynamics' vs. 'adaptive dynamics'.
Journal of Evolutionary Biology 18:1162-65.
Agashe, D. 2009. The stabilizing effect of intraspecific genetic
variation on population dynamics in novel and ancestral habitats.
The American Naturalist 174:255-67.
Agrawal, A. 2000. Host-range evolution: Adaptation and trade-offs in
fitness of mites on alternative hosts. Ecology 81:500-08.
Agrawal, A. 2003. Community genetics: New insights into community
ecology by integrating population genetics. Ecology 84:543-44.
Anderson, R. and R. May. 1982. Coevolution of hosts and parasites.
Parasitology 85:411-26.
Anderson, W. W. and C. E. King. 1970. Age-specific selection.
Proceedings of the National Academy of Sciences 66:780-86.
Antonovics, J. 1992. Towards community genetics. P. 426-49 in R. S. Fritz
and
E. L. Simms, editors. Ecology and Evolution of Plant Resistance to
Herbivores and Pathogens: Ecology, Evolution, and Genetics. .
University of Chicago Press.
Ashley, M. V., M. F. Willson, O. R. W. Pergams, D. J. O'Dowd, S. M.
Gende, et al. 2003. Evolutionarily enlightened management.
Biological Conservation 111:115-23.
Ayala, F. 1968. Genotype, environment, and population
numbers. Science 162:1453-9.

30
Bailey, J. K., J. A. Schweitzer, F. Ubeda, J. Koricheva, C. J. LeRoy, et al.
2009. From genes to ecosystems: a synthesis of the effects of
plant genetic factors across levels of organization. Philos T R Soc B
364:1607-16.
Bassar, R. D., M. C. Marshall, A. López-Sepulcre, E. Zandona, S. K. Auer, et
al.
2010. Local adaptation in Trinidadian guppies alters ecosystem
processes. Proceedings of the National Academy of Sciences 107:3616-
21.
Bergelson, J., G. Dwyer, and J. Emerson. 2001. Models and data on
plant- enemy coevolution. Annual Review of Genetics 35:469-99.
Berry, R., R. Anderson, B. Turner, and L. Taylor. 1978. Genetical
factors in animal population dynamics. P. 53-80 Population
Dynamics.
Bohannan, B. and R. Lenski. 1999. Effect of prey heterogeneity on the
response of a model food chain to resource enrichment. The
American Naturalist 153:73-82.
Bohannan, B. and R. Lenski. 2000. Linking genetic change to
community evolution: insights from studies of bacteria and
bacteriophage. Ecology Letters 3:362-77.
Bone, E. and A. Farres. 2001. Trends and rates of microevolution in plants.
Genetica 112-113:165-82.
Bull, J. J., J. Millstein, J. Orcutt, and H. A. Wichman. 2006. Evolutionary
feedback mediated through population density, illustrated with viruses
in chemostats.
American Naturalist 167:E39-E51.
Cappuccino, N. and P. W. Price. 1995. Population Dynamics: New
Approaches and Synthesis. Academic Press.
Collins, J. 1986. Evolutionary ecology and the use of natural selection

31
in ecological theory. Journal of the History of Biology 19:257-88.

32
Crawley, M. 1989. Insect Herbivores and Plant Population Dynamics.
Annual Review of Entomology 34:531-62.
Darwin, C. 1859. On The Origin of Species By Means of Natural Selection.
Day, T. 2005. Modelling the ecological context of evolutionary change:
Déjà vu or something new? P. 273-309 in K. Cuddington and B. E.
Beisner, editors.
Ecological Paradigms Lost Routes of Theory Change. Elsevier
Academic Press.
Duffy, M., S. Hall, A. Tessier, and M. Huebner. 2005. Selective
predators and their parasitized prey: Are epidemics in Zooplankton
under top-down control? Limnology and Oceanography 50:412-20.
Duffy, M. A. and L. Sivars-Becker. 2007. Rapid evolution and
ecological host- parasite dynamics. Ecology Letters 10:44-53.
Dyer, K. F. 1968. Evolution observed -- Some examples of evolution
occurring in historical times. Journal of Biological Education 2:317-
38.
Ehrlich, P. R. and P. H. Raven. 1964. Butterflies and Plants: A Study in
Coevolution. Evolution 18:586-608.
Endler, J. A. 1991. Genetic heterogeneity and ecology. P. 315–34 in R. J.
Berry,
T. J. Crawford, and G. M. Hewitt, editors. Genes in Ecology: The 33rd
Symposium of the British Ecological Society. Blackwell Scientific
Publications.
Ezard, T. H. G., S. D. Cote, and F. Pelletier. 2009. Eco-evolutionary
dynamics: disentangling phenotypic, environmental and population
fluctuations.
Philosophical Transactions of the Royal Society B: Biological
Sciences 364:1491-98.
Ford, E. B. 1964. Ecological Genetics. Chapman and Hall.

33
Fussmann, G. F., S. P. Ellner, and N. G. J. Hairston. 2003. Evolution as a
critical component of plankton dynamics. Proceedings of the Royal
Society of London. Series B, Biological Sciences 270:1015-22.
Fussmann, G. F., M. Loreau, and P. A. Abrams. 2007. Eco-evolutionary
dynamics of communities and ecosystems. Functional Ecology
21:465-77.
Futuyma, D. J. and A. A. Agrawal. 2009. Macroevolution and the
biological diversity of plants and herbivores. Proceedings of the
National Academy of Sciences of the United States of America
106:18054-61.
Hairston, N. G. J., S. P. Ellner, M. A. Geber, T. Yoshida, and J. A. Fox.
2005. Rapid evolution and the convergence of ecological and
evolutionary time. Ecology Letters 8:1114-27.
Hanski, I. and I. Saccheri. 2006. Molecular-level variation affects
population growth in a butterfly metapopulation. PLoS Biology
4:e129.
Hazell, S. P., I. A. D. McClintock, and M. D. E. Fellowes. 2006.
Intraspecific heritable variation in life-history traits can alter the
outcome of interspecific competition among insect herbivores. Basic
and Applied Ecology 7:215-23.
Hendry, A. P. and M. T. Kinnison. 1999. Perspective: The pace of modern
life: Measuring rates of contemporary microevolution. Evolution
53:1637-53.
Holt, R. D. 2005. On the integration of community ecology and
evolutionary biology: Historical perspectives and current prospects.
P. 235-72 in K. Cuddington and B. Beisner, editors. Ecological
Paradigms Lost Routes of Theory Change. Elsevier.
Hufbauer, R. A. and G. K. Roderick. 2005. Microevolution in biological
control: Mechanisms, patterns, and processes. Biological Control
35:227-39.

34
Hughes, A. R., B. D. Inouye, M. T. J. Johnson, N. Underwood, and M.
Vellend. 2008. Ecological consequences of genetic diversity.
Ecology Letters 11:609- 23.

35
Johnson, M. T. J. and A. Agrawal. 2005. Plant genotype and
environment interact to shape a diverse arthropod community on
evening primrose (Oenothera biennis). Ecology 86:874-85.
Johnson, M. T. J. and J. R. Stinchcombe. 2007. An emerging synthesis
between community ecology and evolutionary biology. Trends in
Ecology and Evolution 22:250-57.
Johnson, M. T. J., M. Vellend, and J. R. Stinchcombe. 2009. Evolution in
plant populations as a driver of ecological changes in arthropod
communities.
Philosophical Transactions of the Royal Society B: Biological
Sciences 364:1593-605.
Karley, A., W. Parker, J. Pitchford, and A. Douglas. 2004. The mid-
season crash in aphid populations: why and how does it occur?
Ecological Entomology 29:383-88.
Kokko, H. and A. Lopez-Sepulcre. 2007. The ecogenetic link between
demography and evolution: can we bridge the gap between theory
and data? Ecology Letters 10:773-82.
Law, R. 2000. Fishing, selection, and phenotypic evolution. ICES
Journal of Marine Science 57:659-68.
Leips, J., J. Travis, and F. H. Rodd. 2000. Genetic influences on
experimental population dynamics of the least killifish. Ecological
Monographs 70:289-309.
Levins, R., R. S. Singh, and M. K. Uyenoyama. 2003. Towards a
population biology, still. P. 21–47 The Evolution of Population
Biology.
Lewontin, R., R. S. Singh, and M. K. Uyenoyama. 2003. Building a
science of population biology. P. 7–20 The Evolution of Population
Biology.
Loeuille, N. and M. A. Leibold. 2008. Ecological consequences of

36
evolution in plant defenses in a metacommunity. Theoretical
Population Biology 74:34-45.

37
Loeuille, N., M. Loreau, and R. Ferriere. 2002. Consequences of plant-
herbivore coevolution on the dynamics and functioning of
ecosystems. Journal of Theoretical Biology 217:369-81.
Maron, J. L. and E. Crone. 2006. Herbivory: effects on plant
abundance, distribution and population growth. Proceedings of the
Royal Society B: Biological Sciences 273:2575-84.
McGuire, R. and M. T. J. Johnson. 2006. Plant genotype and induced
responses affect resistance to herbivores on evening primrose
(Oenothera biennis).
Ecological Entomology 31:20-31.
Pelletier, F., D. Garant, and A. P. Hendry. 2009. Eco-evolutionary
dynamics.
Philosophical Transactions of the Royal Society B: Biological
Sciences 364:1483-89.
Pimentel, D. 1961. Animal population regulation by the genetic feed-
back mechanism. The American Naturalist 95:65-79.
Pimentel, D. 1968. Population regulation and genetic feedback.
Science 159:1432-37.
Pimentel, D. and R. Al-Hafidh. 1965. Ecological control of a parasite
population by genetic evolution in the parasite-host system. Annals
of the Entomological Society of America 58:1-6.
Pimentel, D., W. P. Nagel, and J. L. Madden. 1963. Space-time
structure of the environment and the survival of parasite-host
systems. The American Naturalist 97:141-67.
Post, D. M., E. P. Palkovacs, E. G. Schielke, and S. I. Dodson. 2008.
Intraspecific variation in a predator affects community structure and
cascading trophic interactions. Ecology 89:2019-32.
Real, L., J. Henderson, R. Biek, J. Snaman, T. Jack, et al. 2005. Unifying
the spatial population dynamics and molecular evolution of

38
epidemic rabies virus.

39
Proceedings of the National Academy of Sciences of the United
States of America 102:12107-11.
Reznick, D. N. and H. A. Bryga. 1996. Life-history evolution in guppies
(Poecilia reticulata: Poeciliidae): V. Genetic basis of parallelism in life
histories.
American Naturalist 147:339-59.
Reznick, D. N. and C. K. Ghalambor. 2001. The population ecology of
contemporary adaptations: what empirical studies reveal about the
conditions that promote adaptive evolution. Genetica 112-113:183-
98.
Saccheri, I. and I. Hanski. 2006. Natural selection and population dynamics.
Trends in Ecology & Evolution 21:341-47.
Sax, D. and S. Gaines. 2003. Species diversity: from global decreases to
local increases. Trends in Ecology & Evolution 18:561-66.
Schlager, G. 1963. The ecological genetics of the mutant Sooty in
populations of Tribolium castaneum. Evolution 17:254-73.
Schoener, T. W. 2011. The newest synthesis: Understanding the
interplay of evolutionary and ecological dynamics. Science
331:426-29.
Shertzer, K., S. Ellner, G. F. Fussmann, and N. G. J. Hairston. 2002.
Predator- prey cycles in an aquatic microcosm: testing hypotheses
of mechanism.
Journal of Animal Ecology 71:802-15.
Sibly, R. and J. Hone. 2002. Population growth rate and its determinants:
an overview. Philosophical Transactions of the Royal Society of London
Series B- Biological Sciences 357:1153-70.
Sinervo, B., E. Svensson, and T. Comendant. 2000. Density
cycles and an offspring quantity and quality game driven by
natural selection. Nature 406:985-88.

40
Slobodkin, L. B. 1980. Growth and Regulation of Animal Populations. 2nd
edition.
Dover Publications Inc.
Terhorst, C. P., T. E. Miller, and D. R. Levitan. 2010. Evolution of prey
in ecological time reduces the effect size of predators in
experimental microcosms. Ecology 91:629-36.
Thompson, J. N. 1998. Rapid evolution as an ecological process. Trends
in Ecology & Evolution 13:329-32.
Tuda, M. 1998. Evolutionary character changes and population
responses in an insect host-parasitoid experimental system.
Researches on Population Ecology 40:293-99.
Wallner, W. 1987. FACTORS AFFECTING INSECT POPULATION-DYNAMICS:
Differences between outbreak and non-outbreak species. Annual
Review of Entomology 32:317-40.
Whitham, T. G., J. K. Bailey, J. A. Schweitzer, S. M. Shuster, R. K. Bangert,
et al.
2006. A framework for community and ecosystem genetics: from genes
to ecosystems. Nature Reviews Genetics 7:510-23.
Yoshida, T., N. G. J. Hairston, and S. Ellner. 2004. Evolutionary trade-off
between defence against grazing and competitive ability in a simple
unicellular alga, Chlorelia vulgaris. P Roy Soc Lond B Bio 271:1947-
53.
Yoshida, T., L. E. Jones, S. P. Ellner, G. F. Fussmann, and N. G. J.
Hairston. 2003. Rapid evolution drives ecological dynamics in a
predator-prey system. Nature 424:303-06.

41
CHAPTER TWO: MOLECULAR AND ECOLOGICAL
CHARACTERIZATION OF STUDY SYSTEM
ABSTRACT
I developed a system to experimentally study eco-evolutionary
dynamics in both the laboratory and in the field. I selected the green
peach aphid, Myzus persicae (Sulzer), and a wild mustard host
Hirschfeldia incana (Lagrèze-Fossat), system because the aphid’s
reproductive biology makes it an excellent candidate for experimental
evolution. The preliminary studies presented in this chapter introduce
and characterize the study system for the experiments presented in
future chapters. I first justify why I selected an asexually reproducing
model system. I then present the study system and describe how I
sampled a local population and genetically identified multiple clonal
lineages that were maintained in the greenhouse. I then ecologically
characterized these clones by assessing differences in fitness using
two experiments. I found that aphids differed by as much as 17% in
intrinsic growth rate and selected a subset of three clones to use in
subsequent experiments that directly quantify eco- evolutionary
dynamics.

42
INTRODUCTION
Experimentally Testing Eco-Evolutionary Dynamics
The overall objective of my dissertation is to test experimentally
the conditions under which rapid evolution interacts with concurrent
ecological dynamics. The key to accomplish this end is to manipulate
the rate of evolution. One commonly used approach is to compare
non-evolved and evolved populations under common garden
conditions in a post-hoc manner (Hanski and Saccheri 2006, Post et al.
2008, Harmon et al. 2009, Bassar et al. 2010). A related approach
consists of repeatedly testing changes in ecological parameters as a
population is evolving (e.g. fitness on a new host Agrawal 2000, the
strength of predation Terhorst et al. 2010) compared to unselected
control populations.
A different approach consists of manipulating only the response
to selection without changing the selective environment. One can thus
compare the ecological properties (e.g., population dynamics,
interspecific interactions, ecosystem effects…) of populations as they
are evolving to non-evolving controls. One method used to prevent
evolution consists of continually replacing the control population under
selection with unselected individuals (Pimentel 1968). This is
unfeasible in most systems because it would alter population
dynamics. An alternate approach, used here, is to manipulate

43
available genetic variation (see also Yoshida et al. 2003, Agashe
2009). Populations with less or no genetic variation will evolve more
slowly or not at all (Fisher 1930). The

44
population dynamics in these treatments can be directly compared to
those of populations that have natural levels of genetic variation. Yet,
this approach also has its limitations, including the confounding effect
of inbreeding if the study organism is sexual. Inbreeding as well as
genetic variation is known to impact ecological dynamics (Haag et al.
2002, Hanski and Saccheri 2006, Hughes et al. 2008). However,
naturally asexual organisms do not suffer from these issues.
Evolution in these asexual systems occurs through changes of clonal
frequencies, which also can change mean population trait values (Via
and Shaw 1996). This form of evolution is common in many taxa
including aphids (Via and Shaw 1996, Vorburger 2006), algae
(Fussmann et al. 2003, Yoshida et al. 2003), crustaceans (Lynch 1984),
protozoans (Terhorst et al. 2010), ‘genotypic selection’ in clonally
reproducing plants (Pan and Price 2001), bacteria (Bohannan and
Lenski 2000), and has been observed in snails (Jokela et al.
2003) and fish (Vrijenhoek and Pfeiler 1997).
Study System
I developed a local aphid-mustard study system specifically for
this dissertation research. To my surprise no other eco-evolutionary
experimental system uses an insect-plant model system where the
focal species is the insect (although Agrawal (2000) used herbivorous

45
spider mites). Other studies use predator-prey (Fussmann et al. 2003,
Yoshida et al. 2003, Terhorst et al. 2010) or host-parasitoid systems
(Tuda and Iwasa 1998, Bohannan and Lenski 2000).

46
This is surprising given that a growing body of research in eco-
evolutionary dynamics is focused on how plant genetics impacts insect
communities (‘community genetics’ reviewed in Whitham et al. 2006,
Hughes et al. 2008).
I selected the green peach aphid Myzus persicae (Sulzer) (Insecta:
Hemiptera: Aphididae) for my studies. M. persicae has a global
distribution but probably originated in China (Blackman 1974). It is
considered the world’s most important crop pest due to its enormous
host-range (over 40 families of plants) and its ability to transmit over
100 plant viruses (Mackauer and Way 1976, Blackman and Eastop
2000). Given its importance, its population dynamics, basic biology
and ecology are well studied (Van Emden et al. 1969, Mackauer and
Way 1976, Ro and Long 1999, Blackman and Eastop 2000, Karley et
al.
2003). Moreover many genetic resources are available (Sloane et al.
2001, Wilson et al. 2003, Wilson et al. 2004). This host-alternating
aphid reproduces through cyclical parthenogenesis which is the most
common reproductive mode in aphids (Dixon et al. 1989). It
reproduces sexually on its primary host (Prunus species) and the
offspring migrate to secondary hosts (crops or wild plants) where they
reproduce asexually for multiple generations or remain asexual
switching between a series of secondary hosts (Van Emden et al.

47
1969). The asexual reproductive phase in aphids is apomictic, i.e. that
offspring are exact genetic copies of their mothers except for rare
point mutations (Wilson et al.
2003). This implies that microsatellite markers can reliably identify
clonal lineages. Clonal lines differ in their propensity to reproduce
sexually (Blackman

48
1974) and in certain warmer climates these clones are favored since
the sexual over-wintering egg stage is not required for survival
(Vorburger et al. 2003).
Myzus persicae is highly amenable to experimental evolution
because of its short generation time (5-8 days depending on
temperature), high fecundity, ease of culture, and facultative asexual
reproduction. Aphids in their asexual phase have telescoping
generations, i.e. grand-daughters are developing within adult females
thus shortening development time from birth to maturity (Dixon et al.
1989). Also this aphid has a large magnitude of genetic variation
between clones identified in multiple traits, including intrinsic growth
rate (Weber 1985b, a, Vorburger 2005). Given their cyclical
parthenogenetic reproduction and migration of clones over larger
distances, spring populations are replete with clonal variation (Dickson
and Laird 1967, Vorburger 2006). These populations naturally undergo
rapid evolution, through clonal selection, within a matter of weeks
leading to significant changes in clonal frequencies (Vorburger 2006).
This occurs in many aphid species (de Barro et al. 1995, Sunnucks et
al. 1997, Fuller et al. 1999). Such changes in clonal frequencies alter
mean phenotypic trait values within weeks (Via and Shaw 1996).
Multiyear temporal studies have identified highly successful and
widespread genotypes (Wilson et al. 2003, Vorburger 2005, Vorburger

49
2006). In agricultural settings certain clones have evolved pesticide
resistance and rapidly increase in frequency (Foster et al.
2002). Although evolution and ecological dynamics are often studied in
aphids, to my knowledge no studies have looked at how rapid
evolution within a season

50
might impact the aphid’s population dynamics (e.g., growth rate, peak
densities, peak density date) even in the laboratory (Roush and
McKenzie 1987).
I selected the short-pod mustard Hirschfeldia incana (Lagreze-
Fossat) (Brassicaceae), formerly Brassica geniculata, as a host species.
This mustard, probably of Mediterranean origin, has invaded Western
Europe, Australia, New Zealand, and the South Western United States
(Horovitz and Galil 1972). It was selected for its local abundance
throughout the field site and because it is easily reared. This primarily
self-incompatible (Horovitz and Galil 1972) annual plant completes its
growth from seed to seed within a few months permitting me to
quantify the impact of the aphids on its host.
The experiments focus on a single population of aphids collected
at the University of California Motte-Rimrock Reserve near Perris,
California (MRR,
http://nrs.ucop.edu/reserves/motte/motte_rimrock.htm). The UC
Natural Reserve System provides accessible yet protected natural
sites that are excellent locations to study non-agricultural species
interactions in natural settings. The MRR is particularly good location
to study this insect-plant system since it is very close to the UCR
campus, which reduces travel, facilitates experimental execution, and
permits more thorough sampling. The MRR is a mix of Riversidean

51
sage scrub habitat, coastal-desert grassland, and willow riparian
thickets (Minnich and Dezzani 1998). All collections of aphids and host
seeds were made within the reserve and the field experiment (Chapter
4) was conducted here. I focused on a single population of aphids as
opposed to

52
sampling multiple populations because I wanted to assess how local,
i.e. available, genetic variation might lead to eco-evolutionary
interactions. Artificially increasing genetic variation by combining
genotypes from multiple populations that would never interact in
nature would limit my ability to understand the importance of eco-
evolutionary interactions in natural populations (for an example see
Agashe 2009).
Population Sampling
In March 2008, I collected 22 adult female apterous (non-
winged) M. persicae feeding on Hirschfeldia incana from the Motte-
Rimrock Reserve. I sampled early in the season because this is period
when the population should contain the highest number of clonal
lineages from sexual reproduction and migration (Vorburger 2006).
These asexually reproducing females were used to create isofemale
colonies that were maintained in the greenhouse on individually caged
H. incana seedlings under conditions that maintain asexual
reproduction (16hrs light / 8hrs dark) (Blackman 1974). Given that the
clonal composition of aphid population in future experiments was to be
manipulated I genotyped the isofemale colonies to determine whether
they differed genetically.

53
Clone Molecular Identification
I identified clonal lineages using six published microsatellite
markers (Sloane et al. 2001, Wilson et al. 2004). Microsatellites are
short repeated

54
genomic sequences (usually 1-5 base pairs) with highly variable
number of repeats and can be used to identify aphid clones (Wilson et
al. 2003). I selected these microsatellite markers over other neutral
genetic markers because they are highly reliable, can be genotyped
cheaply because they do not require sequencing, are co-dominant and
highly polymorphic, and can be multiplexed, meaning that multiple loci
can be genotyped with a single PCR. Because they are used
commonly, the methods for M. persicae were readily available (Sloane
et al. 2001, Vorburger et al. 2003, Wilson and Swenson 2003, Wilson et
al.
2004).
Three individuals from each isofemale colony were genotyped.
PCR methods were modified from previous studies (Sloane et al. 2001,
Wilson et al. 2004). One microsatellite primer from each pair was 5’
labeled with fluorescent dyes. Loci with overlapping lengths were
labeled with dyes of different wavelengths (loci-dye: myz2-6FAM,
myz3-6FAM, M40-6FAM, M86-HEX [Sigma- Aldrich], M49-PET [Applied
Biosystems], and myz9-HEX [Invitrogen]). All six microsatellite were
composed of dinucleotide repeats. DNA from a single aphid was
extracted using 5% Chelex 100 resin (Bio-Rad) and incubated for
35min at 56°C and for 15min at 95°C. Samples were then centrifuged
at 12000rpm for 2min and the supernatant retained. PCR reactions

55
were 10µL in volume that included 0.6 units of Taq polymerase (New
England Biolabs), 1µL of 10x Mg-free standard reaction buffer, 0.2mM
dNTP, 1µM of forward and reverse primer,
1.5mM MgCl2, and 0.8µL of DNA extract. Touchdown PCR was used to
amplify

56
these loci. Two different PCR cycling programs were used that follow
those of Sloane et al. (2001) except that one additional amplification
cycle was added to the last annealing temperature. Loci myz2, myz9,
M40, and M86 used PCR program PMS1 and myz3 and M49 used
PMS2. The lengths of PCR products were determined using an ABI
3100 Genetic Analyzer, using the GeneScan 500 LIZ size standard, and
GeneMapper software (Applied Biosystems).
Our genotyping identified 10 genetically unique clonal lineages.
Table 1.1 presents the each clones genotype at these loci.
Clone Maintenance
Multiple clonal populations were maintained in the greenhouse
throughout the dissertation research. Populations were always kept on
H. incana grown from seeds collected at the Motte-Rimrock Reserve.
Initially, in 2008-2009, colonies were maintained on seedlings that
were contained in large plastic jars with screen windows. Every three
or four weeks approximately two dozen aphids were transfer to a fresh
seedling. This was repeated for each clonal colony. Older colonies were
kept as backups. In 2010-2011, I switched to using larger plants (at
the end of the rosette stage) within large cages. These populations
were larger and the plants survived longer. Transfers were still
conducted every three to four weeks but consisted of hundreds of

57
aphids. The three focal clones (813, 815, and 828) were maintained in
duplicate. All colonies were kept within a partially temperature
controlled greenhouse without humidity control under

58
natural lighting as well as metal halide lights that extended daylight to
16hrs a day. These conditions maintained asexual reproduction
(Blackman 1974).
Every 4-6 weeks a group of 3-5 aphids from each clonal
population was tested for clonal contamination. If this was detected
individual aphids were used to establish new isofemale colonies and
these were tested until the original clone was rescued. In the hundreds
of tests I never found new alleles/genotypes in the microsattelite loci
tested. In other words, all contaminating aphids were from a known
aphid clonal lineage and none of these had mutations at microsatellite
loci. Due to contamination and greenhouse cooling failures I did,
however, permanently lose some clones.
Population Sampling: Clone Identification and Characterization
For adaptive evolution to occur within a population composed of
different clones these clones must differ in relative fitness. Given that
these aphids grow and reproduce very quickly I was able to assess
fitness by measuring their intrinsic growth rate. The intrinsic growth
rate (rm) is a good index of fitness in this system because populations
typically grow exponentially, then crash as their host plant senesces
(Wallner 1987, Karley et al. 2003, Karley et al. 2004). Intrinsic growth
rate is known to vary greatly between aphid clones within species and

59
between species (Weber 1985a, Vorburger 2005). The rm of a given
clone is sensitive to the plant species or genotype on which it grows,
so it is commonly used to measure host suitability (Wyatt and White
1977). Intrinsic growth rate,

60
and how it relates to temperature, is also a key component in
predictive models used in integrative pest management (Guldemond
et al. 1998, Ro and Long 1999).
Intrinsic growth rate is commonly estimated in aphids using full or
truncated life table analyses (Birch 1948, Wyatt and White 1977, Le
Roux et al. 2004).
These methods however have their limitations in that they isolate
individual adults in small clip-cages. This procedure can cause stress
to the insect, harm the plant, alter the microclimate, and restricts
selection of feeding sites (Guldemond et al. 1998). I instead extracted
rm from observed population growth rates on whole caged plants using
population growth models (Vehrs et al. 1992, Guldemond et al. 1998).
These conditions mimic future experimental conditions and are more
informative than life table approaches.
EXPERIMENT 1: ECOLOGICAL CHARACTERIZATION OF M. PERSICAE
CLONES
The objective of this experiment is quantifying intrinsic growth
rates for the unique clonal lineages collected from the Motte-Rimrock
population. H. incana, seeds collected at the Motte-Rimrock Reserve
were grown in small pots (~500mL) using UC soil Mix III, a sand/peat
moss mix supplemented with micronutrients. Once the seedlings, still

61
in the rosette stage, reached approximately 25cm wide they were
placed in cages within the greenhouse.
Cages were constructed to individually house each plant. A cage
consisted of an

62
eight liter pot with a wire frame creating a 75cm high dome that held
up thin transparent mesh (Bridal Organza, #664-7242, Jo-Ann). Aphid
clones were cleared of plant-viruses by using the approach suggested
in Raybould et al. (1999). On day 0 of the experiment each plant (the
unit of replication) received 12 apterous third instar M. persicae from a
single clonal lineage. I attempted to test all lineages: however, clone
831 did not have enough aphids to initiate the experiment and clone
820 was contaminated with another clone. Thus I tested 8 different
clonal treatments and each was replicated three times. This
experiment was conducted in a partially temperature controlled
greenhouse (mean daytime temperature = 26.8°C, range = 19°C to
32°C, mean nighttime = 21°C, range = 14°C to 29°C). Additional
lighting to extend light to 16hrs / 8hrs day as a way of maintaining
asexual reproduction (Blackman 1974).
Population size was measured, by counting all aphids, on days 0,
3, 6, 9, 12, and 23. Because it took longer than a full day to count all
the aphids (there were other treatments not presented here), certain
treatments were counted on day 13 and others on days 24 and 25. I
tested for differences in growth rate by fitting an exponential growth
model to the population dynamics observed on days 0 to 13 because
after this day population growth declined. I fit a linear mixed- effect
model (LME) with a linear exponential growth equation. I set a

63
common intercept (mean density of aphids on day 0) across
treatments. Thus the dependent variable was LN(x) transformed
number of aphids, the fixed effect was aphid treatments and day (as
the main covariate). Given that plants were

64
repeatedly counted violating the assumption of independent
observations I set unique plant identity as a random effect on
population growth rate and used an autoregressive correlation error
structure (Pinheiro and Bates 2000). Increasing variance through time
was modeled by using a variance function within the LME that
increases with the power of the variance covariate (varPower). All
analyses were implement in R (v. 2.11.1; R Development Core Team
2009) using the nlme package (Pinheiro et al. 2009).
RESULTS
This first experiment revealed significant clonal variation in
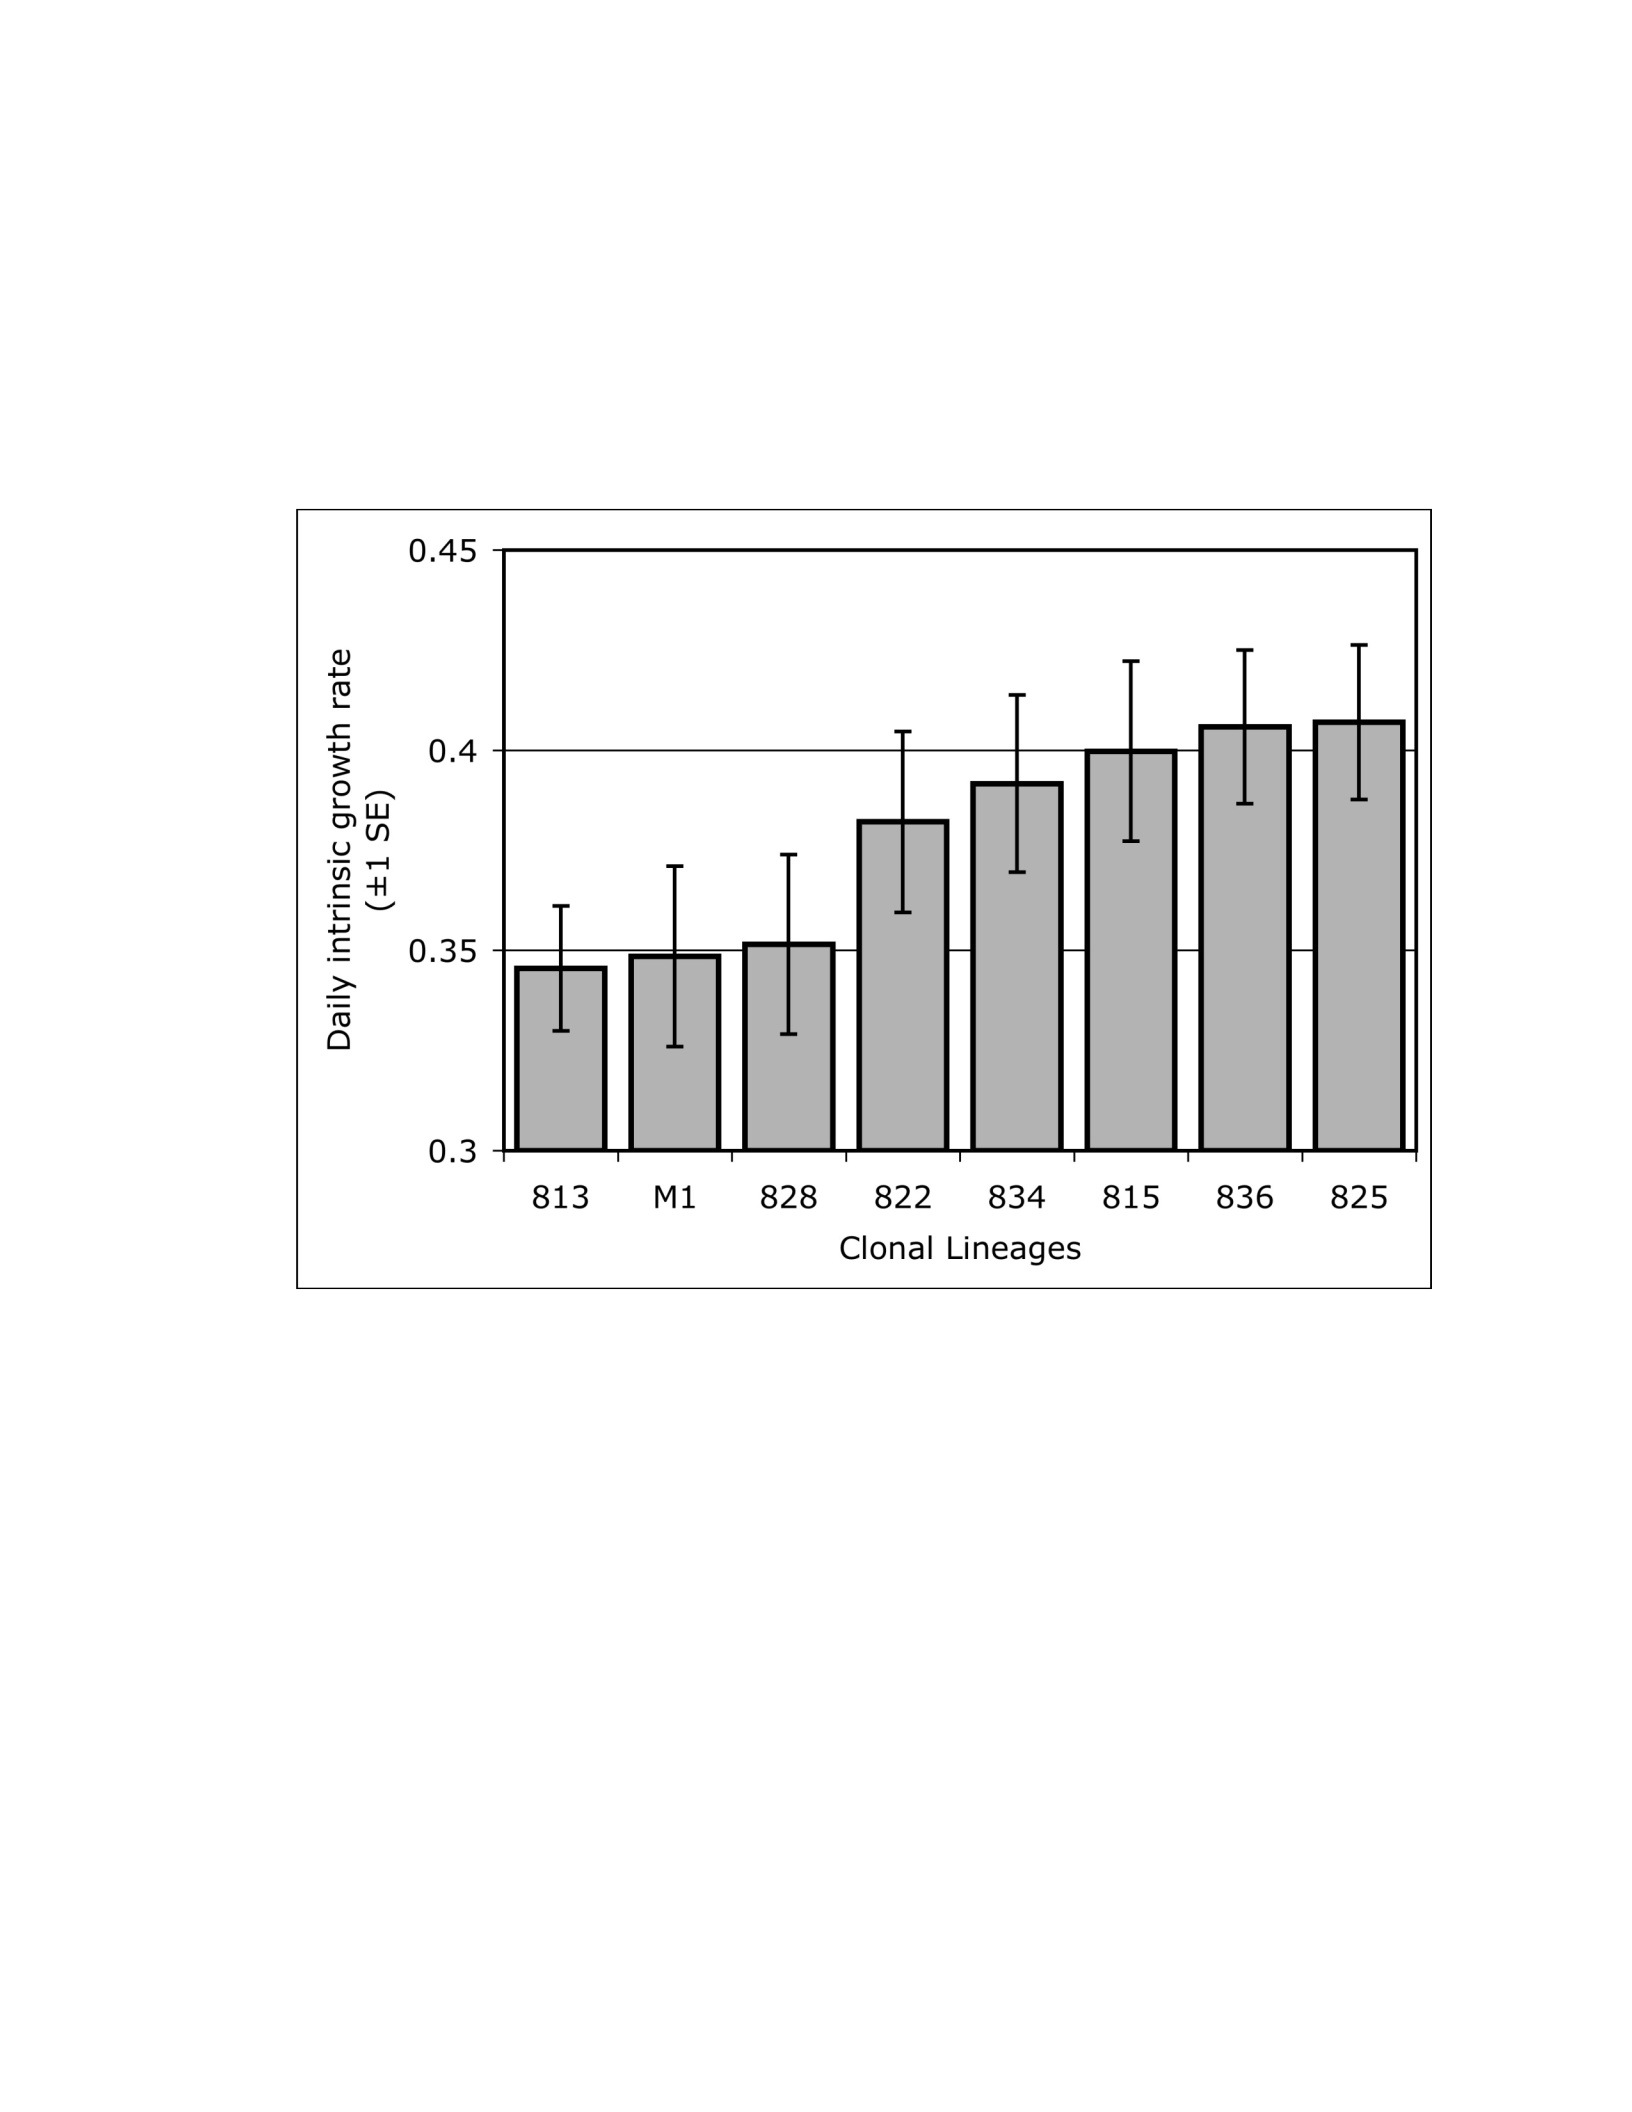
intrinsic growth rate (Fig. 2.1, LME, p = 0.002). Clonal lineages differed
by as much as 17%, which causes a range in doubling time of 41 to 48
hours. Over a period of 10 days of exponential growth the fastest
clone should reach 85% higher population size than the slowest clone.
I thus identified clonal lineages that differed in fitness. However, this
experiment had limitations that I wanted to correct.
EXPERIMENT 2: FOCUSED CHARACTERIZATION
Experiment 1 identified clones that differed greatly in fitness but it
had limitations. I repeated the above experiment but improved upon it
by using more replicates (5), by counting more often, and initializing

65
the population with a stable age distribution. I decided to focus on a
subset of clones that had different growth rates (813, 815, and 828) to
confirm their differences. Clone 820 was selected

66
also since it was contaminated in the previous experiment and thus its
growth rate was not determined. I was able to re-isolate this clone
before experiment 2.
The methods were very similar to experiment 1 and I here focus
on the differences. H. incana, were grown in larger four liter pots. Once
the seedlings, still in the rosette stage, reached approximately 20cm
wide they were placed in cages within the greenhouse. On day 0 of the
experiment each plant received 10 apterous M. persicae from a single
clonal lineage. From Experiment 1 I estimated a stable age structure
after a few generations. I estimated the mean proportion of aphids in
each growth stage during the last days of exponential growth. I
replicated this stable age distribution by introducing two adults, one
4th, two 3rd, and five 1st or 2nd instars to each plant. Instar stages
were distinguished by size. These treatments were replicated five
times and the position of plants randomized within the partially
temperature controlled greenhouse (mean daytime temperature =
23°C, range = 13°C to 37°C, mean nighttime = 14°C, range = 8°C to
21°C).
Population size was measured by counting all aphids on days 0, 3, 6,
9, 12,
15, 18, 21, 25, 29, and 36. Some treatments were counted one day
later on days 19, 22, 26, and 30 because of time limitations. I fit a LME
exponential growth model to the population dynamics but excluded

67
day 36 since the plants started senescing. The analysis mirrored that
of experiment 1.

68
RESULTS
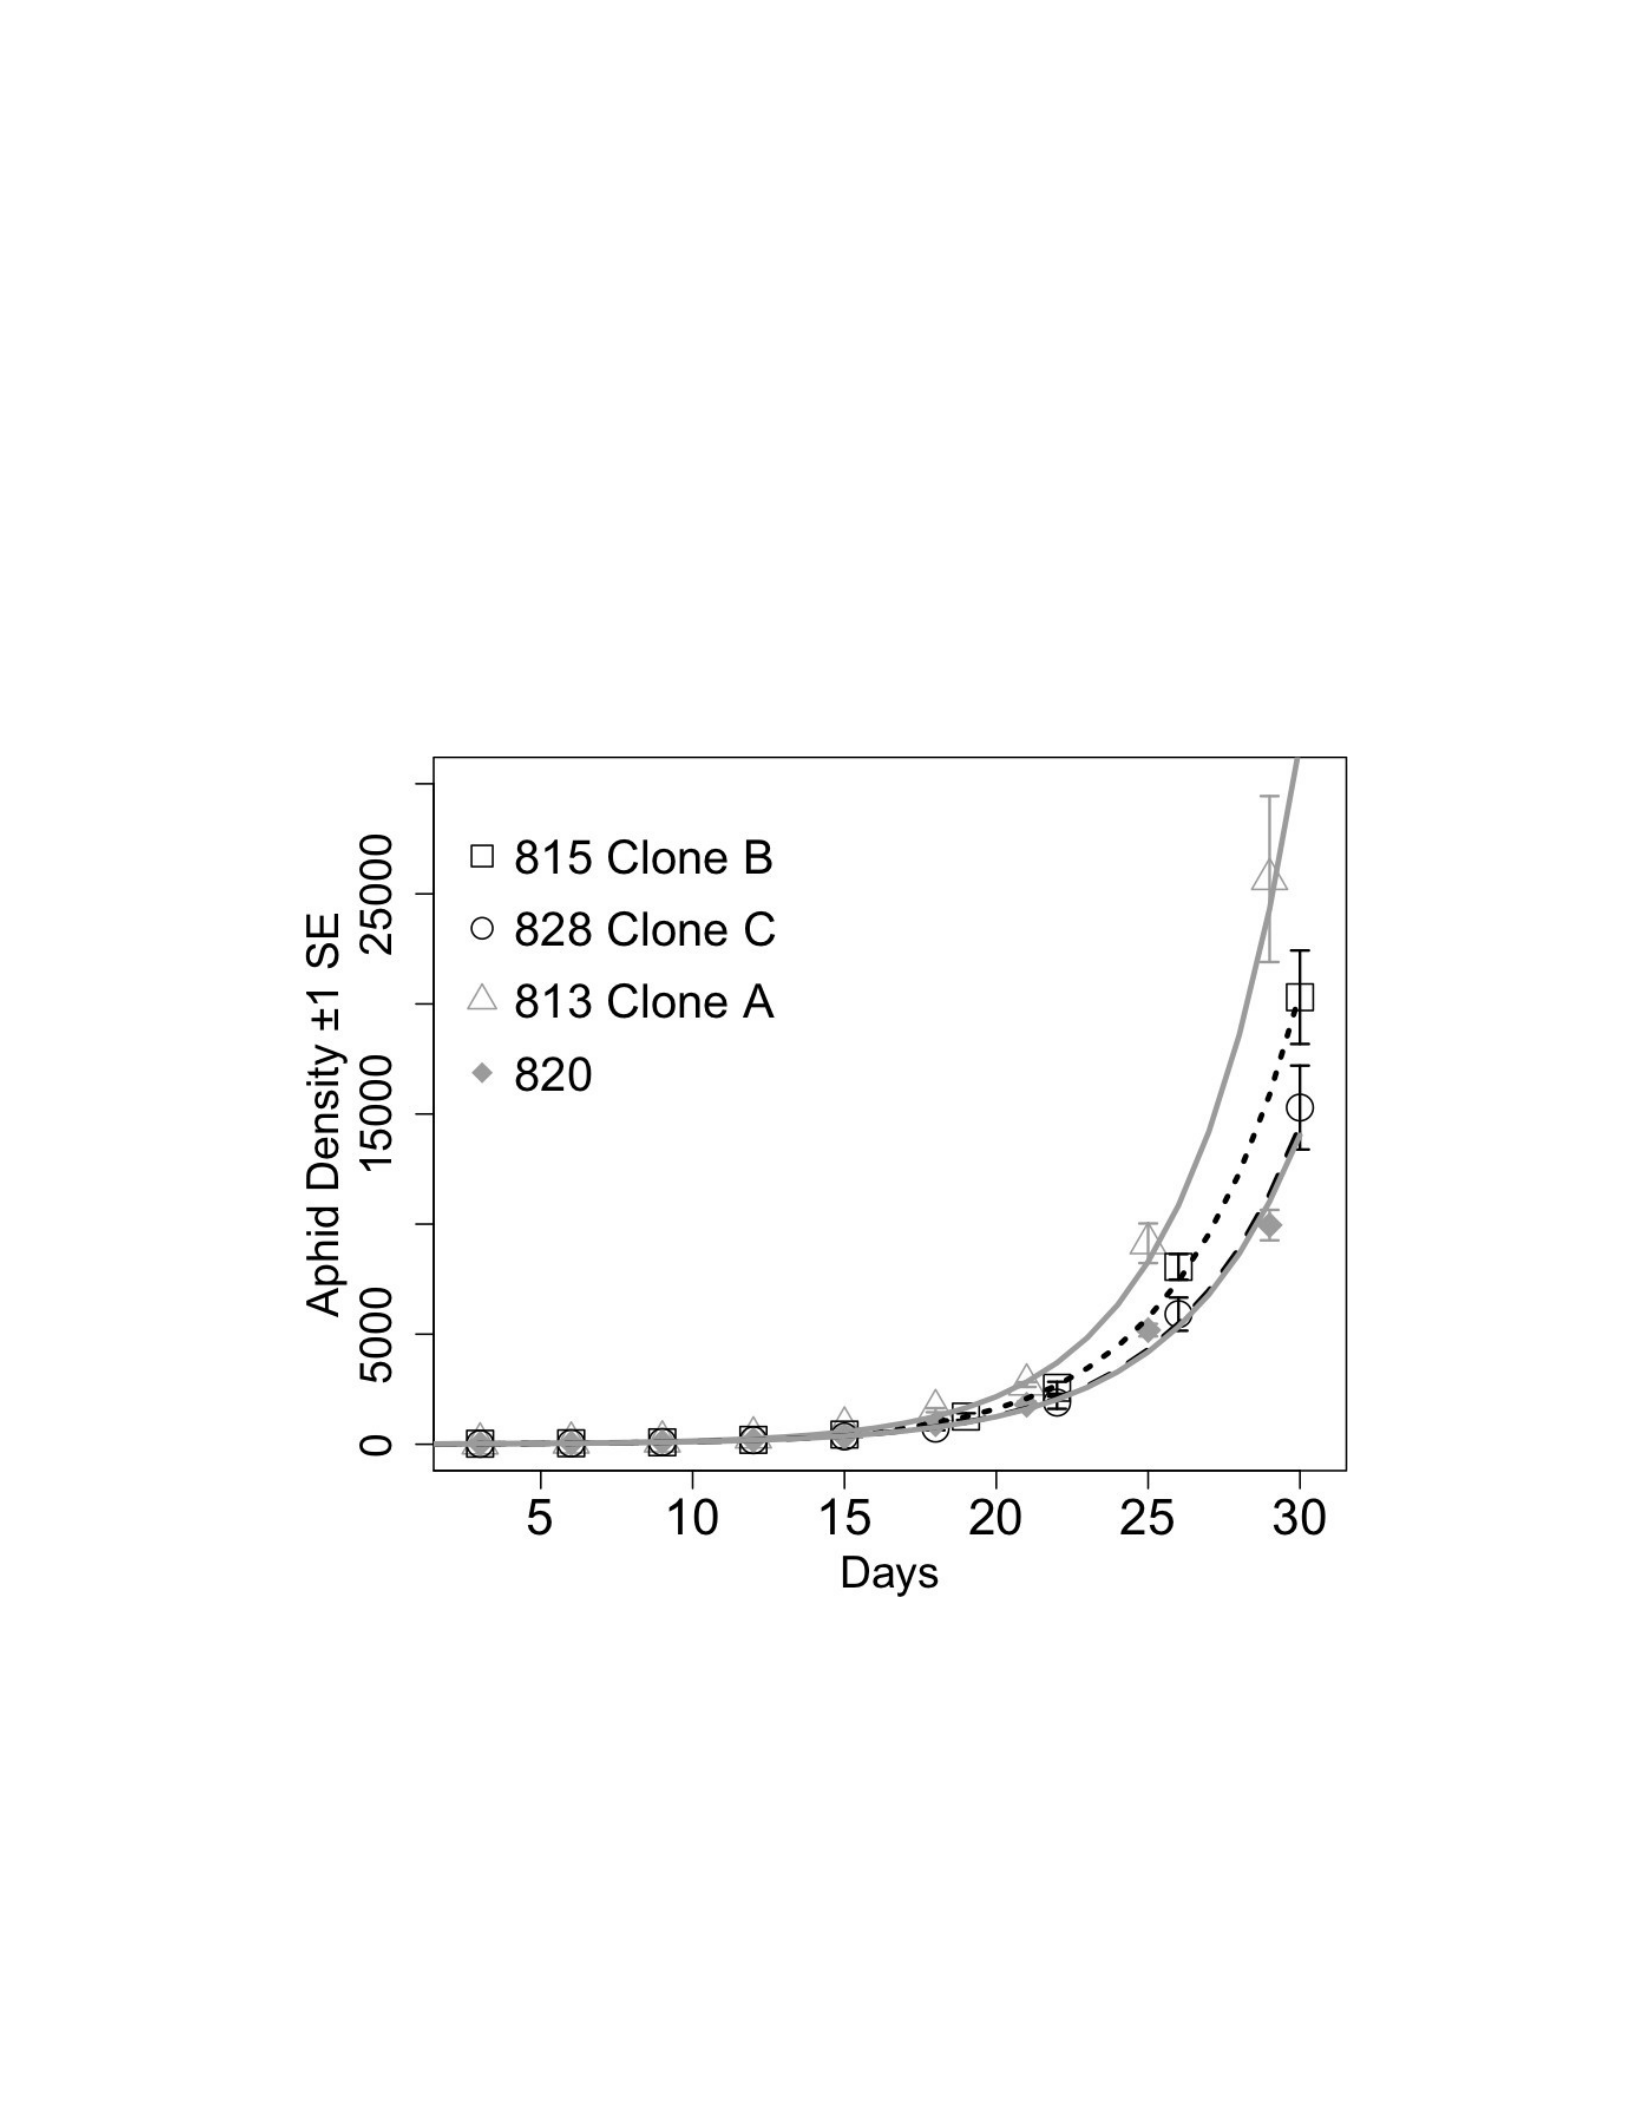
Clones grew exponentially until day 30, reaching densities
between 10 to 20 thousand aphids per plant (Fig. 2.2). Exponential
growth lasted much longer than in the first experiment because the
plants were larger and could grow faster as they had more soil. Also,
aphids grew more slowly probably due to lower temperatures during
the experiment. M. persicae grows faster at a mean fluctuating
temperature of 24°C (Exp. 1) than 18.5°C (Exp. 2) (Davis et al. 2007).
Clonal differences in the second experiment were smaller than the first
but were still highly significantly different among clones. Analysis of
the population dynamics from days 0 to 30 showed that clone 813
grew fastest (daily rm mean ± 1 SE: 0.268 ± 0.002) which was 2.2%
faster (planned contrast, p<0.001) than
clone 815 (0.263 ± 0.004). In turn, clone 815 grew 4.6% faster (p<0.001)
than
clone 828 (0.251 ± 0.004). Thus clone 813 grew 6.9% faster
(p<0.001) than the clone 828. Only three clonal lineages were
required for future experiments and I decided not to use clone 820
(which had a growth rate of 0.251 ± 0.004) since it had a similar
value to clone 828.
An analysis restricted to the first 19 days of the experiment
revealed the same pattern of growth rates but differences between
clones were even larger. Clone 813 grew 9% faster (p<0.001) than the

69
815 that in grew 8.9% faster than 828 (p=0.005). This implies that 813
grew 18.9% faster (p<0.001) than the 828. These growth rates predict
population densities that differ by as much as 2.3 fold by day 19.
Comparing the analyses of days 0-30 with 0-19 suggest that fitness

70
differences between clones changed slightly with density.
DISCUSSION
My experiments identified significant genetically based variation
among clones in fitness quantified as exponential growth rate. I
identified up to 17-18.9% variation in fitness depending on the dataset
and analysis. Because these clones grew under controlled
environmental conditions, differences between clones are genetically
based (Via and Shaw 1996). Such intraspecific variation between
clones is not uncommon in M. persicae and even larger differences have
been observed if clones are collected from different host plant species.
Weber (1985a) found up to 8 fold variation in population size after 12
days in 1137 unreplicated isofemale lines, whereas Vorburger (2005)
found 60% variation in his measure of fitness using 19 clones. My
sampling of the Motte-Rimrock Reserve was not extensive; I began
with 22 females, representing 10 clones, all of which were feeding on
the host plant species used in the future experiments.
One surprising result from my experiments is that clone 813 in the
first experiment was one of the slower genotypes (Fig. 2.1). However,
in the second experiment it was the fastest growing clone. This could
be explained by a variety of causes such as the lack of proper temporal
sampling and replication in the first experiment and potentially human

71
error (I was still improving the counting technique). It is also possible
that given differences in temperature between experiments, this clone
could simply grow relatively more quickly at lower

72
temperatures. These results highlight that experiments need to be
self-contained i.e., having all controls needed for the analysis
concurrently being studied.
Given the variation I identified in the clones I assigned the three
focal clones a letter for easier reference. Clone 813 is henceforth clone
A, 815 is clone B, and 828 is clone C. Each of the clones was selected
because they differed in growth but also because their genotypes at
three of their microsatellite markers were unique. These markers had
PCR conditions that permitted multiplexing (using one PCR reaction to
amplify all three), alleles were very diverse, and thus one genetic
analysis provided information on 3 loci that could each identify the
clones in case some loci did not amplify in the sample (loci myz2, M40,
M86 in Table. 1.1). This streamlined genotyping in the large
experiments presented in chapters 2, 3, and 4.
CONCLUSIONS
I identified unique clonal lineages from a natural population,
characterized them genetically, identifying markers for easy
genotyping, and quantified how they differed in fitness. The
differences in intrinsic growth suggest that clonal frequency could
rapidly evolve in a mixed clone population. Because aphids undergo
multiple generations within a growing season, changes in frequency

73
should be measurable within the time course of short-term population
dynamics and could potentially have an impact on population growth
rate thereby linking evolution with concurrent population dynamics.

74
Table 2.1: Aphid Microsatellite Genotypes
The multilocus microsatellite genotypes of the 10 clonal M. persicae lineages
collected at the reserve. Numbers represent the length of each allele at each
locus. Unique clones have alleles of unique length or unique combinations of
alleles. The three bolded clonal lines will be used in future experiment. Their
alphabetical coding is listed for reference.
The bolded loci are used to quickly genotype aphids in those experiments.
The number of unique alleles and unique genotypes are listed for each locus.
Microsatellite Loci
Clonal Lineage
myz2 myz3 myz9 M40 M49 M86
813- Clone A 188/202 119 203/209 125 156/171 98/135
815 – Clone B 186/196 115/121 195/207 121/125 201/203 110/112
820 162/186 105/115 207/209 125/131 166 117/133
822 186/198 117/119 195/223 121/131138/156 123
825 186/198 117/ 119* 221/223 119/125152/166117/140*
828 – Clone C 186/188 117 195/209 121 154 135
831 186/188 117 195/209 119/121 154 117/135
834 174 117 195/223 121/133 138/ * 98/100
836 174/188 117 203 121/133136/156 110/123
207 /
M1 172/186 113/119 121/125 143/179
108/112 238*
# Alleles 8 6 7 5 11 9 or 10
# Genotypes 8 5 8 8 8 or 9 10
* alleles where microsatellite lengths were inconsistent due to bad amplification.
75
Figure 2.1: Aphid Clonal Variation in Intrinsic Growth Rate
Daily intrinsic growth rates, from experiment 1, of the eight clonal lineages
estimated during population exponential growth in pure (single clone)
populations.
76
Figure 2.2: Population Dynamics of Pure Clone Populations
Population dynamics of the clonal lineages in experiment 2. Values represent
mean number of aphids (±1 SE) and the lines are the best model fit more
predictions from the analysis. The three clones that are used in subsequent
experiment have their alphabetical code listed in the legend. Populations
crashed after day 30.

77
LITERRATURE CITED
Agashe, D. 2009. The stabilizing effect of intraspecific genetic
variation on population dynamics in novel and ancestral habitats.
The American Naturalist 174:255-67.
Agrawal, A. 2000. Host-range evolution: Adaptation and trade-offs in
fitness of mites on alternative hosts. Ecology 81:500-08.
Bassar, R. D., M. C. Marshall, A. López-Sepulcre, E. Zandona, S. K. Auer, et
al.
2010. Local adaptation in Trinidadian guppies alters ecosystem
processes. Proceedings of the National Academy of Sciences 107:3616-
21.
Birch, L. 1948. The intrinsic rate of natural increase of an insect
population. The Journal of Animal Ecology 17:15-26.
Blackman, R. 1974. Life-cycle variation of Myzus persicae (Sulz.)(Hom.,
Aphididae) in different parts of the world, in relation to genotype
and environment. Bulletin of Entomological Research 63:595-607.
Blackman, R. and V. Eastop. 2000. Aphids on the World’s Crops: an
Identification and Information Guide. 2nd edition. John Wiley &
Sons.
Bohannan, B. and R. Lenski. 2000. Linking genetic change to
community evolution: insights from studies of bacteria and
bacteriophage. Ecology Letters 3:362-77.
Davis, J., E. Radcliffe, and D. Ragsdale. 2007. Effects of high and
fluctuating temperatures on Myzus persicae (Hemiptera: Aphididae).
Physiological ecology 35:1461-66.
de Barro, P., T. Sherratt, C. Brookes, O. David, and N. Maclean. 1995.
Spatial and temporal genetic variation in British field populations of
the grain aphid Sitobion avenae (F.)(Hemiptera: Aphididae) studied

78
using RAPD-PCR. Proceedings of the Royal Society B: Biological
Sciences 262:321-27.

79
Dickson, R. and E. J. Laird. 1967. Fall dispersal of green peach aphids to
desert valleys. Annals of the Entomological Society of America 60:1088-
91.
Dixon, A. F. G., A. J. Minks, and P. Harrewijn. 1989. Evolution and
adaptive significance of cyclical parthenogenesis in aphids. P. 289-
97 Aphids: their Biology, Natural Enemies and Control.
Fisher, R. 1930. The Genetical Theory of Natural Selection. Clarendon
Press. Foster, S., R. Harrington, A. Dewar, I. Denholm, and A.
Devonshire. 2002.
Temporal and spatial dynamics of insecticide resistance in Myzus
persicae
(Hemiptera: Aphididae). Pest Management Science 58:895-907.
Fuller, S., P. Chavigny, L. Lapchin, and F. Vanlerberghe-Masutti. 1999.
Variation in clonal diversity in glasshouse infestations of the aphid,
Aphis gossypii Glover in southern France. Molecular Ecology 8:1867-
77.
Fussmann, G. F., S. P. Ellner, and N. G. J. Hairston. 2003. Evolution as a
critical component of plankton dynamics. Proceedings of the Royal
Society of London. Series B, Biological Sciences 270:1015-22.
Guldemond, J., W. J. Brink, and E. Belder. 1998. Methods of assessing
population increase in aphids and the effect of growth stage of the
host plant on population growth rates. Entomologia Experimentalis
et Applicata 86:163- 73.
Haag, C. R., J. W. Hottinger, M. Riek, and D. Ebert. 2002. Strong
inbreeding depression in a Daphnia metapopulation. Evolution
56:518-26.
Hanski, I. and I. Saccheri. 2006. Molecular-level variation affects
population growth in a butterfly metapopulation. PLoS Biology
4:e129.

80
Harmon, L. J., B. Matthews, S. Des Roches, J. M. Chase, J. B. Shurin, et al.
2009. Evolutionary diversification in stickleback affects ecosystem
functioning. Nature 458:1167-70.

81
Horovitz, A. and J. Galil. 1972. Gynodioecism in East mediterranean
Hirschfeldia incana Cruciferae. Botanica Gazette 133:127-31.
Hughes, A. R., B. D. Inouye, M. T. J. Johnson, N. Underwood, and M.
Vellend. 2008. Ecological consequences of genetic diversity.
Ecology Letters 11:609- 23.
Jokela, J., C. Lively, M. Dybdahl, and J. Fox. 2003. Genetic variation in
sexual and clonal lineages of a freshwater snail. Biological Journal of
the Linnean Society 79:165-81.
Karley, A., W. Parker, J. Pitchford, and A. Douglas. 2004. The mid-
season crash in aphid populations: why and how does it occur?
Ecological Entomology 29:383-88.
Karley, A. J., J. W. Pitchford, A. E. Douglas, W. E. Parker, and J. J. Howard.
2003. The causes and processes of the mid-summer population
crash of the potato aphids Macrosiphum euphorbiae and Myzus persicae
(Hemiptera: Aphididae). Bulletin of Entomological Research 93:425-
37.
Le Roux, V., J. Saguez, C. Vincent, and P. Giordanengo. 2004. Rapid
method to screen resistance of potato plants against Myzus persicae
(Homoptera : Aphididae) in the laboratory. Journal of Economic
Entomology 97:2079-82.
Lynch, M. 1984. The genetic structure of a cyclical parthenogen.
Evolution 38:186-203.
Mackauer, M. and M. J. Way. 1976. Myzus persicae Sulz. an aphid of world
importance. P. 51-119 in V. L. Delucchi, editor. Studies in biological
control. Cambridge University Press.
Minnich, R. and R. Dezzani. 1998. Historical decline of coastal sage
scrub in the Riverside-Perris Plain, California. Western Birds 29:366-
91.
Pan, J. and J. Price. 2001. Fitness and evolution in clonal plants: the

82
impact of clonal growth. Evolutionary Ecology 15:583-600.

83
Pimentel, D. 1968. Population regulation and genetic feedback.
Science 159:1432-37.
Pinheiro, J. and D. Bates. 2000. Mixed-Effects Models in S and
S-PLUS. Springer-Verlag.
Pinheiro, J. C., D. M. Bates, S. DebRoy, and D. Sarkar. 2009. nlme: Linear
and Nonlinear Mixed Effects Models.
Post, D. M., E. P. Palkovacs, E. G. Schielke, and S. I. Dodson. 2008.
Intraspecific variation in a predator affects community structure and
cascading trophic interactions. Ecology 89:2019-32.
R Development Core Team. 2009. R: A language and environment for
statistical computing. R Foundation for Statistical Computing,
Vienna, Austria.
Raybould, A., L. Maskell, M. Edwards, J. Cooper, and A. Gray. 1999. The
prevalence and spatial distribution of viruses in natural populations
of Brassica oleracea. New Phytologist 141:265-75.
Ro, T. and G. Long. 1999. GPA-Phenodynamics, a simulation model for
the population dynamics and phenology of green peach aphid in
potato: formulation, validation, and analysis. Ecological Modelling
119:197-209.
Roush, R. and J. McKenzie. 1987. Ecological genetics of insecticide
and acaricide resistance. Annual Review of Entomology 32:361-80.
Sloane, M. A., P. Sunnucks, A. C. C. Wilson, and D. F. Hales. 2001.
Microsatellite isolation, linkage group identification and determination
of recombination frequency in the peach-potato aphid, Myzus persicae
(Sulzer) (Hemiptera: Aphididae). Genetical Research 77:251-60.
Sunnucks, P., P. DeBarro, G. Lushai, N. Maclean, and D. Hales. 1997.
Genetic structure of an aphid studied using microsatellites: Cyclic
parthenogenesis, differentiated lineages and host specialization.
Molecular Ecology 6:1059-73.

84
Terhorst, C. P., T. E. Miller, and D. R. Levitan. 2010. Evolution of prey
in ecological time reduces the effect size of predators in
experimental microcosms. Ecology 91:629-36.
Tuda, M. and Y. Iwasa. 1998. Evolution of contest competition and its
effect on host–parasitoid dynamics. Evolutionary Ecology 12:855-
70.
Van Emden, H., V. Eastop, R. Hughes, and M. Way. 1969. The ecology of
Myzus persicae. Annual Review of Entomology 14:197-270.
Vehrs, S., G. Walker, and M. Parrela. 1992. Comparison of population
growth rate and whitin-plant distribution between Aphis gossypii
and Myzus persicae (Homoptera : Aphididae) reared on potted
chrysanthemums. Journal of Economic Entomology 85:799-807.
Via, S. and A. J. Shaw. 1996. Short-term evolution in the size and
shape of pea aphids. Evolution 50:163-73.
Vorburger, C. 2005. Positive genetic correlations among major life-
history traits related to ecological success in the aphid Myzus
persicae. Evolution 59:1006- 15.
Vorburger, C. 2006. Temporal dynamics of genotypic diversity reveal
strong clonal selection in the aphid Myzus persicae. Journal of
Evolutionary Biology 19:97-107.
Vorburger, C., M. Lancaster, and P. Sunnucks. 2003.
Environmentally related patterns of reproductive modes in the
aphid Myzus persicae and the predominance of two 'superclones'
in Victoria, Australia. Molecular Ecology 12:3493-504.
Vrijenhoek, R. and E. Pfeiler. 1997. Differential survival of sexual and
asexual
Poeciliopsis during environmental stress.
Wallner, W. 1987. FACTORS AFFECTING INSECT POPULATION-DYNAMICS:
Differences between outbreak and non-outbreak species. Annual

85
Review of Entomology 32:317-40.

86
Weber, G. 1985a. Genetic variability in host plant adaptation of the
green peach aphid, Myzus persicae. Entomologia Experimentalis et
Applicata 38:49-56.
Weber, G. 1985b. Population genetics of insecticide resistance in the
green peach aphid, Myzus persicae (Sulz.) (Homoptera, Aphididae).
Zeitschrift für Angewandte Entomologie 99:408-21.
Whitham, T. G., J. K. Bailey, J. A. Schweitzer, S. M. Shuster, R. K. Bangert,
et al.
2006. A framework for community and ecosystem genetics: from genes
to ecosystems. Nature Reviews Genetics 7:510-23.
Wilson, A., P. Sunnucks, and D. Hales. 2003. Heritable genetic
variation and potential for adaptive evolution in asexual aphids
(Aphidoidea). Biological Journal of the Linnean Society 79:115-35.
Wilson, A. C. C., B. Massonnet, J. C. Simon, N. Prunier-Leterme, L.
Dolatti, et al. 2004. Cross-species amplification of microsatellite loci
in aphids: assessment and application. Molecular Ecology Notes
4:104-09.
Wilson, D. and W. Swenson. 2003. Community genetics and
community selection. Ecology 84:586-88.
Wyatt, I. and P. White. 1977. Simple estimation of intrinsic increase
rates for aphids and tetranychid mites. The Journal of Applied
Ecology 14:757-66.
Yoshida, T., L. E. Jones, S. P. Ellner, G. F. Fussmann, and N. G. J.
Hairston. 2003. Rapid evolution drives ecological dynamics in a
predator-prey system. Nature 424:303-06.

87
CHAPTER THREE: EXPERIMENTAL
ASSESSMENT OF THE IMPACT OF RAPID
EVOLUTION ON POPULATION DYNAMICS IN
THE GREENHOUSE
ABSTRACT
Most short-term population dynamic models and studies assume
that evolution occurs on slower timescales and thus do not allow for
parameter values to evolve during their study. Yet multiple recent
examples of rapid evolution in many systems could invalidate this
approach if evolution impacts short-term ecological dynamics. The
objective of this study is to quantify the impact of rapid evolution on
short-term population dynamics using an aphid (Myzus persicae) and an
undomesticated host (Hirschfeldia incana). This is the first experimental
Eco-Evolutionary Dynamics study system using an insect-herbivore to
my knowledge. I manipulated the amount of genetic variation in
intrinsic growth rate within replicated aphid populations by altering the
clonal composition. Aphid populations evolved rapidly changing
significantly from their initial frequency within four weeks, well within a
growing season and approximately four or five aphid generations. As

88
populations were evolving I quantified their population dynamics.
Evolving populations grew significantly faster, between 28% and 34%,

89
and reached higher densities, compared to non-evolving control
populations. Evolving aphid populations did not cause increased
damage to their host plant. My results countermand to prevailing
approach that assumes that short-term population dynamics are too
fast for evolution to have an influence.
INTRODUCTION
Few studies or models concerning short-term population
dynamics consider the possibility that evolution could alter population
parameters (e.g. intrinsic growth rates, carrying capacity, interspecific
interactions) during the study period (Thompson 1998, Levins et al.
2003). Although studies take into account changes in population
parameters, due to changes in age structure or spatial distribution,
they rarely consider genetic changes (Cappuccino and Price 1995,
Sibly and Hone 2002) even though certain ecologists have advocated
such a consideration for decades (Pimentel 1961, Chitty 1967,
Anderson and King 1970, Berry et al. 1978). This view, however, seems
to be changing (Thompson 1998, Hairston et al. 2005, Saccheri and
Hanski 2006, Hughes et al. 2008, Pelletier et al. 2009).
Life tables are commonly used to estimate intrinsic growth rate,
a key parameter in models forecasting population dynamics (Kocourek
et al. 1994, Guldemond et al. 1998, Ro and Long 1999). Alternatively,

90
models are fit to historical density data to forecast future population
density (Onstad et al. 2005). These approaches however assume that
genotypic frequencies and hence

91
parameter values do not evolve. The justification for ignoring
evolution in short- term ecological studies is based on two
assumptions. Firstly, populations are often assumed to be genetically
homogeneous, at least in traits that impact population dynamics
(Roughgarden 1979, Cappuccino and Price 1995). Yet, population
genetic variation in ecologically important traits has been
demonstrated repeatedly since the 1960s reviewed in (Ayala 1968,
Berry et al. 1978). Moreover, such variation can significantly influence
population dynamics in the laboratory (Schlager 1963, Leips et al.
2000) and in nature (Hazell et al. 2006, Saccheri and Hanski 2006).
Secondly, evolution is assumed to occur on a much slower (and thus
separate) timescale, over hundreds or thousands of generations, than
short-term ecological processes, occurring over a dozen or fewer
generations (Slobodkin 1980, Thompson 1998, Hairston et al. 2005).
Thus even if genetic variation is considered, evolution is ignored
because it is perceived to be too slow to have an ecological effect
(Endler 1991). Studies falsifying this assumption by identifying ‘rapid
evolution’ occurring on ‘ecological time’, often within a few
generations, in both natural and human disturbed environments, have
recently become very common (see reviews in Dyer 1968, Thompson
1998, Hendry and Kinnison 1999, Bone and Farres 2001, Reznick and
Ghalambor 2001, Ashley et al. 2003) but what remains unclear is

92
whether such rapid evolution actually impacts short-term ecological
dynamics (Pelletier et al. 2009).

93
Theoretical models have shown that rapid evolution in
population parameters and genotypic frequencies can significantly
alter population growth trajectories (Pimentel 1961, Anderson and
King 1970, Fussmann et al. 2003, Duffy and Sivars-Becker 2007).
These effects could be straightforward. For example, if a genotype
with a higher growth rate becomes more common it could accelerate
the whole population’s growth rate. On the other hand, more complex
effects are possible. If this common genotype’s relative fitness
advantage decreases with increasing density and frequency it might
slow the growth of the evolving population (Agrawal 2004). Because of
such potentially non-intuitive interactions it is important to
experimentally assess the impact of rapid evolution.
Whether the effect of evolution is simple or complex does not
imply that evolution should be considered in all population dynamic
studies. It is important to quantify how strongly evolution can impact
concurrent population dynamics in different contexts (Hairston et al.
2005). The strength of this effect might depend on the ecological
context (e.g. community composition, level of disturbance) and
evolutionary context (e.g. amount of genetic variation present, rate of
evolution, mechanism of evolution). For example, Yoshida et al. (2003)
showed that rapid evolution within their rotifer-algal chemostat system
causes the predator-prey cycles to become almost perfectly out-of-

94
phase and not one quarter out-of-phase as predicted by ecological
theory. Yet this predator-prey cycling in chemostats is highly
dependent on nutrient flow and will not occur if the dilution rate is too
low

95
or too high (Shertzer et al. 2002). This implies that empirical studies
under differ conditions are required to quantify the importance of this
process.
A small but growing number of experimental studies have begun
quantifying the impact of rapid evolution on population dynamics
using different methods (Fussmann et al. 2007). Bohannan and Lenski
(2000) observed changes in mean density, and the fluctuation in
density in both bacteria and phage, as the bacteria evolved resistance
to this phage. Fussmann et al. (2003) used a combination of modeling
and an experimental verification to show that rapid evolution of
asexual reproduction qualitatively changed populations dynamics
within 30 days. Without evolution the populations has a single peak in
density and then crashes, however, with evolution a second peak in
density occurs. Other studies experimentally compare the population
dynamics of evolving populations to those that cannot evolve due to
replacement of the population with unselected individuals (Pimentel et
al. 1963, Pimentel and Al- Hafidh 1965, Pimentel 1968), a lack of
genetic variation (Yoshida et al. 2003, Fussmann et al. 2007, Agashe
2009), or because the non-evolving population is in an environment
without the key selective pressure such as predation (Agrawal 2000,
Terhorst et al. 2010). These studies demonstrate how evolutionary
dynamics influence the dynamics and outcome of short-term

96
ecological phenomena and argue convincingly for causality.
Plant-herbivore interactions are thought to be one of the most
common and important ecological interactions in natural populations,
generating much of

97
the species and phenotypic diversity in nature as well as having
immense economic importance (Ehrlich and Raven 1964). Surprisingly,
there have been no experimental studies in which evolution was
manipulated and its impact on population dynamics quantified in
plant-herbivore interactions (except spider mites in Agrawal 2000). Yet
a growing body of research in eco-evolutionary dynamics is focused on
how plant genetics impacts insect communities (‘community genetics’
reviewed in Whitham et al. 2006, Hughes et al. 2008). This is striking
given that Wallner (1987), in his highly cited review of the causes of
insect pest outbreak, strongly advocated for a consideration of the role
of evolution in such outbreaks. The ecological effects of rapid evolution
in a plant- herbivore system could differ greatly from those observed
in predator-prey or host-parasitoid interactions for two reasons. First,
the patterns of population dynamics often differ. In many plant-
herbivore systems, especially in agricultural pests, the pest dynamics
are often in a non-equilibrium state consisting of outbreaks and
crashes (reviewed in Wallner 1987, Karley et al. 2004) as opposed to
equilibrium or predator-prey cycles observed in the rapid evolution
studies listed previously. Second, herbivores might have a weaker
affect on host population dynamics than would a predator on predator-
prey dynamics because herbivores do not necessarily kill their host.
The magnitude of impact of insect herbivores on plant population

98
dynamics has been debated for years (Crawley 1989) and only in the
last decade have a dozen or so studies found support for this process
(Maron and Crone 2006).

99
My goal was thus to develop a model plant-herbivore system to
study how rapid evolution through natural selection acting on genetic
variation present within natural populations impacts concurrent
population dynamics. To do so, I developed a study system wherein
evolution can easily be manipulated. I selected the green peach aphid
(Myzus persicae) and a local wild invasive annual mustard, Hirschfeldia
incana, as a host. In this aphid species populations are replete with
clonal variation at the beginning of the season, resulting from
immigration and sexual reproduction, which permits rapid evolution at
the beginning of the growing season (Vorburger 2006). Variation
declines throughout the growing season leading to the evolutionary
changes in population mean trait values (Via and Shaw 1996). To
study the impact of such rapid evolution on population dynamics I
experimentally manipulated aphid populations’ genetic composition
and evolutionary potential by controlling which clones were present in
replicated populations. By selecting different pairings of clones I
altered the level of genetic variation in an ecologically important trait
and could thus test how the evolutionary context might alter the
impact of rapid evolution on concurrent population dynamics. I
specifically tested the following hypotheses-predictions: 1) If rapid
evolution impacts population dynamics, then the observed population dynamics
of evolving aphid populations will differ significantly from those of non- evolving

10
0
aphids, 2) If evolutionary context is important, then the impact of rapid evolution
on population dynamics will differ between the different evolution treatments,
and 3) If rapid evolution in aphids impacts their host plant, then plant

10
1
fitness will differ significantly when exposed to evolving versus non-evolving
aphids.
MATERIALS AND METHODS
I- Experimental Design
Evolving and non-evolving M. persicae populations on H. incana
plants were studied in a partly cooled greenhouse (mean daytime
temperature = 31°C, range = 16°C to 47°C, mean nighttime = 19°C,
range = 13°C to 30°C). Asexual reproduction was maintained by using
addition lighting providing 16hrs light/ 8hrs dark (Blackman 1974). To
minimize variation in this primarily outcrossing plant, plants used in
the experiment were grown from the seeds of a single H. incana plant
collected in 2008 at the Motte-Rimrock Reserve. These seeds were
planted in four liter pots, using UCR soil mix III, a sand/peat moss mix
supplemented with micronutrients, and watered every three days.
Cages were constructed to individually house each plant. Cages
consisted of an 8 liter pot with a wire frame creating a 75cm high
dome that held up thin transparent mesh (Bridal Organza, #664-7242,
Jo-Ann). On day 0 of the experiment, the six week old seedlings in the
rosette stage, approximately 10-15cm wide, were inoculated with
seven different aphid treatments by placing 20 third instar aphids onto
each plant.

10
2
These aphids came from stock greenhouse clonal populations,
regularly tested for contamination. Replicates were initiated on three
consecutive days starting October 1st 2009. On day 1 missing aphids
were replaced with fourth instar

10
3
aphids. Each treatment combination was assigned in a randomized
block design and replicated 10 times.
I used three aphid clonal lineages, identified as ‘A’, ‘B’, and ‘C’,
that were collected in 2008 from the University of California Motte-
Rimrock Reserve near Perris, California (see Chapter 1). These clones
differ in microsatellite markers (Appendix 3.1). A preliminary
greenhouse experiment revealed that they also differ in exponential
growth rates when grown in pure cultures (Chapter 2, daily growth
rate of clone A = 0.268 ± 0.002, B = 0.263 ± 0.004, and C = 0.251 ±
0.004). I used these three clones to establish seven aphid treatments.
Three evolution treatments consisted of aphid populations (on a
single plant) that have two different clones. I established evolution
treatments that consisted of all three two-way combinations (A-B, B-C,
and A-C). Based on the ranking of growth rate in the preliminary
experiments (Chapter 2), I initiated these evolving populations with 5
individuals of the faster growing clones and 15 individuals of the
slower growing clones. The A clone in the A-B and A-C evolution
treatments as well as the B clone in the B-C evolution treatment
represented 25% of the initial clonal frequency. These populations
have genetic variation in fitness (e.g. A clone’s rm is greater than that
of the C clone) and thus could evolve by changing in clonal frequency
(away from the 25% : 75% initial ratio). Three different non-evolution

10
4
(pure clone) treatments received 20 aphids of only one of the three
clones.
Because all individuals were of the same genotype within these pure
populations,

10
5
gene frequencies could not change, thus preventing evolution. Finally,
a ‘no- aphid control’ treatment did not receive any aphids.
II- Rates of Evolution
On day 28 I collected 100 aphids from every population to track
changes in clonal frequencies (evolution). Between 16 and 24 aphids
from each sample were genotyped (for a total of 497 aphids) at three
microsatellite loci using a multiplex approach (see Appendix 3.1 for
detailed genetic methods). I calculated the frequency of the faster
clone for each treatment and replicate separately. For each evolution
treatment I then determined whether the mean frequency of the
faster clone differed significantly from the initial clonal frequency of
25% using one-sample t-tests.
III- Aphid Population Dynamics
Aphid population dynamics were quantified by counting all
aphids on days 3, 7, 10, 14, 17, 21, 24, 28, and 33. When populations
rose above 2000 aphids per plant I sub-sampled by counting one half
of every leaf. Plant senescence caused the aphid populations to crash
after day 28 so I excluded the census taken on day 33. I fit an
exponential population growth model and I found, by looking at the
residuals of every treatment, that exponential growth lasted until day

10
6
14. Afterwards populations grew linearly, as determined by fitting a
separate linear model on this portion of the time-series, days 14 to 28.

10
7
The exponential growth phase, days 0-14, was analyzed with a
linear mixed-effect model (LME) where the dependent variable was
LN(x) transformed number of aphids, the fixed effect was aphid
treatments and day (as the main covariate). Because the repeated
aphid counts on the same plant violated the assumption of
independent observations, I set unique plant identity as a random
effect on population growth rate and intercept and used an
autoregressive correlation error structure (Pinheiro and Bates 2000). I
modeled increasing variance through time by using a variance function
within the LME that increases with the power of the variance covariate
(varPower). Block (day of initiation of the replicate and spatial position
in the greenhouse) and initial plant size did not improve model fit and
were not included in the final model. For the linear growth phase, days
14-28, the same LME model was applied except that the number of
aphids was not LN(x) transformed. All analyses were implement in R
(v. 2.11.1; R Development Core Team 2009) using the nlme package
(Pinheiro et al. 2009).
IV- The Impact of Evolution on Population Dynamics
My objective is not to predict which clone will out-compete the
other but to statistically test the impact of changes in clonal frequency
on concurrent population dynamics. Ideally, one would compare the

10
8
observed aphid population dynamics in the evolution treatment to
those of a non-evolving mixed population containing the same two
clones that remain at a frequency of 25% : 75%. This is impossible
since clones will change in frequency because of fitness differences. I

10
9
thus generated the expected population growth parameters of such a
non- evolving population by using the pure aphid treatments. I tested
three a priori null hypotheses that the population growth rate (slope)
and density (intercept) do not differ between each evolution treatment
and their corresponding pure treatments,
e.g. A-C evolution treatment vs pure A and pure C treatments. I did so
with the use of planned contrasts that are orthogonal comparisons
between a subset of the aphid treatment levels within the LME
analysis. Different hypotheses are tested by assigning weights to
treatments levels. I set the planned contrast coefficients of the no-
evolution expectation to match those of the initial clonal frequency
(e.g. pure A= -0.25 and pure C= -0.75 and these are compared to the
AC evolution treatment= 1). My three hypotheses were tested using
the following simplified contrast matrix:
Aphid
Treatments
Hypothesis 1:
AB vs Pure A and
Pure B
Hypothesis 2:
BC vs Pure B and
Pure C
Hypothesis 3:
AC vs Pure A and
Pure C
Pure clone A -0.25 0 -0.25
Pure clone B -0.75 -0.25 0
Pure clone C 0 -0.75 -0.75
Evolution AB +1 0 0
Evolution BC 0 +1 0
Evolution AC 0 0 +1
Thus differences in growth rate or density between the evolution
treatment and the no-evolution expectation represent the impact of

11
0
changes in the frequency of clones (rapid evolution) on population
dynamics.

11
1
V - Host Plant Fitness
Finally, to quantify the impact of aphid rapid evolution on its
host’s fitness I measured the above ground dry biomass of the plants
at the end of the experiment as a proxy for host fitness (Mitchell-Olds
and Bradley 1996). I fit a general linear model on LN(x) transformed
plant weight measurements. The factors were aphid treatment, block
and initial plant size (width of rosette on day 3). The interactions
between these factors were non-significant and thus removed from the
final model. I again used planned contrasts to determine whether
plants with evolving aphid populations were smaller than expected
from no-evolution treatments.
RESULTS
I - Pure Clone Treatments
Pure clone treatments differed in their population dynamics as
the rank order of growth rates changed throughout the experiment
(Fig. 3.1). In the exponential phase (day 0- to 14) the B clone grew
fastest (5.6% faster than A), the A clone was second fastest (4.8%
faster than the C clone; Fig. 3.1.a). In the linear growth phase (day 14
to 28) the B clone grew significantly slower than the other two clones.
The A clone grew 80% and the C clone grew 37% faster than the B
clone respectively and the A clone grew 12% faster than clone C (Fig.

11
2
3.1.b).

11
3
II - Evolution Treatments - Genetic Analyses
On day 28 I tested for changes in the frequency of clones in the
evolution treatments away from the initial frequency of 25% : 75%. In
the A-B evolution treatment clonal frequency did not change
(frequency of A clone = 23%, one sample t-test, p = 0.63; Fig. 3.2).
The B-C and A-C evolution treatments did significantly evolve as the
frequency of the C clone decreased. The B clone reached 44%
(p=0.031) and the A clone reached 47% (p=0.001) almost doubling
their initial frequency of 25% (Fig. 3.2).
III - Impact of Aphid Evolution on Aphid Population Dynamics
To test the impact of rapid evolution on concurrent population
dynamics I compared the observed population dynamics in evolving
populations to those observed in both corresponding pure treatments
by using planned contrasts proportional to the initial frequency of
clones (i.e., population dynamics without evolution). For example in
the exponential growth phase the A-C evolution treatment grew with
an exponential rate of 0.321 which is 8.5% slower than the expected
growth rate of a population at a constant (non-evolving) frequency of
25% (for clone A with a growth rate of 0.0363) and 75% (for clone C
with a growth rate of 0.347) which has an expected growth rate of
0.351.

11
4
In the exponential phase (days 0 to 14), the only evolution
treatment that differed in daily growth rate from its no-evolution
expectation was the A-C treatment (Fig. 3.3 a-b-e, Table 3.1). Oddly,
although the faster growing A clone

11
5
increased in frequency in this treatment, the evolution treatment grew
8.5% slower (LME, p = 0.0015) than the no-evolution expectation (Fig.
3.3.e). In the second growth phase, days 14 to 28, the A-B evolution
treatment did not differ from the no-evolution expectation in either
intercept (density on day 14) or growth rate (Fig. 3.3.b, Table 3.1).
Evolution in the B-C treatment did not alter density on day 14 but
significantly accelerated population growth rate compared to the no-
evolution expectation afterwards (+28.2%, p = 0.008, Fig. 3.3.d, Table
3.1).
Finally, although the A-C evolution treatment grew slower in the
exponential stage leading to a significant decrease in density at day
14 (-28.5%, p= 0.009), evolution significantly accelerated population
growth rate in the second growth phase (+33.8%, p < 0.001, Fig. 3.3.f,
Table 3.1).
IV - Impact of Aphid Evolution on Host Plant Fitness
Aphid feeding severely reduced plant size. The no-aphid control
plants were five times heavier than plants with aphids (p < 0.001).
Although in certain treatments evolution led to higher aphid densities,
this did not magnify the impact of aphids on the host plants’ above
ground biomass. Final plant weight did not differ significantly between
the three evolution treatments and their corresponding no-evolution

11
6
expectations (ANOVA, all p-values > 0.1).

11
7
DISCUSSION
I experimentally assessed the impact of rapid evolution on
concurrent ecological dynamics in a plant-herbivore system. I found
that rapid evolution, occurring within weeks, significantly accelerated
population growth rates and density as clonal frequencies changed.
Yet, this rapid evolution of aphids did not have a detectable effect on
the plant host. The presence of aphids had a large and significant
impact on plant growth, but faster growing evolving aphids did not
damage their host more than non-evolving aphids. These results have
important implications for the study of population dynamics and pest
management.
Over the course of only 28 days, approximately 4-5 aphid
generations, natural selection significantly altered aphid clonal
frequencies in two of the three evolution treatments. Similar changes
have been observed in non-experimental aphid infections in
greenhouses (Fuller et al. 1999) as well as in the wild populations (de
Barro et al. 1995, Vorburger 2006). In the A-C evolution treatment,
the A clone almost doubled its initial frequency, which is expected
given that the A clone grew faster than the C clone in pure
treatments in both growth phases (Fig 3.1). Yet, the evolutionary
outcome was not always predictable from the difference in the growth
rates of single clone cultures. The A-B treatment did not evolve (Fig.

11
8
3.2), even though on day 28 the pure A clone was 41% more dense
than the pure B clone (Fig. 3.1). This might be explained by the fact
that the pure B clone grew faster than the A during the first growth
phase but slower during the second growth phase, reversing the
evolution that

11
9
occurred during the first phase. This reversal may in turn suggest that
the fitness difference between the clones is density dependent. Also,
the B clone in the B-C treatment reached a frequency of 44% on day
28, even though its density on that day was 30% lower than the pure C
clone. This is surprising since in the early phase pure B grew faster
than C but the opposite occurs in the later growth phase. One possible
explanation for these two unpredictable results is that one clone
reduces the others’ growth (Rochat et al. 1999). In my experiment it is
possible that the B clone interferences with the C and A clones’
feeding, thus lowering their relative fitness when mixed, resulting in
higher clone B frequencies than expected on day 28. Also, it is possible
that the early growth phase determines the evolutionary outcome
since populations expand approximately 170 fold during the early
phase, as opposed to only 4.5 fold in the later phase.
The novelty of my study is not to determine the exact process
leading to these evolutionary changes but to assess the impact of
these changes on concurrent population dynamics. I observed strong
impacts of rapid evolution on population dynamics in both treatments
that evolved. Rapid evolution accelerated population growth rate by
28% and 33% in the two mixed treatments where evolution occurred,
supporting my first hypothesis (Fig. 3.3, Table 3.1). Evolution increased
population density by as much as 17% for the B-C and 19% for the A- C

12
0
treatments compared to no-evolution expectations (best linear
approximations on day 24 where maximum differences are seen in the
raw data). These effects are similar in magnitude to other ecological
forces usually deemed as important.

12
1
For example increasing temperature from 20-25ºC and 25-30ºC
causes M. persicae’s intrinsic growth rate to increase by 14% and 3.6%
respectively (Davis et al. 2007). Gurevitch et al (2000)’s factorial
meta-analysis of dozens of experiments manipulating predation and
competition revealed impact sizes similar to those reported here. The
strong effects I observed suggest that population density and growth
rate might not be predictable by simply averaging the demographic
parameters of a mixed genotype population (Wallner 1987, Endler
1991).
Rapid evolution could have even stronger effects if I had used
clones with larger fitness differences. Such variation would be likely if I
had 1) sampled more than a dozen clones from a natural population,
2) collected aphids from different host species, or 3) conducted the
experiment in an agricultural setting with pesticide application that
would select for M. persicae clones that differ in resistance. Other
studies in M. persicae have reported higher levels of genetic variation
between clones. Weber (1985a) found up to 8 fold variation in
population size after 12 days in 1137 unreplicated isofemale lines,
whereas Vorburger (2005) found 60% variation in his measure of
fitness using 19 clones. In another study, Weber (1985b) found 3000
fold variation in resistance to parathion. Also, the acceleration in
growth rate due to evolution that I observed only occurred in the latter

12
2
half of the experiment (Table 3.1). This delay is likely a consequence
of a lag of at least a few generations before evolution can change the
population’s growth parameters. The fact that such a change occurred
within

12
3
only 30 days directly challenges the assumption that evolutionary
change happens on a much longer time scale than the change
wrought by ecological interactions. These results suggest that if the
experiment had lasted longer, either by having a longer-lived host or
by having new host plants, the effect of evolution could have been
magnified. The large acceleration of growth rate within only a few
weeks suggests that rapid evolution on naturally occurring genetic
variation can be a strong driver of population dynamics on ‘ecological
timescales’.
It is difficult to compare the effect of rapid evolution on
population dynamics between very different study systems. Rapid
evolution in certain predator-prey or host-parasite systems has been
shown to alter the mean density and the pattern and magnitude of
density cycles (Pimentel 1968, Bohannan and Lenski 2000, Fussmann
et al. 2003, Yoshida et al. 2003, Terhorst et al. 2010).
These systems might inherently have more opportunity for qualitative
changes in population dynamics since both species undergo multiple
generations within the experiment. Thus the population dynamics and
potentially the evolutionary dynamics of both species might be
altered. This is not what occurs in many plant- herbivore systems.
Many insect populations grow rapidly then crash because of plant
senescence, predation, parasitism or climate (Wallner 1987, Ro and

12
4
Long 1999, Karley et al. 2004). Such dynamics often occur within one
generation of the plant. Given differences in these types of
interspecific interactions in nature it

12
5
is important to investigate the impact of rapid evolution in different
model systems.
My second hypothesis tests whether the evolutionary context
(identity of genotypes and rate of evolution) influences the impact of
rapid evolution on population dynamics. Given that one evolution
treatment did not evolve and the other two did so at similar rates
nullifies my ability to quantify the relationship between rate of
evolution and impact size since I have dichotomous treatments (rapid
and no evolution). These results suggest that, in these experimental
conditions, genotypic identity of clones, as long as they evolve at
similar rates, does not change the magnitude of the impact of rapid
evolution on population growth rate. Yet a closer examination of my
results suggests that clonal identity might have an important impact.
In the A-C evolution treatment it is clear why the growth rate
accelerates; the faster growing A clone becomes more common. For
the B-C treatment however, the B clone increases in frequency but the
B clone grows more slowly in the second growth phase (by 37%) than
the C clone did in pure treatments (Fig. 3.1). Why exactly this
evolutionary change accelerates the growth of the evolving population
remains unresolved. One possibility is that the B clone experiences
more severe density-dependent growth when at high frequency which
only occurs in the pure B treatment. Reduced growth rate does not

12
6
occur in the B-C evolution treatment because the B clone only reaches
44% frequency. Experiments at different initial clone frequencies could
help resolve this issue. Such intraspecific variation in the strength of
density dependence has

12
7
been document in other aphid species (Agrawal et al. 2004) and is
obvious from the pure clone treatments (Fig. 3.1). I have also
observed that the B aphids become smaller in body size and are more
likely to produced winged aphids but only at very high densities and
only when it represents a dominant frequency of the population (M. M.
Turcotte pers. observation in multiple experiments). Aphid clones are
known to differ in their propensity to create winged individuals during
crowding (Muller et al. 2001, Hazell et al. 2005).
An obstacle I faced was how to statistically compare evolving
and non- evolving populations. If one compares an evolving mixed
population (e.g. clones A and B) to either pure treatment (pure A or
pure B) then genetic variation, clonal identity, and evolution are
confounded. My aim was to assess the impact of evolution itself and
not the former factors. Hence I created planned contrasts that
compare the observed population parameters in the evolution
treatment to those of both corresponding pure treatments in the ratio
of the initial frequency of clones (25:75). This is akin to having a
population composed of a constant (non- evolving) ratio of clones. The
limitation of this approach is that it assumes that interclonal
interactions are equivalent to intraclonal interactions. This caveat
might explain why the A-C evolution treatment is initially grows 8.4%
slower (Fig. 3.3.E, Table 3.1). This result suggests that one clone,

12
8
probably A, is interfering with the other. This decreases total
population growth rate and only once the faster growing A clone has
increased significantly in frequency, days 14-28, can evolution
compensate for this effect and accelerate population growth rate.

12
9
Alternatively, interclonal interference might be density- and/or
frequency- dependent and thus change throughout the experiment.
Clones with aphid populations are known to vary genetically in
competitive ability and this variation can also change with ecological
context (Hazell et al. 2006).
This study quantified one half of the eco-evolutionary feedback
cycle and showed that rapid evolution can significantly alter
population density. Whether this occurs under different ecological
conditions remains to be tested. Another opened question is whether
changes density reciprocally influences future bouts of evolution. If
this is the case it would complete the eco-evolutionary feedback cycle
(Fussmann et al. 2007, Kokko and Lopez-Sepulcre 2007). Although
selection within aphids is known to be density-dependent (Agrawal et
al. 2004) direct tests of this hypothesis in this system should be
undertaken. Accurate predictions of population dynamics are crucial
in many applied fields, such as fisheries, pest management,
conservation biology, invasion biology, and epidemiology. Rapid
evolution, in many ecologically relevant traits has been documented
repeatedly in these systems (Ashley et al. 2003) yet evolution is
usually not considered in population dynamic studies. My
experimental results strongly countermands this approach and
suggest that rapid evolution can have a large effect on growth rate

13
0
and density. It follows that investigating the impact of rapid evolution
can improve predictions and population management (Hufbauer and
Roderick 2005, Duffy and Sivars-Becker 2007).

13
1
Table 3.1: Analysis of Population Dynamics Comparing Evolving and Non-
Evolving Populations
Planned contrasts from a linear mixed-effect model, comparing each type of
evolving population to its corresponding no-evolution expectation, generated
from the pure aphid treatments following the initial frequency of clones (see
Methods for details). The percent change represents the change in slope or
intercept from the non-evolving expectation to that of the observed evolution
treatment. Thus positive changes represent increases due to evolution. Slope
represents the rate of growth of aphid populations and intercept represents
density at the start of each time period. All p-values are for 2-tailed tests.
Significant results were bolded for easier identification.
Evolutio
n
Treatme
nt
Days 0-14 Days 14-28
(Clones) d.f. t p % Change d.f. t p % Change
Intercept
A-B
50 -0.51 0.613 -2.6 50 0.16 0.875 +1.7
Slope 216 -0.38 0.703 -0.9 215 -0.77 0.440 -9.4
Intercept
B-C
50 -0.77 0.448 -3.7 50 -1.33 0.187 -14.4
Slope 216 -0.89 0.375 -2.2 215 2.67 0.008 +28.2
Intercept 50 -0.35 0.723 -1.8 50 -2.77 0.009 -28.5
A-C
Slope 216 -3.22 0.002 -8.5 215 3.41 0.001 +33.8
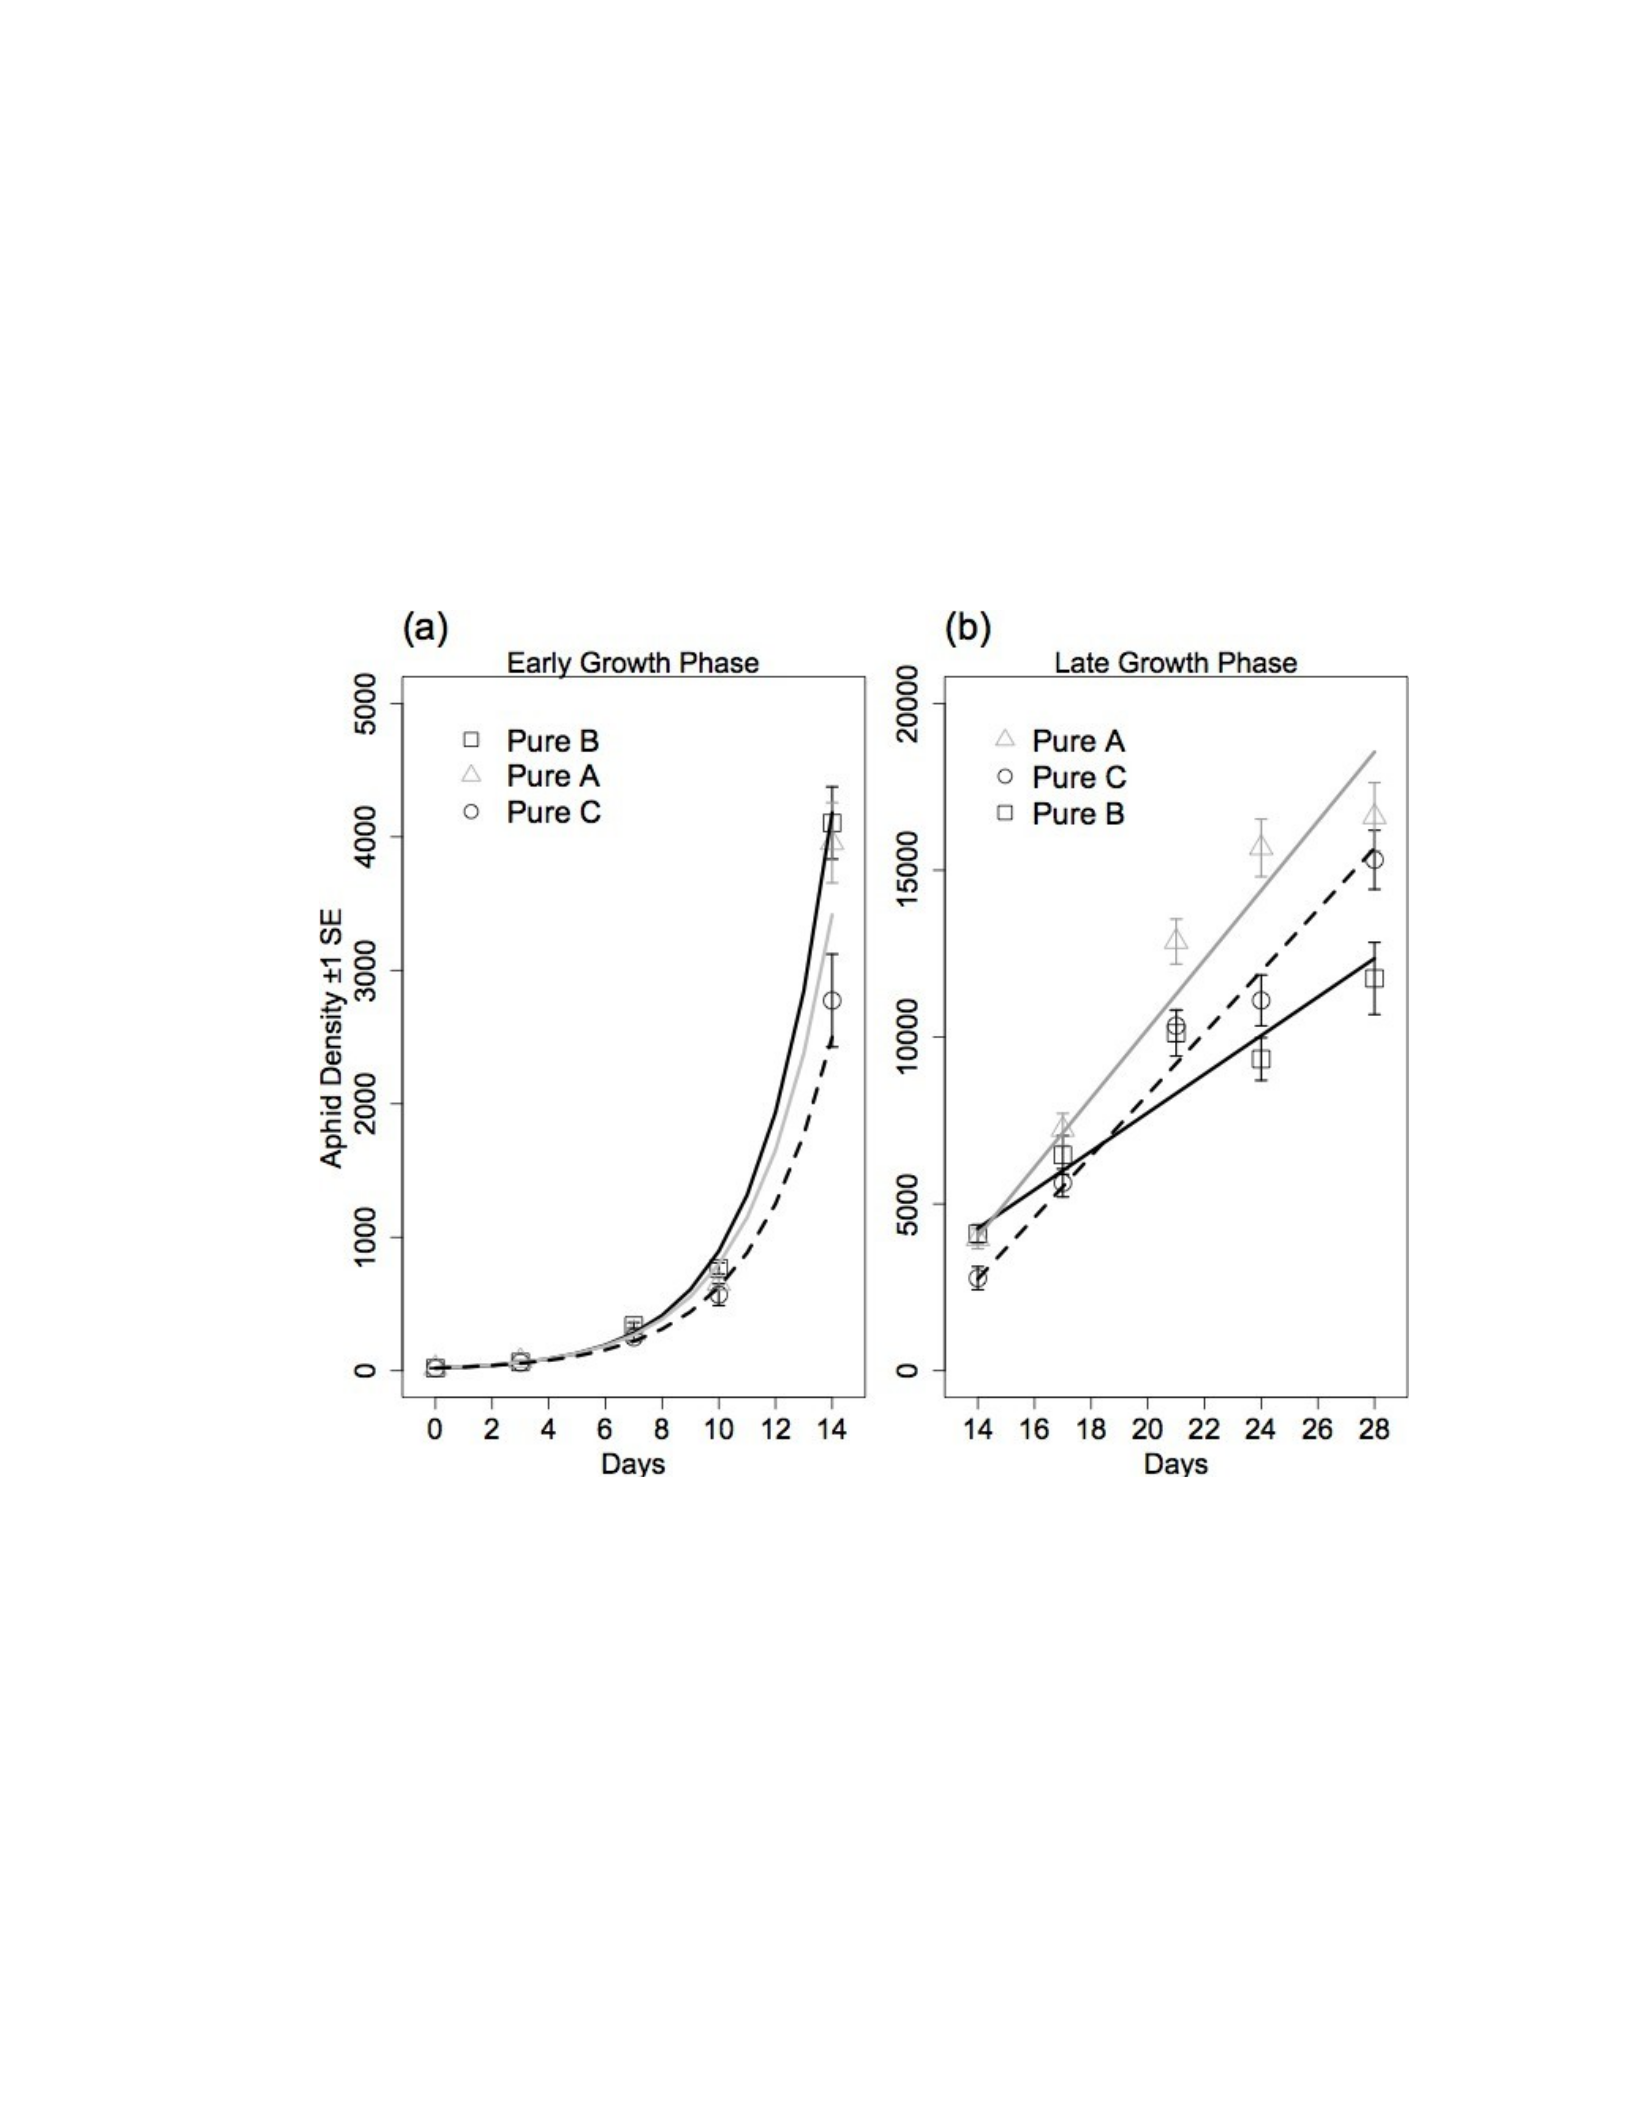
13
2
Figure 3.1: Population Dynamics of Pure Clone Treatments
Population dynamics of pure clonal treatments. Values represent mean
number of aphids (±1 SE) through time separated into two time periods for
easier visualization. a) early growth phase during days 0 to 14 and b) the late
growth phase during days 14 to
28. The y-axes differ between panels.
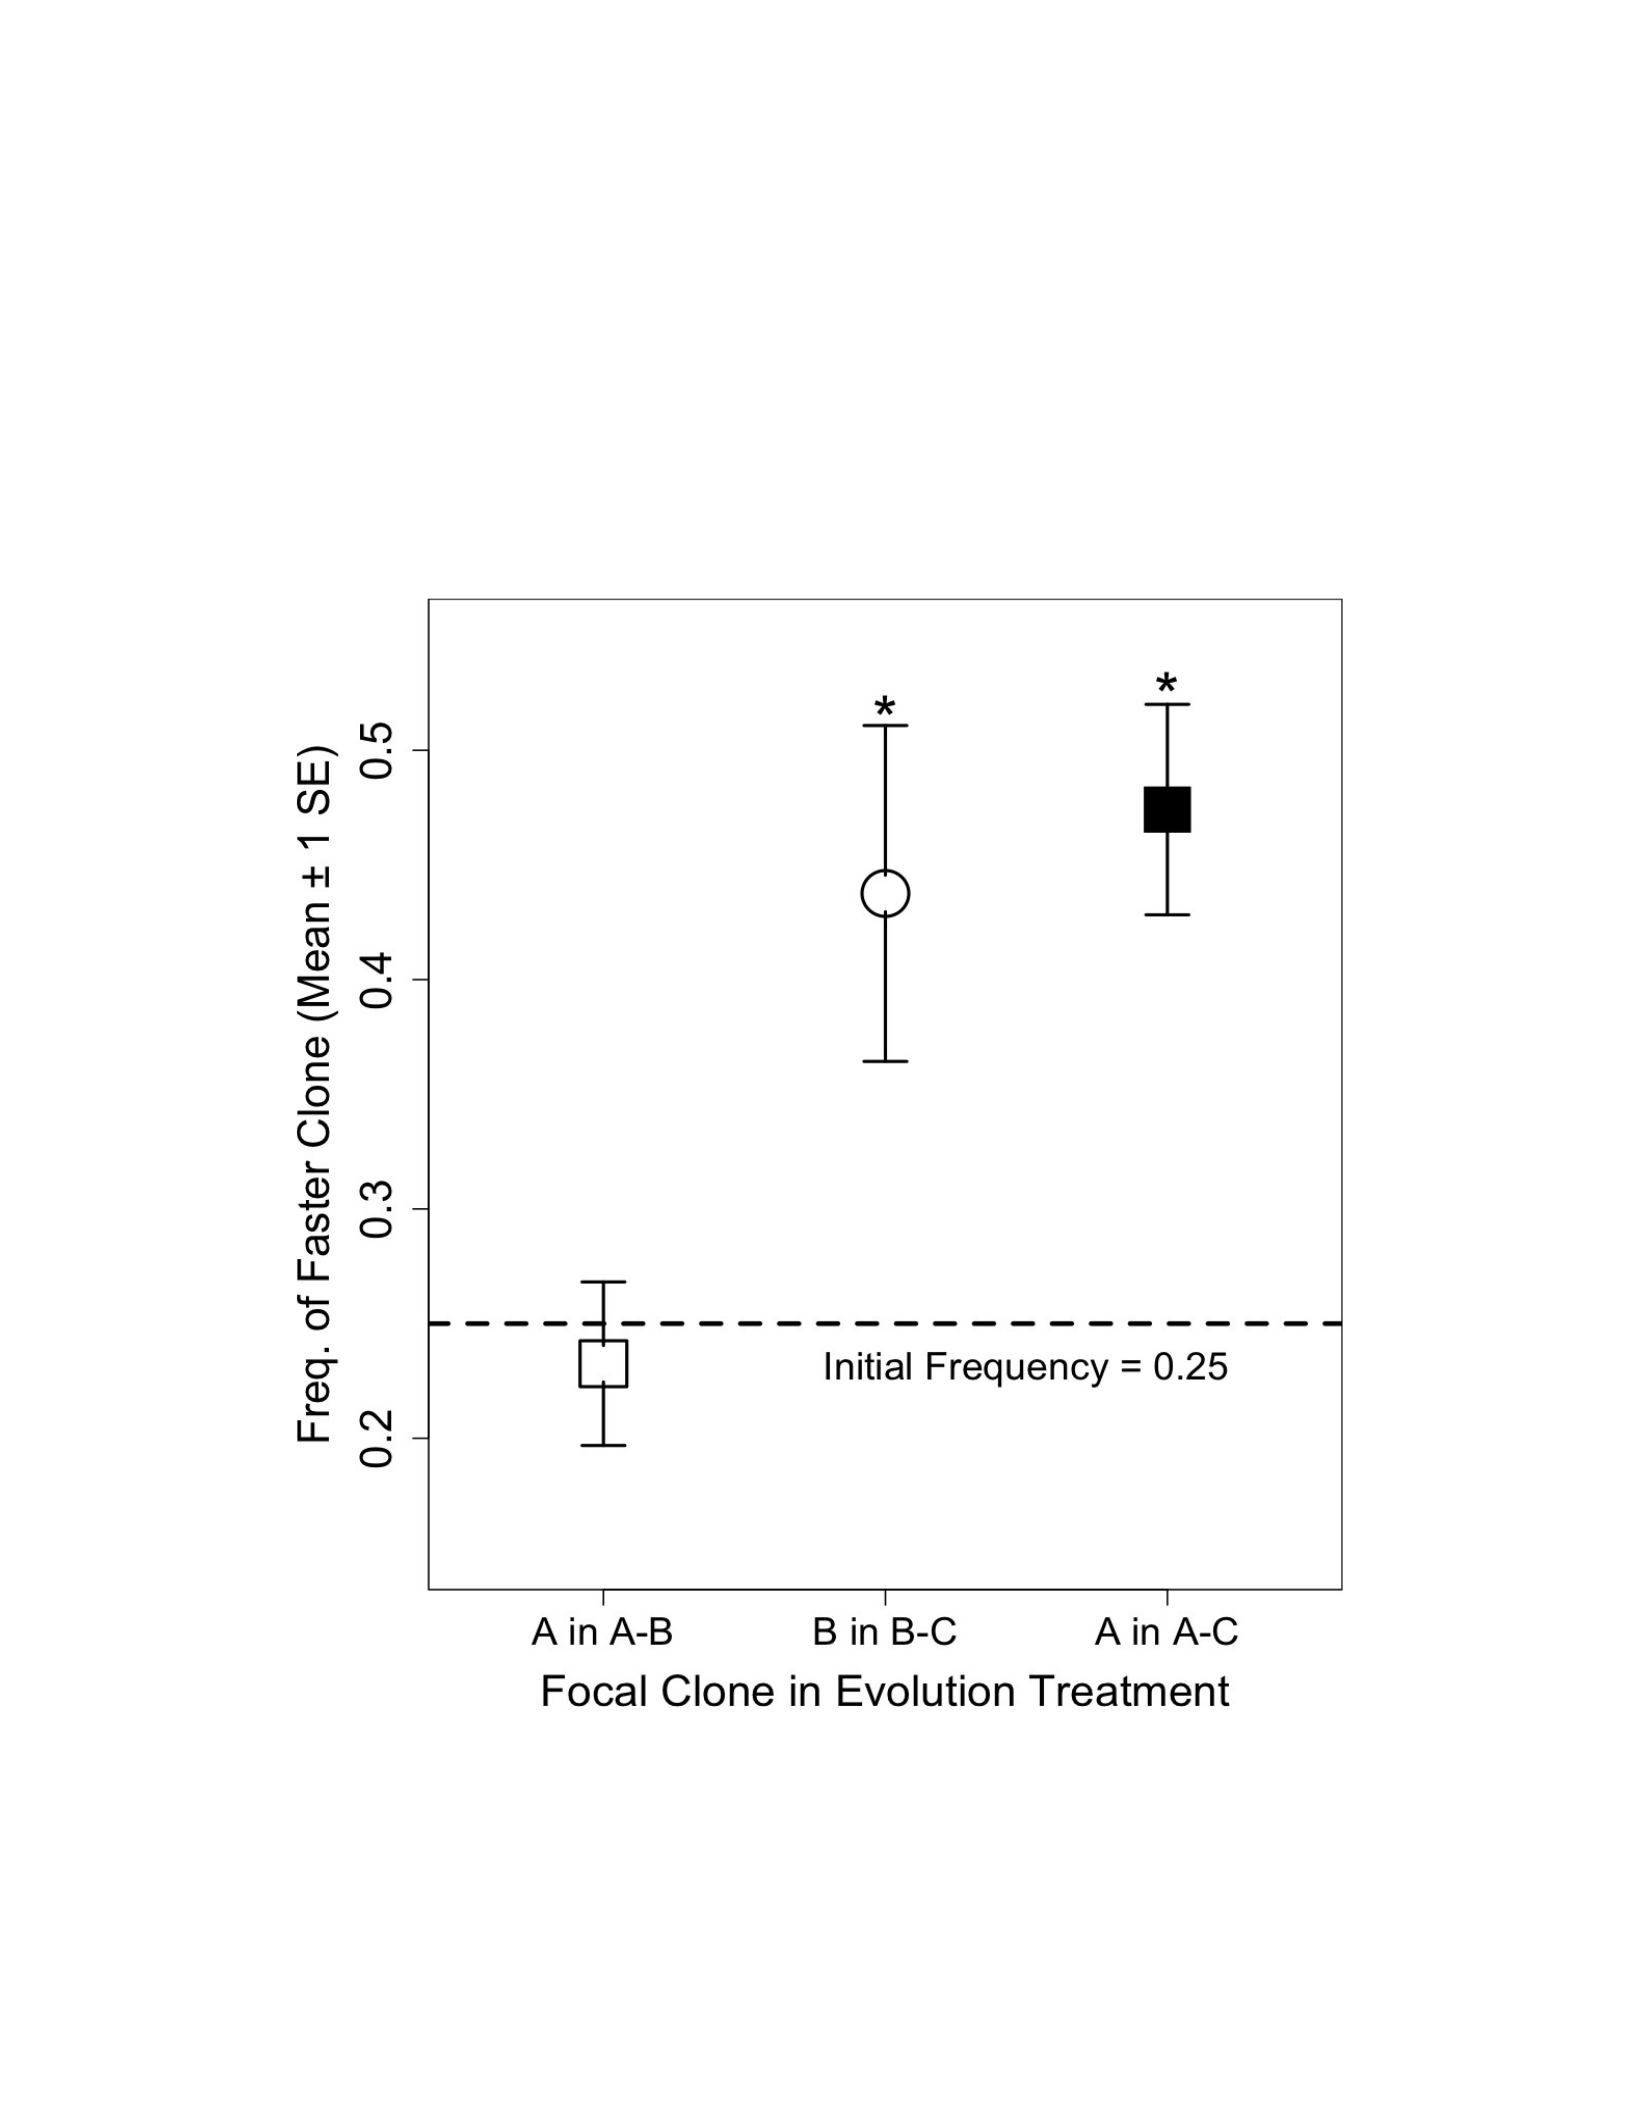
13
3
Figure 3.2: Rapid Experimental Evolution of Clonal Frequencies
Rapid clonal evolution as shown by the mean frequency of the faster
growing aphid clones in each evolution treatment (±1 SE). X-axis shows
which clone’s frequency is being tested in each evolution treatment. Dashed
horizontal bar indicates initial clonal frequency of 25% and (*) indicate
significant divergence from initial frequency. A, B, and C are the aphid clones.

13
4
Figure 3.3: Populations Dynamics of Evolving and Non-Evolving Aphids
Population dynamics of the three observed evolution treatments (black
diamonds) with the best fit model from LME analysis (black line). Left panels
are for the early growth phase and panels on the right for the late growth
phase for easy visualization. The dashed gray line represents the best fit
model that combines both pure treatments using the constant (non-evolving)
frequency of clones (25:75). For each treatment I added the corresponding
pure clone treatments (grey symbols) used to generate the no-evolution
expectation. Values represent mean number of aphids (±1 SE) and the y-axes
differ between left and right panels. Evolution treatments have two letters.
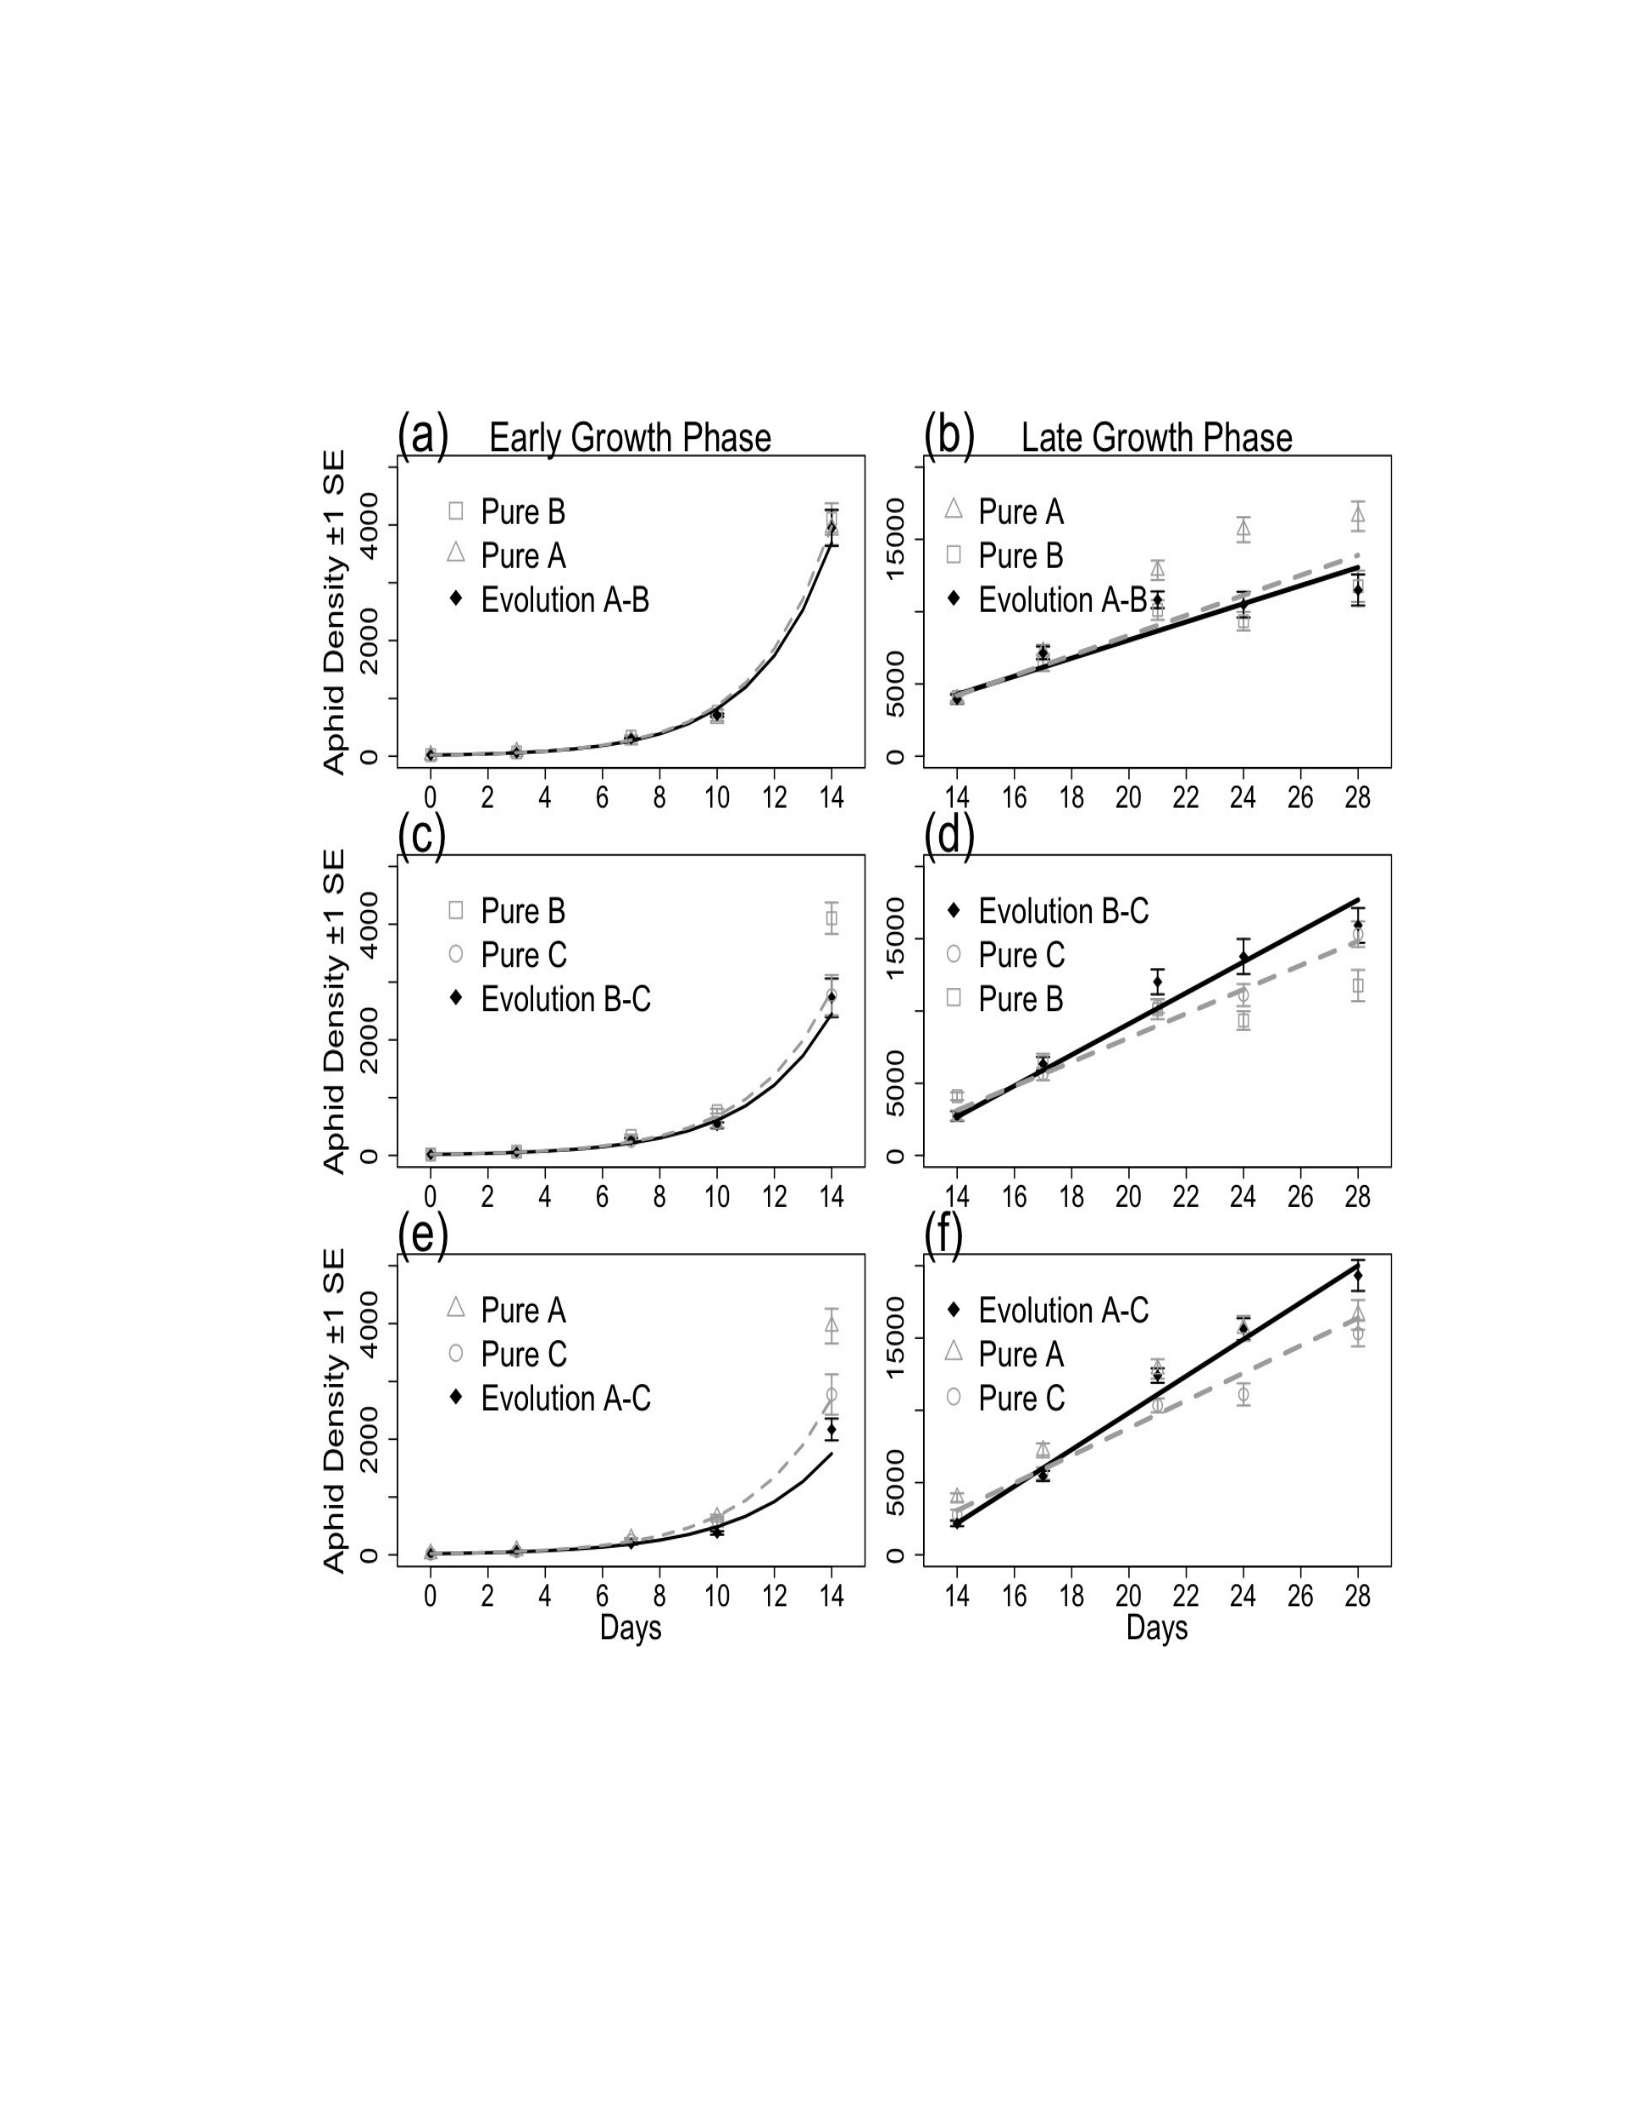
13
5
Figure 3.3

13
6
APPENDIX 3.1: DETAILS OF MULTIPLEX GENETIC ANALYSIS
Methods for Multiplex Genotyping used during Experiment
During the experiment I genotyped aphids using three microsatellite loci
for which the three clones had unique genotypes (Appendix Table 3.1). This
reduced cost and workload while providing robust genotyping. A single
multiplex PCR reaction amplified three microsatellite loci at once (myz2, M40,
and M86) using the PMS1 program. The PCR reactions were identical to those
used to genetically characterize all clones in Chapter 1 except for the use of
a mixed primer solution that contained three forward and three reverse-
labeled primers. To normalize signal strength the concentrations of the primer
pairs were: 1, 3, and 5µM for loci myz2, M40, and M86 respectively.
Appendix Table 3.1: Microsatellite Genotype of Focal Aphid Clones
Microsatellite genotypes of the three clonal lineages of green peach
aphid (Myzus persicae) used in this experiment. These were collected from the
Motte-Rimrock Reserve in spring 2008 from the mustard plant Hirschfeldia
incana. Numbers represent the length of the each allele at each locus. The
three bold loci were used to identify clones during the experiment.
Microsatellite Loci
Clonal Lineage
myz2 myz3 myz9 M40 M49 M86
A186 202 119 119 203 209 125 125 156 171 98 135
B186 196 115 121 195 207 121 125 201 203 110 112
C186 188 117 117 195 209 121 121 154 154 135 135

13
7
LITERATURE CITED
Agashe, D. 2009. The stabilizing effect of intraspecific genetic
variation on population dynamics in novel and ancestral habitats.
The American Naturalist 174:255-67.
Agrawal, A. 2000. Host-range evolution: Adaptation and trade-offs in
fitness of mites on alternative hosts. Ecology 81:500-08.
Agrawal, A. 2004. Plant defense and density dependence in the
population growth of herbivores. American Naturalist 164:113-20.
Agrawal, A. A., N. Underwood, and J. R. Stinchcombe. 2004.
Intraspecific variation in the strength of density dependence in
aphid populations.
Ecological Entomology 29:521-26.
Anderson, W. W. and C. E. King. 1970. Age-specific selection.
Proceedings of the National Academy of Sciences 66:780-86.
Ashley, M. V., M. F. Willson, O. R. W. Pergams, D. J. O'Dowd, S. M.
Gende, et al. 2003. Evolutionarily enlightened management.
Biological Conservation 111:115-23.
Ayala, F. 1968. Genotype, environment, and population
numbers. Science 162:1453-9.
Berry, R., R. Anderson, B. Turner, and L. Taylor. 1978. Genetical
factors in animal population dynamics. P. 53-80 Population
Dynamics.
Blackman, R. 1974. Life-cycle variation of Myzus persicae (Sulz.)(Hom.,
Aphididae) in different parts of the world, in relation to genotype
and environment. Bulletin of Entomological Research 63:595-607.

13
8
Bohannan, B. and R. Lenski. 2000. Linking genetic change to
community evolution: insights from studies of bacteria and
bacteriophage. Ecology Letters 3:362-77.
Bone, E. and A. Farres. 2001. Trends and rates of microevolution in plants.
Genetica 112-113:165-82.
Cappuccino, N. and P. W. Price. 1995. Population Dynamics: New
Approaches and Synthesis. Academic Press.
Chitty, D. 1967. The Natural Selection of self-regulatory behaviour in
animal populations. Proceedings of the Ecological Society of
Australia:51-78.
Crawley, M. 1989. Insect Herbivores and Plant Population Dynamics.
Annual Review of Entomology 34:531-62.
Davis, J., E. Radcliffe, and D. Ragsdale. 2007. Effects of high and
fluctuating temperatures on Myzus persicae (Hemiptera: Aphididae).
Physiological ecology 35:1461-66.
de Barro, P., T. Sherratt, C. Brookes, O. David, and N. Maclean. 1995.
Spatial and temporal genetic variation in British field populations of
the grain aphid Sitobion avenae (F.)(Hemiptera: Aphididae) studied
using RAPD-PCR. Proceedings of the Royal Society B: Biological
Sciences 262:321-27.
Duffy, M. A. and L. Sivars-Becker. 2007. Rapid evolution and
ecological host- parasite dynamics. Ecology Letters 10:44-53.
Dyer, K. F. 1968. Evolution observed -- Some examples of evolution
occurring in historical times. Journal of Biological Education 2:317-
38.
Ehrlich, P. R. and P. H. Raven. 1964. Butterflies and Plants: A Study in
Coevolution. Evolution 18:586-608.

13
9
Endler, J. A. 1991. Genetic heterogeneity and ecology. P. 315–34 in R. J.
Berry,
T. J. Crawford, and G. M. Hewitt, editors. Genes in Ecology: The 33rd
Symposium of the British Ecological Society. Blackwell Scientific
Publications.
Fuller, S., P. Chavigny, L. Lapchin, and F. Vanlerberghe-Masutti. 1999.
Variation in clonal diversity in glasshouse infestations of the aphid,
Aphis gossypii Glover in southern France. Molecular Ecology 8:1867-
77.
Fussmann, G. F., S. P. Ellner, and N. G. J. Hairston. 2003. Evolution as a
critical component of plankton dynamics. Proceedings of the Royal
Society of London. Series B, Biological Sciences 270:1015-22.
Fussmann, G. F., M. Loreau, and P. A. Abrams. 2007. Eco-evolutionary
dynamics of communities and ecosystems. Functional Ecology
21:465-77.
Guldemond, J., W. J. Brink, and E. Belder. 1998. Methods of assessing
population increase in aphids and the effect of growth stage of the
host plant on population growth rates. Entomologia Experimentalis
et Applicata 86:163- 73.
Gurevitch, J., J. Morrison, and L. Hedges. 2000. The interaction
between competition and predation: A meta-analysis of field
experiments. American Naturalist 155:435-53.
Hairston, N. G. J., S. P. Ellner, M. A. Geber, T. Yoshida, and J. A. Fox.
2005. Rapid evolution and the convergence of ecological and
evolutionary time. Ecology Letters 8:1114-27.
Hazell, S., D. Gwynn, S. Ceccarelli, and M. Fellowes. 2005. Competition
and dispersal in the pea aphid: clonal variation and correlations across
traits. Ecological Entomology 30:293-98.
Hazell, S. P., I. A. D. McClintock, and M. D. E. Fellowes. 2006.
Intraspecific heritable variation in life-history traits can alter the
outcome of interspecific competition among insect herbivores. Basic

14
0
and Applied Ecology 7:215-23.

14
1
Hendry, A. P. and M. T. Kinnison. 1999. Perspective: The pace of
modern life: Measuring rates of contemporary microevolution.
Evolution 53:1637-53.
Hufbauer, R. A. and G. K. Roderick. 2005. Microevolution in
biological control: Mechanisms, patterns, and processes.
Biological Control 35:227-39.
Hughes, A. R., B. D. Inouye, M. T. J. Johnson, N. Underwood, and M.
Vellend. 2008. Ecological consequences of genetic diversity.
Ecology Letters 11:609- 23.
Karley, A., W. Parker, J. Pitchford, and A. Douglas. 2004. The mid-
season crash in aphid populations: why and how does it occur?
Ecological Entomology 29:383-88.
Kocourek, F., J. Havelka, J. Berankova, and V. Jarosik. 1994. Effect of
temperature on development rate and intrinsic rate of increase of
Aphis gossypii reared on greenhouse cucumbers. Entomologia
Experimentalis et Applicata 71:59-64.
Kokko, H. and A. Lopez-Sepulcre. 2007. The ecogenetic link between
demography and evolution: can we bridge the gap between theory
and data? Ecology Letters 10:773-82.
Leips, J., J. Travis, and F. H. Rodd. 2000. Genetic influences on
experimental population dynamics of the least killifish. Ecological
Monographs 70:289-309.
Levins, R., R. S. Singh, and M. K. Uyenoyama. 2003. Towards a
population biology, still. P. 21–47 The Evolution of Population
Biology.
Maron, J. L. and E. Crone. 2006. Herbivory: effects on plant
abundance, distribution and population growth. Proceedings of the
Royal Society B: Biological Sciences 273:2575-84.
Mitchell-Olds, T. and D. Bradley. 1996. Genetics of Brassica rapa .3.

14
2
Costs of disease resistance to three fungal pathogens. Evolution
50:1859-65.

14
3
Muller, C. B., I. S. Williams, and J. Hardie. 2001. The role of nutrition,
crowding and interspecific interactions in the development of winged
aphids. 26:330-40.
Onstad, D., S. Fang, and D. Voegtlin. 2005. Forecasting seasonal
population growth of Aphis glycines (Hemiptera: Aphididae) in
soybean in Illinois. Journal of Economic Entomology 98:1157-62.
Pelletier, F., D. Garant, and A. P. Hendry. 2009. Eco-evolutionary
dynamics.
Philosophical Transactions of the Royal Society B: Biological
Sciences 364:1483-89.
Pimentel, D. 1961. Animal population regulation by the genetic feed-
back mechanism. The American Naturalist 95:65-79.
Pimentel, D. 1968. Population regulation and genetic feedback.
Science 159:1432-37.
Pimentel, D. and R. Al-Hafidh. 1965. Ecological control of a parasite
population by genetic evolution in the parasite-host system. Annals
of the Entomological Society of America 58:1-6.
Pimentel, D., W. P. Nagel, and J. L. Madden. 1963. Space-time
structure of the environment and the survival of parasite-host
systems. The American Naturalist 97:141-67.
Pinheiro, J. and D. Bates. 2000. Mixed-Effects Models in S and
S-PLUS. Springer-Verlag.
Pinheiro, J. C., D. M. Bates, S. DebRoy, and D. Sarkar. 2009. nlme:
Linear and Nonlinear Mixed Effects Models.
R Development Core Team. 2009. R: A language and environment for
statistical computing. R Foundation for Statistical Computing,
Vienna, Austria.

14
4
Reznick, D. N. and C. K. Ghalambor. 2001. The population ecology of
contemporary adaptations: what empirical studies reveal about the
conditions that promote adaptive evolution. Genetica 112-113:183-
98.
Ro, T. and G. Long. 1999. GPA-Phenodynamics, a simulation model for
the population dynamics and phenology of green peach aphid in
potato: formulation, validation, and analysis. Ecological Modelling
119:197-209.
Rochat, J., F. Vanlerberghe-Masutti, P. Chavigny, R. Boll, and L.
Lapchin. 1999. Inter-strain competition and dispersal in aphids:
evidence from a greenhouse study. Ecological Entomology 24:450-
64.
Roughgarden, J. 1979. Theory of Population Genetics and Evolutionary
Ecology: An introduction.
Saccheri, I. and I. Hanski. 2006. Natural selection and population
dynamics.
Trends in Ecology & Evolution 21:341-47.
Schlager, G. 1963. The ecological genetics of the mutant Sooty in
populations of Tribolium castaneum. Evolution 17:254-73.
Shertzer, K., S. Ellner, G. F. Fussmann, and N. G. J. Hairston. 2002.
Predator- prey cycles in an aquatic microcosm: testing hypotheses
of mechanism.
Journal of Animal Ecology 71:802-15.
Sibly, R. and J. Hone. 2002. Population growth rate and its determinants:
an overview. Philosophical Transactions of the Royal Society of London
Series B- Biological Sciences 357:1153-70.
Slobodkin, L. B. 1980. Growth and Regulation of Animal Populations. 2nd
edition.
Dover Publications Inc.

14
5
Terhorst, C. P., T. E. Miller, and D. R. Levitan. 2010. Evolution of prey
in ecological time reduces the effect size of predators in
experimental microcosms. Ecology 91:629-36.

14
6
Thompson, J. N. 1998. Rapid evolution as an ecological process. Trends
in Ecology & Evolution 13:329-32.
Via, S. and A. J. Shaw. 1996. Short-term evolution in the size and
shape of pea aphids. Evolution 50:163-73.
Vorburger, C. 2005. Positive genetic correlations among major life-
history traits related to ecological success in the aphid Myzus
persicae. Evolution 59:1006- 15.
Vorburger, C. 2006. Temporal dynamics of genotypic diversity reveal
strong clonal selection in the aphid Myzus persicae. Journal of
Evolutionary Biology 19:97-107.
Wallner, W. 1987. FACTORS AFFECTING INSECT POPULATION-DYNAMICS:
Differences between outbreak and non-outbreak species. Annual
Review of Entomology 32:317-40.
Weber, G. 1985a. Genetic variability in host plant adaptation of the
green peach aphid, Myzus persicae. Entomologia Experimentalis et
Applicata 38:49-56.
Weber, G. 1985b. Population genetics of insecticide resistance in the
green peach aphid, Myzus persicae (Sulz.) (Homoptera, Aphididae).
Zeitschrift für Angewandte Entomologie 99:408-21.
Whitham, T. G., J. K. Bailey, J. A. Schweitzer, S. M. Shuster, R. K. Bangert,
et al.
2006. A framework for community and ecosystem genetics: from genes
to ecosystems. Nature Reviews Genetics 7:510-23.
Yoshida, T., L. E. Jones, S. P. Ellner, G. F. Fussmann, and N. G. J.
Hairston. 2003. Rapid evolution drives ecological dynamics in a
predator-prey system. Nature 424:303-06.

14
7
CHAPTER FOUR: THE IMPACT OF RAPID EVOLUTION ON
POPULATION DYNAMICS IN THE WILD: EXPERIMENTAL
TEST OF ECO-EVOLUTIONARY DYNAMICS
ABSTRACT
Rapid evolution challenges the assumption that evolution is too
slow to impact short-term ecological dynamics. This has led to a push
to empirically study how evolution and ecological processes
reciprocally impact each other on short time scales termed ‘Eco-
Evolutionary Dynamics’. In this study I tested how rapid evolution
impacts concurrent population dynamics using an aphid (Myzus
persicae) and an undomesticated host (Hirschfeldia incana) in replicated
wild populations. I manipulated the amount of genetic variation in
intrinsic growth rate within aphid populations, which altered rates of
evolution (changing clonal, or gene, frequencies) in both caged and
uncaged populations. Evolving populations grew significantly faster,
up to 42%, and reached higher densities, up to 67% higher, compared
to non-evolving control populations. Moreover, the magnitude of the
impact of evolution on population growth rate increased with observed
rates of evolution. Yet this effect only occurred in uncaged treatments

14
8
that were open to a natural spectrum of herbivores and predators.
Also, the relative fitness of competing clones changed with density.
This suggests that as evolution

14
9
changes density, density feeds back changes the selective
environment leading to reciprocal eco-evolutionary dynamics at the
same timescale. Finally, aphid evolution did not significantly influence
their host’s fitness.
INTRODUCTION
Ecological and evolutionary forces are usually thought to
influence each other asymmetrically, i.e. ecology shapes evolution
(Levins and Lewontin 1980, Hairston et al. 2005, Kokko and Lopez-
Sepulcre 2007). Ecological changes are often assumed to occur
independently of evolution, e.g. an organism’s population size is
reduced due to a drought. Evolutionary changes, however, are usually
a consequence of the ecological environment, e.g. desiccation
resistance evolves in response to droughts. Most ecological models
and studies make the simplifying assumption that evolution does not
impact short-term ecological processes because evolution is perceived
to act on a much slower time scale relative to ecological interactions
(Slobodkin 1980, Endler 1991, Thompson 1998, Hairston et al. 2005,
Pelletier et al. 2009). This assumption has now been challenged by
dozens of studies documenting rapid evolutionary changes in nature
occurring on ‘ecological time scales’, sometimes within a few
generations (Thompson 1998, Hendry and Kinnison 1999, Reznick and

15
0
Ghalambor 2001, Ashley et al. 2003). Given the convergence of time
scales, the next step is to assess whether rapid evolution and
concurrent ecological dynamics influence each other reciprocally
(Pelletier et al. 2009). This reciprocal interaction defines

15
1
eco-evolutionary dynamics (Hairston et al. 2005, Bull et al. 2006,
Kokko and Lopez-Sepulcre 2007). This process could have
important implications for fisheries, pest, and infectious diseases
management where accurate evolutionary and population
dynamic predictions are required (Hufbauer and Roderick 2005).
A growing body of eco-evolutionary dynamic theory, based on
very different biological assumptions, generally concludes that when
rapid evolution occurs during the course of an ecological interaction, it
can significantly alter quantitative and qualitative ecological
predictions (reviewed in Day 2005, Fussmann et al. 2007). Theoretical
models suggest that such eco-evolutionary dynamics can influence the
trajectory of growth of single populations (Anderson and King 1970),
the density and stability of victim-exploiter systems (Pimentel 1961,
Fussmann et al. 2003, Bull et al. 2006, Duffy and Sivars-Becker 2007),
the structure of multi-species communities (Loeuille and Leibold
2008), and even ecosystem processes (Loeuille et al. 2002).
I focus on quantifying the impact of rapid evolution on
concurrent ecological dynamics. This aspect of eco-evolutionary
dynamics has received less attention than the impact of ecology on
evolution (Bull et al. 2006, Ezard et al.
2009, Pelletier et al. 2009). One fruitful empirical approach consists of
using models to assess the influence of ecological and evolutionary

15
2
processes on observed ecological dynamics (Hairston et al. 2005,
Duffy and Sivars-Becker 2007, Ezard et al. 2009). In such studies,
rapid evolution is usually strongly

15
3
correlated with ecological dynamics and ecological predictions are
usually significantly improved by including evolutionary dynamics. A
second approach consists of post-hoc comparisons of the ecological
properties of ancestral populations versus populations that have
undergone evolution. Such studies assess how evolution has altered
life history traits (Reznick and Bryga 1996), population dynamics
(Hanski and Saccheri 2006), community structure (Post et al. 2008)
and ecosystem processes (Bassar et al. 2010). These field studies
demonstrate the strength and generality of rapid evolution’s
ecological effects.
Other empirical studies can quantify the impact of rapid
evolution as populations evolve. These powerful studies test the
causal impact of rapid evolution on population dynamics by
experimentally manipulating the occurrence of evolution itself thus
directly comparing evolving and non-evolving populations. Pimentel
first used this approach to show how the population dynamics of a
parasitoid wasp were changed as its housefly host evolved resistance
compared to a non-evolving control (Pimentel et al. 1963, Pimentel
and Al-Hafidh 1965, Pimentel 1968). By replacing the control housefly
population every generation, he prevented the evolution of resistance.
Rapid evolution within a few years in the host reduced the parasitoid’s
population size and variance even though host population size was

15
4
held constant. This experimental approach has only been attempted a
handful of times (Tuda 1998, Bohannan and Lenski 1999, Yoshida et
al. 2003, Fussmann et al. 2007, Agashe 2009, Terhorst et al. 2010). In
my previous study (Chapter 3) I experimentally quantified the impact
of aphid rapid

15
5
evolution on population growth rate compared to non-evolving
control populations in the greenhouse. I found that certain rapid
evolution treatments significantly accelerated population growth rate
by as much as 34%. These studies demonstrate how evolutionary
dynamics influence the dynamics and outcome of short-term
ecological phenomena and argue convincingly for causality, but only
under carefully controlled laboratory conditions.
Here I assess whether and how strongly rapid evolution impacts
concurrent ecological dynamics in natural populations. While
recognizing the value of lab studies, field experiments are crucial
because ecological context can influence both ecological and
evolutionary processes (Holt 2005). Experiments conducted in the wild
within realistic communities encompass more realistic levels of biotic
and abiotic variation as well as gene flow. These confounding factors
could impose different selective pressures, altering the rate or
direction of evolution itself, or they could interfere with the manner in
which rapid evolution impacts population dynamics, e.g. by altering
the strength of density regulation. All of these problems imply that
eco-evolutionary dynamics should be studied in the wild since non-
intuitive results could occur that differ significantly from predictions
based only upon laboratory experiments.
Most eco-evolutionary dynamics studies focus on interspecific

15
6
interactions and all experimental systems to my knowledge utilize
predator-prey or host- parasitoid model systems. Whether short-term
interspecific eco-evolutionary dynamics are important in plant-
herbivore systems remains an open question.

15
7
Although many studies show that plant genotypes can influence the
composition of arthropod communities (reviewed in Whitham et al.
2006, Hughes et al. 2008) they have yet to document these effects of
rapid evolution itself. In my previous greenhouse experiment I found
that aphids significantly harm their host plant, reducing above ground
biomass by a factor of five (Chapter 3). Yet aphid evolution, although
accelerating population growth rate, did not alter damage to the host.
Field populations permit better quantification of host plant fitness
differences because pollination can occur. Thus in this experiment I
more thoroughly quantify host fitness by investigating host
characteristics that are more tightly linked to fitness such as flower
and seed production in order to explore interspecific eco-evolutionary
dynamic effects.
My specific objective was to experimentally assess the impact of
rapid evolution on concurrent population dynamics in the wild. To do
so, I used my study system wherein evolution can easily be
manipulated. I selected the green peach aphid (Myzus persicae) and a
local wild invasive annual mustard, Hirschfeldia incana, as a host. I
manipulated aphid populations’ genetic composition and evolutionary
potential by controlling which clones were present within each
treatment. In order to explore the importance of ecological context I
conducted this study in caged and uncaged populations in the wild; the

15
8
difference is that uncaged populations admit a natural spectrum of
herbivores and predators. I specifically tested the following
hypotheses-predictions: 1) If rapid evolution impacts population dynamics,
then the observed population dynamics

15
9
of evolving aphid populations will differ significantly from those of non-evolving
aphids, 2) If ecological context is important, then the impact of rapid evolution on
population dynamics will differ between caged and uncaged treatments, and 3) If
rapid evolution in aphids impacts their host plant, then plant fitness will differ
significantly when exposed to evolving versus non-evolving aphids.
MATERIALS AND METHODS
I- Study System
Myzus persicae is considered the world’s most important crop
pest and thus its life-history and ecology are well-studied (Mackauer
and Way 1976). It is highly amenable to experimental evolution
because of its short generation time (6-10 days), ease of culture, and
the large magnitude of genetic variation identified in multiple traits
(Chapter 1; Vorburger 2005). This cyclically parthenogenetic aphid
undergoes sexual reproduction to survive cold winters. In the spring
populations are replete with multiple clonal lineages that reproduce
asexually until the fall (Mackauer and Way 1976). Aphid populations
rapidly
evolve through natural clonal selection within months, changing gene
frequencies and mean trait values (Via and Shaw 1996, Vorburger
2006). This parthenogenetic lifestyle permitted the experimental
manipulation of the level of genetic variation within a population by

16
0
controlling the initial frequency of clones therein.

16
1
In 2008, I collected multiple clonal lineages from a single wild
population from the Motte-Rimrock Reserve in Perris California. I
identified clones using 6 microsatellite markers and characterized their
intrinsic per capita growth rates experimentally (Chapter 2; Sloane et
al. 2001, Wilson et al. 2004). I selected three of these clones for this
and previous experiment (Chapters 2 & 3) that differ in intrinsic growth
rate (detailed below).
II- Field Experiment Design
The focal experiment was conducted in a wash area (20m by
12m), which was cleared of vegetation, at the Reserve where the
aphids were collected. A wire fence was erected to keep out large
vertebrate herbivores. Clonal aphid reproduction was maintained by
the long days and high temperature during the month of July
(Blackman 1974). To minimize variation in this primarily outcrossing
plant, plants used in the experiment were grown from the seeds of a
single H. incana plant collected in 2008 at the Reserve and germinated
in the greenhouse. Two week old seedlings, were planted 1.4 m apart
in the field site. Plants were watered three times a week because there
was no measurable precipitation during the experiment. Plants were
caged in a thin transparent mesh (Bridal Organza, #664-7242, Jo-Ann)
to prevent insect damage and permit aphid populations to become

16
2
established. On day 0 of the experiment, seven different aphid
treatments were initiated by placing 20 third instar aphids onto each
plant. These aphids came from stock greenhouse clonal populations,
regularly tested

16
3
for contamination, that were maintained on H. incana. Replicates were
initiated on three consecutive days starting June 30th 2009. On day 1
missing aphids were replaced with fourth instar aphids. On day 13, for
half of the plants, the cage mesh was lifted but tied to the top of the
wire frame. This maintained consistent shade between treatments but
allowed full access to the arthropod community. Thus aphid
treatments were fully crossed with caging treatments. In uncaged
plants, competitors, predators, pollinators, and other herbivores were
seen interacting with the aphids and their host.
I used three aphid clonal lineages, identified as ‘A’, ‘B’, and ‘C’,
that differ in microsatellite markers (Appendix 3.1). A preliminary
greenhouse experiment revealed that they also differ in exponential
growth rates when grown in pure cultures (Chapter 2, daily per capita
growth rate of clone A = 0.268 ± 0.002, B = 0.263 ± 0.004, and C =
0.251 ± 0.004). Using these clones, seven aphid treatments were
established as follows: three evolution treatments consisted of aphid
populations (on a single plant) that were initially composed of two
different clones (10 individuals of each clone for a total of 20 aphids).
These populations have genetic variation in fitness (e.g. A clone’s rm is
greater than that of the C clone) and thus could evolve by changing in
clonal frequency (away from the initial ratio). To explore how the rate
of evolution might alter the magnitude of evolution’s impact on

16
4
population dynamics, I established evolution treatments that consisted
of all three two-way combinations (A-B, B-C, and A-C). Three different
non-evolution (pure clone) treatments received aphids of only one of
the

16
5
three clones. Because all individuals were of the same genotype within
these pure populations, gene frequencies could not change, thus
preventing evolution. Finally, ‘no- aphid control’ treatments did not
receive any aphids. Each treatment combination was assigned in a
randomized block design and replicated 8 times for a total of 112
plants.
III - Rates of Evolution
On days 13, 20, and 31 I collected 20, 50, and 70 aphids
respectively from every population in order to track changes in clonal
frequencies (evolution).
Between 16 and 32 aphids from each sample were genotyped (for a
total of 2213 aphids) at three microsatellite loci (for detailed genetic
methods see Appendix 3.1). I calculated the frequency of the faster
clone for each treatment, sampling day and replicate separately. For
each treatment I then determined whether the mean frequency of the
faster clone differed significantly from the initial clonal frequency of
50% using one-sample t-tests. I also tested how caging, evolution
treatment, and their interaction impacts the final frequency of clones
using a general linear model. All analyses were implement in R (v.
2.11.1; R Development Core Team 2009) using the nlme package
(Pinheiro et al. 2009).

16
6
IV - Aphid Population Dynamics
Aphid population dynamics were quantified by counting all
aphids on days 3, 6, 10, 14, 17, 20, 24, 27, 31, and 36. When
populations rose above 2000

16
7
aphids per plant I sub-sampled by counting one half of every leaf. The
removal of cages on day 13 for half the treatments qualitatively
altered population dynamics. Because of this I analyzed caged and
uncaged treatments separately.
Treatments that remained caged for the entire experiment grew
exponentially until day 27 (Fig. 4.1.a). On day 31, population growth
started to slow and on day 36 populations crashed due to plant
senescence. The uncaged treatments were initially caged for 13 days
during which the aphids grew exponentially (Fig. 4.1.b). Once cages
were removed many lower leaves were damaged or consumed by
vertebrate herbivores which reduced growth rate. However, after this
reduction populations once again grew exponentially until day 31
before crashing on day 36 (Fig. 4.1.c). Thus I analyzed these time
periods separately (days 0 to 13 and then starting day 13 to 31) for
the uncaged treatments, this greatly improved residuals normality for
all treatments.
I thus had three separate analyses; caged from days 0 to 27,
uncaged days 0 to 13, and uncaged 13 to 31. For each of these I
tested for differences in population growth rate between treatments
using the following exponential
growth model:
Nt = N0 * e(rm *day)

16
8
where Nt is the number of aphids on day t, N0 is the number of aphids
on day 0, and rm is the intrinsic growth rate. Models were analyzed
using linear mixed- effect models (LME) where the dependent variable
was LN(x) transformed number of aphids and the fixed effects were
aphid treatment, day (as the main

16
9
covariate), and their interaction. Because the repeated aphid counts on
the same plant violated the assumption of independent observations, I
set unique plant identity, nested within block, as a random effect on
population growth rate and intercept and used an autoregressive
correlation error structure (Pinheiro and Bates 2000). I modeled
increasing variance through time by using a variance function that
increases with the power of the variance covariate (varPower).
Because plants differed slightly in size and stage of development at
the start of the experiment I explore whether the inclusion of these
covariates improved model fit. Initial plant size was measured as the
number of true leaves and rosette width and combined into a principal
component score. Only the first principal component was used since it
explained 73% of the variation. Stage of development was quantified
into an ordinal scales (1= rosette, 2 = low bolt, 3= bolt). Only in the
caged treatments did the covariates improve fit and were kept in the
final model. All analyses were implement in R (v. 2.11.1 R
Development Core Team 2009) using the nlme package (Pinheiro et al.
2009).
IV - The Impact of Evolution on Population Dynamics
My objective is not to predict which clone will out compete the
others but to statistically test the impact of changes in clonal

17
0
frequency on concurrent population dynamics (Hypothesis 1). Ideally
one would compare the observed aphid population dynamics in the
evolution treatment to those of a mixed population, containing the
same clones, but cannot evolve (remains at a

17
1
frequency of 50:50 even though clones differ in fitness). This is not
possible in my field experiment. I thus generated the expected
population growth parameters of a non-evolving population (that
remains at constant clonal frequency) by using the pure aphid
treatments. I tested three a priori null hypotheses that the population
growth rate (slope) and density (intercept) do not differ between each
evolution treatment and their corresponding pure treatments, e.g. A-C
evolution treatment vs pure A and pure C treatments. I did so with the
use of planned contrasts that are orthogonal comparisons between a
subset of the aphid treatment levels within the LME analysis. I set the
planned contrast coefficients of the no-evolution expectation to match
those of the initial clonal frequency (e.g. pure A= -0.5 and pure C= -0.5
and these are compared to the AC evolution treatment= 1). The
contrast matrix is found in Chapter 3. Thus differences in growth rate
or density between the evolution treatment and the no-evolution
expectation represent the impact of changes in the frequency of clones
(rapid evolution) on population dynamics. I present the results of
planned contrasts for the slope and intercept estimates of these
comparisons.
V - The Effect of Density on Natural Selection
I also investigated whether competing clones reacted differently

17
2
to changes in density in order to explore whether more complex eco-
evolutionary dynamics are occurring such as density-dependent
selection. To test this possibility I compared how the relative fitness of
competing clones, in each

17
3
evolution treatment, depends on density. For each population I
calculated the quantity of each clone on days 0, 13, 20, and 31 by
multiplying their genotypic frequencies by total population size. Next I
calculated per capita growth rate in each time period (days 0-13, 13-
20, and 20-31) using ln(N2)- ln(N1) / (day2-day1), where N= number of
aphids of this clone (Agrawal et al. 2004). This was done for each clone
in each evolution treatment. I then fitted a linear mixed-effect model
on these growth rates. I fit separate models for caged and uncaged
populations. Fixed effects were the treatment (combination of identity
of the focal clone, identity of the competitor; e.g. clone A competing
with clone B) and initial density in that time period and their
interaction. I included plant identity and block as a random effect as
well as autocorrelation error. With the use of planned contrasts I
determined if density differentially reduced growth rate between
competing clones.
VI - Host Plant Fitness
I first determine whether aphid treatments impact their host’s
growth by measuring final above ground dry biomass as done in
previous experiments. I fit a general linear model with plant weight as
the response variable, the fixed effect was aphid treatment, including
the 7th treatment which did not receive any aphids, the covariates

17
4
were initial plant stage of development and the first principal
component of plant size. Planned contrasts were used to determine
whether aphid herbivory in general influence plant final weight. Other
contrasts,

17
5
mimicking those used in the population dynamic models, were used to
determine whether plants with evolving aphid populations differed in
weight compared to plants with non-evolving populations.
I also quantified plant fitness traits. I first calculating flower-days
by summing my counts of the number of flowers present on every
sampling day multiplied by the length of that counting period. When
harvesting the plants I estimated the total number of seeds and mean
seed dry mass by sub-sampling. I performed a similar analysis as
described above but given correlation among traits I did so in a
MANCOVA framework.
Finally I determined whether final plant dry biomass predicted
plant fitness by fitting three separate linear models one focusing on
flower days, one on seed number, and one on mean seed weight. The
dependent variable was final plant weight, and the covariates were
stage and size of the plant at the start of the experiment. In all three
analyses these covariates were non-significant and did not improve
model fit and were thus removed. I thus present results from Pearson
correlations without the covariates.
RESULTS:
I - Pure Clone Treatments
Pure clone treatments differed greatly in their population

17
6
dynamics in the field (Fig. 4.1) as expected from greenhouse studies.
In the caged treatments, the exponential population growth rate
(slope) of the A clone was fastest. It grew

17
7
9.4% faster than the B clone and 14.5% faster than the C clone (Fig.
4.1.a). The B clone in turn grew 4.7% faster than the C clone. The
caged treatments reached very high densities approximately ten times
higher than the uncaged treatments (see y-axis scales in Figs. 4.1.a &
c). This difference occurred because of strong vertebrate herbivory I
observed when the cages were removed from the uncaged treatments
on day 13. This herbivory reduced plant biomass and in addition to
predation on the aphids slow the uncaged aphid’s population growth.
The pattern of growth rate between the pure clone populations was
similar in the uncaged treatments. Within the first 13 days, clones with
higher expected rm grew at faster rate. The A clone grew 9.8% faster
than the B clone and 19.3% faster than the C clone (Fig. 4.1.b). The B
clone in turn grew 8.6% faster than the C clone. After cages were
removed, the A clone still grew fastest, 12.1% faster than the B clone
and 19.3% faster than the C clone and finally the B clone grew 6.4%
faster than the C clone (Fig. 4.1.c).
II - Evolution Treatments - Genetic Analyses
Within only 20 days, in caged and uncaged populations, the
faster growing clones in the A-C and in the B-C evolution populations
significantly increased in frequency compared to their initial frequency
of 50% (one sample t-tests, all p- values < 0.03; Fig. 4.2). By day 31 all

17
8
evolution treatments showed significant evolution in the expected
direction (all p-values <0.01, except for caged A-B p= 0.1). The faster
growing clones in the caged populations reached on average

17
9
71% frequency, which is significantly less than the uncaged population
reaching 79% (p = 0.04, Fig. 4.2). This implies that caged treatments
evolved 38% slower than in uncaged (29% increase in frequency
divided by 21%). Aphid treatments differed significantly in their rate of
evolution (p < 0.001) the A-C and B-C treatments differed significantly
from A-B but not between each other (Fig. 4.2). Caging did not interact
with evolution treatment (p = 0.46, Fig. 4.2). Thus the A clone in the A-
C evolution treatments reached on average 85%, the B clone in the B-
C treatments reached 80%, and the A clone in the A-B treatments
reached 62% (Fig. 4.2). Thus evolution treatments that differ in their
rate of evolution were successfully created.
III - Impact of Aphid Evolution on Aphid Population Dynamics
To test the impact of rapid evolution on concurrent population
dynamics I compared the observed population dynamics in evolving
populations to those observed in both corresponding pure treatments
by using planned contrasts proportional to the initial frequency of
clones (i.e., population dynamics without evolution). In the caged
treatments, although rapid evolution occurred leading to an increase
in the frequency of the faster growing clone this did not alter the
evolving populations growth rate compared to their no-evolution
expectations (Table 4.1, Fig. 4.3). The B-C evolution treatment, even

18
0
though it grew 4.2% faster than its no-evolution expectation this
differences was not significant (p = 0.09). As for the uncaged
treatments, in the early growth phase, none of the

18
1
evolution treatments differed in growth rate or density from their no-
evolution expectations (Table 4.1, Figs. 4.4.a, b, c). After day 13, in
the uncaged treatments all evolution treatments grew at a
significantly faster rate than their corresponding no-evolution
expectations (between 33% and 42% faster, Table 4.1, Figs. 4.4.d, e,
f). I also created predicted population densities for each treatment
based on the model fitted parameters. This approach is more reliable
than simply comparing densities on day 31 because the fitted values
incorporate all the time series data. Thus predicted population sizes on
day 31 in the evolution treatments reached much higher densities
than expected without evolution (A-B treatment +13.7%, B-C +67%,
and A-C +17.5%, Table 4.1).
Although evolution in the A-B and B-C treatments have similarly
accelerated population growth rate (by 33% and 35%) their
predicted densities on day 31 differed greatly because the fitted
models incorporate differences in intercept. Moreover, the evolution
treatment with the slowest rate of evolution (A-B) showed the
smallest effect of rapid evolution on population growth rate. The
faster evolving treatments (A-C and B-C), which do not differ in their
rate of evolution, showed a stronger positive impact on population
dynamics.

18
2
IV -The Effect of Density on Natural Selection
I tested for density-dependent natural selection by fitting a
linear mixed- effect models that compared how strongly density
reduces the growth rate of each clone in the evolution treatments.
Increases in density more severely

18
3
reduced the growth of clone C than clone A (caged p<0.001; uncaged
p < 0.001, Table 4.2) and also compared to clone B (caged p= 0.065;
uncaged p < 0.001, Table 4.2). Thus the relative fitness of clone C
decreases in response to increased population density when
competing with another clone.
V - Impact of Aphid Evolution on Host Fitness
Because rapid evolution did not impact aphid dynamics in the
caged treatments I only present results for the uncaged treatments.
Firstly, my analysis revealed that aphid herbivory significantly reduced
final host biomass (mean ± SE weight with aphids = 15.3 g. ± 2.6,
weight without aphids = 20.8 g. ±2.2; GLM, p = 0.014). However,
although rapid aphid evolution significantly increased aphid growth
rate and density this did not cause more damage to the host plant than
the corresponding no-evolving aphid populations (GLM, all three p-
values > 0.11). My multivariate analysis of fitness for flower-days, seed
number, and seed weight found no difference between any aphid
treatments including the no-aphid treatment (MANCOVA, Wilks = 0.57,
F= 1.1, overall treatment p-value = 0.37, planned contrasts p-values
all > 0.12). Although no-aphid treatments had higher plant fitness
means there was a lot of variation that overwhelmed any trends (e.g.
mean ± SE for flower-days for no-aphid treatment = 1683 ± 373,

18
4
mean for aphid treatments = 1542 ± 135).

18
5
I also documented significant correlations between the above
ground dry biomass of the plants and the number of seeds produced
and total flower-days. Mean seed weight, however, was marginally
non-significant (p=0.084, Table 4.3).
DISCUSSION
I experimentally assessed the impact of rapid evolution on
concurrent ecological dynamics in the wild for the first time. I found
that rapid evolution, occurring within weeks, significantly accelerated
population growth rates and density as the frequency of faster
growing clones increased (Hypothesis 1), yet this change in aphid
density and growth rate did not impact host plant fitness (Hypothesis
3). I also found that the magnitude of the impact of rapid evolution on
population dynamics depended positively on the rapidity of evolution
and on ecological context (Hypothesis 2). Unexpectedly, in caged
populations, although rapid evolution occurred this had no impact on
population dynamics. This highlights the important affect that
ecological context can have the strength of eco-evolutionary
dynamics. My results have important implications for basic as well as
applied ecological and evolutionary biology.
In my field experiment, pure aphid treatments grew at
significantly different rates (Fig. 4.1). As expected, when populations

18
6
contained two clones their genetic composition quickly changed as the
faster clones increased in frequency (Fig. 4.2). For example the
frequency of the C clone in the uncaged A-C evolution populations was
reduced by more than four fold within only 31 days.

18
7
Similar large changes in clonal frequencies have been observed in
other wild aphid populations (Vorburger 2006). This change in clonal
frequency is not surprising nor is it novel. The novelty of my study lies
in quantifying the effect of this evolutionary change on the
population’s growth rate within that short time period. Hypothesis 1 was
supported but only in the natural uncaged treatments. Focusing on
these results, I saw that evolving populations grew at a significantly
faster rate than the expected rate if evolution is not taken into
account (Fig. 4.4, Table 4.1). Endler (1991) foreshadowed these results
while discussing early ecological-evolutionary models: “The time course
of total population size is not predictable from the average of the demographic
parameters of all genotypes. … genotypes contribute unequally and differently to
population size as they change in frequency during the course of natural
selection.” Moreover, the magnitude of this effect was dependent on the
observed rate of evolution (Hypothesis 2). The more quickly a
population evolves the strong impact of that rapid evolution on
population growth rate (Figs. 4.2 and 4.4, Table 4.1).
Even more complex and unexpected qualitative changes in
population dynamics have been observed in some laboratory studies
of rapid evolution. In Yoshida et al.’s (2003) study of rotifer and algae
in chemostats, rapid evolution in algae caused the predator-prey
population dynamics to change from being 1/4 out-of-phase to being

18
8
perfectly out-of-phase. In another rotifer study, Fussmann et al. (2003)
found that rapid evolution caused two peaks in population size but
only a single peak when populations could not evolve. These systems
might

18
9
inherently have more opportunity for qualitative changes in population
dynamics since both species undergo multiple generations within the
experiment. Thus the population dynamics and potentially the
evolutionary dynamics of both species might be altered. This is not
what occurs in many plant-herbivore systems. Many insect populations
grow rapidly then crash because of plant senescence, predation,
parasitism or climate (Wallner 1987, Ro and Long 1999, Karley et al.
2004). Such dynamics often occur within one generation of the plant.
Given differences in these types of interspecific interactions in nature
it is important to investigate the impact of rapid evolution in different
model systems.
All three uncaged evolution treatments accelerated population
growth rate. However evolution seems to have had a more pronounced
impact on population dynamics in the B-C evolution treatment (Fig
4.e). This occurred because the A- B and A-C evolution treatments had
lower day 13 densities than their corresponding no-evolution
expectations (Fig. 4.d & f), although these differences were not
significant (Table 4.1). Evolution in these two treatments compensated
for this effect and eventually overtook the no-evolution expectations.
On the other hand the B-C evolution treatment has similar intercept
values thus a 35% increase in growth has a very large effect on final
density.

19
0
Given these differences it is clear that the increase in growth rate in the
evolution treatments is not simply due to some evolution treatments
having lower day 13 densities. Overall my results, in addition to my
previous greenhouse experiment (Chapter 3 and those of Pimentel 1968,
Fussmann et al. 2003, Yoshida et al.

19
1
2003) argue that evolution should no longer be assumed to be too
slow to impact short-term ecological dynamics (Slobodkin 1980, Endler
1991, Thompson 1998, Hairston et al. 2005). Rapid evolution can be a
strong driver of population dynamics.
My experiment, however, demonstrated that ecological context
can have an important impact on rapid evolution’s ecological effects.
When I designed the experiment I created caged and uncaged
treatments because I hypothesized that environmental biotic variation
might overwhelm any effects of evolution. The impact of rapid
evolution in the uncaged treatments was evident even in the face of
potentially confounding factors. First, when cages were opened on day
13, vertebrate herbivores chewed off many large leaves causing a
reduction in aphid growth. Second, a competing aphid species
(Brevicoryne brassicae) colonized some plants (although remained at low
density) as did aphid predators (e.g. spiders, coccinellid larvae and
adults) that seemingly influenced the treatments randomly, adding to
variation between replicates. Finally, on average, 10% of the aphids
genotyped were immigrants. I did not remove the effect of these
ecological processes because they occur in natural populations. These
confounding factors and environmental variation strengthen the
importance of my results because the impact of rapid evolution on
population dynamics was still measurable and large.

19
2
I expected a stronger impact of rapid evolution on population
dynamics in the caged treatments because migration, interspecific
competition, predation,

19
3
and non-aphid herbivory were prevented. Surprisingly, even though
populations rapidly evolved in the caged treatments this did not
significantly impact population dynamics (Fig. 4.3, Table 4.1). I posit
that my ability to detect an effect of evolution might have been
reduced by the large population sizes reached in the caged
treatments (up to 50 000 aphids) because counts become less
accurate at such densities. The coefficient of variation for triplicate
counts of the same plant at a density of 6000 aphids was 0.02
whereas it was 0.13 for a plant with 26000 aphids. Moreover caging
significantly reduced the rate of evolution by 38% (Fig. 4.2) thus
potentially reducing the effect of evolution.
Aphids clones might differ in susceptibility to predation (Muller 1983,
Pilson 1992) a selective force not present in cages thus potentially
slowing the rate of evolution cages. Another possibility is that the rate
of evolution was reduced because populations were less density-
regulated than the uncaged populations. Stronger competition
between clones could magnify selective advantages and change the
selection environment (Table 4.2, and see text below). Aphid clones
are known to differ in how their growth rates respond to increased
population density (Agrawal et al. 2004). I argue that caged aphid
populations were under less severe population regulation because per
capita growth rates were much higher throughout the experiment

19
4
(mean daily rm= 0.25) compared to uncaged populations in the second
growth phase (rm = 0.08). This difference can be attributed to the fact
that the uncaged host plants were damaged by herbivores, which
reduced plant size. Final mean dry weight for caged plants was 52%

19
5
higher than uncaged (t-test, p < 0.001). Uncaged plants also had
smaller leaves most of which were lost by the end of the experiment in
contrast to caged plants. Stronger competition among aphids might
have caused more rapid evolution, in caged treatments, and hence a
stronger impact of evolution on population growth rate. A greenhouse
experiment using the same aphid clones supports these findings in
that aphid density can alter not only the clonal selection environment
but also the impact of rapid evolution on population dynamics (Chapter
5).
Saccheri & Hanski (2006) proposed that population density is less
likely to be influences by natural selection or evolution if that
population is under strong density regulation, which should overwhelm
for eco-evolutionary effects. The population dynamics in my system do
not behave as though they are tightly regulated yet my results still
suggest that density affects the selective environment leading to non-
intuitive outcomes.
Conducting studies in this emerging field in realistic ecological
conditions is crucial. The choice of genotypes are studied can also
alter the rate of evolution, which can change the impact strength of
rapid evolution on population dynamics. Together my results
emphasize that to properly assess the relative importance of evolution
on population dynamics requires experiments under natural

19
6
conditions. These should manipulate ecological variables in a realistic
manner, e.g. mimicking natural levels of variation in competition, and
also use genetic variation present within populations (i.e. not
artificially magnifying variation by using non-local genotypes).

19
7
The importance of genetic variation and rapid evolution on other
members of the community is currently receiving much attention
(Hughes et al. 2008, Johnson et al. 2009). I investigated whether this
is occurring in my system by assessing host plant fitness. Aphid rapid
evolution could impact its host’s fitness if one clone is more damaging
per capita, and thus an increase in its frequency would
correspondingly reduce plant fitness. More directly an increase in
aphid density through rapid evolution could also increase damage.
Although aphid evolution increased aphid population growth rate and
density, by up to 42%, this did not impact plant fitness or plant final
biomass (Hypothesis 3). One possibility is that non-aphid herbivore
damage determined plant fitness, overwhelming the aphid’s impact.
This suggestion is supported by the result that plants being consumed
by aphids, although having lower biomass, did not differ in fitness
from plants without aphids. Finally, micro-environmental variation
might have increased variation between replicates in plant fitness
(coefficients of variation among replicates: range of 0.1-1.9 with a
mean of 0.6). To properly quantify the interspecific effects of rapid
evolution in natural populations one must not experimentally exclude
such confounding ecological processes.
My experiment focused on the less-studied half of the eco-
evolutionary dynamics cycle. Rapid evolution impacts concurrent

19
8
population dynamics and its host fitness but is the reciprocal causal
process also occurring? I found that the competitive advantage of the
A and the B clones over C clone significantly increases at higher
density, in both caged and uncaged treatments. This

19
9
suggests the possibility of a full eco-evolutionary feedback cycle
where both rapid evolution and ecological dynamics influence each
other on similar timescales (Kokko and Lopez-Sepulcre 2007). As rapid
evolution leads to higher densities this alters natural selection thus
potentially modifying future bouts of evolution. Comparing my caged
and uncaged genetic results the strength of density regulation might
be more important than the absolute density in influencing the
selective environment. I limit my interpretation of these results since
my experimental design cannot disentangle the effect of density and
time. The C clone might simply have a fitness disadvantage on mature
plants, which is confound with density in this experiment.
In many applied fields such as fisheries, pest management,
conservation biology, invasion biology, and epidemiology, accurate
predictions of population dynamics are crucial. Rapid evolution in
many traits has been observed in these systems (Ashley et al. 2003).
My results suggest that considering rapid evolution as a force
impacting concurrent population dynamics might provide important
insight into many of these applied issues (Hufbauer and Roderick
2005, Duffy and Sivars-Becker 2007). For example in pest
management, models are used to establish guidelines for the
economic use of pesticides yet these almost always assume non-
evolving population growth parameters. My results argue that this

20
0
oversight might be problematic. Even in a small population, where
drift might be stronger, within only 31 days, predictions made without
considering rapid evolution could underestimate actual population
growth rate by up to 42% and

20
1
population size by 67%. This could significantly alter optimal control
strategies. My novel study suggests predictions of population
dynamics and rapid evolution will be more accurate if they explicitly
consider these processes and their interactions at all timescales.

Table 4.1: Analysis of Population Dynamics Comparing Evolving Aphids to Non-Evolving Controls for
Caged and Uncaged Treatments
Planned contrasts from linear mixed-effect models, comparing each type of evolving population to its
corresponding predicted non-evolving expectation for the caged treatments (days 0 to 27), for the early growth
phase (days 0 to 13) and the late phase (days 13 to 31) of the uncaged treatments. Evolution treatments are
identified by their clonal composition. Intercept represents density at the start of each time period, slope
represents aphid population growth rate, and predicted density represent expected density on the last day of
the time period based on the best fit model parameter estimates. The percent change represents the change
in intercept, slope, or final density, from the non-evolving expectation to that of the observed evolution
treatment. Positive values represent increase due to rapid evolution. All p-values are for 2-tailed tests.
Significant results were bolded for easier identification.
11
3

Table 4.1
Evolution
Treatment Caged (days 0 to 27 Uncaged (days 0 to 13) Uncaged (days 13 to 31)
(Clones) d.f. F p %
Change d.f. F p %
Change d.f. F p %
Change
Intercept 29 1.3 0.212 14.7% 30 -1.3 0.208 -13.2% 30 -1.9 0.071 -25.7%
A-B Slope 345 -0.8 0.443 -1.7% 166 -0.9 0.361 -4.9% 200 2.5 0.012 33.3%
Predicted 0.19% -29.0% 13.7%
Density
Intercept 29 -0.7 0.506 -7.9% 30 1.0 0.307 12.4% 30 0.6 0.568 9.1%
B-C Slope 345 1.7 0.088 4.2% 166 -0.7 0.487 -4.2% 200 2.4 0.016 35.2%
Predicted 12.6% -2.8% 67.0%
Density
Intercept 29 2.3 0.026 27.8%30 -1.3 0.188 -15.1% 30 -1.8 0.079 -29.0%
A-C Slope 345 -0.6 0.581 -1.3% 166 -0.1 0.905 -0.7% 200 2.8 0.006 41.7%
Predicted
Density 0.1% -21.5% 17.5%
11
4

Table 4.2: Analysis of Density-Dependent Clonal Selection
Summary of density-dependent clonal selection analysis. Results of planned contrasts comparing
how
strongly density reduces the growth rate of each clone in the evolution treatments. Slopes
represent daily growth rate as a function of initial density in each time period (see methods for
details). All slope values (means and SE) should be multiplied by 10-4. All p-values are for 2-tailed
tests.
Treatments
Slope of
Faster
Slope of % Difference
Slower in Slope d.f. t-value p-value
Clone (SE) Clone (SE)
A-B -0.35 (0.14) -0.27 (0.12) 30.1% 85 -0.8 0.4284
Caged B-C -0.22 (0.11) -0.59 (0.2) -62.7% 85 1.9 0.0653
A-C -0.29 (0.13) -0.66 (0.14) -56.6% 85 3.5 0.0008
A-B -4.2 (0.7) -3.2 (0.7) 32.7% 78 -1.5 0.1497
Uncaged B-C -2.8 (0.5) -7.2 (1.1) -61.3% 78 4.1 0.0001
A-C -2.7 (0.7) -7.8 (1.2) -65.0% 78 4.3 0.0001
11
5

116
Table 4.3: Correlation Between Final Plant Weight and Plant Fitness Traits
Summary of Pearson correlation analyses between final plant dry
above ground biomass and three fitness traits. All correlations were
positive. All p-values are for 2-tailed tests.
Number
Weight
Fitness Trait d.f. t-value p-value Pearson Correlation
Total Seed 49 5.19 0.0000 0.60
Mean Seed 40 1.77 0.0838 0.27
Flower-Days 49 3.62 0.0007 0.46

117
Figure 4.1: Population Dynamics of Pure Clone Populations for Caged and
Uncaged Treatments
Partial residual plots of population dynamics, over the time periods used in
the analyses, of pure clonal treatments in field experiment. Values represent
mean number of aphids (±1 SE) through time once all explained variation in
the model has been removed. Panel
(a) represents the caged treatments during days 0 to 27, (b) early growth
phase of the uncaged plants before cages were removed on day 13, and (c)
late growth phase of uncaged plants once cages were removed. Notice that
panels differ in y-axis scales. Functions represent the best fit exponential
model for each treatment (clone A is gray, clone B is the full black line, and
clone C is the dashed black line).
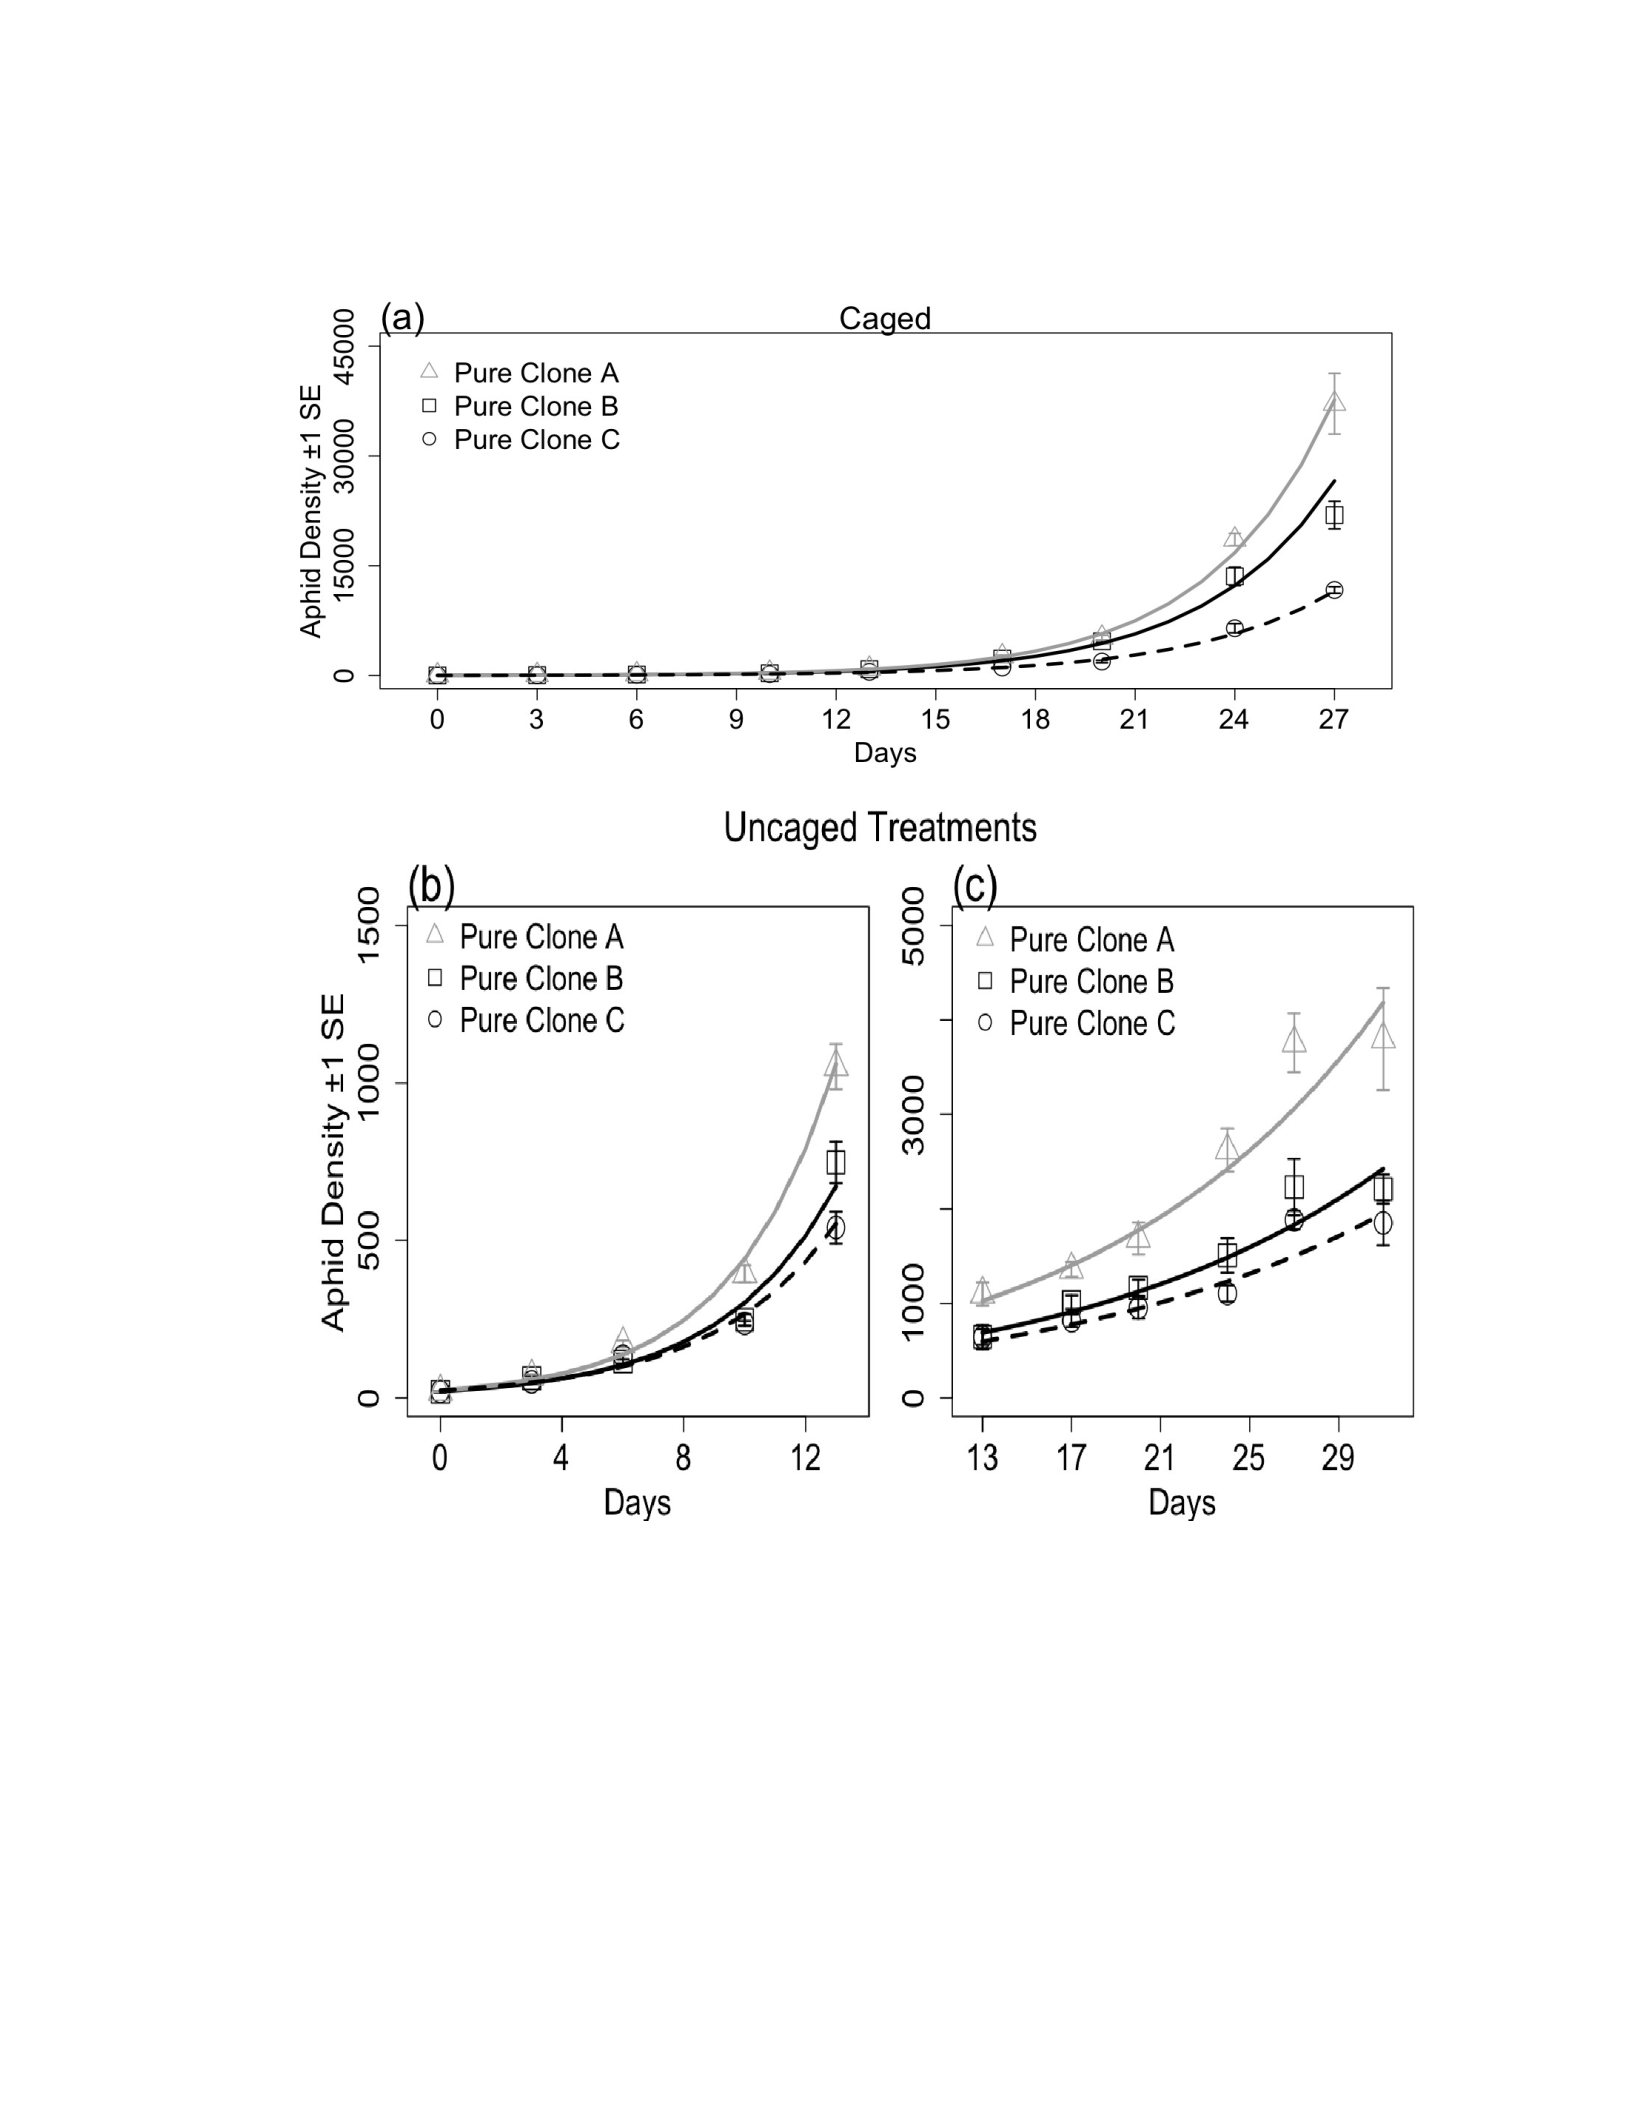
118
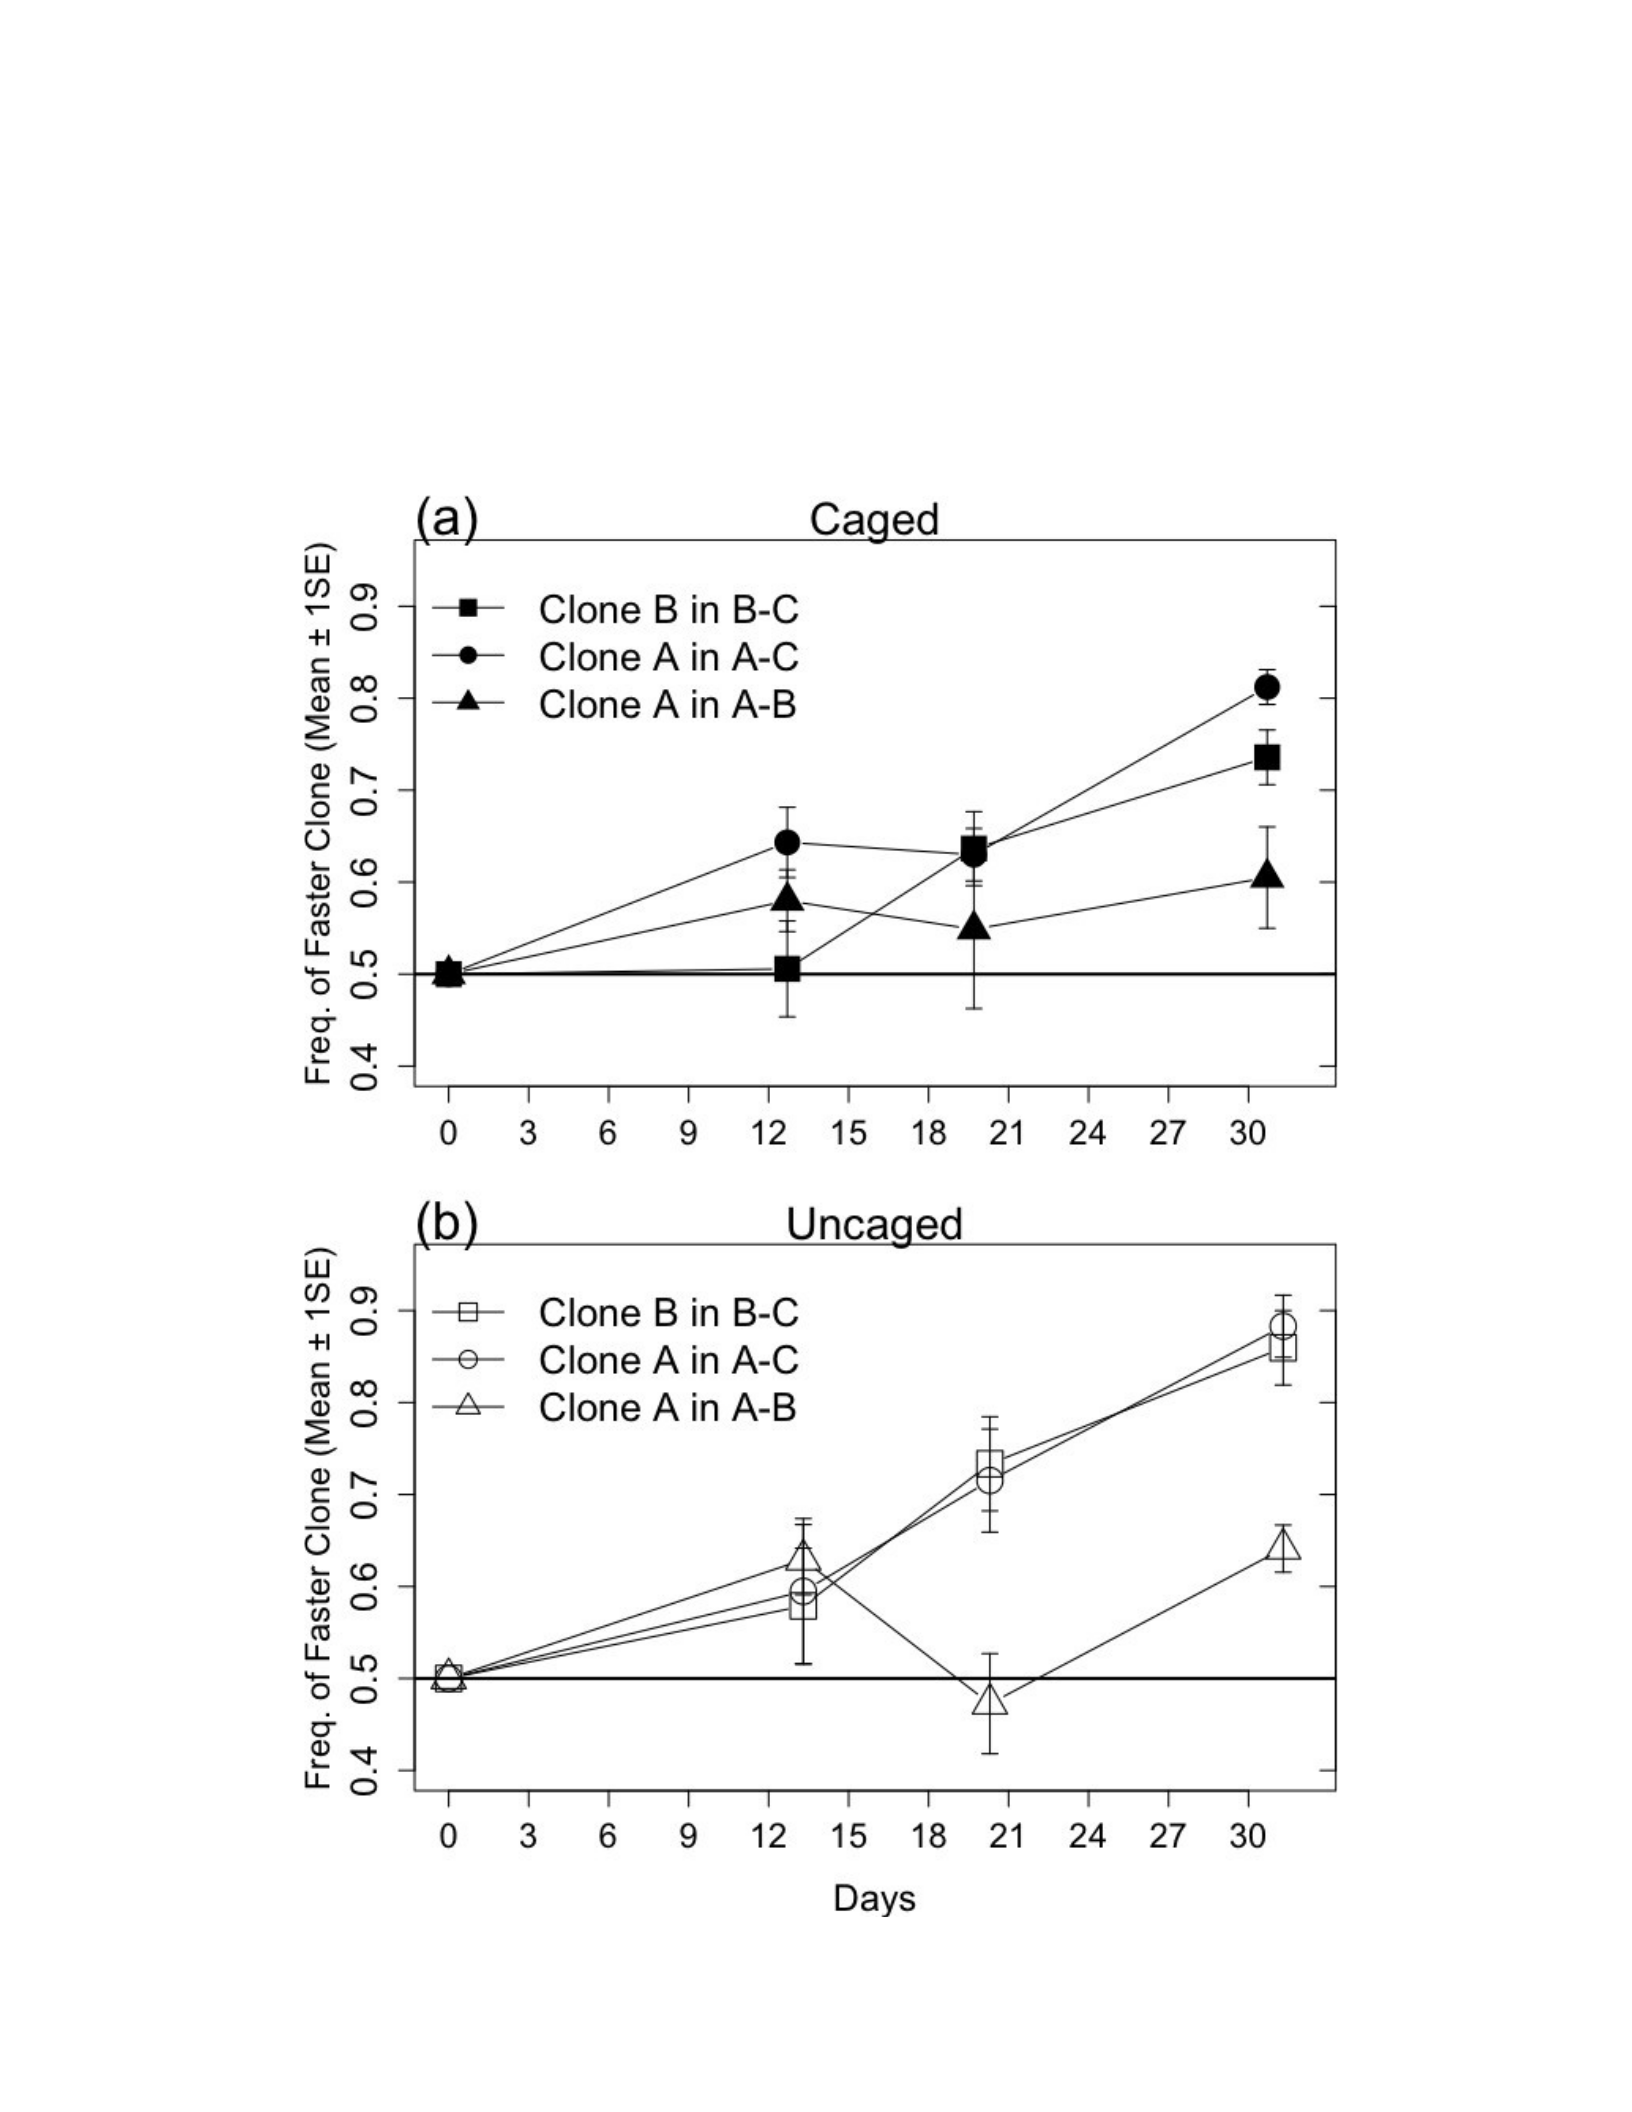
119
Figure 4.2: Temporal Changes in Clonal Frequency During the Experiment
Rapid clonal evolution as shown by the mean frequency of the faster growing
aphid clones in each evolution treatment (±1 SE). Panels separate caged (a)
and uncaged (b) treatments Horizontal bar indicates initial clonal frequencies
of 0.5.
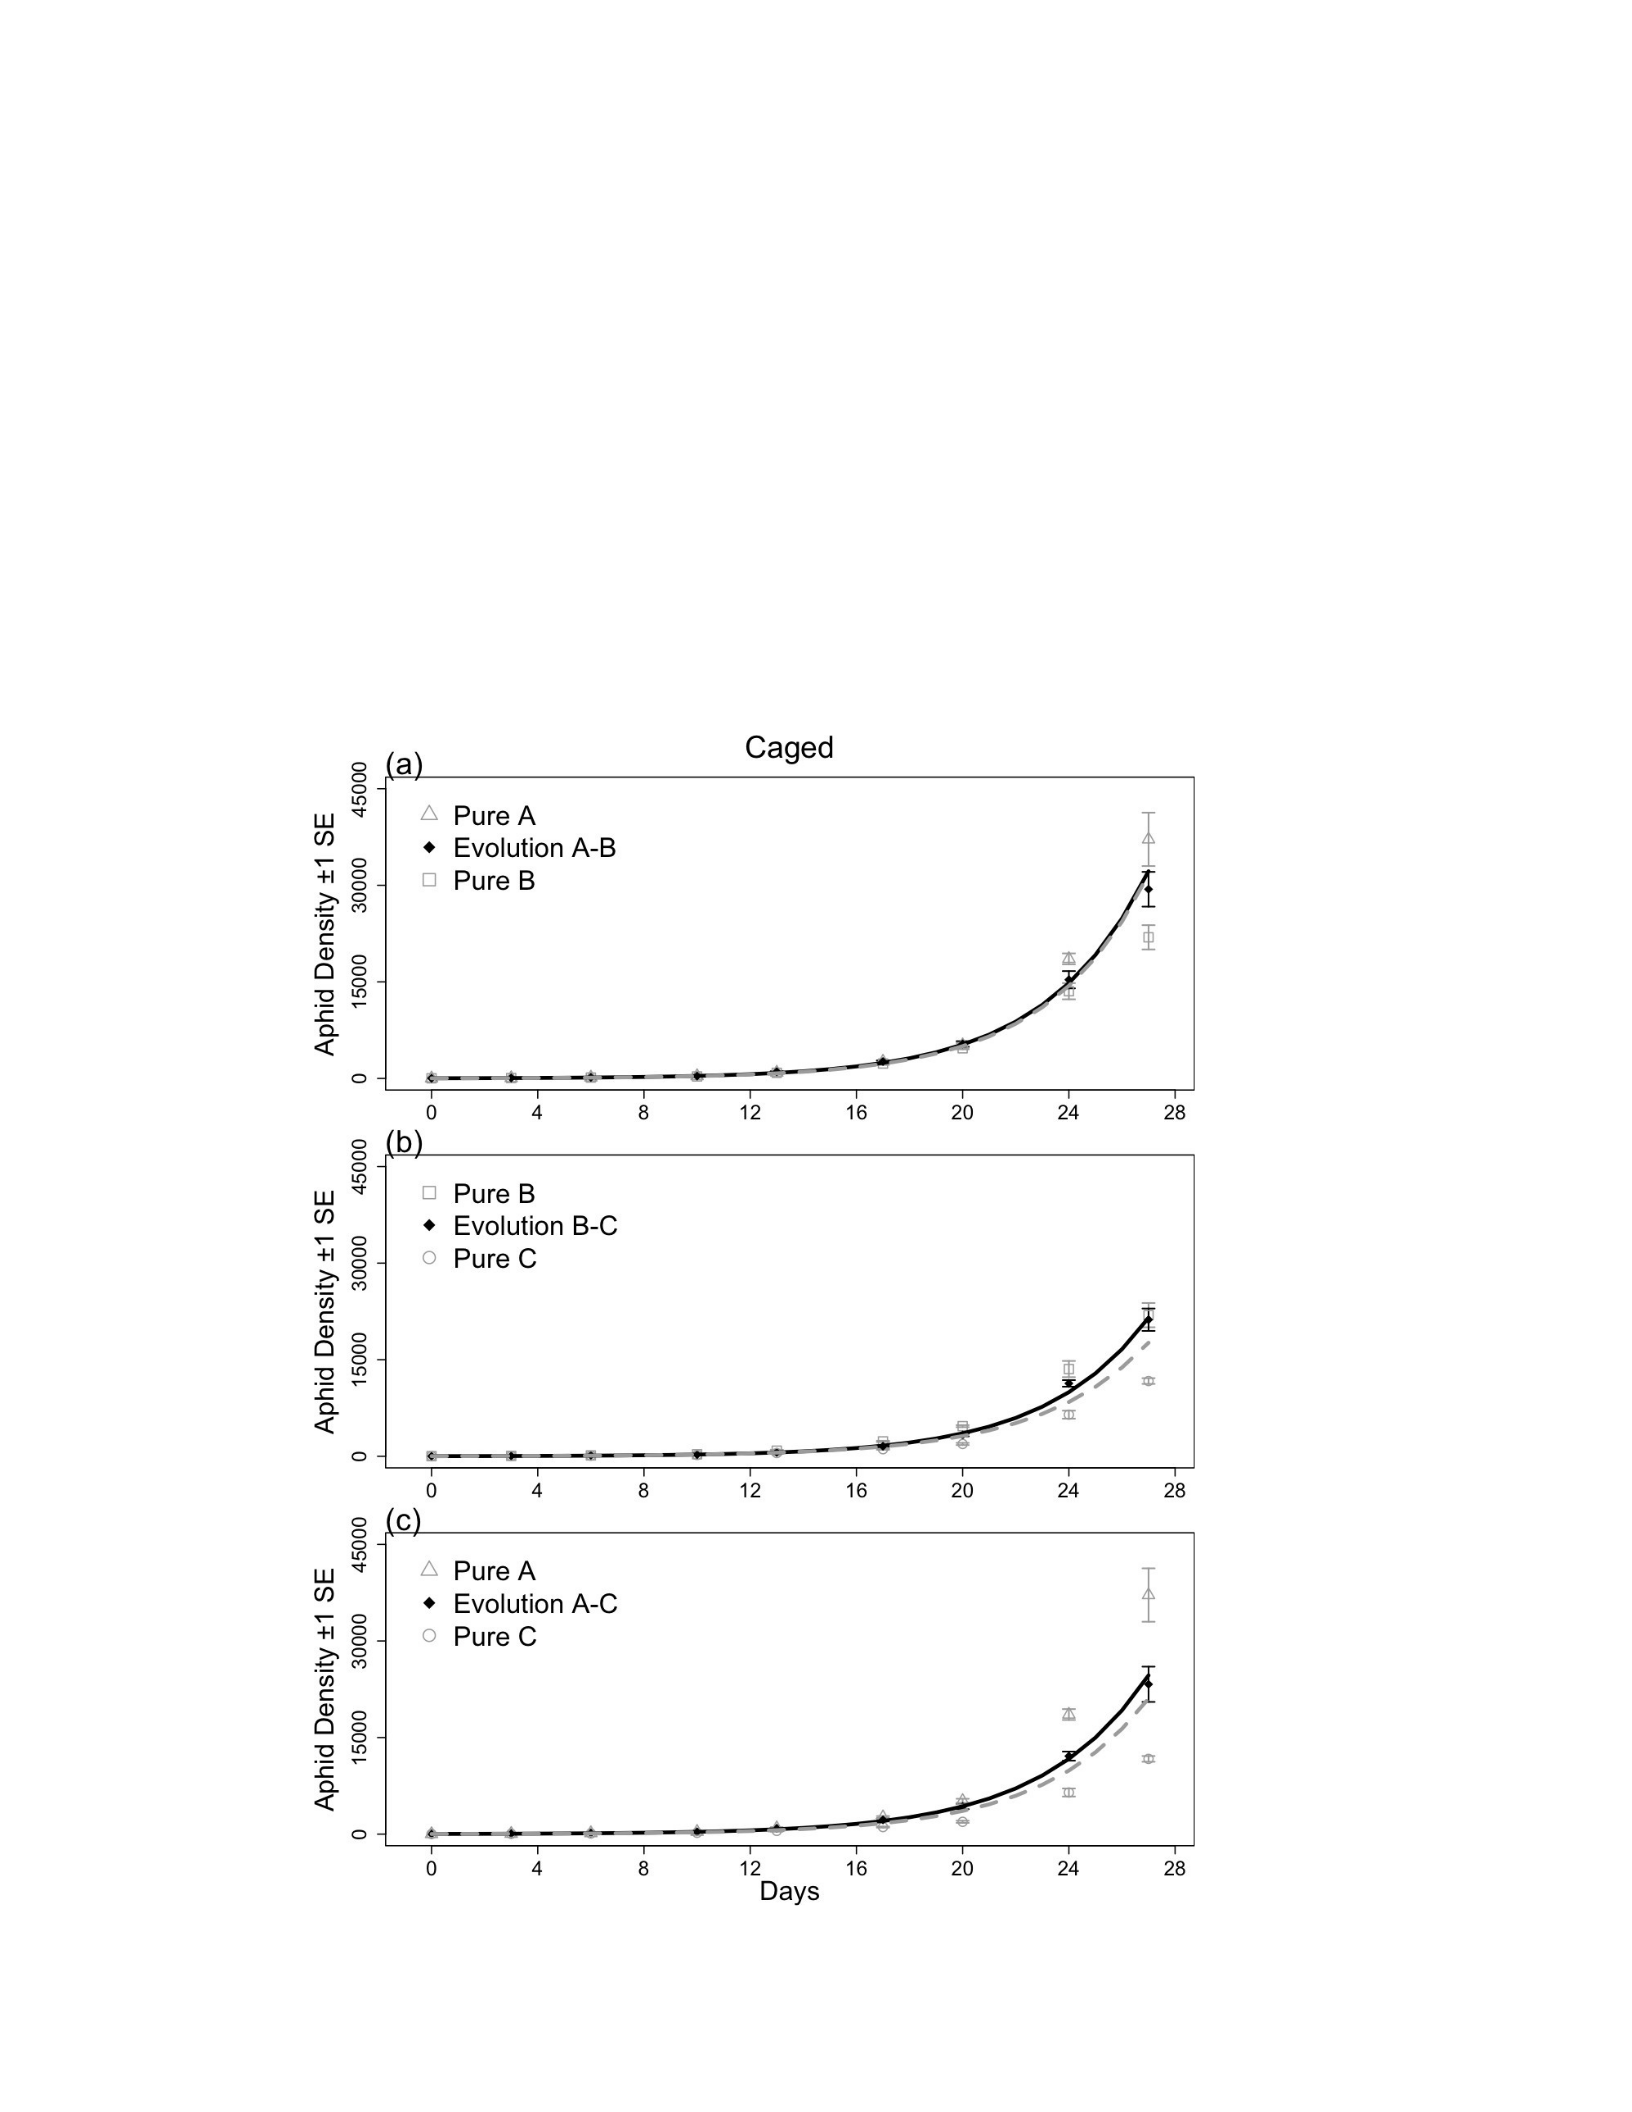
120
Figure 4.3: Population Dynamics Comparing Evolving Aphids to Non-
Evolving Controls in Caged Treatments
Partial residual plot of population dynamics of the three observed evolution
treatments (black diamonds) with the best fit model from LME analysis (black
line) for caged treatments. The dashed gray line represents the best fit model
that combines both pure treatments using the constant (non-evolving)
frequency of clones (50:50). For each treatment I added the corresponding
pure clone treatments (grey symbols) used to generate the no-evolution
expectation. Evolution treatments have two letters. Values represent mean
number of aphids (±1 SE) once all explained variation in the model has been
removed.

121
Figure 4.4: Population Dynamics Comparing Evolving Aphids to Non-
Evolving Controls in Caged Treatments
Partial residual plot of population dynamics of the three observed evolution
treatments (black diamonds) with the best fit model from LME analysis (black
line) for uncaged treatments (caged results can be seen in Appendix 3.1).
The dashed gray line represents the best fit model that combines both pure
treatments using the constant (non-evolving) frequency of clones (50:50). For
each treatment I added the corresponding pure clone treatments (grey
symbols) used to generate the no-evolution expectation. Evolution treatments
have two letters. Values represent mean number of aphids (±1 SE) once all
explained variation in the model has been removed. The y-axes differ
between panels. Left panels are for the early growth phase (days 0 to 13) and
right panels are for the late growth analysis (days 13 to 31).
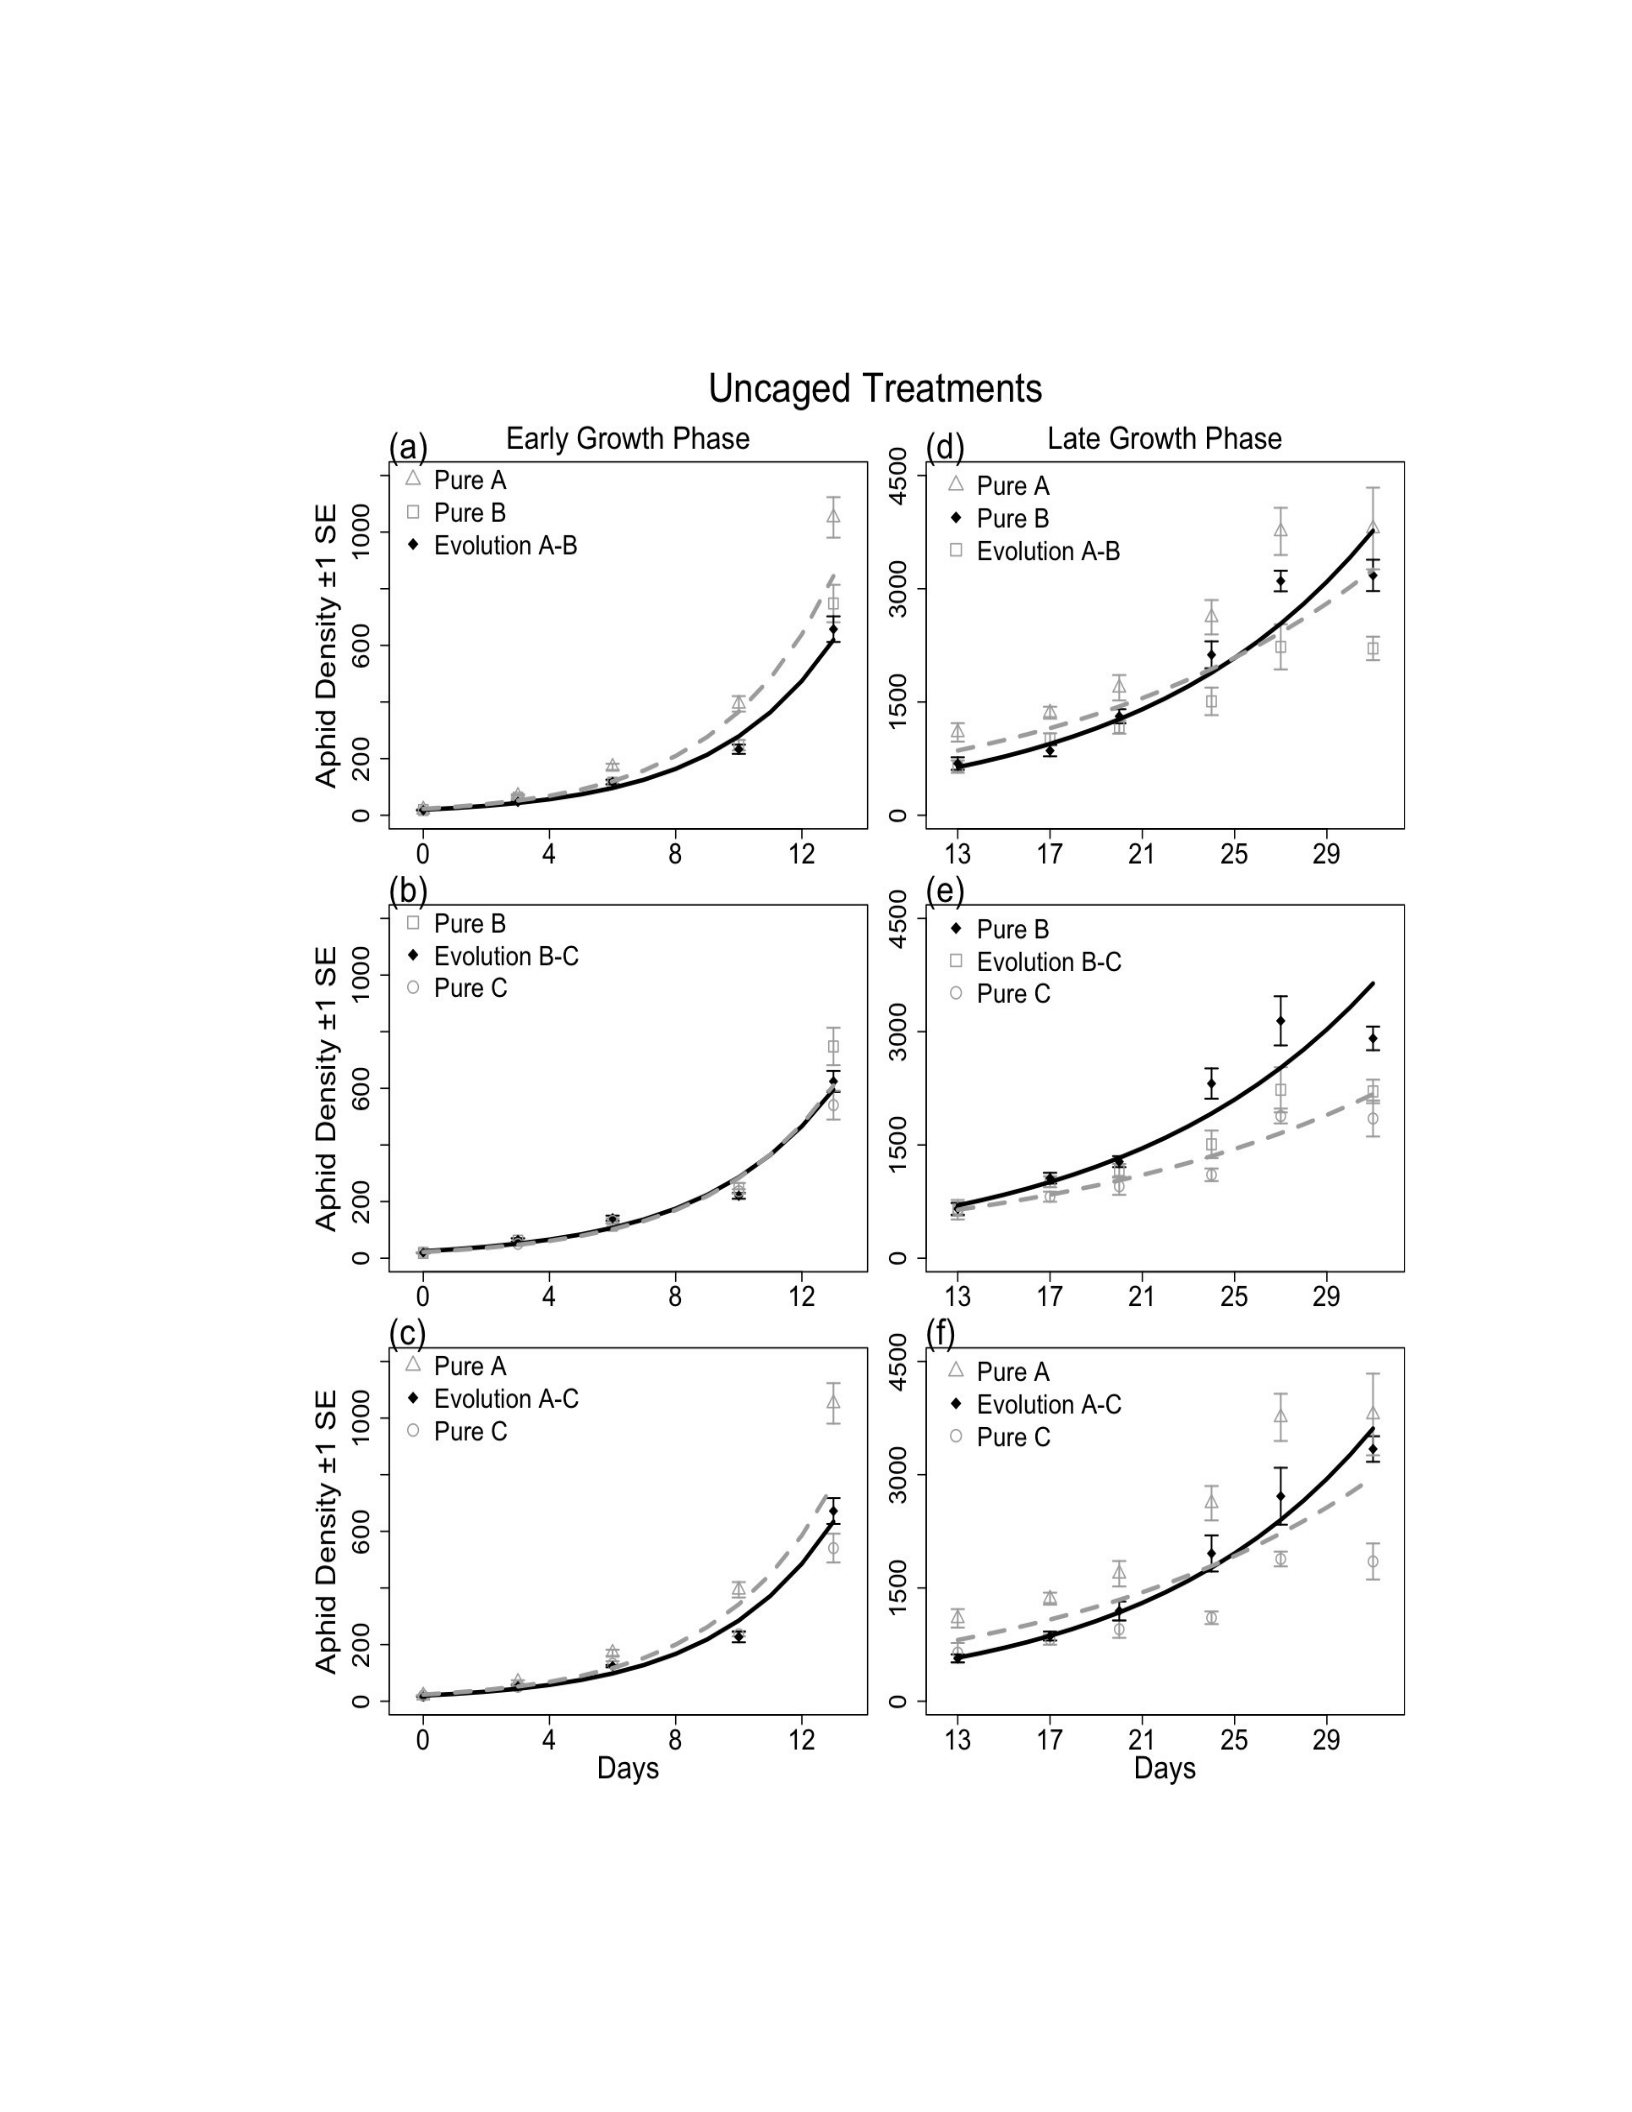
122
Figure 4.4

123
LITERATURE CITED
Agashe, D. 2009. The stabilizing effect of intraspecific genetic
variation on population dynamics in novel and ancestral habitats.
The American Naturalist 174:255-67.
Agrawal, A. A., N. Underwood, and J. R. Stinchcombe. 2004.
Intraspecific variation in the strength of density dependence in aphid
populations.
Ecological Entomology 29:521-26.
Anderson, W. W. and C. E. King. 1970. Age-specific selection.
Proceedings of the National Academy of Sciences 66:780-86.
Ashley, M. V., M. F. Willson, O. R. W. Pergams, D. J. O'Dowd, S. M.
Gende, et al. 2003. Evolutionarily enlightened management.
Biological Conservation 111:115-23.
Bassar, R. D., M. C. Marshall, A. López-Sepulcre, E. Zandona, S. K. Auer, et
al.
2010. Local adaptation in Trinidadian guppies alters ecosystem
processes. Proceedings of the National Academy of Sciences
107:3616-21.
Blackman, R. 1974. Life-cycle variation of Myzus persicae (Sulz.)(Hom.,
Aphididae) in different parts of the world, in relation to genotype and
environment. Bulletin of Entomological Research 63:595-607.
Bohannan, B. and R. Lenski. 1999. Effect of prey heterogeneity on the
response of a model food chain to resource enrichment. The
American Naturalist 153:73-82.
Bull, J. J., J. Millstein, J. Orcutt, and H. A. Wichman. 2006. Evolutionary
feedback mediated through population density, illustrated with viruses
in chemostats.

124
American Naturalist 167:E39-E51.

125
Day, T. 2005. Modelling the ecological context of evolutionary change:
Déjà vu or something new? P. 273-309 in K. Cuddington and B. E.
Beisner, editors.
Ecological Paradigms Lost Routes of Theory Change. Elsevier
Academic Press.
Duffy, M. A. and L. Sivars-Becker. 2007. Rapid evolution and ecological
host- parasite dynamics. Ecology Letters 10:44-53.
Endler, J. A. 1991. Genetic heterogeneity and ecology. P. 315–34 in R. J.
Berry,
T. J. Crawford, and G. M. Hewitt, editors. Genes in Ecology: The 33rd
Symposium of the British Ecological Society. Blackwell Scientific
Publications.
Ezard, T. H. G., S. D. Cote, and F. Pelletier. 2009. Eco-evolutionary
dynamics: disentangling phenotypic, environmental and population
fluctuations.
Philosophical Transactions of the Royal Society B: Biological
Sciences 364:1491-98.
Fussmann, G. F., S. P. Ellner, and N. G. J. Hairston. 2003. Evolution as a
critical component of plankton dynamics. Proceedings of the Royal
Society of London. Series B, Biological Sciences 270:1015-22.
Fussmann, G. F., M. Loreau, and P. A. Abrams. 2007. Eco-evolutionary
dynamics of communities and ecosystems. Functional Ecology
21:465-77.
Hairston, N. G. J., S. P. Ellner, M. A. Geber, T. Yoshida, and J. A. Fox.
2005. Rapid evolution and the convergence of ecological and
evolutionary time. Ecology Letters 8:1114-27.
Hanski, I. and I. Saccheri. 2006. Molecular-level variation affects
population growth in a butterfly metapopulation. PLoS Biology
4:e129.
Hendry, A. P. and M. T. Kinnison. 1999. Perspective: The pace of
modern life: Measuring rates of contemporary microevolution.

126
Evolution 53:1637-53.
Holt, R. D. 2005. On the integration of community ecology and
evolutionary biology: Historical perspectives and current prospects.
P. 235-72 in K.

127
Cuddington and B. Beisner, editors. Ecological Paradigms Lost
Routes of Theory Change. Elsevier.
Hufbauer, R. A. and G. K. Roderick. 2005. Microevolution in
biological control: Mechanisms, patterns, and processes.
Biological Control 35:227-39.
Hughes, A. R., B. D. Inouye, M. T. J. Johnson, N. Underwood, and M.
Vellend. 2008. Ecological consequences of genetic diversity.
Ecology Letters 11:609- 23.
Johnson, M. T. J., M. Vellend, and J. R. Stinchcombe. 2009. Evolution
in plant populations as a driver of ecological changes in arthropod
communities.
Philosophical Transactions of the Royal Society B: Biological
Sciences 364:1593-605.
Karley, A., W. Parker, J. Pitchford, and A. Douglas. 2004. The mid-
season crash in aphid populations: why and how does it occur?
Ecological Entomology 29:383-88.
Kokko, H. and A. Lopez-Sepulcre. 2007. The ecogenetic link between
demography and evolution: can we bridge the gap between theory
and data? Ecology Letters 10:773-82.
Levins, R. and R. Lewontin. 1980. Dialectics and reductionism in ecology.
Synthese 43:47-78.
Loeuille, N. and M. A. Leibold. 2008. Ecological consequences of
evolution in plant defenses in a metacommunity. Theoretical
Population Biology 74:34-45.
Loeuille, N., M. Loreau, and R. Ferriere. 2002. Consequences of plant-
herbivore coevolution on the dynamics and functioning of
ecosystems. Journal of Theoretical Biology 217:369-81.
Mackauer, M. and M. J. Way. 1976. Myzus persicae Sulz. an aphid of
world importance. P. 51-119 in V. L. Delucchi, editor. Studies in

128
biological control. Cambridge University Press.

129
Muller, F. P. 1983. Differential alarm pheromone responses between
strains of the aphid Acyrthosiphon pisum. . Entomologia
Experimentalis et Applicata 34:347–48.
Pelletier, F., D. Garant, and A. P. Hendry. 2009. Eco-evolutionary
dynamics.
Philosophical Transactions of the Royal Society B: Biological
Sciences 364:1483-89.
Pilson, D. 1992. Insect distribution patterns and the evolution of host
use. P. 120- 39 in R. S. Fritz and E. L. Simms, editors. Plant resistance
to herbivores and pathogens: ecology, evolution, and genetics
Unviersity of Chicago Press.
Pimentel, D. 1961. Animal population regulation by the genetic feed-
back mechanism. The American Naturalist 95:65-79.
Pimentel, D. 1968. Population regulation and genetic feedback.
Science 159:1432-37.
Pimentel, D. and R. Al-Hafidh. 1965. Ecological control of a parasite
population by genetic evolution in the parasite-host system. Annals
of the Entomological Society of America 58:1-6.
Pimentel, D., W. P. Nagel, and J. L. Madden. 1963. Space-time
structure of the environment and the survival of parasite-host
systems. The American Naturalist 97:141-67.
Pinheiro, J. and D. Bates. 2000. Mixed-Effects Models in S and
S-PLUS. Springer-Verlag.
Pinheiro, J. C., D. M. Bates, S. DebRoy, and D. Sarkar. 2009. nlme:
Linear and Nonlinear Mixed Effects Models.
Post, D. M., E. P. Palkovacs, E. G. Schielke, and S. I. Dodson. 2008.
Intraspecific variation in a predator affects community structure and
cascading trophic interactions. Ecology 89:2019-32.

130
R Development Core Team. 2009. R: A language and environment for
statistical computing. R Foundation for Statistical Computing,
Vienna, Austria.
Reznick, D. N. and H. A. Bryga. 1996. Life-history evolution in guppies
(Poecilia reticulata: Poeciliidae): V. Genetic basis of parallelism in life
histories.
American Naturalist 147:339-59.
Reznick, D. N. and C. K. Ghalambor. 2001. The population ecology of
contemporary adaptations: what empirical studies reveal about the
conditions that promote adaptive evolution. Genetica 112-113:183-
98.
Ro, T. and G. Long. 1999. GPA-Phenodynamics, a simulation model for
the population dynamics and phenology of green peach aphid in
potato: formulation, validation, and analysis. Ecological Modelling
119:197-209.
Saccheri, I. and I. Hanski. 2006. Natural selection and population
dynamics.
Trends in Ecology & Evolution 21:341-47.
Sloane, M. A., P. Sunnucks, A. C. C. Wilson, and D. F. Hales. 2001.
Microsatellite isolation, linkage group identification and
determination of recombination frequency in the peach-potato
aphid, Myzus persicae (Sulzer) (Hemiptera: Aphididae). Genetical
Research 77:251-60.
Slobodkin, L. B. 1980. Growth and Regulation of Animal Populations. 2nd
edition.
Dover Publications Inc.
Terhorst, C. P., T. E. Miller, and D. R. Levitan. 2010. Evolution of prey in
ecological time reduces the effect size of predators in experimental
microcosms. Ecology 91:629-36.
Thompson, J. N. 1998. Rapid evolution as an ecological process. Trends
in Ecology & Evolution 13:329-32.

131
Tuda, M. 1998. Evolutionary character changes and population
responses in an insect host-parasitoid experimental system.
Researches on Population Ecology 40:293-99.

132
Via, S. and A. J. Shaw. 1996. Short-term evolution in the size and shape
of pea aphids. Evolution 50:163-73.
Vorburger, C. 2005. Positive genetic correlations among major life-
history traits related to ecological success in the aphid Myzus
persicae. Evolution 59:1006- 15.
Vorburger, C. 2006. Temporal dynamics of genotypic diversity reveal
strong clonal selection in the aphid Myzus persicae. Journal of
Evolutionary Biology 19:97-107.
Wallner, W. 1987. FACTORS AFFECTING INSECT POPULATION-DYNAMICS:
Differences between outbreak and non-outbreak species. Annual
Review of Entomology 32:317-40.
Whitham, T. G., J. K. Bailey, J. A. Schweitzer, S. M. Shuster, R. K. Bangert,
et al.
2006. A framework for community and ecosystem genetics: from
genes to ecosystems. Nature Reviews Genetics 7:510-23.
Wilson, A. C. C., B. Massonnet, J. C. Simon, N. Prunier-Leterme, L.
Dolatti, et al. 2004. Cross-species amplification of microsatellite loci
in aphids: assessment and application. Molecular Ecology Notes
4:104-09.
Yoshida, T., L. E. Jones, S. P. Ellner, G. F. Fussmann, and N. G. J.
Hairston. 2003. Rapid evolution drives ecological dynamics in a
predator-prey system. Nature 424:303-06.

133
CHAPTER FIVE: AN EXPERIMENTAL ASSESSMENT OF THE
FULL ECO-EVOLUTIONARY DYNAMICS CYCLE BETWEEN
RAPID EVOLUTION AND POPULATION DENSITY AND THEIR
RELATIVE IMPACTS
ABSTRACT
This study builds on previous findings that aphid rapid evolution
impacts concurrent population dynamics by experimentally testing
whether such changes in density alter the course of evolution. This
represents the first explicit experimental test of the full eco-
evolutionary dynamic cycle (two-way causality between ecological and
rapid evolutionary dynamics) in a plant-herbivore system. Using
aphids and mustard, I manipulated aphid initial density and aphid
rapid evolution. I found strong evidence for density-dependent
selection. Initial aphid density altered the rate and outcome of
evolution, as measured by changes in clonal frequency. Density also
quantitatively and qualitatively altered how rapid evolution impacts
concurrent population growth rate. Aphid evolution, within only 16
days, significantly accelerated population growth rate (by up to
10.3%) compared to non-evolving controls in some combinations of

134
clones. Yet in one treatment combination, rapid evolution reduced
population growth by 6.4%. These effects were similar in magnitude to
the reduction in population

135
growth rate caused by a three-fold increase in initial density. These
results suggest that the full eco-evolutionary dynamic cycle is
occurring in this system and can have relatively strong effects on both
population dynamics and rapid evolution. I also identified one
treatment where aphid evolution significantly augmented the damage
caused to the host plant. These results have important implications for
the study of population dynamics and pest management.
INTRODUCTION
The reciprocal causal influences between evolution, genotypic
variation, and ecological dynamics termed ‘Eco-Evolutionary Dynamics’
(Fig. 1.1) is currently receiving much attention because such
dynamics can alter the predicted outcome of ecological interactions
(reviewed in Fussmann et al. 2007, Johnson and Stinchcombe 2007,
Pelletier et al. 2009, Schoener 2011). This renewed interested
emanates from recent empirical studies of eco-evolutionary dynamics
occurring on short-time scales, i.e. within a few dozen generations
(Fussmann et al. 2003, Yoshida et al. 2003, Hairston et al. 2005). Eco-
evolutionary dynamics, occurring on these timescales, have
traditionally been ignored because of a widely held assumption that
evolution is too slow to influence ecological dynamics (Hairston et al.
2005, Fussmann et al. 2007).

136
Thus much of the work in evolutionary-ecology and ecological genetics
focused on how ecological conditions (abiotic, competitive
environment) and ecological dynamics (density fluctuations) cause
selection and evolution (focused on arrow

137
1 in Fig. 1.1; Levins et al. 2003, Johnson and Stinchcombe 2007). The
reciprocal arrow of causality was rarely studied but important
exceptions do exist (Pimentel 1961, Chitty 1967, Pimentel 1968).
Many reviews listing examples of rapid evolution have recently
challenged the assumption that evolution is too slow to have an
impact on contemporary ecological interactions (Thompson 1998,
Hendry and Kinnison 1999, Bone and Farres 2001, Reznick and
Ghalambor 2001). Such examples of rapid evolution inspired a few but
growing number of empirical studies that quantify how rapid evolution
alters ecological dynamics (Bohannan and Lenski 2000, Fussmann et
al. 2003, Yoshida et al. 2003, Terhorst et al. 2010). For example, in my
previous studies using the green peach aphid, Myzus persicae, I
experimentally quantified that aphid rapid evolution significantly
accelerates population growth rate within a few weeks compared to
non-evolving control populations in the greenhouse (Chapter 3) and in
the field (Chapter 4). Yet, my previous experiments focused on one
arrow of causality in the eco-evolutionary dynamics cycle, which is
how rapid evolution might alter ecological dynamics (arrow 2 in Fig.
1.1). Eco- evolutionary dynamics can potentially be more complex in
this system if both processes are linked through cyclical causality (Fig.
1.1). Ecological changes induced by rapid evolution could alter future
bouts of evolution by changing the selection experienced by the target

138
organism. Full eco-evolutionary dynamics seem to be occurring in a
side-blotched lizards field system (Sinervo et al. 2000, Svensson and
Sinervo 2000) and in rotifer-algae chemostat experiments

139
(Yoshida et al. 2003). In both cases density cycles lead to, and are
caused by, cycles in phenotypic composition thus linking ecological
and evolutionary dynamics. In most studies in this emerging field
however, only parts of the cyclical pathway are investigated.
My previous studies have shown that rapid evolution can
increase population growth rate and density (arrow 2 in Fig. 1.1;
Chapters 3 & 4) but it remains unknown whether the full eco-
evolutionary dynamic cycle is occurring. The ecological change that I
observed in the first bout of eco-evolutionary dynamics (altered
population growth rate) could alter the affect of evolution on
population dynamics in the second bout in at least two ways. First,
changes in density might alter the selective environment directly
through density-dependent aphid clonal selection (thus modifying
arrow 1 in Fig. 1.1). Aphid clones are known to differ in how their
growth rates respond to increased population density (Agrawal et al.
2004). My field experiment (Chapter 4) found correlerative evidence
for density-depdendent clonal selection but more robust experiments
are required that do not confound host plant age with density. If the
higher population densities, caused by aphid evolution, feed back and
alters the selective environment then the aphids might not evolve at
the rate or even direction as predicted within a constant selective
environment. Second, increased density could also affect the strength

140
of population regulation, which might interfere with the ability of rapid
evolution to impact population growth rate

141
or density (altering arrow 2 in Fig. 1.1). Strong population regulation
could overwhelm any effect of rapid evolution (Saccheri and Hanski
2006).
Even if rapid evolution occurs within a system and has an
ecological impact, this does not guarantee a full eco-evolutionary
dynamic cycle. This could be the case if the ecological change does not
change the selective environment and does not feedback to influence
future evolution. Theoretical studies suggest that a break in the
feedback cycle could lead to very different ecological and evolutionary
outcomes (Anderson 1971, Abrams and Matsuda 1997, Shertzer et al.
2002, Day 2005). Thus the objective of this study is to explicitly assess
whether the full eco-evolutionary dynamic feedback cycle is occurring
in my study system. I will extend previous studies by testing 1) whether
aphid clonal selection is density-dependent by comparing the final aphid clonal
frequency in replicated populations initiated at different densities. I am thus
testing whether ecological context impacts the selective environment
(if arrow 2 impacts arrow 1 in Figure 1.1). Given these density
treatments I will also test 2) whether the impact of rapid evolution on
concurrent population dynamics depends on initial density (if arrow 1
influences arrow 2 in Fig. 1.1) by comparing whether treatments initiated at
different densities differ in how strongly evolution alters population growth rate.
Also by conducting these experiments with different aphid clones I will

142
test 3) whether the evolutionary context (genotypic composition of the
population) affects the results. Finally, simply showing that eco-
evolutionary dynamics occur fails in telling us how important this
process is. It is thus

143
imperative to compare its effect size with other commonly studied
ecological forces (Hairston et al. 2005, Johnson and Stinchcombe 2007,
Pelletier et al. 2009). Thus I will also 4) tests the relative impact of rapid
evolution on population growth rate compared to the effect of manipulating
density.
METHODS
I- Study System
The system used in this study is the green peach aphid, Myzus
persicae, and one of its many hosts the annual mustard, Hirschfeldia
incana. M. persicae is a globally distributed species best know for its
tremendous impact as an agricultural pest (Blackman 1974, Mackauer
and Way 1976). I developed this system to study eco-evolutionary
dynamics because the aphid naturally evolves rapidly, through
changes in clonal frequency, during its asexual growth phase in the
spring-summer months (Foster et al. 2002, Vorburger 2006). In 2008, I
collected multiple clonal lineages from a single wild population from
the Motte- Rimrock Reserve in Perris California. I identified clones using
6 microsatellite markers (Chapter 2; Sloane et al. 2001, Wilson et al.
2004) and characterized their intrinsic per capita growth rates
experimentally (Chapter 2). I selected three of these clones for this and
previous experiment (Chapters 2, 3, & 4) that differ in intrinsic growth

144
rate (detailed below).

145
II- Experimental Design
Evolving and non-evolving M. persicae populations on H. incana
plants were studied in a partly cooled greenhouse (mean daytime
temperature = 33°C, range = 21°C to 47°C, mean nighttime = 21.5°C,
range = 16°C to 28.5°C).
Asexual reproduction was maintained by using addition lighting
providing 16hrs light/ 8hrs dark (Blackman 1974). To minimize
variation in this primarily outcrossing plant, plants used in the
experiment were grown from the seeds of a single H. incana plant
collected in 2008 at the Motte-Rimrock Reserve. These seeds were
planted in four liter pots, using UCR soil mix III, a sand/peat moss mix
supplemented with micronutrients, and watered every three days.
Cages were constructed to individually house each plant. Cages
consisted of an 8 liter pot with a wire frame creating a 75cm high
dome that held up thin transparent mesh (Bridal Organza, #664-
7242, Jo-Ann). On day 0 of the experiment, the eight week old plants,
were inoculated with 6 different aphid treatments by placing a given
number of third instar aphids onto each plant. These aphids came
from stock greenhouse clonal populations, regularly tested for
contamination, that were maintained on H. incana (Chapter 2).
Replicates were initiated on three consecutive days starting July 25th
2010. On day 1 missing aphids were replaced with fourth instar

146
aphids.
I used three aphid clonal lineages, identified as ‘A’, ‘B’, and ‘C’,
that differ in microsatellite markers (Appendix 3.1). A preliminary
greenhouse experiment revealed that they also differ in exponential
growth rates when grown in pure

147
cultures (Chapter 2, daily per capita growth rate of clone A = 0.268 ±
0.002, B = 0.263 ± 0.004, and C = 0.251 ± 0.004). I used these three
clones to establish 12 aphid treatments in a factorial design that
manipulated density (low and high ~3x) and aphid evolution
(possibility of evolution or not). Three evolution treatments consisted
of aphid populations (on a single plant) that have two different clones
at an initial frequency of 50% : 50%. I established evolution treatments
that consisted of all three two-way combinations (A-B, B-C, and A-C).
These populations have genetic variation in fitness (e.g. A clone’s rm is
greater than that of the C clone) and thus could evolve by changing in
clonal frequency (away from the initial ratio). Three different non-
evolution (pure clone) treatments received aphids of only one of the
three clones. Because all individuals were of the same genotype within
these pure populations, gene frequencies could not change, thus
preventing evolution. I also manipulated initial density by initiating
these six treatments with either 20 or 60 third instar aphids on each
plant. I tripled the initial density because in my field collections I often
observed such a range of density on single plants (M. M. Turcotte
personal observation). Each treatment combination was assigned in a
randomized block design and replicated 7 times for a total of 84 plants.
III- Rates of Evolution

148
On day 22 I collected 50 aphids from every population in order to
track changes in clonal frequencies (evolution). Between 16 and 40
aphids from each

149
sample were genotyped (for a total of 892 aphids) at three
microsatellite loci using a multiplex approach (see Appendix 3.1 for
detailed genetic methods). I calculated the frequency of the faster
clone for each treatment and replicate separately. For each treatment
I then determined whether the mean frequency of the faster clone
differed significantly from the initial clonal frequency of 50% using
one-sample t-tests. I also tested whether the frequency of the faster
clone in each evolution treatment differed between initial density
using 2-sample t- tests.
IV- Aphid Population Dynamics
Aphid population dynamics were quantified by counting all
aphids on days 3, 6, 10, 13, 16, 22, 25, and 29. When populations rose
above 2000 aphids per plant I sub-sampled by counting one half of
every leaf. By fitting different population growth models I found that
the results were best described by fitting an exponential model from
days 0 to 16. On day 22 plants were starting to senesce, having
multiple yellow and/or drying leaves. When the logistic growth model
was extended to include day 22 many treatments had severely
overestimated population sizes on that day. On day 26, population size
declined as the populations crashed. Given the crash of aphid density
due to plant senescence, logistic growth models no longer yielded

150
accurate estimates of carrying capacity.

151
Differences in population growth rate between treatments were
tested using the following exponential growth model:
Nt = N0 * e(rm *day)
where Nt is the number of aphids on day t, N0 is the number of aphids
on day 0, and rm is the intrinsic growth rate. This model was analyzed
with a non-linear mixed-effect model (NLME). The fixed effect for N0
was initial density (low or high) and the fixed effects for rm were initial
density, aphid treatment, and their interaction. Because the repeated
aphid counts on the same plant violated the assumption of
independent observations, I set unique plant identity as a random
effect on population growth rate and intercept and used an
autoregressive correlation error structure (Pinheiro and Bates 2000). I
modeled increasing variance through time by using a variance
function that increases exponentially with the variance covariate
(varExp) but that differs between both density treatments. Block (day
of initiation of the replicate and spatial position in the greenhouse)
did not improve model fit and was not included in the final model.
Because plants differed slightly in size and stage of development on
day 0 these data were included as covariates for population growth
rate. Initial plant size was measured as the number of true leaves and
rosette width and combined into a principal component score. Only the
first principal component was used since it explained 70% of the

152
variation. Stage of development was quantified into an ordinal scales
(1= low bolt, 2 = bolt, 3= flowers). All analyses were implement in

153
R (v. 2.11.1 R Development Core Team 2009) using the nlme package
(Pinheiro et al. 2009).
V- The Impact of Evolution on Population Dynamics
My objective is not to predict which clone will out-compete the
other but to assess the impact of changes in clonal frequency on
concurrent population dynamics. Ideally one would compare the
observed aphid population dynamics in the evolution treatment to
those of a non-evolving mixed population containing the same two
clones (remains at a frequency of 50% : 50%). This is impossible since
clones will change in frequency because of fitness differences. This is
not possible in my field experiment. I thus generated the expected
population growth parameters of a non-evolving population (that
remains at constant clonal frequency) by using the pure aphid
treatments. I tested three a priori null hypotheses that the population
growth rate (slope) do not differ between each evolution treatment
and their corresponding pure treatments, e.g. A-C evolution treatment
vs pure A and pure C treatments. I did so with the use of planned
contrasts that are orthogonal comparisons between a subset of the
aphid treatment levels within the NLME analysis. I set the planned
contrast coefficients of the no-evolution expectation to match those of
the initial clonal frequency (e.g. pure A= -0.5 and pure C= -0.5 and

154
these are compared to the AC evolution treatment= 1). The contrast
matrix is found in Chapter 3. Thus differences in population growth
rate between the evolution treatment and the no-evolution

155
expectation represent the impact of changes in the frequency of clones
(rapid evolution) on population dynamics. To enhance interpretation of
the magnitude of differences in population growth rate I calculated
expected densities on day 16 from the model parameters and set
common covariate values (mean values).
VI - Host Plant Fitness
Finally, to quantify the impact of aphid rapid evolution on its
host’s fitness I measured the above ground dry biomass of the plants
at the end of the experiment as a proxy for host fitness (Chapter 4,
Mitchell-Olds and Bradley 1996). I fit a general linear model on LN(x)
transformed plant weight measurements. The factors were treatment
(combination of aphid treatment and density), initial plant size PCA
score, and stage of development. The interactions between these
factors were non-significant and thus removed from the final model. I
again used planned contrasts to determine whether plants with
evolving aphid populations were smaller than expected from no-
evolution treatments.
RESULTS
I - Pure Clone Treatments
Pure clone treatments differed in their intrinsic growth rate and

156
these differences changed in magnitude and rank with density (Fig.
5.1). At low initial density, differences between pure treatments were
smaller between clones.
Clone A grew fastest, its rm value was 2.4% higher than clone B and 5.3%
higher

157
than clone C (Fig. 5.1.a). Clone B grew faster than clone C by 2.9%. At
high density however there was a change in rank order (Fig. 5.1.b).
Clone A grew 21% faster than clone B and 14 % faster than clone C,
and clone B grew 5.7% slower than clone C. Expected density on day
16 based on the best fit growth estimates predict that pure
population could differ by as much as 27% in low density and 117% at
high density.
II - Genetic Analyses of Density-Dependent Selection
On day 22 I tested for changes in the deviation of the frequency
of clones in the evolution treatments from the clonal initial frequency
of 50% : 50%. All treatments rapidly evolved except for one within this
period and clear evidence for density-dependent clonal evolution was
observed (Fig. 5.2). The A-B evolution treatments significantly evolved
but only at high density (frequency of A clone = 57%, one sample t-
test, p = 0.02). In the B-C evolution treatments density altered the
direction of evolution; at low density the B clone became more
frequent reaching 69% (p=0.017) whereas at high density clone C
reached 70% (p=0.004). Finally in the A-C evolution treatments the A
clone became more common reaching 71% (p=0.002) and 65%
(p=0.044) in the low and high density treatments respectively (Fig.
5.2).

158
III - Impact of Initial Aphid Density and Evolution on Aphid Population Dynamics
Although high initial density treatments reached higher densities
on day 16 (see axis scale in Figs. 5.1 and 5.3) these treatments had
significantly reduced population growth rates. Overall the high density
treatments had 9.5% lower population growth rates (NLME, F= 25, p <
0.0001). To test the impact of rapid evolution on concurrent population
dynamics I compared the observed population dynamics in evolving
populations to those observed in both corresponding pure treatments
by using planned contrasts proportional to the initial frequency of
clones (i.e., population dynamics without evolution). Given that the
interaction between initial density and aphid treatment was significant
(NLME, F= 4.8, p = 0.0003) I conducted planned contrasts for each
density separately (see Table 5.1). Evolution in the A-B evolution
treatments did not significantly alter population dynamics at either
density (Fig. 5.3.a & b, Table 5.1, both p > 0.2). The impact of
evolution in the B-C treatments was highly influenced by initial
density. At low density, rapid evolution (i.e., an increase in the
frequency of clone B) slowed population growth by 6.4% (p=0.0004,
Fig.
5.3.c) whereas at high density rapid evolution (i.e., an increase in
clone C) accelerated population growth by 10.3% (p=0.003, Fig. 5.3.d,
Table 5.1). Expected density on day 16 based on the best fit growth

159
estimates predict that rapid evolution causes differences in population
size of –25% and +48% respectively. Finally, in the A-C evolution
treatments initial density magnified the effect of rapid evolution. At
low density rapid evolution marginally accelerated

160
population growth rate by 1.1% (p=0.022, Fig. 5.2.e) yet at high
density evolution accelerated population growth by 9.4% (p= 0.0001,
Fig. 5.2.f, Table 5.1). These differences in population growth rate due
to evolution are predicted to cause differences on day 16 of +4.3% and
+43% in population size respectively.
IV - Impact of Aphid Evolution on Host Plant Fitness
My analysis of final plant weight did not reveal an overall effect
of initial aphid density (p=0.25). Of the six comparisons between
evolving populations and their corresponding no-evolution treatments
only one revealed a significant difference. The evolution treatment
with the largest effect on population growth, high density B-C,
significantly reduced its host’s biomass by 27% (GLM, p= 0.030).
DISCUSSION:
I experimentally assessed eco-evolutionary dynamics by
manipulating both density and rapid evolution in a plant-herbivore
system. I found that aphid populations rapidly evolved through
changes in clonal frequencies but the magnitude and direction of
evolution depended on initial density. Aphid evolution significantly
altered population growth rate but the direction and magnitude
depended upon initial density and genotypic composition. These

161
results suggest that the full eco-evolutionary dynamics cycles are
occurring in this system (Fig. 1.1) and can have relatively strong
effects on both population dynamics and rapid

162
evolution. Rapid aphid evolution changed population growth rate and
density influenced the course of evolution. I also identified one
treatment where aphid rapid evolution significantly augmented the
damage cause to the host plant.
These results have important implications for the study of population
dynamics and pest management because they suggest that neither
short-term ecological or evolutionary dynamics should be studied
separately.
My prior experiments in this system experimentally tested the
less studied half of eco-evolutionary dynamics. I showed that over a
period of 28 days rapid evolution significantly accelerated population
growth rate in the greenhouse by 28% to 34% (Chapter 3). In my field
experiment (Chapter 4), even in the presence of environmental
variation, immigration, the presence of competitors, herbivores,
predators, and parasitoids, rapid evolution still significantly
accelerated population growth rate by 33% to 42% within 31 days.
These experiments have thus revealed that evolution can affect
concurrent ecological dynamics (arrow 2 in Fig. 1.1). The experiment
presented here builds on the previous ones experimentally quantifying
the full eco-evolutionary cycle by assessing changes in population
density, which is the product of population growth and rapid evolution,
can in turn feed back on and influence the outcome of interclonal

163
competition.
My experiment revealed clear evidence of density-dependent
selection. Initial density had multifarious effects on the pattern of
evolution depending on genotypic composition (Fig. 5.2).
Differences in density altered whether rapid

164
evolution occurred or not (A-B evolution treatments), it affected the
direction/outcome of evolution (B-C evolution treatments, Fig. 5.2). My
goal is not to predict the outcome of clonal selection but to document
that changes in density alter the outcome. However, it remains true
that differences in population growth rate in single clone cultures most
often predicted the direction of evolution correctly (e.g. the change in
outcome of B-C treatments) but not always the rate of evolution (e.g.
when A and B were grown together at high density, A reached only
57% frequency even though the pure A clone grows 21% faster than
pure B clone). Overall my experiment revealed density-dependent
clonal evolution, which suggests that as density changes due to rapid
evolution, the selective environment is also changing in a way that
alters the evolutionary outcome, thus linking rapid evolution and
population dynamics in a cyclical causal pathway.
Multiple traits might explain why one clone out-competes
another. Aphid clones vary in many traits including life-history traits,
competitive ability, predator and pathogen resistance, adult weight,
body size, morphology, feeding rate, probing behavior, plant choice,
alate production, tendency to drop from plants, response to alarm
pheromones, photoperiod response, ability to transmit viruses, and
temperature tolerance (Muller 1983, Pilson 1992, Via and Shaw 1996,
Rochat et al. 1999, Hazell et al. 2005, Vorburger 2005, Hazell and

165
Fellowes 2009), although some of these differences might be
attributable to secondary endosymbionts (Oliver et al. 2010). I
conducted a life-table experiment on the aphids clones used in this
experiment and found that clones A, B, and C differ in

166
lifetime fecundity and survival rates (M.M. Turcotte, unpublished data).
Changes in aphid density could interact with a number of these
differences between clones thus leading to density-dependent
selection. Aphid clonal variation in the strength of density-regulation as
also been observed (Agrawal et al. 2004).
To further test the eco-evolutionary dynamics cycle, I also tested
whether density would alter how rapid evolution affects population
dynamics (how arrow 1 affects arrow 2 in Fig. 1.1). Initial density
quantitatively and qualitatively altered how rapid evolution impacts
population growth rate (Fig. 5.3, Table 5.1). In the A- C evolution
treatments an increase in initial density led to a much stronger effect
of evolution on population dynamics compared to non-evolving
controls (+1.1% versus +9.4%). This magnification of the impact of
evolution might be explained by the fact that the fitness differences
between clones A and C are exaggerated at higher densities (Fig. 5.1).
Thus an increase in frequency of clone A would more strongly
accelerate population dynamics in the high density treatment than in
the low density treatment. Overall, increased initial density led to
stronger effects of rapid evolution on population dynamics (Table 5.1).
This is consisted with my field experiment where higher levels of
competition also led to stronger impacts (Chapter 4). The mechanism
seems to be stronger clonal selection at higher densities. I still posit

167
that this magnification of the effect of rapid evolution on population
growth rate might be diminished if density regulation is strong enough
to maintain the populations near a carrying capacity (Saccheri and

168
Hanski 2006). These conditions do not seem to apply to my aphid
system where the population grows rapidly and crashes.
Initial density also qualitatively changed the affect of evolution
in the B-C treatments. At high density the C clone becomes more
frequent and since clone C’s growth rate is higher than clone B it
accelerates the evolution treatment’s population growth rate by 10.3%
above the non-evolving control (Table 5.1, Fig. 5.3.d). At low density
the B clone becomes more dominant, reaching a frequency of 69%, but
this evolutionary change slows down population growth rate by 6.4%,
even though the B clone grows more quickly than the C clone at low
initial density. I posit that the B clone interferes with its own growth
and that of the C clone when it reaches a high frequency and density.
Interference could occur through resource competition or competition
for feeding site. Alternatively, if clones vary in their propensity to
produce or respond to alarm pheromones emitted at high density
(Muller 1983) this might alter the clones feeding and reproduction.
Thus the evolving population’s growth slows as it becomes dominated
by the B clone. A similar hypothesis was proposed in Chapter 3, where
I documented evidence that clone B has reduced growth at high
density and frequency. Such intraspecific variation in the strength of
density dependence has been document in other aphid species
(Agrawal et al. 2004) as well as in this experiment (Fig. 5.1). Overall

169
my results demonstrate the dual causal interplay between rapid
evolution and concurrent ecological dynamics.

170
Study systems where the full eco-evolutionary dynamics have
been shown are very rare (Svensson and Sinervo 2000, Yoshida et al.
2003). In some systems only a tentative hypothesis is suggested. For
example in Palkovacs and Post’s (2008) aquatic system, populations of
alewifes (Alosa pseudoharengus) have become landlocked by dams and
have evolved within 300 years. The ancestral anadromous type is only
present in certain freshwater lakes in the spring and summer months.
Because of year round foraging, the landlocked fish have altered the
zooplankton community by favoring smaller species and smaller
individuals within species. It is suggested that these ecological
changes have fed back and caused the evolution of more efficient
foraging morphology (smaller gill raker spacing and gape width) and
higher prey selectivity in the landlocked alewifes compared to
anadromous forms (Palkovacs and Post 2008). Thus eco- evolutionary
dynamic cycles are inferred as a plausible explanation for existing
patterns. Given that we are just looking at patterns without a clear
establishment of cause and effect relationships, we must accept that
alternative explanations may account for them. Thus clear advantage
of my study system is that because of rapid evolution occurring within
a few weeks I can dissect the eco-evolutionary dynamics as they occur
and establish causality.
My experiment revealed that evolution altered population growth

171
by 1.1% to 10.3%, which is smaller than the effect sizes I found in
previous experiments (Chapters 3 & 4). I posit that is because I used
more mature plants in the current study. This led to an earlier
termination of the experiment as the plants

172
senesced, which in turn reduced the number of days (and hence
generations) of usable data in the experiment from 28 and 30 days in
Chapters 3 & 4 to 16 days in the current study. This reduced time
period limits the extent of evolution and the time evolution can take to
impact population dynamics. In the previous experiments I found that
evolution had no significant effects in the early time periods. Moreover
the reduced time implies smaller population sizes, which could
minimize the potential impact of an acceleration of population growth
rate. Yet, my current results are surprising in that they show a
significant effect of evolution on population growth rate over only 3-4
generations. Most other studies of the ecological effects of rapid
evolution study time periods representing many dozen generations
(Tuda and Iwasa 1998, Fussmann et al. 2003, Yoshida et al. 2003,
Terhorst et al. 2010).
Recent reviews of eco-evolutionary dynamics stress that it is of
vital importance to test the relative impact of rapid evolution
compared to other ecological forces on population dynamics compared
to more commonly studied ecological processes (Hairston et al. 2005,
Johnson and Stinchcombe 2007, Pelletier et al. 2009). My experimental
design lends itself well to address this issue. I found that a three-fold
increase in initial density reduced population growth rate by 9.5%.
Rapid evolution in two different evolution treatments had similar effect

173
sizes (Table 5.1) suggesting that rapid evolution and eco- evolutionary
dynamics can be important forces in population dynamics on short-
timescales.

174
Unlike any other experimental study system to my knowledge, I
have shown eco-evolutionary dynamics within a single species. This
suggests that short-term eco-evolutionary dynamics could be very
common, even occurring in systems that do not show strong
population dynamic coupling with other species (as opposed to
predator-prey systems). I also observed that aphid rapid evolution, in
the treatment with largest impact on aphid population dynamics, had
an interspecific impact on its host. The evolving aphid population
reduced plant biomass by 27% compared to non-evolving controls.
This suggests that eco- evolutionary dynamics could extend beyond
the aphids in this system. More experiments will be required to
explore this issue.
My results have important implication for the study of both
population dynamics and evolutionary dynamics. It suggests that
even on very short timescales of a few generations rapid evolution
can occur and can significantly alter population dynamics in complex
ways. Moreover the rate and direction of such rapid evolution can be
influenced by changes in population dynamics thus completing the
eco-evolutionary dynamics cycle. These results suggest that in
certain systems ecological and evolutionary predictions would be
improved if eco-evolutionary dynamics were explicitly considered.
Improving predicted population growth rates should enhance our

175
ability to manage agricultural pests and exploited populations such
as in fisheries.

176
Table 5.1: Analysis of Population Dynamics Comparing Evolving and Non-
Evolving Populations in Low and High Density Treatments
The effect of rapid evolution on population growth rate compared to non-
evolving controls. Results of planned contrasts from a non-linear mixed-effect
model, comparing growth rates of each type of evolving population to its
corresponding no-evolution expectation, generated from the pure aphid
treatments following the initial frequency of clones (see Methods for details).
The percent change represents the change in slope from the non-evolving
expectation to that of the observed evolution treatment. Thus positive
changes represent increases due to evolution. Slope represents the rate of
growth of aphid populations. All p-values are for 2-tailed tests. Significant
results were bolded for easier identification.
Evolutio
n
Treatme
nt
Low Density High Density
(Clones) d.f. F p % Change d.f. F p % Change
A-B 397 0.3 0.577 +1.0% 397 1.6 0.205 +3.6%
B-C 397 12.8 0.0004 -6.4% 397 9.1 0.0028 +10.3%
A-C 397 5.3 0.022 +1.1% 397 15.2 0.0001 +9.4%
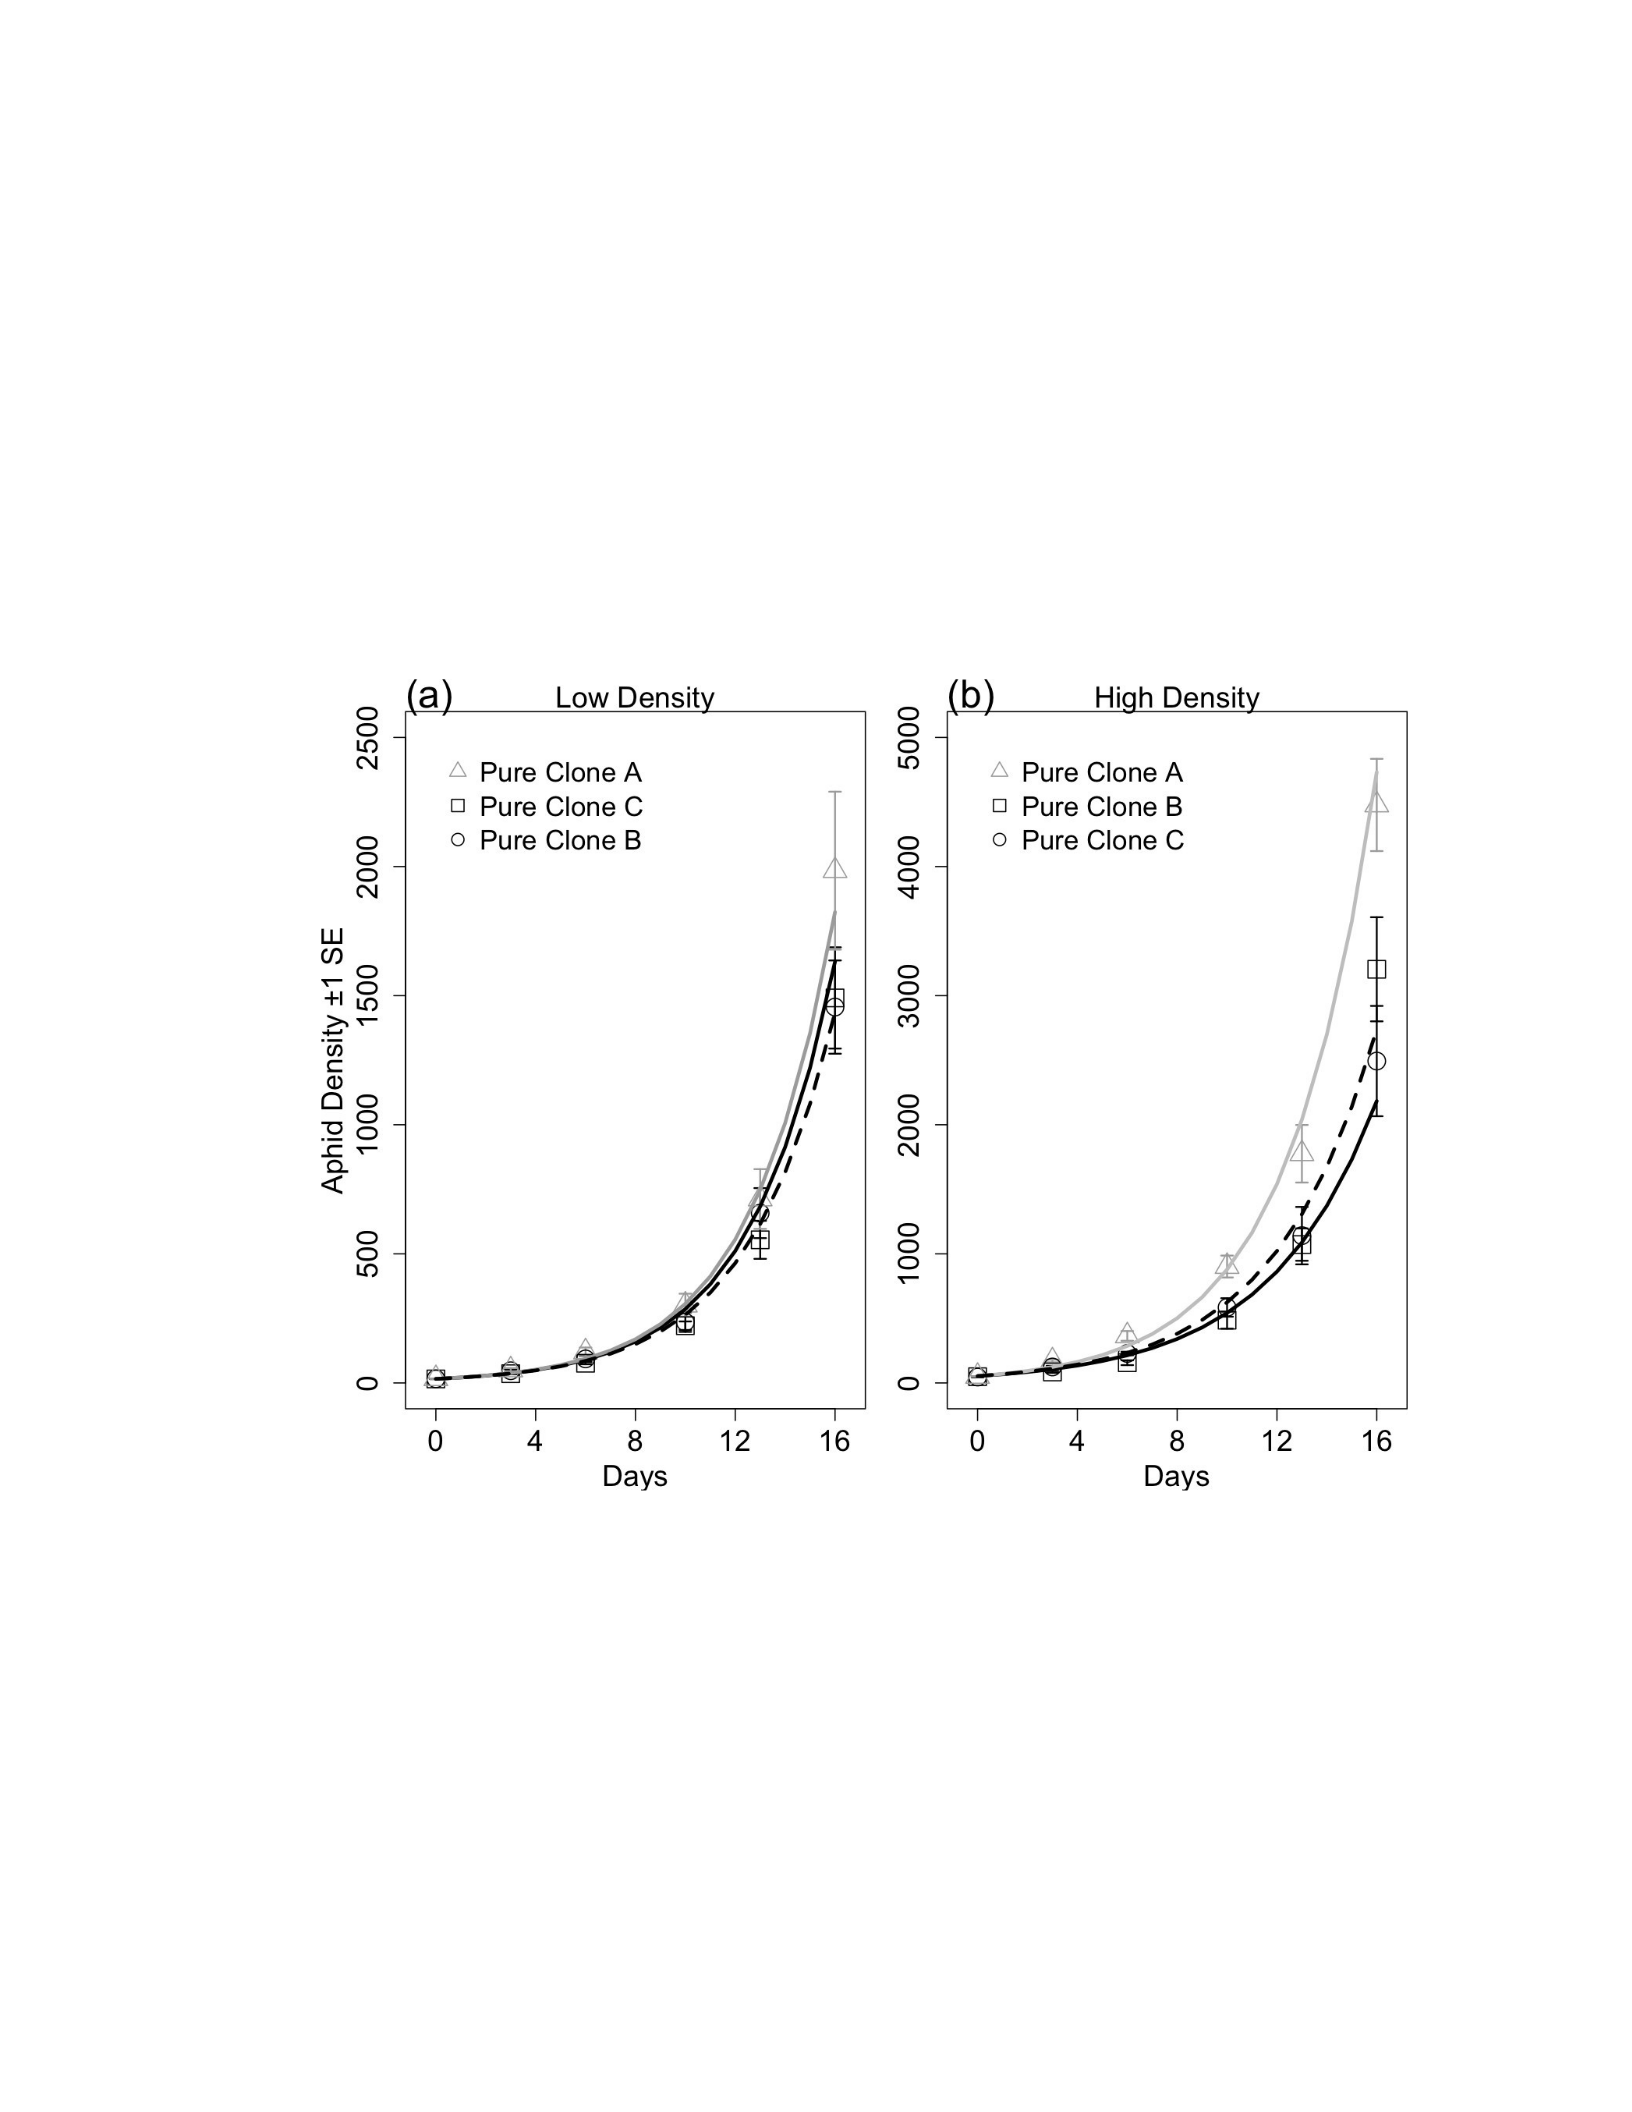
177
Figure 5.1: Population Dynamics of Pure Clone Treatments at High and Low
Densities
Partial residual plots of population dynamics of pure clonal treatments.
Values represent mean number of aphids (±1 SE) through time, once all
explained variation in the model has been removed, separated by a) low
initial density treatments and b) high initial density treatment. Functions
represent the best fit exponential model for each treatment (clone A is gray,
clone B is the full black line, and clone C is the dashed black line). The y-axes
differ between panels.
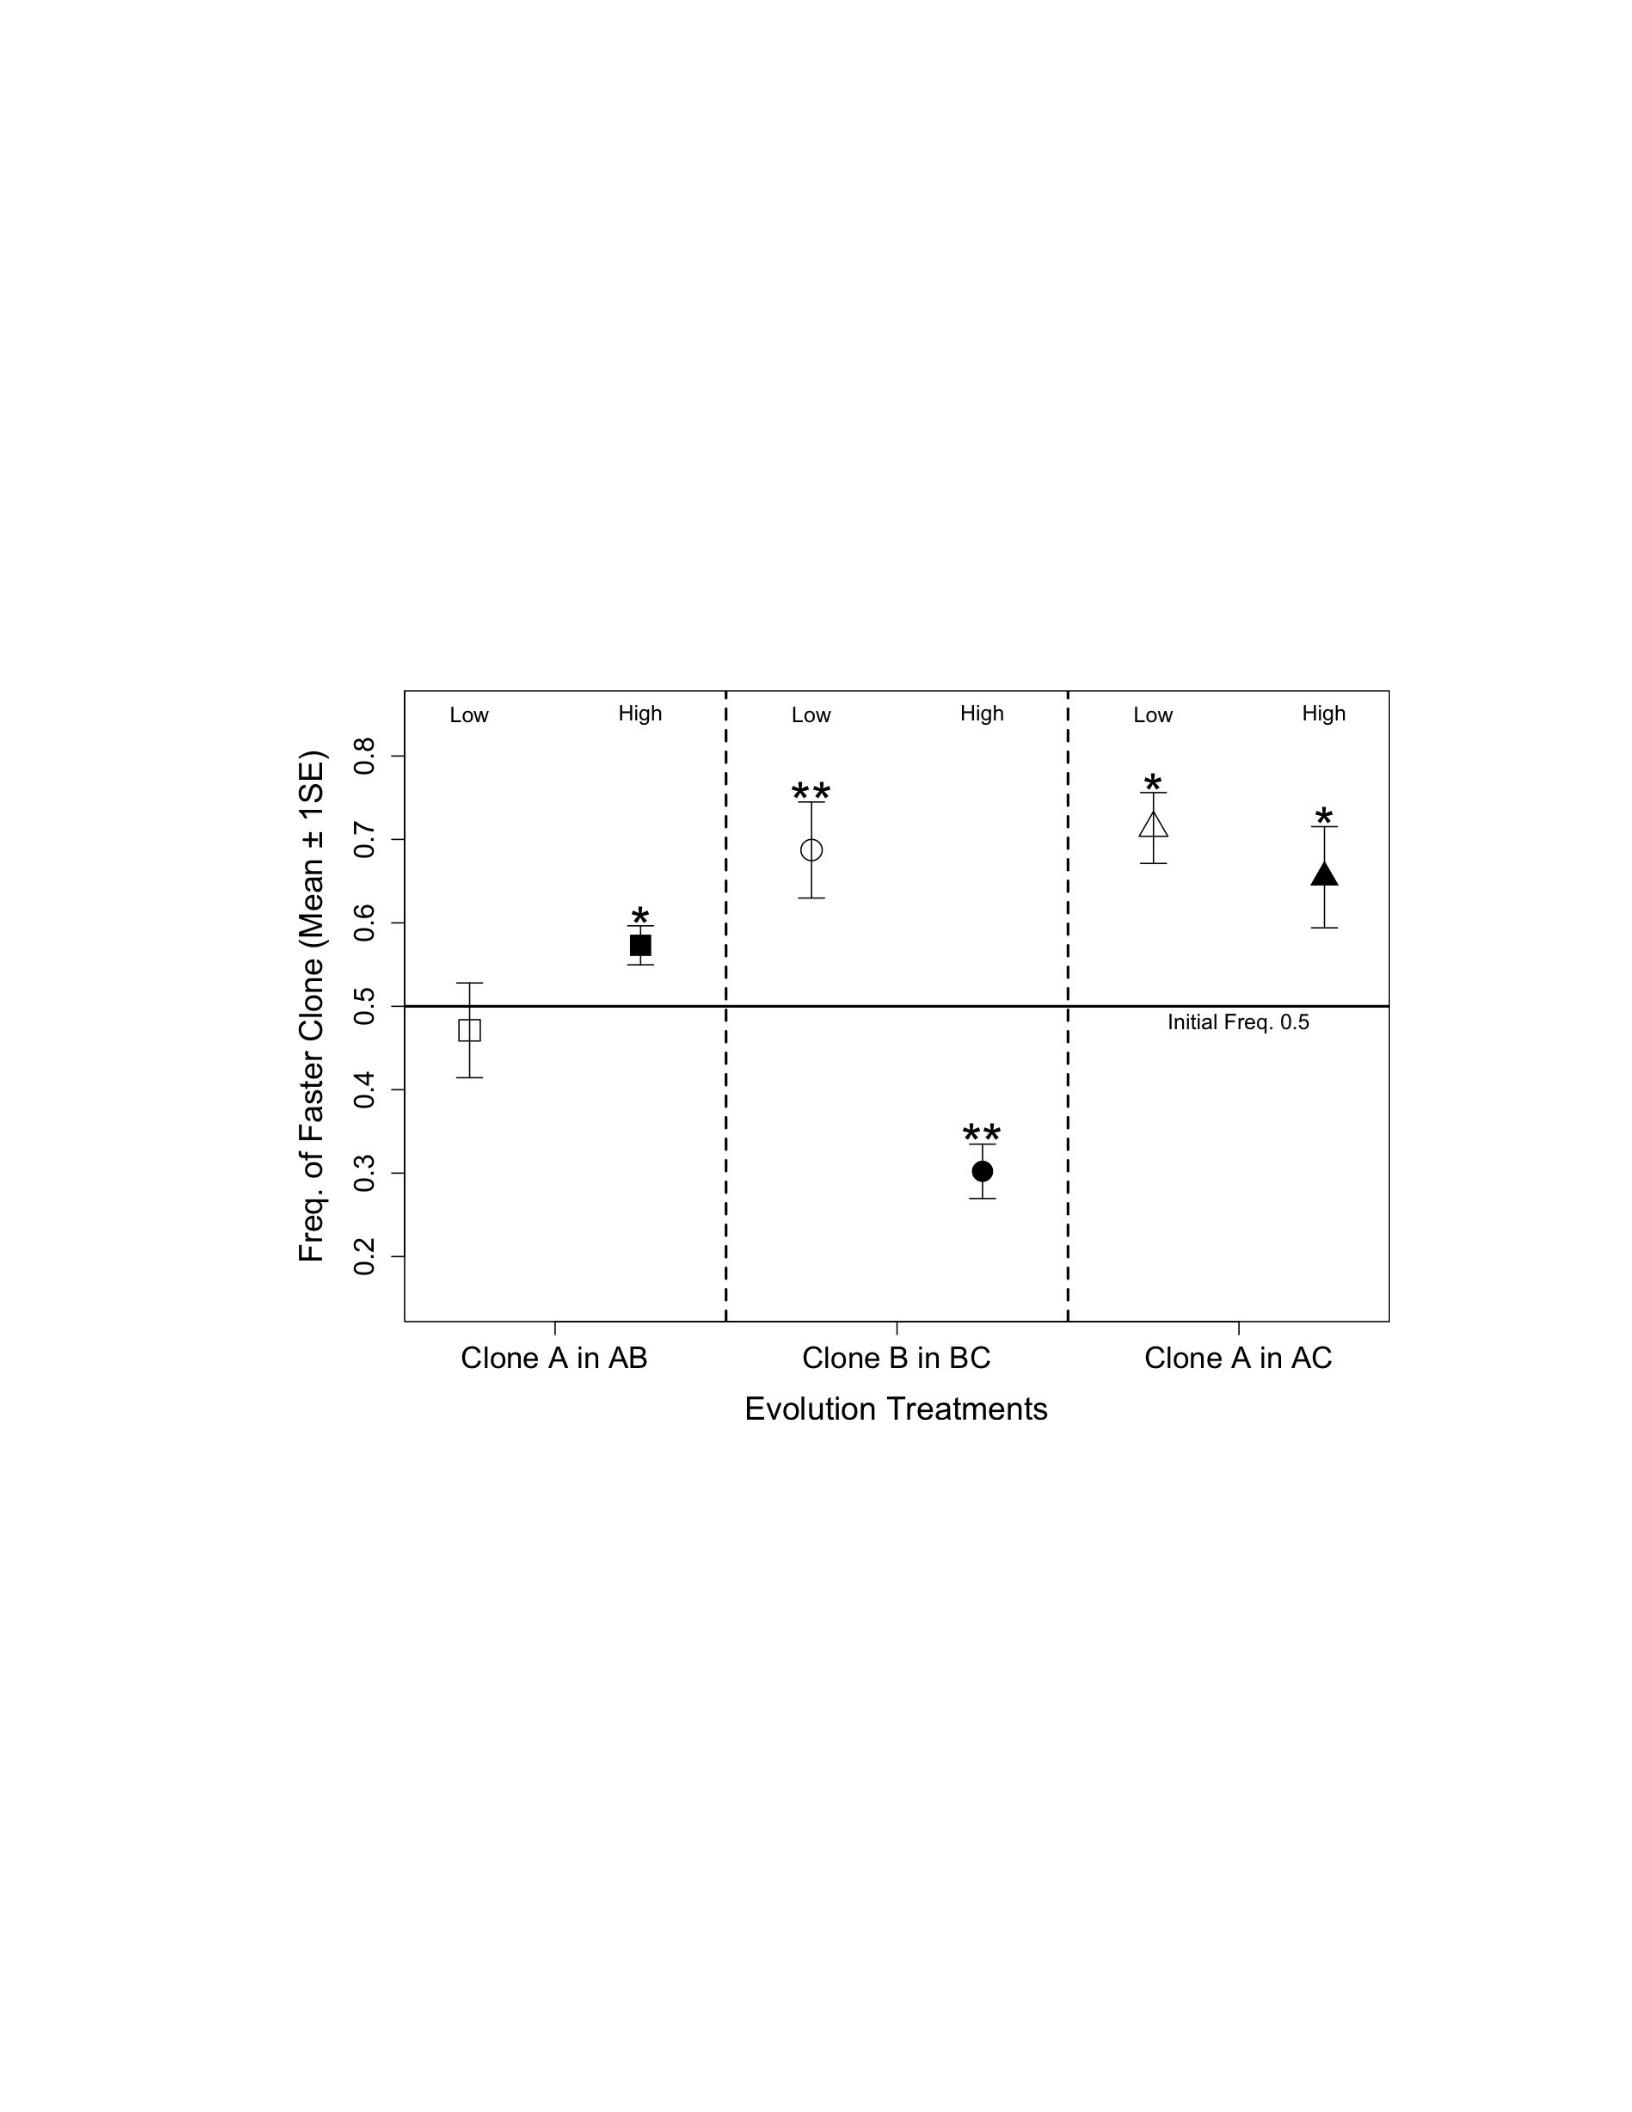
178
Figure 5.2: Rapid Evolution Through Changes in Clonal Frequency at Different
Initial Aphid Densities
Rapid clonal evolution as shown by the mean frequency (±1 SE) of the faster
growing aphid clones on day 22 of the experiment. The horizontal bar
indicates the initial clonal frequency of 50% on day 0. The X-axis shows which
clone’s frequency is being tested in each evolution treatment. Dashed vertical
lines separate the evolution treatments for which both initial density
treatments are shown. The (*) indicate significant divergence from initial
frequency and (**) indicates that clone frequency significantly differs between
low and high initial density within an evolution treatment.
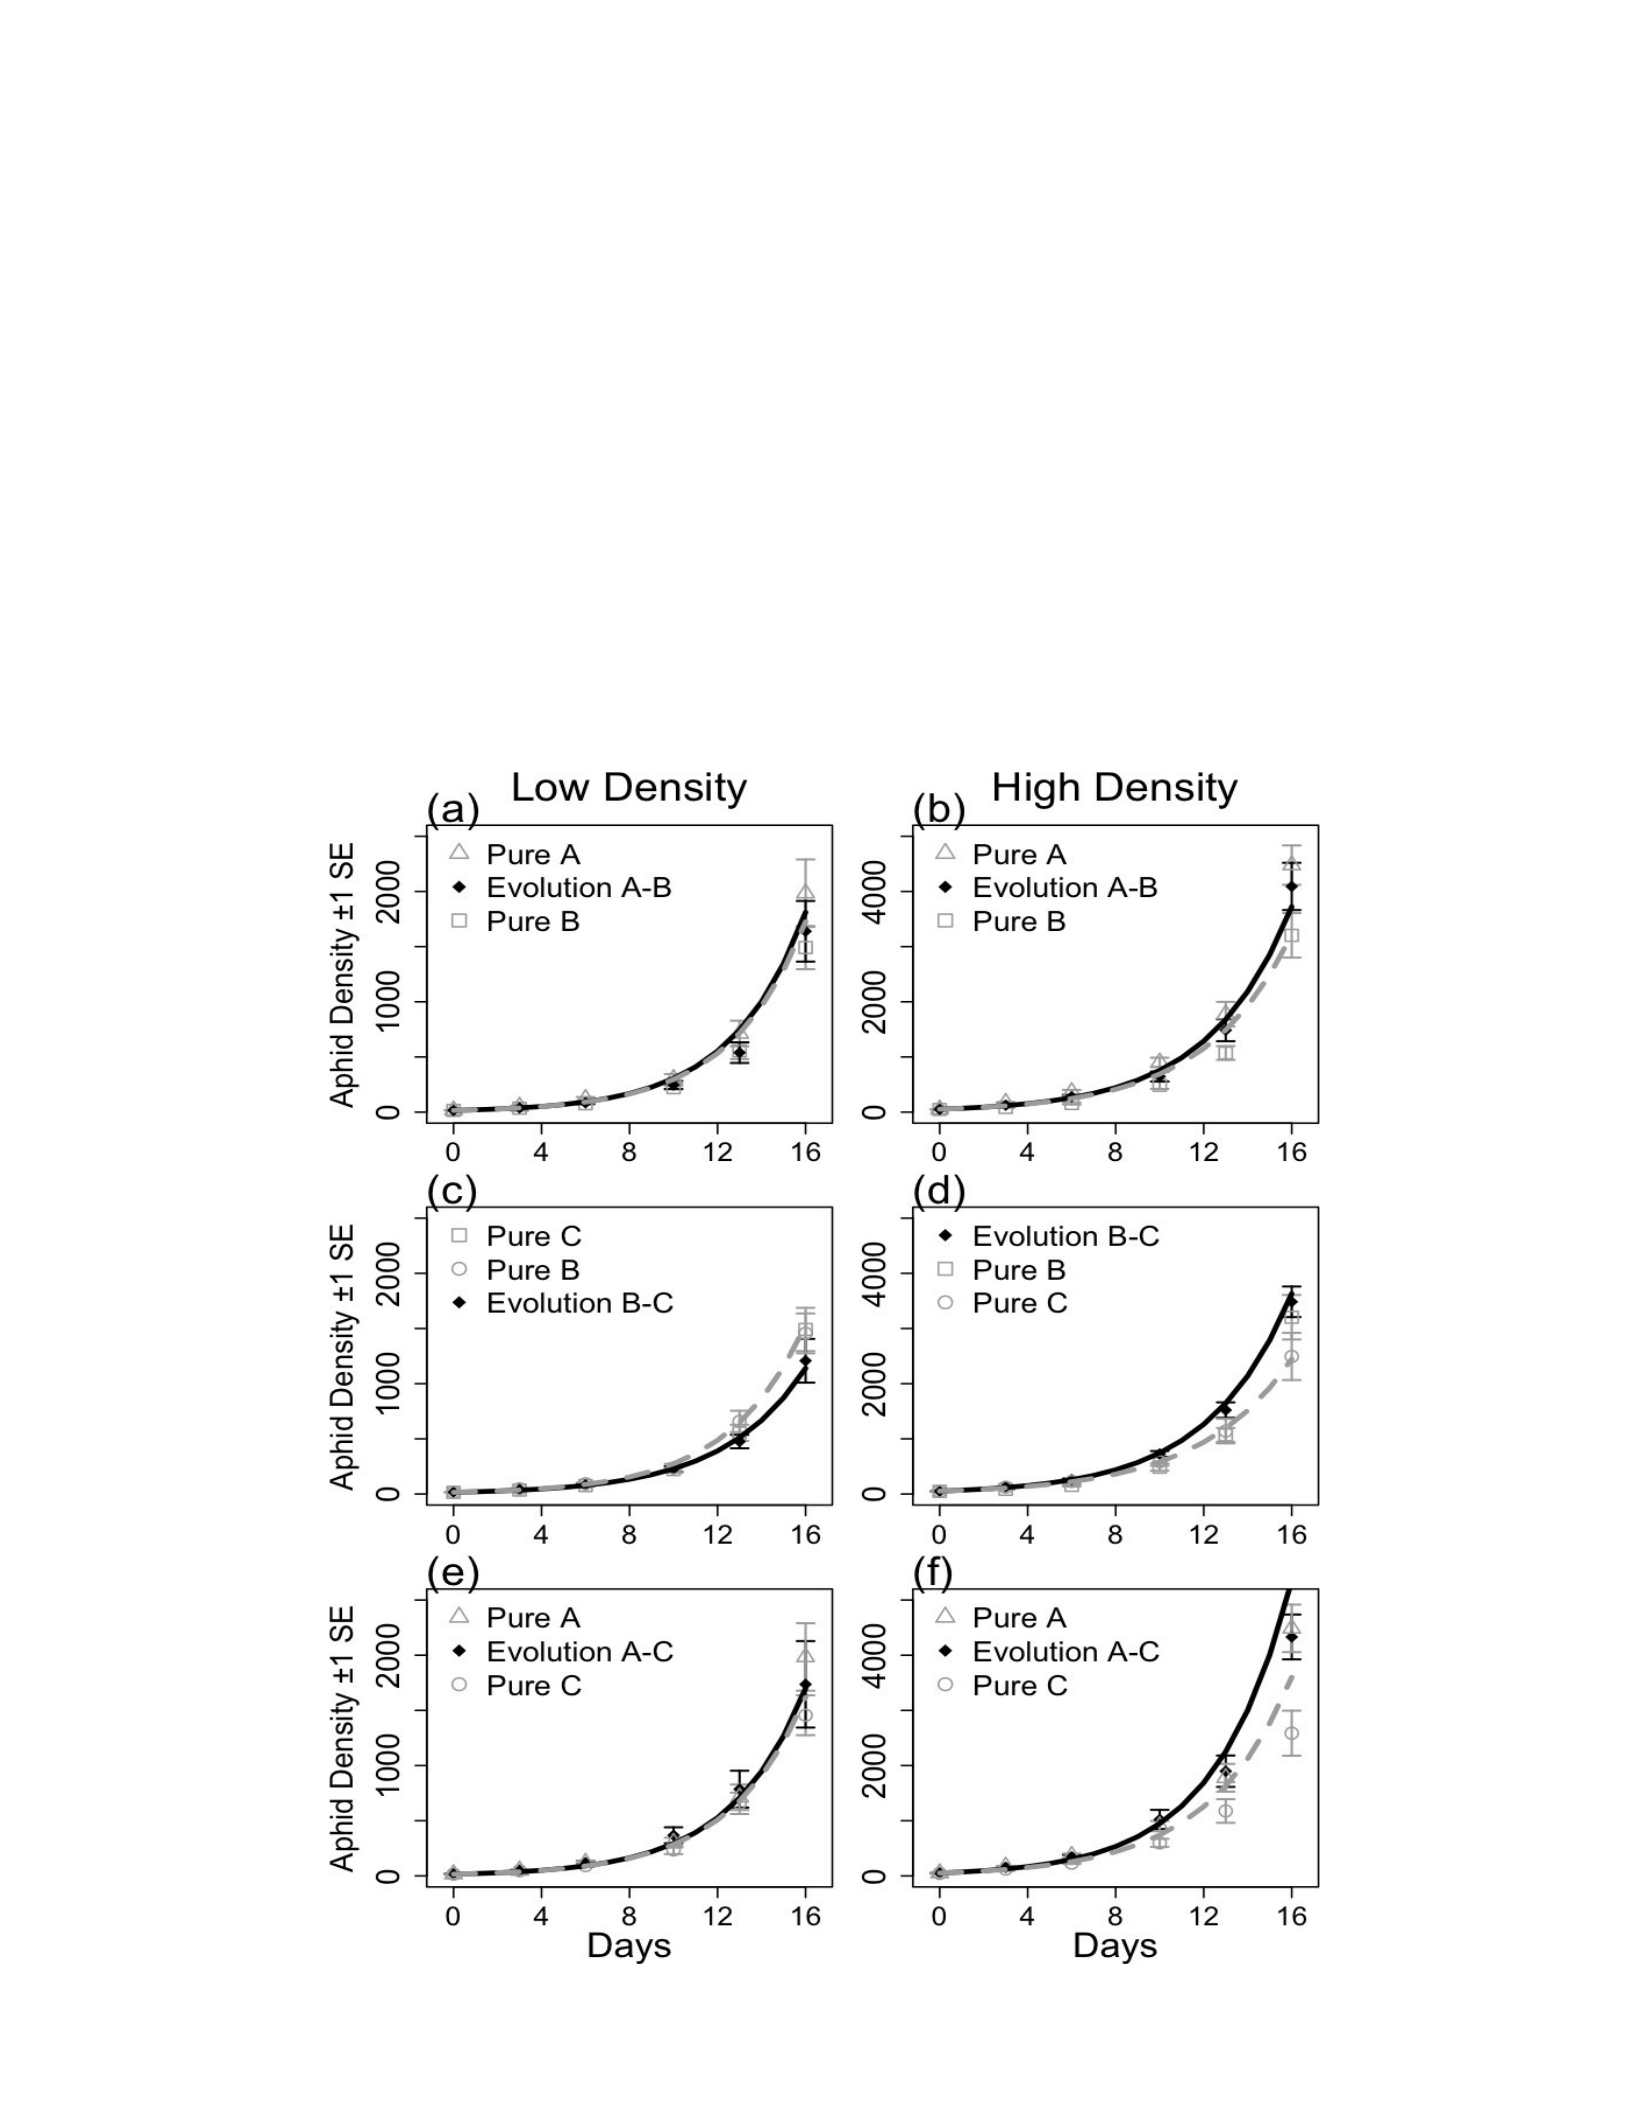
179
Figure 5.3: Population Dynamics of Evolving and Non-Evolving Aphids at Different
Initial Densitites
Partial residual plot of population dynamics of the three observed evolution
treatments (black diamonds) with the best fit model from LME analysis (black
line). Left panels are for the low initial density treatments whereas the right
panels are for the high initial density treatments. The dashed gray line
represents the best fit model that combines both pure treatments using the
constant (non-evolving) frequency of clones (50:50).
Corresponding pure clone treatments (grey symbols) used to generate the no-
evolution expectation. Values represent mean number of aphids (±1 SE)
once explained variation in the model was removed. The y-axes differ
between panels.

180
LITERATURE CITED
Abrams, P. A. and H. Matsuda. 1997. Prey adaptation as a cause of
predator- prey cycles. Evolution 51:1742-50.
Agrawal, A. A., N. Underwood, and J. R. Stinchcombe. 2004.
Intraspecific variation in the strength of density dependence in aphid
populations.
Ecological Entomology 29:521-26.
Anderson, W. 1971. Genetic equilibrium and population growth under
density- regulated selection. The American Naturalist 105:489-98.
Blackman, R. 1974. Life-cycle variation of Myzus persicae (Sulz.)(Hom.,
Aphididae) in different parts of the world, in relation to genotype and
environment. Bulletin of Entomological Research 63:595-607.
Bohannan, B. and R. Lenski. 2000. Linking genetic change to
community evolution: insights from studies of bacteria and
bacteriophage. Ecology Letters 3:362-77.
Bone, E. and A. Farres. 2001. Trends and rates of microevolution in plants.
Genetica 112-113:165-82.
Chitty, D. 1967. The Natural Selection of self-regulatory behaviour in
animal populations. Proceedings of the Ecological Society of
Australia:51-78.
Day, T. 2005. Modelling the ecological context of evolutionary change:
Déjà vu or something new? P. 273-309 in K. Cuddington and B. E.
Beisner, editors.
Ecological Paradigms Lost Routes of Theory Change. Elsevier
Academic Press.

181
Foster, S., R. Harrington, A. Dewar, I. Denholm, and A. Devonshire. 2002.
Temporal and spatial dynamics of insecticide resistance in Myzus
persicae
(Hemiptera: Aphididae). Pest Management Science 58:895-907.

182
Fussmann, G. F., S. P. Ellner, and N. G. J. Hairston. 2003. Evolution as a
critical component of plankton dynamics. Proceedings of the Royal
Society of London. Series B, Biological Sciences 270:1015-22.
Fussmann, G. F., M. Loreau, and P. A. Abrams. 2007. Eco-evolutionary
dynamics of communities and ecosystems. Functional Ecology
21:465-77.
Hairston, N. G. J., S. P. Ellner, M. A. Geber, T. Yoshida, and J. A. Fox.
2005. Rapid evolution and the convergence of ecological and
evolutionary time. Ecology Letters 8:1114-27.
Hazell, S., D. Gwynn, S. Ceccarelli, and M. Fellowes. 2005. Competition
and dispersal in the pea aphid: clonal variation and correlations
across traits. Ecological Entomology 30:293-98.
Hazell, S. P. and M. D. E. Fellowes. 2009. Intra-specific variation
affects the structure of the natural enemy assemblage
attacking pea aphid colonies. Ecological Entomology 34:34-42.
Hendry, A. P. and M. T. Kinnison. 1999. Perspective: The pace of
modern life: Measuring rates of contemporary microevolution.
Evolution 53:1637-53.
Johnson, M. T. J. and J. R. Stinchcombe. 2007. An emerging synthesis
between community ecology and evolutionary biology. Trends in
Ecology and Evolution 22:250-57.
Levins, R., R. S. Singh, and M. K. Uyenoyama. 2003. Towards a
population biology, still. P. 21–47 The Evolution of Population
Biology.
Mackauer, M. and M. J. Way. 1976. Myzus persicae Sulz. an aphid of
world importance. P. 51-119 in V. L. Delucchi, editor. Studies in
biological control. Cambridge University Press.
Mitchell-Olds, T. and D. Bradley. 1996. Genetics of Brassica rapa .3.
Costs of disease resistance to three fungal pathogens. Evolution

183
50:1859-65.

184
Muller, F. P. 1983. Differential alarm pheromone responses between
strains of the aphid Acyrthosiphon pisum. . Entomologia
Experimentalis et Applicata 34:347–48.
Oliver, K. M., P. H. Degnan, G. R. Burke, and N. A. Moran. 2010.
Facultative symbionts in aphids and the horizontal transfer of
ecologically important traits. Annual Review of Entomology 55:247-
66.
Palkovacs, E. P. and D. M. Post. 2008. Eco-evolutionary interactions
between predators and prey: can predator-induced changes to
prey communities feed back to shape predator foraging traits?
Evolutionary Ecology Research 10:699-720.
Pelletier, F., D. Garant, and A. P. Hendry. 2009. Eco-evolutionary
dynamics.
Philosophical Transactions of the Royal Society B: Biological
Sciences 364:1483-89.
Pilson, D. 1992. Insect distribution patterns and the evolution of host
use. P. 120- 39 in R. S. Fritz and E. L. Simms, editors. Plant resistance
to herbivores and pathogens: ecology, evolution, and genetics
Unviersity of Chicago Press.
Pimentel, D. 1961. Animal population regulation by the genetic feed-
back mechanism. The American Naturalist 95:65-79.
Pimentel, D. 1968. Population regulation and genetic feedback.
Science 159:1432-37.
Pinheiro, J. and D. Bates. 2000. Mixed-Effects Models in S and
S-PLUS. Springer-Verlag.
Pinheiro, J. C., D. M. Bates, S. DebRoy, and D. Sarkar. 2009. nlme:
Linear and Nonlinear Mixed Effects Models.
R Development Core Team. 2009. R: A language and environment for
statistical computing. R Foundation for Statistical Computing,

185
Vienna, Austria.

186
Reznick, D. N. and C. K. Ghalambor. 2001. The population ecology of
contemporary adaptations: what empirical studies reveal about the
conditions that promote adaptive evolution. Genetica 112-113:183-
98.
Rochat, J., F. Vanlerberghe-Masutti, P. Chavigny, R. Boll, and L.
Lapchin. 1999. Inter-strain competition and dispersal in aphids:
evidence from a greenhouse study. Ecological Entomology 24:450-
64.
Saccheri, I. and I. Hanski. 2006. Natural selection and population
dynamics.
Trends in Ecology & Evolution 21:341-47.
Schoener, T. W. 2011. The newest synthesis: Understanding the
interplay of evolutionary and ecological dynamics. Science 331:426-
29.
Shertzer, K., S. Ellner, G. F. Fussmann, and N. G. J. Hairston. 2002.
Predator- prey cycles in an aquatic microcosm: testing hypotheses of
mechanism.
Journal of Animal Ecology 71:802-15.
Sinervo, B., E. Svensson, and T. Comendant. 2000. Density
cycles and an offspring quantity and quality game driven by
natural selection. Nature 406:985-88.
Sloane, M. A., P. Sunnucks, A. C. C. Wilson, and D. F. Hales. 2001.
Microsatellite isolation, linkage group identification and
determination of recombination frequency in the peach-potato
aphid, Myzus persicae (Sulzer) (Hemiptera: Aphididae). Genetical
Research 77:251-60.
Svensson, E. and B. Sinervo. 2000. Experimental excursions on
adaptive landscapes: density-dependent selection on egg size.
Evolution 54:1396-403.
Terhorst, C. P., T. E. Miller, and D. R. Levitan. 2010. Evolution of prey in
ecological time reduces the effect size of predators in experimental

187
microcosms. Ecology 91:629-36.
Thompson, J. N. 1998. Rapid evolution as an ecological process. Trends
in Ecology & Evolution 13:329-32.

188
Tuda, M. and Y. Iwasa. 1998. Evolution of contest competition and its
effect on host–parasitoid dynamics. Evolutionary Ecology 12:855-70.
Via, S. and A. J. Shaw. 1996. Short-term evolution in the size and shape
of pea aphids. Evolution 50:163-73.
Vorburger, C. 2005. Positive genetic correlations among major life-
history traits related to ecological success in the aphid Myzus
persicae. Evolution 59:1006- 15.
Vorburger, C. 2006. Temporal dynamics of genotypic diversity reveal
strong clonal selection in the aphid Myzus persicae. Journal of
Evolutionary Biology 19:97-107.
Wilson, A. C. C., B. Massonnet, J. C. Simon, N. Prunier-Leterme, L.
Dolatti, et al. 2004. Cross-species amplification of microsatellite loci
in aphids: assessment and application. Molecular Ecology Notes
4:104-09.
Yoshida, T., L. E. Jones, S. P. Ellner, G. F. Fussmann, and N. G. J.
Hairston. 2003. Rapid evolution drives ecological dynamics in a
predator-prey system. Nature 424:303-06.

