


1
Section 1: Foundation of the Study
Background of the Problem
The occurrence of DDoS attacks is a big problem for the Internet (Idhammad et
al., 2018b). DDoS attacks involve overloading systems from various machines (Yonghao
et al., 2019). DDoS attack detection methods based on machine learning algorithms aim
to recognize DDoS attacks. Machine learning algorithms involve supervised and
unsupervised learning to mine useful information from data to predict events. According
to Idhammad et al. (2018b), supervised learning requires prelabelled data to identify
DDoS attacks while unsupervised learning does not.
A problem of unsupervised DDoS attack detection methods is the curse of
dimensionality. The curse of dimensionality lowers the effectiveness of unsupervised
DDoS attack detection methods in terms of identifying attacks correctly (Idhammad et
al., 2018b). In a high dimensional network traffic data set that has a lot of features
(attributes), distance between data points leads to being inconsequential, which causes
calculation of the learning process of an unsupervised DDoS attack detection method to
produce equal feature weights known as the curse of dimensionality (Idhammad et al.,
2018b). DDoS attack detection methods that use the clustering method are unsupervised
to mine useful information for prediction through categorizing data points in clusters.
This method is not effective in categorizing high dimensional data (Yuanjie et al., 2020).
I added the filter and wrapper methods prior to the clustering method to reduce features
in avoiding generation of equal feature weights between two clusters for BENIGN and

2
DDoS labels, representing normal network traffic data and attacks, using the
CICIDS2017 dataset, to identify effective DDoS attack detection methods.
Problem Statement
DDoS attack detection methods based on unsupervised learning algorithms
produce high false positive rates (Idhammad et al., 2018b). In the first quarter of 2016,
Amazon lost $209 million due to service interruptions caused by DDoS attacks,
compared to $24 million during all four quarters of 2015 (David & Thomas, 2019). The
general IT problem is that DDoS attack detection methods based on the clustering
method produce high false positive rates. The specific IT problem is that some IT leaders
do not know whether adding the filter and wrapper methods prior to the clustering
method is effective in terms of lowering false positive rates of DDoS attack detection
methods.
Purpose Statement
The purpose of this quantitative study was to examine whether adding the filter
and wrapper methods prior to the clustering method is effective in terms of lowering false
positive rates of DDoS attack detection methods. I used ex post facto known as causal
comparative study with the A-B-A-BC single group phase design. Ex post facto designs
facilitate realization of causation in natural settings (Iqbal et al., 2020). The A-B-A-BC
design involves providing opportunity to control an intervention independently during the
B phase, and in a combination with a second intervention during the BC phase (Tanious
& Onghena, 2019). The first and second interventions were the filter and wrapper
methods. The single group was network traffic data. Using single group experiment, in

3
this study, enabled me not to divide network traffic data between the A, B, and BC
phases. Features involve impacting learnability of machine learning algorithms (Lamba et
al., 2018). The independent variables were the filter, wrapper, and clustering methods.
The dependent variable was false positive rates of DDoS attack detection methods that
applied the filter, wrapper, and clustering methods. The false positive rate represents the
ratio of the number of categorized normal network traffic events as attack events and
normal network traffic events (Yonghao et al., 2019). The population was network traffic
data of the CICIDS2017 dataset. The CICIDS2017 dataset contains realistic network
traffic data (Abdulhammed et al., 2019). This study may contribute to positive social
change by identifying effective DDoS attack detection methods. This may help
governments, foundations, and other social service organizations better protect their
systems from service interruptions and offer uninterrupted services to their communities.
Nature of the Study
I used the quantitative methodology to examine hypotheses in this study. This
methodology encompasses collecting numeric data (Ahmad et al., 2019). The quantitative
methodology involves rejecting or confirming hypotheses (House, 2018). This rejection
or confirmation is based on collected numeric data. False positive rates of DDoS attack
detection methods, examined in this study, represented numeric data to reject or confirm
the hypotheses in this study. I did not use the qualitative method. The qualitative method
does not involve performing examination of hypotheses (House, 2018). This method
requires presentation of narrations (Rutberg & Bouikidis, 2018). Narrations are not
involved in rejecting or confirming hypotheses. I did not use the mixed methods design.

4
This design involves using elements of the quantitative and qualitative methods (Califf et
al., 2020). I only examined the hypotheses that were in this research and I did not seek to
provide narrations. The objective of this study was to examine whether incorporating the
filter and wrapper methods prior to the clustering method is effective in terms of lowering
false positive rates of DDoS attack detection methods.
I considered ex post facto designs known as causal comparative designs. A causal
comparative research design involves realizing cause and effect of an event that already
exists (Yenice et al., 2019). Ex post facto designs do not involve imposing alterations to
conditions of a sample population (Dölek & Hamzadayı, 2018). I did not consider true
experimental designs. True experimental designs involve conducting random trials
(Bloomfield & Fisher, 2019). These designs entail manipulating variables (Bloomfield &
Fisher, 2019). However, I did not manipulate the filter, wrapper, and clustering methods.
I did not use pre-experimental designs. Pre-experimental designs must be conducted prior
to an arranged experimentation (Farooq et al., 2016). At that point instrumentation has
not reached the level of adequacy for determination of a factor’s scopes (Farooq et al.,
2016).
Research Question
Is adding the filter and wrapper methods prior to the clustering method effective
in terms of lowering false positive rates of DDoS attack detection methods?

5
Hypotheses
Null Hypothesis (H0): Adding the filter and wrapper methods prior to the
clustering method is not effective in terms of lowering false positive rates of DDoS attack
detection methods.
Alternative Hypothesis (Ha): Adding the filter and wrapper methods prior to the
clustering method is effective in terms of lowering false positive rates of DDoS attack
detection methods.
Framework
I used the cross industry standard process for data mining (CRISP-DM)
framework. The CRISP-DM framework involves addressing knowledge discovery
process using existing data (Wiemer et al., 2019). This framework facilitates analyzing
voluminous data and discovery of important information (Castro et al., 2019). Knowledge
discovery process involves applying machine learning algorithms to provide the
opportunity in enabling the analysis of voluminous data and discovery of important
information for prediction purposes related to organizational tasks.
A group of organizations, comprising SPSS, NCR and Daimler Chrysler,
developed the CRISP-DM framework in the year of 2000 (Yudith et al., 2018). The tenet
and purpose of the CRISP-DM framework involves addressing knowledge discovery
process through use of data that already exist (Wiemer et al., 2019). This framework
involves having the goal of transferring discoveries of data mining projects to daily
organizational operations (Jenke, 2018). The CRISP-DM framework was applicable to
this research as it facilitated the analysis of network traffic data and discovery of

6
important information by DDoS attack detection methods using the CICIDS2017 dataset,
and provided the opportunity to enable DDoS attack detection methods be transferrable to
any organization.
Significance of Study
This study may be valuable to IT organizations, because it involved the
presentation of the research in whether incorporating the filter and wrapper methods prior
to the clustering method lowers false positive rates of DDoS attacks detection methods.
The Internet has a great issue with DDoS attacks (Idhammad et al., 2018b). Organizations
suffer financially from $50,000 to $2.3 million annually (Lopez et al., 2019). DDoS
attack detection systems based on the clustering method are used to identify unknown
DDoS attacks from the Internet. Dimensionality reduction is vital for the clustering
method (Mohamed, 2020). Therefore adding the filter and wrapper methods prior to the
clustering method can increase the effectiveness of DDoS attack detection methods and
decrease the occurrences of financial damages.
This study may contribute to effective IT practices by deploying DDoS attack
detection methods outside of demilitarized zones (DMZs). A DMZ is an area between
internal organizational networks and the Internet. DMZ networks involve having the goal
of providing a clean network traffic path between computing resources of external and
internal networks (Chard et al., 2018). Anomaly-based DDoS attack detection methods
provide statistical reliability (Khalaf et al., 2019). These methods are knowledge
discovery methods that have the advantage of identifying attacks based on statistics and
knowledge from network traffic data. Deploying DDoS attack detection methods outside

7
of a DMZ area provides the opportunity for a firewall that is connected directly to the
Internet to be signaled of the detected attacks by the methods. Then, the firewall stops the
attacks. Positioning DDoS attack detection methods outside of DMZs to detect DDoS
attacks may lead organizations to take timely supervision to protect their systems from
service interruptions caused by these attacks. DMZ networks involve providing security
that is intermediate (Alvarez et al., 2021, p. 613). According to Miloslavskaya (2018), if
for any reason attacks could penetrate networks of organizations, DMZ networks
facilitate faster response and recovery of organizational resources.
Results of this study may have positive social change by identifying effective
DDoS attack detection methods. DDoS attacks cause services to be degraded (Khalaf et
al., 2019). These attacks congest computational assets and bandwidths with rapid network
traffic requests (Hoque et al., 2017). Effective DDoS attack detection methods may assist
governments, foundations, and other social service organizations better safeguard their
systems and offer uninterrupted services to their communities with reduced financial
damages.
Operational Definitions
Clustering Method: This method is an unsupervised approach for defining object
(data point) categories without labelled data (Rodriguez et al., 2019).
DDoS attack detection methods: These methods apply machine learning
algorithms based on supervised and unsupervised learning algorithms for detecting DDoS
attacks (Idhammad et al., 2018b).

8
False Positive Rate (FPR): It is the ratio of the number of falsely classified
normal network traffic events as attack events and total normal network traffic events
(Yonghao et al., 2019).
Filter method: This method involves the application of procedures to select
features without the need for machine learning algorithms (Lamba et al., 2018).
Machine learning: Machine learning involves applying programmed algorithms to
train and enhance the capability of their learning processes through assessing data for
forecasting purposes (Uddin et al., 2019).
Supervised learning: Supervised learning involves the use of labelled data to train
the target algorithm before prediction (Uddin et al., 2019).
Unsupervised learning: Unsupervised learning involves the use of unlabeled data
in working with learning tasks (Yonghao et al., 2019).
Wrapper method: This method involves the application of procedures to select a
subset of features according to a classification learning model of a machine learning
algorithm (Lamba et al., 2018).
Assumptions, Limitations, and Delimitations
Assumption of the Study
Assumptions represent what researchers regard as factual without providing any
evidence (Ellis & Levy, 2009). I assumed that analysis of network traffic data using the
CICIDS2017 dataset will be generalizable in terms of assessing network traffic data by
DDoS attack detection methods in real time. The collection of network traffic data for the
CICIDS2017 dataset involved using common protocols (Chiba et al., 2019). Common

9
protocols are protocols that organizations normally use to communicate through their
networks. These protocols were “HTTP, HTTPS, FTP, SSH, and email protocols”
(Sharafaldin et al., 2018, p. 114).
Limitation of the Study
Limitations are enforced constraints that ultimately researchers do not control
(Theofanidis & Fountouki, 2018). The limitation in this study was that I focused to
address the curse of dimensionality problem to identify effective DDoS attacks detection
methods. The curse of dimensionality leads to reduction of the effectiveness of
unsupervised DDoS attack detection methods in terms of proper identification of attacks
(Idhammad et al., 2018b).
Delimitation of the Study
Delimitations are constraints that researchers control (Theofanidis & Fountouki,
2018). The delimitation of this research involved the use of the clustering method in
DDoS attack detection methods to identify attacks. The clustering method is not effective
when it analyzes high dimensional data (Yuanjie et al., 2020).
Literature Review
Introduction
This literature review comprises seven parts: the first part includes a literature
review of the CRISP-DM framework, followed by the clustering method in detecting
DDoS attacks. This is followed by a review of the filter and wrapper methods and the
CICIDS2017 dataset. Next is a review of the Waikato Environment for Knowledge
Analysis (WEKA) workbench. This tool is a software package that facilitated the

10
knowledge discovery process by DDoS attack detection methods in this study to detect
attacks. The literature review concludes with a review of DMZ and application to the
applied IT problem.
The strategy for searching relevant research articles was to find contents relevant
to the problem of the curse of dimensionality and the performance of knowledge
discovery methods in analyzing network traffic data to detect attacks. The strategy was to
locate peer-reviewed research articles related to the clustering method and its
performance in terms of detecting DDoS attacks and network traffic intrusions.
I referenced 188 articles as well as 2 books, of which 170 (90.43%) articles were
peer-reviewed and 18 (9.57%) were not. I used peer-reviewed articles to provide reviews
for the CRISP-DM framework; the filter, wrapper, and clustering methods; the
CICIDS2017 dataset; the WEKA workbench; DMZ; and application to the applied IT
problem in whether adding filter and wrapper methods is effective in terms of lowering
false positive rates of DDoS attack detection methods. The articles that were not peer-
reviewed were presented under the CRISP-DM, clustering Method, CICIDS2017 dataset,
WEKA workbench, DMZ, and application to the applied IT problem parts of this review.
The modeling section under application to the applied IT problem part of this review
references the 2 books involving explanation of the clustering algorithms that this study
chose to address high false positive rates of DDoS attack detection methods in identifying
attacks.

11
CRISP-DM Framework
Data Mining
Data mining encompasses mining useful information for future forecasting of
unidentified patterns (Neto et al., 2019). This process involves analyzing large
dimensions to predict events (Jian-qiang et al., 2020). It is the process of extracting
patterns from data sets that contain large amount of data (Neto et al., 2017). It also
involves logically integrating statistical analysis with knowledge from data (Mirza,
2018). Data mining processes involve applying machine learning algorithms and
mathematical functions in terms of realizing useful information (Neto et al., 2019).
Machine learning algorithms use validation methods to regularize their models and
achieve generalization (Jian-qiang et al., 2020). One validation method is the 10-fold
cross validation method that I considered to test DDoS attack detection methods. This
method involves partitioning data into 10 subsets to train and test using applied data
mining techniques (Jian-qiang et al., 2020).
Data mining techniques are used to perform billions of observations (Jian-qiang et
al., 2020). Observations that are produced by a data mining technique forms a statistical
model. Subsequently, this model can forecast future events. Industries use these
techniques, as these techniques are used to intelligently assess data and provide
substantial advantages (Dogan & Birant, 2021). These techniques include gathering,
assessment, evaluation, and documentation of data with respect to their contexts and
settings (Tomasevic et al., 2020). According to Dogan and Birant (2021), researchers and
manufacturers work together to assess effects of data mining techniques for future events.

12
Data mining techniques have a significant impact in decision making (Dogan &
Birant, 2021). These techniques facilitate the evaluation of complex data sets (Rahaman
et al., 2019). Data mining processes involve describing structures of a data set (Dogan &
Birant, 2021). These processes involve discovering patterns in which machine learning
algorithms try to train organizational systems based on effective statistical models
(Dogan & Birant, 2021). With respect to the context of this study, DDoS attack detection
methods based on the clustering method are organizational intrusion detection methods
that organizations implement to protect their internal networks from DDoS attacks. Data
mining techniques have demonstrated their success in intrusion detection systems
(Molina-Coronado et al., 2020). Through data mining, intrusion detection systems are
able to collect, prepare, and extract meaningful patterns from network traffic data to be
effective (Molina-Coronado et al., 2020).
Data mining is a multidisciplinary methodology to analyze data using statistics,
probability and decision theories, feature engineering, and graphics for visualization
purposes (Rahaman et al., 2019). The techniques for data mining require training and
testing to produce accurate results (Alizadehsani et al., 2019). To test these techniques,
statistical and mathematical functions need to be applied for data sets to form prediction
models based on statistical analysis. These techniques represent supervised and
unsupervised machine learning algorithms (Neto et al., 2019). Supervised learning is
typically used for classification problems (Dogan & Birant, 2021). This type of learning
is applied to forecast a value (Neto et al., 2019). This value represents a label or class
(Aljawarneh et al., 2019). The labels should be finite with small amounts (Aljawarneh et

13
al., 2019). This forecasting or prediction involves requiring specifications of an intended
feature (Neto et al., 2019). However, unsupervised learning is the process of realizing
relationships among data (Neto et al., 2019). This type of learning does not involve
requiring the pre-existence of labels (Yonghao et al., 2019). To assess data mining
techniques representing supervised and unsupervised learning, a data mining process is
applied to facilitate knowledge discovery from data.
Data Mining Processes
The CRISP-DM, Knowledge Discovery and Data Mining (KDDM), Knowledge
Discovery in Databases (KDD), and Sample-Explore-Modify-Model-Assess (SEMMA)
frameworks involve addressing knowledge discovery from data in data mining tasks.
These frameworks represent data mining processes in planned phases. Data mining
techniques via one of these frameworks can be evaluated regarding their operational
performance in analyzing data.
The CRISP-DM framework has an established approach for data mining tasks
(Moslehi et al., 2018). This framework divides knowledge discovery process into six
phases (Chen-Shu et al., 2019). These phases are the “business understanding, data
understanding, data preparation, modeling, evaluation, and deployment” (Nguyen et al.,
2019, p. 80). This framework involves holding the assumption that knowledge discovery
has a process (Michalak & Gulak-Lipka, 2017). According to Jenke (2018), the use of
this framework enables assessment and deployment of machine learning algorithms in the
context of organizational settings. This framework facilitates provision of data mining
project recommendations (Bohanec et al., 2017).

14
The business understanding phase of the CRISP-DM framework is based on
determining the direction of knowledge discovery process (Nguyen et al., 2019). This
phase involves recognizing objectives based on organizational perspectives (Zwetsloot et
al., 2018), and it facilitates realizing objectives and purpose of data analysis (Oreški &
Ređep, 2018). The data understanding phase of this framework is based on data
documentations (Nguyen et al., 2019). The second phase involves providing qualification
characteristics of data for analysis (Oreški & Ređep, 2018) and facilitates evaluating data
quality leading to data familiarization (Zwetsloot et al., 2018). The data preparation phase
of this framework is about transforming data, in which subsequently, during the modeling
phase, data mining techniques are chosen to be applied on data (Nguyen et al., 2019). The
third phase provides the opportunity for final processing of data from raw data followed
by data modeling phase in constructing models (Zwetsloot et al., 2018). During the third
phase data preprocessing will occur to provide cleaned data. Cleaned data would
represent data that does not include unwanted attributes or data that leads to the incorrect
or halt of the formation of models in producing inaccurate or no result. Scholars claim
that data preprocessing is essential in data mining tasks (Benhar et al., 2020). It involves
70% to 80% of these tasks (Idri et al., 2018).
During the evaluation phase, the CRISP-DM framework involves testing machine
learning models (Nguyen et al., 2019). This phase involves ensuring that business
objectives are achieved (Zwetsloot et al., 2018). The deployment phase facilitates
documentation and incorporation of models in business settings (Zwetsloot et al., 2018).
This phase of the CRISP-DM framework enables organizations to conduct real-time

15
industrial operations based on “repetitive requisites” (Nguyen et al., 2019, p. 80).
According to Nguyen et al. (2019), this means that organizations would be able to have
online and continuous evaluation as well as modeling maintenance and retraining of
knowledge discovery methods. Consequently, this framework would frequently involve
in improving the effectiveness of knowledge discovery methods.
Data mining is the essence of knowledge discovery process (Nguyen et al., 2019).
Significant realization of usefulness of data mining led to establishment of the CRISP-
DM framework (Nguyen et al., 2019). The CRISP-DM framework includes a
standardized process to analyze large sets of “unstructured data” (Cazacu & Titan, 2020,
p. 99) via a cyclic and repetitive process (Nguyen et al., 2019).
The KDDM process involves selecting an existing dataset, in which subsequently,
data are cleaned via repairing incorrect data and fixing missing values (Park et al., 2020).
This process facilitates transformation of data through reducing dimensions of data and
putting it in a proper format (Park et al., 2020). Consequently, this process enables data
mining and knowledge discovery (Park et al., 2020). Next, the KDDM process involves
evaluating results; and then, effective models are incorporated in a desired setting (Park
et al., 2020). This framework allows only for building, evaluating, and deploying models
(Yan et al., 2017).
The KDD process is about collecting and using data in realizing patterns by
machine learning algorithms (Mirza, 2018). The main objective by using this process is
to transform data to useful information (Naghani et al., 2019). The KDD process involves
scientific analysis of data mining techniques (Oliveira et al., 2018). This process has five

16
phases of the “definition of preliminary points, data pre-processing, data dimensionality
reduction, data mining, and knowledge quantification” (Storti et al., 2018, p. 5). During
the first phase of the definition of preliminary points, this process involves defining
concepts and objectives in terms of directing a data mining task (Storti et al., 2018). The
data pre-processing phase enables data cleaning (Storti et al., 2018). Applying this phase
enables provision of consistent data (Chala, 2019). Based on Storti et al. (2018), the
subsequent phase involves performing the dimensionality reduction of an intended data.
The data mining phase of the KDD process facilitates the application of data mining
algorithms to data mining tasks in evaluating them during the knowledge quantification
phase (Storti et al., 2018). The KDD framework enables analyzing big data (Storti et al.,
2018). This framework involves the benefits of reducing large data size and dealing with
uncertain circumstances (Storti et al., 2018).
The SEMMA involves a sequential process (Cazacu & Titan, 2020). According to
Barrios et al. (2019), the SEMMA process has five phases of the data sampling, data
exploration, data modification, modeling, and assessment. The data sampling phase
facilitates the extraction of data that are large enough to provide useful information and
small enough to be processed fast (Barrios et al., 2019). During the data exploration
phase, the SEMMA process enables investigation of trends and contexts in which data are
provided to enable idea familiarization (Barrios et al., 2019). The data modification phase
involves performing data cleaning and reduction of sampled data (Barrios et al., 2019).
Subsequently, the modeling phase involves applying data mining techniques to forecast

17
desired events (Barrios et al., 2019). During the last phase, data mining techniques are
assessed for their effectiveness based on results (Barrios et al., 2019).
Success of the CRISP-DM Framework Over Other Data Mining Processes
The CRISP-DM framework has been accepted by academic institutes and
industries (Yunpeng et al., 2019). Research has shown that this framework is more
widely used (Yan et al., 2017). This framework has a cyclic and repetitive process
(Nguyen et al., 2019). This enables process reuse in reevaluation of data mining
techniques. The KDDM framework does not facilitate process reuse (Yan et al., 2017).
This is because, this framework does not provide an iterative approach to data mining
projects. The KDDM framework provides a sequential process.
Also, the CRISP-DM framework is the enhanced version of the KDD framework
(Plotnikova et al., 2020). The framework has an iterative approach while the KDD has a
sequential one (Plotnikova et al., 2020). The CRISP-DM framework is more business-
oriented than the KDD (Kharlamov et al., 2020). Likewise, the CRISP-DM is more
comprehensive than the SEMMA framework (Kharlamov et al., 2020). The SEMMA
framework does not have a deployment phase, and it does not involve assessing large
datasets.
The CRISP-DM framework involves realization and correct employment of its
phases (Komenda et al., 2020). This framework provides the opportunity to go back to its
phases, and it facilitates ensuring validation of obtained results before deployment
(Komenda et al., 2020). The CRISP-DM framework enables provision of
recommendations throughout its phases to offer generality and reliability (Kebede et al.,

18
2017). Applying this framework will guarantee the way that existing databases or
datasets could be utilized to have specific objectives, and be able to support industry
decision makings (Groggert et al., 2018). This framework involves ensuring “efficiency
and maturity” (Groggert et al., 2018, p. 246) of developed knowledge discovery methods
for organizations (Groggert et al., 2018).
From the beginning, the objective of the CRISP-DM framework was set to
provide an open knowledge discovery process that was standardized for data mining
(Overgoor et al., 2019). This framework is considered to be a guideline for data mining
projects (Asamoah & Sharda, 2019). According to Overgoor et al. (2019), organizations
regarded the CRISP-DM framework as the knowledge discovery process that involved
best practices model (Overgoor et al., 2019). The creation of this framework was
hierarchical to enable each phase to be branched to additional phases (Overgoor et al.,
2019).
Organizations frequently use the CRISP-DM framework (Oreški & Ređep, 2018).
This framework involves facilitating classification using data sets (Oreški & Ređep,
2018). In an international survey that comprised 300 IT leaders, 88% of the participants
revealed that it is necessary for better analysis of rapidly growing data (Schmidt &
Wenying, 2018). In this survey, 96% of these participants stated that their organizations
have large data mining projects and 32% of respondents articulated that they are able to
accomplish high quality of these projects (Schmidt & Wenying, 2018). In another survey,
from 67.5% of respondents, 43% of them stated that their organizations utilize the
CRISP-DM framework to deliver projects (Schmidt & Wenying, 2018). This survey

19
revealed that 17% of organizations use SEMMA and 7.5% use KDD (Schmidt &
Wenying, 2018). According to Bohanec et al. (2017), the 43% response of organizations
using the CRISP-DM makes this framework a suitable knowledge discovery process for
data mining projects. Schmidt and Wenying (2018) stated that quality of these projects
associates with the knowledge discovery process that these organizations apply in their
data mining projects. Research shows that the success of data mining projects depends on
the iterative and interactive nature of data mining processes (Schmidt & Wenying, 2018).
An organizational consortium delivered the CRISP-DM framework (Plotnikova et
al., 2020). This consortium comprised SPSS, NCR and Daimler Chrysler companies that
delivered this framework in the year of 2000 (Yudith et al., 2018). The CRISP-DM
framework involves a comprehensive knowledge discovery process for successfully
conducting data mining projects (Bohanec et al., 2017). This organizational consortium
designed the CRISP-DM framework to be “domain-agnostic” (Plotnikova et al., 2020, p.
7). That means that this framework can be applied to uncertain circumstances in
accomplishing data mining projects. This led to the extensive use of this framework in
research communities and various organizations (Plotnikova et al., 2020).
Blasi and Alsuwaiket (2020) applied the CRISP-DM framework in their study to
accomplish a data mining task by addressing knowledge discovery from students’
misconduct data in higher education institutions. The CRISP-DM was applied to
determine attributes that led to students’ mischiefs while they are in the university
campus chosen for this particular study (Blasi & Alsuwaiket, 2020). Blasi and
Alsuwaiket (2020) considered the CRISP-DM useful in managing this data mining

20
project. Blasi and Alsuwaiket (2020) incorporated the J48 classifier to learn from data
and recommended further investigation of data mining techniques for this task in higher
education institutions. The J48 classifier is a decision tree learning algorithm. A decision
tree learning algorithm involves applying top-down learning structure (Tomáš et al.,
2020). A decision tree starts from a root to branch examples (data) into separate subsets
(Tomáš et al., 2020). Based on Tomáš et al. (2020), each node represents a tested
(validated) value.
In another study, Macas et al. (2017) stated that innovative solutions in social
security public sector require significant enhancements. Macas et al. (2017) regarded the
CRISP-DM framework successful in accomplishing data mining projects to enable the
recognition of unknown network attack patterns. To conduct a study using this
framework, Macas et al. (2017) mentioned that several IT personnel stated that some
attacks could not be detected in this sector. As the result, data mining strategies have
been essential for intrusion detection systems (Macas et al., 2017). Macas et al. (2017)
applied this framework to build a network intrusion model using the J48 classifier to
detect attacks in this public sector. The purpose of the study by Macas et al. (2017) was
to introduce an innovative solution to enable detection of network attacks, and to increase
security within this sector.
However, the CRISP-DM framework has one disadvantage. This framework does
not involve data acquisition (Wiemer et al., 2019, p. 1). The CRISP-DM framework
provides the opportunity to address knowledge discovery process using existing data
(Wiemer et al., 2019). Wiemer et al. (2019) proposed Data Mining Methodology for

21
Engineering applications (DMME) as an extension to the CRISP-DM framework.
According to Wiemer et al. (2019), the DMME facilitated the conduction of data
acquisition while having the specifics of the CRISP-DM framework in place to
accomplish data mining tasks.
Nevertheless, the CRISP-DM framework is a great tool to address organizational
data mining problems. This framework encompasses supporting transition of data mining
tasks into business strategies (Wiemer et al., 2019) and facilitates provision of each of its
phases with deliverable tasks (Yunpeng et al., 2019). The CRISP-DM framework
involves offering recommendations to accomplish data mining tasks (Silva et al., 2019),
and it provides the opportunity to increase the delivery of data mining projects (Morais et
al., 2017). The fundamental principles of this framework were based on “enterprise
standard data mining” (Exenberger & Bucko, 2020, p. 13). According to Exenberger and
Bucko (2020), the CRISP-DM framework involves assessing organizational data to
enable business administration. The goal of this framework is to transform organizational
problems into data mining tasks (Huber et al., 2019). This framework is able to facilitate
the conduction of data mining tasks that are separate from application area and the
employed technology (Huber et al., 2019). That makes this framework a standard
approach to fit within any context of organizational operations. The CRISP-DM
framework involves flexible phases that facilitate building a knowledge discovery
method and enabling its practicality in organizations (Pinto et al., 2020). This framework
facilitates administrative processes (Pinto et al., 2020), and it is cheap, dependable,

22
repeatable, controllable, and fast to achieve data mining objectives (Gonçalves et al.,
2020).
Applicability of the CRISP-DM Framework in Evaluating the Clustering Method
The clustering method is a significant data mining technique for realizing patterns
and discovering knowledge (Pérez-Suárez et al., 2019). The CRISP-DM framework
involves transforming data mining tasks into business strategies (Wiemer et al., 2019).
That makes this framework applicable to this study to address the issue of DDoS attack
detection methods based on the clustering method to lower their false positive rates to
enable organizations to better protect their systems. The clustering method provides
experimental activity for data mining (Hamad et al., 2020). This method enables the
categorization of data objects into classes or clusters where data objects belong to a
group, if they are similar (Pérez-Suárez et al., 2019).
The clustering method involves directing a data mining project through a cluster
analysis and performing the examination of characteristics of data objects to classify
similar ones (Zou, 2020). This method makes data more similar under one category than
other category (Guan et al., 2017). This is based on specific measures (Hamodi et al.,
2020). Results of the clustering method will involve having objects with greater
similarity under one group and objects with smaller similarity under another group (Zou,
2020). This analysis is based on the examination of data objects and their associations to
object categories (Moslehi et al., 2018). Knowledge discovery based on the clustering
method facilitates assessing data objects based on matching properties to categorize them
(Schuh et al., 2017).

23
Data mining techniques are advantageous in analyzing large number of attributes
within data sets (Bellinger et al., 2017). They involve discovering patterns from high
dimensional data sets (Bellinger et al., 2017). The performance of DDoS attack detection
methods based on the clustering method suffer from the curse of dimensionality that is as
the result of the analysis of high dimensional data sets in terms of producing high false
positive rates. The clustering method is not effective to group high dimensional data
(Yuanjie et al., 2020). In a high dimensional network traffic data set that has many data
properties (variables/features), distance among data points leads to being inconsequential
(Idhammad et al., 2018b). This leads the learning process of an unsupervised DDoS
attack detection method to generate equal feature weights known as the curse of
dimensionality (Idhammad et al., 2018b). The curse of dimensionality is as the
consequence of redundancy of data properties (Salimi et al., 2018). Therefore in this
study, I intended to examine whether incorporating the filter and wrapper methods prior
to the clustering method is effective in terms of lowering false positive rates of DDoS
attack detection methods. Due to the suitability of the CRISP-DM to deal with
organizational data mining tasks, I used the CRISP-DM framework to facilitate assessing
DDoS attack detection methods.
Clustering Method
The incidence of DDoS attacks is a major problem for the Internet (Idhammad et
al., 2018b). According to Yonghao et al. (2019), DDoS attacks involve interrupting
legitimate network traffic requests for services from several machines as the source
systems by overloading victim systems with redundant network traffic requests. This

24
event may lead in bringing down network services and resulting to financial damages in
occurring costs to organizations from $50,000 to $2.3 million annually (Lopez et al.,
2019).
The clustering method is a well-known unsupervised learning approach (Yonghao
et al., 2019). As the result this method may be known as a common unsupervised
approach for detecting DDoS attacks. The clustering method organizes a data set in
clusters (Sinaga & Miin-Shen, 2020).
Similarity-based and distance-based cluster analyses involve categorizing data
points in clusters. Similarity-based cluster analysis enables maximization of intra-class
similarities and minimization of inter-class similarities which is based on the analysis of
the patterns of statistical distribution (Anjum & Qaseem, 2019). The self-organizing
maps (SOM) algorithm is a procedure of the clustering method that performs similarity-
based cluster analysis. Distance-based cluster analysis involves maximization of intra-
cluster distances and minimization of inter-cluster distances. The k-means algorithm is a
procedure of the clustering method that performs distance-based cluster analysis. Both
SOM and k-means algorithms use the Euclidean distance to perform similarity-based and
distance-based cluster analyses respectively. The Euclidean distance involves calculating
the square root of the feature value variation among two data points in a dimensional
feature space (Faizah et al., 2020).
The SOM algorithm is a widely used procedure of the clustering method (Kuo et
al., 2018). It is the unsupervised implementation of the artificial neural network (ANN)
algorithm (Ghadiri & Mazlumi, 2020). It maps multidimensional data (Youngjin, 2019).

25
This algorithm produces a low dimensional grid from a high dimensional data set
(Ghadiri & Mazlumi, 2020). It involves establishing topological orders of neurons in a
dimensional feature space. Each neuron represents the Euclidean distance between a
series of network traffic data points (an input vector) and a series of generated weights (a
weight vector) by DDoS attack detection methods that use the SOM algorithm. Initially,
this algorithm picks random values from randomly selected network traffic data instances
to determine weights. Subsequently, this algorithm adjusts weights using its weight
function. This algorithm considers data points with nearest distance similar, and therefore
belonging to a class. A network traffic data instance represents categorization of two or
more network traffic data objects in accordance to a label.
The k-means algorithm is the classic algorithm of the clustering method that is
simple with low computational cost (Hanjie et al., 2020). It is the most well-known and
used algorithm (Talasbek et al., 2020), and it has fast execution (Junwen et al., 2020).
The k-means algorithm is an inflexible algorithm that is built with the assumption that a
data object or data point should belong to a cluster (Ziheng & Zixiang, 2020). The
assignment of network traffic data objects to clusters is based on minimized average
distance value. The k-means algorithm involves the average computation of data
instances within a cluster, and it adjusts the cluster’s centroid to that average (Sangve &
Kulkarni, 2017). Consequently, the k-means algorithm assigns network traffic data points
with the nearest centroid (average) of a cluster to that cluster.
DDoS attack detection methods that use the clustering method are unsupervised
detection methods that produce high false positive rates. When Meira (2018) investigated

26
the performance of unsupervised learning algorithms using the NSL-KDD dataset, results
of the study showed that these algorithms achieved similar F-score of 0.6. This is not a
good performance (Meira, 2018). The NSL-KDD dataset comprises four types of attacks,
which are “DoS, Probe, R2L, and U2R” (Idhammad et al., 2018b, p. 3195). Since the F-
score of 0.6 is not a good performance of unsupervised learning algorithms, it signifies
that these algorithms produce high false positive rates in detecting attacks.
Based on the contents of the study by Ko et al. (2019), the F-score is 2 divided by
the summation of 1 divided by the precision and 1 divided by the true positive rate or
recall. According to Verma and Ranga (2018b), the calculation of the precision is the
division of the number of occurrences of the true positive by the summation of the
number of occurrences of the true positive and false positive. The true positive represents
the number of attack data instances predicted correctly (Verma & Ranga, 2018b). The
false Positive represents the number of normal data instances predicted incorrectly as
attack data instances (Verma & Ranga, 2018b). The true positive rate is the ratio of the
number of correct identification of attack network traffic data instances to the entire
network traffic data instances of a dataset (Binbusayyis & Vaiyapuri, 2019). According to
Verma and Ranga (2018b), this metric is the ratio of the number of occurrences of the
true positive divided by the summation of the number of occurrences of the true positive
and false negative. The false negative represents the number of attack data instances
predicted as normal data instances (Verma & Ranga, 2018b). A data instance comprises
some series of network traffic data objects representing either an attack or a normal
network traffic data.

27
Yonghao et al. (2017) used the k-means algorithm to propose a constrained k-
means algorithm representing a semi-supervised clustering method. A semi-supervised
method will take advantage of supervised learning to increase its effectiveness in
detecting attacks using prelabelled data during learning or training. Yonghao et al. (2017)
stated that the algorithm could enhance the accuracy (correct classification) using small
labelled datasets. Based on the study by Yonghao et al. (2017), a small labelled dataset is
a dataset that contains small amount of network traffic features and labelled data
instances within a data file. The accuracy is the ratio of the number of occurrences of the
true negative and true positive divided by the entire size of a dataset (Binbusayyis &
Vaiyapuri, 2019). The true negative is the number of normal data instances predicted
correctly (Verma & Ranga, 2018b).
Sangve and Kulkarni (2017) considered the use of the k-means algorithms on
network traffic data using the NSL-KDD dataset with five different data sizes of 3000,
5000, 8000, 10000, 15000, and 20000. The false positive rate for each given data size
presented by Sangve and Kulkarni (2017) was 0.0080, 0.0052, 0.0055, 0.0080, 0.0052,
and 0.0057 respectively. Verma and Ranga (2018a) reflected on the use of the CIDDS-
001 dataset in comparing the SOM and k-means algorithms. The CIDDS-001 dataset is a
flow based network traffic dataset of normal and attack network traffic data in a cloud
environment (Chiba et al., 2019). This dataset contains 32 million flow-based network
traffic data instances (Idhammad et al., 2018a), and it involves network traffic data from
OpenStack and external servers (Verma & Ranga, 2018a). OpenStack servers are servers
that involve supporting information maintenance and provision of a cloud computing

28
infrastructure. External servers are customized servers that involve supporting
information maintenance and provision of a specific organizational computing
infrastructure.
Verma and Ranga (2018a) extracted 153,026 data instances from external servers
and 172,839 data instances from OpenStack servers, and they compared the performance
of the SOM and k-means algorithms. Verma and Ranga (2018a) could achieve the
accuracies of 0.38 and 0.46 for the SOM algorithm and achieve the accuracies of 0.38
and 0.99 for the k-means algorithm using the external server data and OpenStack server
data respectively. The accuracies of 0.38 and 0.46 obtained using the SOM and k-means
algorithms signify that these algorithms are not effective in identifying DDoS attacks.
Ko et al. (2019) investigated the performance of a two-layered SOM algorithm for
detecting DDoS attacks using the F-score. Based on Ko et al. (2019), the two-layered
SOM algorithm involved the incorporation of the SOM algorithm twice, consecutively.
Ko et al. (2019) compared the performance of the two-layered SOM algorithm with the
k-means algorithm and the single layer SOM algorithm. The two-layered SOM algorithm
outperformed the k-means and the single layer SOM algorithms using the F-score.
Results of the study by Ko et al. (2019) revealed that the two-layered SOM algorithm had
the F-score of 95.83%, the single layer SOM algorithm had the F-score of 83.66%, and
K-means algorithm had the F-score of 93.00%. Chunyong et al. (2017) introduced an
improved SOM algorithm, integrating it with the k-means algorithm. Chunyong et al.
(2017) used the KDD Cup 99 (KDD) dataset. The KDD Cup 99 dataset contains four
types of attacks, which are “DoS, R2L, U2R, and Probe” (Obeidat et al., 2019, p. 71).

29
This dataset has 5 million records with 42 network traffic features (Chunyong et al.,
2017). Chunyong et al. (2017) stated that this algorithm could achieve a good accuracy
compared to the traditional SOM.
In one study, Yonghao et al. (2019) stated that the k-means algorithm has the
disadvantage of equal feature weight assignment among clusters. A feature weight has a
value between 0 and 1, based on minimized average distance values among data points.
The k-means algorithm calculates the average of data instances within a cluster and
updates the cluster’s centroid to that average (Sangve & Kulkarni, 2017). The k-means
algorithm assigns equal feature weights to data points when distance among points leads
to being inconsequential in high dimensional data. This is the curse of dimensionality of
the k-means algorithm. It means that distance among data points in the iterative approach
leads to have no impact to change the value of a resulting feature weight among clusters.
In this case, the k-means algorithm cannot recognize an object category or cluster for a
given data point, lowering its effectiveness in detecting attacks.
Yonghao et al. (2019) used a small labelled dataset for reducing the selection of
beginning center points to enhance the performance of the k-means algorithm. Yonghao
et al. (2019) addressed the curse of dimensionality of the k-means algorithm with the
semi-supervised k-means algorithm using datasets such as the CAIDA and CICIDS2017
datasets. The produced false positive rates of the algorithm from the study by Yonghao et
al. (2019) were 0% and 28.72% respectively. The CAIDA dataset represents some series
of anonymized network traffics, containing features such as “source port, destination
port, protocol type and etc.” (Yonghao et al., 2019, p. 64359). The CICIDS2017 dataset

30
represents some series of network traffic data that are fully labelled, containing features
such as “source port, destination port, protocol ID and etc.” (Yonghao et al., 2019, p.
64359). In another study, Idhammad et al. (2018b) reflected on the curse of
dimensionality of unsupervised learning algorithms, and concentrated on the use of the k-
means algorithm. Idhammad et al. (2018b) introduced a co-clustering method to train
DDoS attack detection methods with appropriate features. The implementation of this
method by Idhammad et al. (2018b) was based on the information gain ratio that was
obtained using entropies of network traffic data.
An entropy is the measure of disordered information (uncertainty) of a random
data object (Yonghao et al., 2019). The uncertainty (disorder/impurity) is the probability
of a network traffic data object being selected with respect to a label. The information
gain ratio is the product of an entropy and the weight of the entropy based on the
distribution of network traffic data. Idhammad et al. (2018b) applied the ensemble
classifiers method on clusters that achieved high information gain ratio for recognizing
DDoS attacks. The ensemble classifiers method involves the combination of some series
of supervised learning algorithms to enhance its effectiveness in detecting attacks. The
results of the study by Idhammad et al. (2018b) revealed that the false positive rate of the
proposed method using the NSL-KDD dataset was 0.33%, using the UNB ISCX 12
dataset was 0.35%, and using the UNSW-NB15 dataset was 0.46%. The ISCX 12 dataset
contains 19 features for DDoS attacks and non-attack (Idhammad et al., 2018b). The
UNSW-NB15 dataset contains 9 types of attacks. These attacks are “Generic, Exploits,
Fuzzers, DoS, Reconnaissance, Analysis, Backdoor, Shellcode, and Worms”

31
(Binbusayyis & Vaiyapuri, 2019, p. 106503). The UNSW-NB15 has 49 features that
were generated using IXIA PerfectStorm platform which is a commercial solution for
generating and assessing large network traffics (Meghdouri et al., 2018).
In spite of the whole efforts of improving the performance of DDoS attack
detection methods based on the clustering method, the curse of dimensionality avoids
these methods to properly identify attacks. When in an unsupervised attacks detection
approach, a DDoS attack detection method analyzes a high dimensional network traffic
data set that has a lot of features, distance among data points leads to being
inconsequential (Idhammad et al., 2018b). The clustering method has an issue in
classifying high dimensional data in groups (Rathore et al., 2019). Since the clustering
method is an unsupervised approach in detecting attacks, as the consequence, the
calculations of the learning processes of these DDoS attack detection methods produce
equal feature weights among categories. This method is not effective in categorizing high
dimensional data (Yuanjie et al., 2020). Many features in high dimensional data would be
redundant (Yanfang et al., 2020). Redundant features are not informative (Azhar et al.,
2019).
Feature redundancy leads to the curse of dimensionality (Salimi et al., 2018). A
dimensionality (feature) reduction process is essential for the clustering method
(Mohamed, 2020). It involves removing redundant features (Henni et al., 2020), and it
can enhance the accuracy (Manbari et al., 2019). A feature reduction process removes
inappropriate features (Visalakshi & Radha, 2017), and it reduces dimensionality (Da et
al., 2020). Feature reduction has the capability to enhance the “generalization

32
performance” (Xiaojuan et al., 2018, p. 595). The filter and wrapper methods involve
administering feature reduction. The filter method selects attributes that have the highest
predictive powers. The wrapper method depends on a learning model to extract attributes.
Filter and Wrapper Methods
The filter method involves selecting features without incorporating machine
learning algorithms (Moran & Gordon, 2019). They are able to provide a subset of
features that is independent of learning models (Moran & Gordon, 2019). The chi-
squared and information gain are algorithms that the filter method uses to produce the
predictive power (worth) of a feature. The chi-squared algorithm performs a statistical
test to calculate a feature deviation from the expected distribution and produces the
predictive power of a feature according to a label (Corrales et al., 2018). The lower the
predictive power of a given feature is, the higher is the independency of the feature to
that label. The filter method removes independent features (Corrales et al., 2018). In this
case, this method uses the ranker search method. If some features have predictive powers
less than a given threshold in the ranker search method, the filter method considers them
independent features. The information gain algorithm evaluates features according to a
label and determines the importance of features (Ahmad et al., 2018). The importance of
each feature depends on information gain ratio. The higher the information gain ratio is,
the higher is the importance of a given feature to a label. The removal of features is based
on a predetermined threshold in the ranker search method. The filter method uses the
ranker search method to remove less important features below a given threshold.

33
In one study, Divyasree and Sherly (2018) measured the performance of the chi-
squared algorithm in selecting appropriate network traffic features using the KDD dataset
in detecting attacks by the ensemble classifiers method. Their results revealed that the
chi-squared algorithm could achieve the false positive rate of 0.4714% in selecting
appropriate network traffic features. The ensemble classifiers method involves integrating
various classifiers to accomplish data mining tasks. In another study, Aljawarneh et al.
(2018) integrated the ensemble classifiers method with the information gain algorithm to
select important network traffic features. This method produced the accuracy of 99.9% in
detecting attacks.
Tchakoucht and Ezziyyani (2018) combined the information gain algorithm with
the CFS (correlation-based feature selection) algorithm and achieved the false positive
rate of 0.3% in detecting attacks using the KDD dataset. The CFS is a supervised
approach (Howcroft et al., 2017) that applies the “heuristic (correlation based) function”
(Singh & Singh, 2018, p. 569). The filter method uses the CFS algorithm to assess
subsets of features (Palma-Mendoza et al., 2018). This algorithm has similar performance
as the wrapper method (Shojanoori et al., 2018). The determination of a subset of
features, using the CFS algorithm, is based on the degree of the subset that increases the
prediction of classes in the dimensional feature space of data instances (Singh & Singh,
2018). Using this algorithm involves having the filter method to select features that have
high correlation with labels and no correlation among each other (Hajisalem & Babaie,
2018).

34
The wrapper method is another approach for evaluating features. This method
uses the accuracy (an evaluation criterion) of a learning model (Shu et al., 2020) and tries
to enhance the accuracy of the associated classifier (Visalakshi & Radha, 2017). The
performance of that classifier determines a subset of features (Jadhav et al., 2018). The
wrapper method can have better outcomes in performance than the filter method in
evaluating features (Pragadeesh et al., 2019).
The curse of dimensionality lowers the effectiveness of DDoS attack detection
methods based on the clustering method to properly categorize network traffic data points
as attacks and non-attack. The clustering method does not perform well in grouping high
dimensional data (Yuanjie et al., 2020). High dimensional data leads to the curse of
dimensionality. The curse of dimensionality lowers the effectiveness of DDoS attack
detection methods that use unsupervised learning algorithms in terms of recognizing
attacks properly (Idhammad et al., 2018b). Therefore the purpose in this study was to
incorporate the filter and wrapper methods prior to the clustering method to identify
effective DDoS attack detection methods. The following section provides a literature
review of the CICIDS2017 dataset, which I used to identify effective DDoS attack
detection methods.
CICIDS2017 Dataset
Sharafaldin et al. (2018) created the CICIDS2017 dataset. This dataset contains
network traffic data that are reflective of real scenarios (Abdulhammed et al., 2019).
Sharafaldin et al. (2018) designed two networks; one representing a victim network and
the other representing an attack network. The victim network included a robust security

35
infrastructure using “firewall, router, switches” (Sharafaldin et al., 2018, p. 110), and
typical operating systems (Sharafaldin et al., 2018). This network had an agent that
delivered normal network traffics on each computer (Sharafaldin et al., 2018). The attack
network used separate router and switch with computers that used public internet
protocols (Sharafaldin et al., 2018).
According to Sharafaldin et al. (2018), the CICFlowMeter was used to create the
CICIDS2017 dataset. The CICFlowMeter has the capability of capturing upto 80 flow-
based network traffic features (Sharafaldin et al., 2018). This tool is a flow-based
network “feature extractor” (Sharafaldin et al., 2018, p. 113). Network traffic flow
represents transmission of network traffic data packets among a source IP and port and a
destination IP and port (Lopez et al., 2019).
Studies in literature have presented the CICIDS2017 dataset as a better network
traffic dataset than the KDD, NSL-KDD, AWID, CIDDS-001, ISCXIDS2012, and
UNSW-NB15 datasets. The AWID dataset is a network traffic dataset that contains three
types of attacks (Lopez-Martin et al., 2019). These attacks have the labels of “flooding,
injection, and impersonation” (Lopez-Martin et al., 2019, p. 3). The ISCXIDS2012
dataset contains one week of network traffics flow, with the two labels of normal and
malicious (Panigrahi & Borah, 2018b).
The KDD dataset has many redundant network traffic data that cause the
classification error to increase (Jianlei et al., 2019). The NSL-KDD dataset does not
contain duplicate traffic data as the KDD dataset (Jianlei et al., 2019), and it is the newer
version of the KDD dataset (Jianlei et al., 2019). However, the UNSW-NB15 dataset is

36
advantageous over the NSL-KDD datasets, because it contains current network traffic
data (Hoang & Tran, 2019).
Abdulhammed et al. (2019) regard the CICIDS2017 dataset as the most
comprehensive dataset compared to the UNSW-NB15, AWID, and CIDDS-001 datasets.
The CICIDS2017 dataset represents distinct (unique) network traffic data in contrast to
UNSW-NB15, AWID, and CIDDS-001 datasets (Abdulhammed et al., 2019). The
CICIDS2017 dataset is also better than the ISCXIDS2012 dataset, because it has network
traffic diversity as opposed to the ISCXIDS2012 dataset (D’Hooge et al., 2019). The
significant reduction of network traffic data instances, or the elimination of important
network traffic features from the CICIDS2017 dataset can still produce real results
(D’Hooge et al., 2019).
In one study, Chiba et al. (2019) integrated the Improved Genetic Algorithm
(IGA) with the Simulated Annealing Algorithm (SAA). Chiba et al. (2019) compared the
performance of this method, using the CICIDS2017, NSL-KDD, and CIDDS-001
datasets. This method was an optimization approach to select the appropriate network
traffic features from these datasets. The investigation by Chiba et al. (2019) revealed that
this method generated the false positive rate of 0.05% using CICIDS2017 dataset
compared to the CIDDS-001 dataset with the false positive rate of 0.08% and the NSL-
KDD dataset with the false positive rate of 0.09%. In the comparison investigation
between the CICIDS2017 and NSL-KDD datasets, the results of the study, presented by
Jonghoon et al. (2019) revealed that the decision tree classifier produced better
performance using the CICIDS2017 dataset. A decision tree learning algorithm performs

37
top-down learning and analyzes data from the root to branch them into distinct subsets
(Tomáš et al., 2020). According to Tomáš et al. (2020), each node will be a validated
value. Decision tree classifiers use supervised learning approach to construct tree-based
structures to build attack detection models.
Haitao et al. (2019) introduced a deep hierarchical network with multimodal-
sequence for network attacks detection using the CICIDS2017, UNSW-NB15, and NSL-
KDD datasets. This method involved a learning model based on multi-grouped network
traffic features to identify attacks (Hiatao et al., 2019). Haitao et al. (2019) revealed that
this method generated the accuracy of 0.986% using the CICIDS2017 dataset compared
to the UNSW-NB15 dataset with the accuracy of 0.862% and the NSL-KDD dataset with
the accuracy of 0.802%. In another study, Prasad et al. (2019) introduced a Bayesian
algorithm using the CICIDS2017 to estimate the probability of network traffic data points
in identifying attacks in producing the overall false positive rate of 0.01422%.
WEKA Workbench
I used the WEKA workbench to enable the execution of DDoS attack detection
methods in detecting attacks. The WEKA workbench is one software package that
enables the execution of data mining tasks (Aksu & Doğan, 2019). This tool is an open
source software package (Verma & Ranga, 2018b) that involves the capabilities of
preprocessing, classification, clustering, association, attribute selection, and visualization
(Aksu & Doğan, 2019).
Preprocessing involves the selection and edition of a dataset (Aksu & Doğan,
2019). Some of preprocessing techniques exist in the WEKA workbench are re-sampling,

38
numeric data cleansing, normalization, data imputation, and randomization methods. Re-
sampling method randomly selects a pre-defined percentage of a network traffic dataset
for training or testing purposes. Numeric data cleansing method involves data cleaning of
network traffic data objects that have values that are either too large or too small from a
given minimum and maximum thresholds, and it sets values to a predefined default value.
Normalization method converts representative values of data objects into a specified
numeric range (Ghanem & Jantan, 2018). Data imputation method solves the problem of
missing values among network traffic data objects. This method does this by placing a
value in the missing value logical location or data space for a given network traffic
feature that is recognized with the null value. This is because a missing value represents
the null value. Imputing network traffic data is based on mean, mode, median,
distribution, statistical analysis, or a learning model among presented data.
Randomization method performs randomization of network traffic data instances.
Classification involves forecasting a value (Neto et al., 2019). This value
represents a label (Aljawarneh et al., 2019). Clustering facilitates the learnability of
object categories from a dataset (Aksu & Doğan, 2019). Association facilitates
learnability through association rules from a dataset (Aksu & Doğan, 2019). Attribute
selection involves selecting appropriate and significant properties (Aksu & Doğan, 2019).
An appropriate property is a feature that its selection is based on the increased worth
above a threshold using the filter method or increased accuracy of a learning model by
way of using the wrapper method during an attribute selection process. Visualization
provides two-dimensional graphs and facilitates the analysis of relationships among data

39
objects (Aksu & Doğan, 2019). Two-dimensional graphs are results from constructed
learning models through classification, clustering, or rules of association. The analysis of
relationships within a dataset is through visualized distribution of data objects.
The WEKA workbench is with the goal of facilitating the identification of
algorithms that are able to produce accurate learning models (Pereira et al., 2017).
According to Ali and Hamed (2018), the WEKA workbench was built based on the
assumption that every data object has attribute stability with respect to data type in being
of a particular type and data value in having data normality. Ali and Hamed (2018) state
that a dataset satisfies data normality, if the dataset represents numeric and alphabetic
values. Also, this tool involves the assumption that the number of features is fixed
(Kiranmai & Laxmi, 2018).
Naik and Samant (2016) compared the performance of five data mining tools: the
WEKA, Rapidminer, Orange, Tanagra, and Knime using Naïve Bayes, decision tree, and
K-nearest neighbor (KNN) classifiers. The results of the analysis by Naik and Samant
(2016) revealed that the WEKA obtained the highest accuracy of 99.66% using KNN
algorithm, and Knime gained the highest accuracies of 72.56% and 87.76% using Naïve
Bayes and Decision Tree respectively. Naïve Bayes is a “conditional probability model”
(Barki et al., 2016, p. 2577). This classifier determines classes, in accordance to the
probability based on the number of classes (Barki et al., 2016). KNN applies similarity
measure to classify data (Barki et al., 2016). In KNN, similarity measure represents the
distance of a data object to its most common class of K nearest neighbors (similar
datapoints), based on a distance function (Barki et al., 2016). Rapidminer represents an

40
integrated environment for “data mining, text mining, predictive analytics, and business
analytics” (Oliveira et al., 2019, p. 693). Orange is one data mining software for front-
end “explorative data analysis and visualization” (Oliveira et al., 2019, p. 693). Tanagra
is the data mining tool for explorative predicative analysis (Oliveira et al., 2019). Knime
is the data mining tool for establishing fresh and initial view for predictive data analysis
(Oliveira et al., 2019).
Surameery and Hussein (2017) used the WEKA workbench to analyze the
performance of the filtered-classifier method with decision tree classifiers. Surameery
and Hussein (2017) revealed that with the use of the filtered-classifier method, the
performance of decision tree classifiers was improved compared to only the application
of decision tree classifiers. The filtered-classifier method has the capability to integrate
data preprocessing procedures with machine learning algorithms. A decision tree
involves branchings examples from a root into subsets (Tomáš et al., 2020).
DMZ
I used the CRISP-DM framework in this study. The CRISP-DM facilitates
organizations to prevent the occurrence of major issues through incorporating DDoS
attack detection methods to protect their systems against service interruptions caused by
DDoS attacks. This framework involves having the objective of moving discoveries of
data mining projects to routine tasks of organizations (Jenke, 2018). As the result, this
framework facilitates deploying DDoS attack detection methods in organizations. This
framework enables organizations to solve major issues through incorporating knowledge
discovery methods (Moslehi et al., 2018). Major issues may be financial damages, asset

41
loss, identity theft, and others as the consequence of these attacks. DDoS attack detection
methods are knowledge discovery methods in detecting DDoS attacks. This literature
review explains the relevancy of DMZ, based on the recommendation of placing DDoS
attack detection methods outside of this area that I provided under the significance of the
study section of this paper.
A DMZ area is a network that acts as an intermediator among external and
internal networks (Chard et al., 2018). DMZ networks avert security vulnerabilities
(Alvarez et al., 2021). However, the promotion of cyber security is challenging for DMZ
networks that involve permitting external networks to communicate with internal
networks of organizations (Murakami, 2019). The Internet poses major security concerns
for organizations. One security concern is the occurrence of network intrusions (Alvarez
et al., 2021). Network intrusions lead to service interruptions, data loss, violation of
security protocols, and many other (Alvarez et al., 2021). To obtain a best network
security posture, there is a need for constant detection and identification of network
security violations (Bopche & Mehtre, 2017). Intrusion detection systems are powerful
and successful tools to attain high level of security (Bostani & Sheikhan, 2017). DDoS
attack detection methods are intrusion detection systems that, as the result, will be
effective in achieving high security level.
The objective of DMZ networks is to provide a path that is clean between
computing resources of external and internal networks (Chard et al., 2018). A clean path
refers to provision of safe network communication connections among external and
internal networks. As DDoS attacks may pose major challenges to organizations from the

42
Internet, DDoS attack detection methods facilitate the detection of these attacks in
providing the opportunity for DMZ networks to achieve the objective of providing a
clean path. For this reason, placement of DDoS attack detection methods outside of DMZ
networks will help organizations to detect DDoS attacks directly from external networks
and the Internet. DMZ networks contain firewalls to provide security. A firewall acts as a
filter to administer the transmission of network traffics from one network to another
(Alvarez et al., 2021). Incorporation of DDoS attack detection methods outside of a DMZ
area facilitates in alerting a designated firewall that is connected directly to the Internet of
detected attacks by these methods. Subsequently, the firewall prevents the attacks. Based
on Miloslavskaya (2018), this area involves having the goal of providing the opportunity
to incorporate knowledge discovery methods for detecting attacks and to reduce systems’
exposures to unwanted network traffic events.
Likewise, deploying DDoS attack detection methods outside of DMZ areas to
detect DDoS attacks may lead organizations to take timely supervision to protect their
systems from service interruptions caused by these attacks. DMZ networks involve
providing intermediary security level (Alvarez et al., 2021). According to Miloslavskaya
(2018), if for any reason, attacks were successful in penetrating organizational networks,
a DMZ area increases faster response and recovery of organizational resources. As the
result, security administrators are able to harden networks and systems against DDoS
attacks.

43
Application to the Applied IT Problem
Purpose and Hypotheses of the Study
The purpose of this quantitative study was to examine whether adding the filter
and wrapper methods prior to the clustering method is effective in terms of lowering false
positive rates of DDoS attack detection methods. I identified one null hypothesis and one
alternative hypothesis in this study. The null hypothesis was that adding the filter and
wrapper methods prior to the clustering method is not effective in terms of lowering false
positive rates of DDoS attack detection methods. The alternative hypothesis was that
adding the filter and wrapper methods prior to the clustering method is effective in terms
of lowering false positive rates of DDoS attack detection methods.
CRISP-DM Framework
I used the CRISP-DM framework to evaluate the performance of DDoS attack
detection methods and their incorporation within organizational settings. The CRISP-DM
framework has six phases: “business understanding, data understanding, data preparation,
modeling, evaluation, and deployment” (Nguyen et al., 2019, p. 80). This framework
involves the assumption that knowledge discovery is the consequence of a process
(Michalak & Gulak-Lipka, 2017), and it arranges a planned approach for data mining
tasks (Moslehi et al., 2018). The life cycle of the process contains these six phases
(Michalak & Gulak-Lipka, 2017). It is the most utilized methodology for data mining
tasks (Yudith et al., 2018) that involves ensuring generality and reliability (Kebede et al.,
2017). Data mining represents a knowledge discovery process for enabling analysis of
voluminous data and the discovery of patterns (Neto et al., 2017). The achievement of

44
particular objectives and support of decision makings in organizations will be ensured
using this framework (Groggert et al., 2018).
One disadvantage of the CRISP-DM framework is that it does not have a data
acquisition phase (Wiemer et al., 2019). This framework will facilitate addressing
knowledge discovery process surrounding existing data (Wiemer et al., 2019). Since
Sharafaldin et al. (2018) already generated the CICIDS2017 dataset, this was not an issue
for this study. This framework involves providing a process model that signifies the life
cycle of each data mining task (Moslehi et al., 2018).
Business Understanding. In this phase of business understanding of the CRISP-
DM, I analyzed the IT problem with respect to high false positive rates of DDoS attack
detection methods. Based on Castro et al. (2019), understanding the business is to
understand a domain problem. This phase of the CRISP-DM involves a domain problem
that organizations have. It encompasses providing the opportunity for high level analysis
of a problem (Castro et al., 2019) and specifies objectives to examine data (Michalak &
Gulak-Lipka, 2017).
DDoS attack detection methods based on the clustering method produce high
false positive rates. A problem of DDoS attack detection methods based on the clustering
method is the curse of dimensionality. When unsupervised DDoS attack detection
methods assess a high dimensional network traffic data set, distance between data points
leads to being inconsequential (Idhammad et al., 2018b). This leads the computation of
the learning processes of these DDoS attack detection method to cause the generation of
equal feature weights known as the curse of dimensionality (Idhammad et al., 2018b).

45
The curse of dimensionality lowers the performance of DDoS attack detection methods
based on the clustering method to distinguish between attacks and legitimate network
traffic requests. The clustering method is not effective in analyzing data sets with lots of
dimensions (Yuanjie et al., 2020). Classifying high dimensional data for the clustering
method is a problem (Rathore et al., 2019). Many properties in high dimensional data
would be redundant (Yanfang et al., 2020). The calculation of the learning process of a
DDoS attack detection method based on the clustering method generates equal feature
weights among clusters using a high dimensional network traffic data set. Redundant
properties lead to the curse of dimensionality (Salimi et al., 2018).
Redundant properties do not provide useful information (Azhar et al., 2019).
Dimensionality reduction is necessary for the clustering method (Mohamed, 2020). It
removes redundant properties (Henni et al., 2020), and it can improve accuracy (Manbari
et al., 2019). Dimensionality reduction enables the elimination of inappropriate features
(Visalakshi & Radha, 2017). This may increase the performance of learning algorithms
(Xiaojuan et al., 2018). Redundant properties are inappropriate features. The filter and
wrapper methods administer dimensionality reduction to remove redundant features. I
added the filter and wrapper methods prior to the clustering method to perform these
dimensionality reduction processes to prevent the generation of equal feature weights
among clusters. The objective was to examine whether adding the filter and wrapper
methods preceded by the clustering method is effective in terms of lowering false
positive rates of DDoS attack detection methods.

46
Data Understanding. This phase of data understanding of the CRISP-DM
involves describing data (Michalak & Gulak-Lipka, 2017). This phase provides the
opportunity for explaining criteria in selecting data (Castro et al., 2019) and facilitates
familiarization of data (Moslehi et al., 2018). Criteria will signify the confirmation of
data quality (Michalak & Gulak-Lipka, 2017).
I used the CICIDS2017 dataset and disregarded the KDD, NSL-KDD, AWID,
CIDDS-001, ISCXIDS2012, and UNSW-NB15 datasets. The KDD dataset contains
duplicate network traffic data that affect machine learning algorithms (Protić, 2018). This
leads bias in the direction of duplicate network traffic data in increasing the classification
error. Duplicate records are redundant. Redundant network traffic data in the KDD
dataset will increase the classification error (Jianlei et al., 2019). This dataset does not
have realistic network traffic data (Protić, 2018). In contrast, the NSL-KDD dataset does
not contain duplicate network traffic data as the KDD dataset (Jianlei et al., 2019).
Eliminated duplicate records causes machine learning algorithms to produce unbiased
results (Protić, 2018). But compared to the NSL-KDD, the UNSW-NB15 has realistic
network traffic data (Hoang & Tran, 2019).
Nevertheless, Abdulhammed et al. (2019) regard the CICIDS2017 dataset as the
most comprehensive dataset in contrast to the UNSW-NB15, AWID, and CIDDS-001
datasets. The CICIDS2017 dataset has realistic network traffic data (Abdulhammed et al.,
2019). Similarly, this dataset contains unique network traffic data as opposed to the
UNSW-NB15, AWID, and CIDDS-001 datasets (Abdulhammed et al., 2019). The
CICIDS2017 dataset is also better than the ISCXIDS2012 dataset. The CICIDS2017

47
dataset has network traffic diversity as opposed to the ISCXIDS2012 dataset (D’Hooge et
al., 2019). The major reduction of network traffic data instances, or the removal of
essential network traffic properties from the CICIDS2017 dataset may still have realistic
outcomes (D’Hooge et al., 2019).
In the CICIDS2017 dataset, benign network traffic data instances represent the
contents of regular human activities (Chiba et al., 2019). The capture of benign traffic
data packets was on Monday of July 3rd, 2017 and the capture of DDoS attack traffic data
was on Friday of July 7th, 2017 (Chiba et al., 2019). The total number of network traffic
data instances in the CICIDS2017 dataset is 225,745. It has 128,027 DDoS attacks data
instances and 97,718 benign data instances. This dataset contains the capture of flow-
based network traffic data. Sharafaldin et al. (2018) used the CICFlowMeter to enable the
capture of 80 flow-based network traffic attributes. Flow-based network traffic attributes
are the captures of network traffic flow. Network traffic flow transmits network traffic
data packets from a source IP and port of a system to a destination IP and port of another
system (Lopez et al., 2019).
The CICIDS2017 dataset contains 84 attributes. The 84th attribute is the class or
label. Based on Chiba et al. (2019), the eligibility criteria of the CICIDS2017 dataset are
the anonymity, complete capture, complete interaction, complete network configuration,
available protocols, complete traffic, feature set, metadata, heterogeneity, and labeling.
These 10 criteria represent this dataset that contains benign and DDoS attack network
traffic data as realistic and authentic. The capture of network traffic data in this dataset

48
was based on “real world criteria” (Prasad, et al., 2019, p. 3). The CICIDS2017 dataset
satisfies these criteria (Binbusayyis & Vaiyapuri, 2019).
The anonymity criterion refers to the concealment of contents of network traffic
data. For satisfying the anonymity criterion, Sharafaldin et al. (2018) used statistical
metrics of “minimum, maximum, mean, and standard deviation” (Abdulhammed et al.,
2019, 5) to conceal contents of network traffics into a series of attributes (Abdulhammed
et al., 2019). The complete capture criterion refers to utilization of a mirror port for
capturing and recording all network traffic data in a server (Sharafaldin et al., 2018).
With respect to the creation of the CICIDS2017 dataset, mirror ports would be able to
capture and transmit network traffic data from the source port of either an attack system
or a victim system to the destination port of the either of these systems. The complete
interaction criterion is the coverage of within and among local area networks (LAN), by
having two dissimilar networks and internet connectivity among these networks
(Sharafaldin et al., 2018). The complete network configuration criterion is the
incorporation of a complete network infrastructure, comprising equipments such as
“modem, firewall, switches, routers, and presence of variety operating systems such as
Windows, Ubuntu, and Macintosh” (Sharafaldin et al., 2018, p. 114). The network
represented a “testbed infrastructure” (Sharafaldin et al., 2018, p. 110). This
infrastructure involved two distinct networks of attack network and victim network to
cover all of these mentioned equipments (Sharafaldin et al., 2018).
Likewise, the collection of network traffic data for the CICIDS2017 dataset was
through utilization of common protocols (Chiba et al., 2019). This involved satisfying the

49
available protocols criterion. In this case, the creation of the CICIDS2017 dataset was
through the use of protocols such as “HTTP, HTTPS, FTP, SSH, and email protocols”
(Sharafaldin et al., 2018, p. 114). Common protocols are protocols that organizations
generally use to facilitate communication through organizational networks. The complete
traffic criterion represents the inclusion of a user profile and 12 computers in the victim
network, and having attacks to come from the attack network (Sharafaldin et al., 2018). A
benign profile system involved providing the user profile of abstract human activities in
the victim network to simulate normal network traffic transmission among systems
(Sharafaldin et al., 2018). The benign profile system could retrieve the profile of 25 users
using the mentioned protocols (Sharafaldin et al., 2018).
The feature set criterion refers to the ability of extracting more than 80 features,
and the presentation of the produced dataset as a CSV file (Sharafaldin et al., 2018). The
metadata criterion is the detailed explanations of the dataset such as timings, list of
network traffic records, and memory dump process (Sharafaldin et al., 2018). In this case,
a memory dump process has the ability to store the contents of a memory, in the event of
a system crash as the result of DDoS attacks. The heterogeneity criterion is the capture of
all network traffics from victim systems during attacks using the memory dump process,
main switch, and system calls (Sharafaldin et al., 2018). In the case of the main switch,
based on Sharafaldin et al. (2018), this device could centralize communication among
victim systems and attack systems. Capabilities of system calls in this scenario was to
provide interfaces among a process and an operating system of victim systems and attack
systems to facilitate the capture of network traffics. According to Andreatos and Moussas

50
(2019), this dataset contains true capture of data. With respect to the labeling criterion,
the CICIDS2017 dataset, containing DDoS attacks and benign network traffic data
instances, contains fully labelled data.
Preparing the Data. This phase of the CRISP-DM involves establishing a “data
cleaning process” (Michalak & Gulak-Lipka, 2017, p. 66). This phase facilitates
organization and repair of data (Castro et al., 2019) and involves preparing data for the
next phase (Cerón et al., 2018). Data cleaning is the process of correcting or eliminating
incorrect data (Manimekalai & Kavitha, 2018), and likewise, it encompasses correcting
missing values (Manimekalai & Kavitha, 2018). Data cleaning prevents inappropriate
generation of patterns (Manimekalai & Kavitha, 2018).
The first problem of the CICIDS2017 dataset is that it has 6 features that are not
suitable for DDoS attack detection models in detecting attacks. Chongzhen et al. (2021)
stated 5 of these features which are Flow ID, Source IP, Source Port, Destination IP, and
Time stamp. These features impact the capability of machine learning algorithms to
construct models for generalization (Chongzhen et al., 2021). They cause learning models
to be constructed with respect to a particular dataset (Chongzhen et al., 2021). The
Destination Port attribute is another similar one based on Chongzhen et al. (2021) that
stated the Source Port. D’ Hooge et al. (2019) make remark on the Flow ID, Source IP,
Source Port, Destination IP, and Destination Port in being redundant. Features have the
capability to impact learnability of machine learning algorithms (Lamba et al., 2018).
Therefore, I removed these 6 attributes.

51
The second problem of the CICIDS2017 dataset is that the dataset does not
include normalized attribute values. Some attributes are in a wide interval between the
maximum and minimum values considering network traffic data of the CICIDS2017
dataset (Chongzhen et al., 2021). These attributes will not be proper for processing
(Chongzhen et al., 2021). However, normalization requires numeric data cleansing
process for values of attributes that are too far away from a specified range.
Normalization has susceptibility to outliers (Xi et al., 2016). Consequently, I applied the
NumericCleaner procedure before normalization.
The NumericCleaner procedure involves applying data cleaning on network
traffic attributes that have values that are either too large or too small from given
minimum and maximum thresholds, and it sets the values to a predefined default value.
The minimum threshold of the NumericCleaner procedure is -1.7976931348623157E308,
and the maximum threshold of this procedure is 1.7976931348623157E308. The
minimum default value of the NumericCleaner is -1.7976931348623157E308, and the
maximum default value of this procedure is 1.7976931348623157E308. These values are
the default values in the NumericCleaner procedure. The WEKA workbench provides the
settings for extracting meaningful information (Kiranmai & Laxmi, 2018). This tool
creates the opportunity to evaluate machine learning algorithms (Ali & Hamed, 2018).
Extracting meaningful information in data mining projects is by using data analysis tools
with capabilities based on probability and statistical measures (Kiranmai & Laxmi,
2018). As the result, these tools have statistical reliabilities.

52
I used the NumericCleaner procedure for the following reasons. Without
normalization, machine learning algorithms cannot process network traffic data properly.
Normalization enables machine learning algorithms to process data correctly (Chiba et
al., 2019). There would be computational and comparison complications for machine
learning algorithms, if data is not normalized (Pandey & Jain, 2017). However, when
unobserved data is out of the range of observed data, the scaled values will be outside of
the interval of [0, 1], which causes normalization method to create issues for applications
(Xi et al., 2016). Thus, normalization method will require numeric data cleansing.
Unobserved network traffic data are not measurable as opposed to observed network
traffic data.
Subsequently, I normalized network traffic data of the CICIDS2017 dataset.
Normalization supports preservation of associations that exist between original data
values (Folorunso et al., 2018). This approach is the most significant step during data
preparation (Ramasamy & Kandhasamy, 2018). It guarantees that data is comparable
(Eesa & Arabo, 2017). The min-max and z-Score algorithms are two procedures of
normalization method. The min-max algorithm subtracts the current value of a feature by
a given minimum value (Chiba et al., 2019). This algorithm divides the resulting value by
the difference that exists among maximum and minimum values (Chiba et al., 2019). The
z-Score algorithm normalizes network traffic attributes based on standard deviation and
the average score of network traffic feature vectors.
I used the min-max algorithm. This algorithm produces accurate results with
respect to time and classification performance (Chiba et al., 2019). This algorithm scales

53
data within the interval of [0, 1] (Jain et al., 2018). The initial feature values fall within
the range of minimum and maximum values (Pandey & Jain, 2017).
I did not use the z-Score algorithm. The z-scores that are produced by the z-Score
algorithm are within unbounded range (Pandey & Jain, 2017). This algorithm does not
place values within the same scale all the time (Kanagaraj et al., 2020). It uses mean and
standard deviation to normalize data values (Cakir & Konakoglu, 2019). Therefore, this
algorithm is suitable for data sets that represent data objects with an uninterrupted order.
It will normalize data to follow its original data pattern (Bui & Duong, 2016). Based on
Bui and Duong (2016), original data patterns should have uninterrupted orders. Therefore
the z-Score algorithm is not suitable for network traffic datasets. Network traffic datasets
do not follow time series data patterns that have uninterrupted orders.
The third problem is that the CICIDS2017 dataset has one attribute, named Flow
Bytes, that misses values in four places or within four data instances. The Flow Bytes
attribute represents the number of bytes in every second in network traffic flow (Lopez et
al., 2019). The problem of missing values means that data points cannot facilitate the
provision of information to enable learning models to categorize data points. The
information will represent distance among data points. Machine leaning algorithms do
not accept null values (Abdulraheem & Ibraheem, 2019). Missing values are null values,
and they signify invalid data.
The expectation and maximization (EM) and mean algorithms are two procedures
in imputing or correcting missing data. The EM algorithm is an iterative process (Kalkan
et al., 2018). Initially, this algorithm imputes first missing value approximations via its

54
“regression model” (Kalkan et al., 2018, p. 405), comprising a random error (Kalkan et
al., 2018). Afterward, it iterates between two steps. During the first step in the iteration,
this algorithm calculates the “covariance matrix” (Kalkan et al., 2018, p. 405) with some
series of average scores (Kalkan et al., 2018). The covariance matrix generalizes the
variance among two network traffic data points to several dimensions. In the second step,
the EM algorithm uses the covariance matrix and average scores to calculate missing
values in the subsequent regression model (Kalkan et al., 2018). The first step is “E”
(Kalkan et al., 2018, p. 405), which is the expectation, and the second step is “M”
(Kalkan et al., 2018, p. 405), which is the maximization (Kalkan et al., 2018). According
to Kalkan et al. (2018), the algorithm uses the last imputed values for replacing missing
values. The mean algorithm replaces missing values with average, median, or mode
(Jadhav et al., 2019).
I used the EM algorithm and disregarded the use of the mean algorithm. The EM
algorithm repeats the E and M steps, until it achieves minimum values (Kalkan et al.,
2018). As the consequence, the produced values will be near to the actual values of data
points in contrast to middle or average values that are produced by the mean algorithm.
The EM algorithm is widely used to address missing data (Armanuos et al., 2020). It is a
well-established algorithm (Malan et al., 2020).
The fourth problem is that the CICIDS2017 is unbalanced, as it has 128,027
DDoS attack data instances and 97,718 BENIGN data instances. The CICIDS2017
dataset is prone to class disproportion (Panigrahi & Borah, 2018a). The unbalanced data
leads to construction of inaccurate (biased) models that favor DDoS attack data instances

55
than benign data instances. Uneven data causes machine learning algorithm to prefer to
learn from large network traffic data instances for detecting attacks (Abdulraheem &
Ibraheem, 2019). With respect to this study, biased models generate a higher accuracy
toward DDoS attack data instances to detect attacks. This may lead to the
misrepresentation of analysis by the 10-fold cross validation method. This method will
randomly partition the CICIDS2017 dataset into 10 equal partitions for evaluation. The
spreadsubsample and synthetic minority over-sampling techniques (SMOTE) are two
procedures that correct unbalanced data. The spreadsubsample procedure is of the type of
the random under sampling (RUS) method. The RUS method reduces network traffic
data instances from the majority class. The SMOTE procedure is of the type of the
random over sampling (ROS) method. It increases network traffic data instances of the
minority class (Salunkhe & Mali, 2018). A majority class contains more data instances
than a minority class.
I used the spreadsubsample procedure. This procedure reduces data instances
from the majority class (Fotouhi et al., 2019). The spreadsubsample procedure balances
network traffic data instances until they present equal sets based on labels. It uses
distribution spread value of 1 to balance the data. The balanced data instances enhance
the performance of learning algorithms (Salunkhe & Mali, 2018). The RUS method is the
most effective method (Viloria et al., 2020). In this study, the majority class represented
the DDoS label, and the minority class represented the BENIGN label. This is because
the CICIDS2017 dataset contains 128,027 data instances for the DDoS label and 97,718
data instances for the BENIGN label.

56
I did not use the SMOTE procedure. It synthetically produces data instances
(Salunkhe & Mali, 2018). Synthetic data instances represent unrealistic data. The
SMOTE procedure leads bias in the direction of the minority class (Elreedy & Atiya,
2019). This procedure duplicates data instances that belong to the minority class (Eko et
al., 2019). The SMOTE procedure is not effective for analysis of high dimensional data
(Elreedy & Atiya, 2019), and it has difficulty to divide between positive and negative
classes (Wenjie, 2019). In this study, DDoS attack detection methods performed the
analysis of network traffic data, using the CICIDS2017 dataset. The positive class
represented the DDoS label and the negative class represented the BENIGN label.
The fifth problem of the CICIDS2017 dataset is that the dataset has DDoS attack
data instances alongside each other and benign data instances alongside each other. This
may cause the 10-fold cross validation method that this study considered to produce
biased results. The 10-fold cross validation method calculates the prediction error known
as error rate (Rooij & Weeda, 2020). Prediction is sensitive to the balance of network
traffic data instances in each fold. The data that is not even will lead learning algorithms
to have inclination in learning from large network traffic data instances in attacks
recognition (Abdulraheem & Ibraheem, 2019). Some partitions (folds) might hold more
network traffic data instances of a label than another in having learning models to favor
them, and consequently, resulting to inaccurate outcomes. Therefore, I used the
Randomize procedure to perform the randomization of data instances within the
CICIDS2017 dataset. The 10-fold cross validation method treats every fold as a
validation set (Gayathri et al., 2020). Each fold that the 10-fold cross validation method

57
produces must be representative of the whole dataset (Aksu & Doğan, 2019). The 10-fold
cross validation method produces lower error rates for folds that contain more of data
instances of a class. The training set and testing set treated by the 10-fold cross validation
method should include most of the classes that features hold (Anjum & Qaseem, 2019).
Modeling. This phase is about selecting and incorporating various methods to
enable knowledge discovery for machine learning tasks (Moslehi et al., 2018). In this
phase, the goal for selecting various methods will be to enhance results (Cerón et al.,
2018). This phase involves applying the chosen or proposed methods to analyze data
(Michalak & Gulak-Lipka, 2017, p. 66).
I used the filtered-classifier method to construct DDoS attack detection methods.
The filtered-classifier method produces better accuracy in prediction with respect to time
(Surameery & Hussein, 2017). This method involves performing supervised learning.
DDoS attack detection methods based on supervised learning algorithms are dependent
upon classified network traffic data (Idhammad et al., 2018b). Supervised learning
algorithms are appropriate for classification (Uddin et al., 2019). Classification increases
predictability due to labelled network traffic data objects. These algorithms are trained on
data instances that are labelled in a data set to construct a prediction (classification)
model (Uddin et al., 2019). Subsequently, the prediction model uses an unlabeled test
data to categorize the data instances into similar groups (Uddin et al., 2019).
A problem of DDoS attack detection methods based on the clustering method is
the curse of dimensionality. According to Idhammad et al. (2018b), the curse of
dimensionality lowers the effectiveness of unsupervised DDoS attack detection methods

58
to properly identify attacks. In high dimensional network traffic data that have lots of
dimensions, distance among data points leads to being inconsequential (Idhammad et al.,
2018b). Because of this, the calculation of the learning process of a DDoS attack
detection method that is unsupervised produces homogenized feature weights known as
the curse of dimensionality (Idhammad et al., 2018b). Redundancy of data properties
results in the curse of dimensionality (Salimi et al., 2018). Therefore, I added the filter
and wrapper methods preceded by the clustering method to reduce network traffic
features to prevent the generation of equal feature weights among clusters. Two
clustering algorithms were considered: the SOM and k-means. Two filter method
algorithms were considered: the chi-squared and information gain. The wrapper method
involved incorporating the two classifiers of J48 and Naïve Bayes.
The clustering method is a prominent unsupervised learning (Yonghao et al.,
2019). As the result this method may be known as the most used unsupervised approach
for detecting DDoS attacks. It involves performing a cluster analysis which examines
data objects to realize their object categories (Moslehi et al., 2018). Similarity-based
cluster analysis and distance-based cluster analysis are the two types of the cluster
analyses to generate clusters for categorization of network traffic data points. Similarity-
based cluster analysis maximizes intra-class similarities and minimizes inter-class
similarities among data points (Anjum & Qaseem, 2019). It involves performing the
analysis of distribution patterns of data points among clusters (Anjum & Qaseem, 2019).
The SOM algorithm is a procedure of the clustering method that performs similarity-
based cluster analysis of network traffic data. Distance-based cluster analysis maximizes

59
intra-cluster distances and minimizes inter-cluster distances among data points. The k-
means algorithm is a procedure of the clustering method that performs distance-based
cluster analysis of network traffic data. Both SOM and k-means algorithms use the
Euclidean distance to perform similarity-based and distance-based cluster analyses
respectively. The Euclidean distance computes the square root of the variation that exists
among network traffic data points in the dimensional feature space (Faizah et al., 2020).
I used the SOM agorithm. The SOM algorithm is one common procedure of the
clustering method (Kuo et al., 2018). This algorithm can handle large data (Eslami et al.,
2017), and it is able to cluster data points with no previous knowledge of data input
clusters (Verma & Ranga, 2018a). The SOM algorithm is able to facilitate the recognition
of clusters with data points using greater properties (Jha et al., 2017).
This algorithm involves the unsupervised implementation of the ANN algorithm
(Ghadiri & Mazlumi, 2020). It maps multidimensional data (Youngjin, 2019), and
generates a low dimensional grid from a high dimensional data (Ghadiri & Mazlumi,
2020). This algorithm forms topological orders of neurons in the dimensional feature
space. Distinct representation of a feature (input) vector is able to preserve the topology
of an input space (Khalifa et al., 2019). An input vector represents a series of data points
in a dimensional feature space. Greater properties are features that are able to increase
proper categorization of a network traffic data set by the clustering method. The SOM
algorithm initializes the neuron weights (Kamath & Choppella, 2017). Subsequently,
according to Kamath and Choppella (2017), this algorithm involves 3 phases of the
competition, cooperation, and adaptive. During the competition phase, neurons compete

60
according to the distance among a neuron weight and the respective input vector (Kamath
& Choppella, 2017). During the cooperation phase the winning neurons compute the
most optimal position in the neighboring topology (Kamath & Choppella, 2017). Finally,
during the adaptive phase, the algorithm updates the selected neuron’s weight and the
neighboring neurons (Kamath & Choppella, 2017). According to Hongrui et al. (2017),
the iteration will occur through these phases with respect to each input vector selected by
the SOM algorithm.
The SOM algorithm initializes weights by selecting random data values in a
dimensional feature space (Kamath & Choppella, 2017). This algorithm picks the random
values from randomly selected network traffic data instances to initialize weights.
Subsequently, in the competition phase of the SOM algorithm, the neurons compute their
“discriminant values” (Kamath & Choppella, 2017, p. 115), using a discriminant
function, in which according to Kamath and Choppella (2017), the winning neuron has
the smallest discriminant value, and the discriminant function is based on the Euclidean
distance function. According to Quang-Van et al. (2021), the winning neuron has the
closest distance to a randomly selected input vector by the SOM algorithm known as best
matching unit (BMU). Based on Kamath and Choppella (2017), the discriminant function
is below, where d is a discriminant value at the position of j in a given feature vector, x is
a data point at the position of i, w is the weight of a neuron at the lattice position of (j, i),
and n is the number of iterations. This step is the intra-class analysis. It represents the
distance of data points among classes.

61
In the cooperation phase, the winning neurons calculate their logical locations
(Kamath & Choppella, 2017) or their best positions in their neural network topology
(Kamath & Choppella, 2017). The positions are based on distance among data points.
Based on Kamath and Choppella (2017), the presentation of the formula (topological
neighborhood function) is shown below, where I(x) is the winning neuron at the lattice
position, and S in the numerator of the exponent function represents the distance. Based
on Kamath and Choppella (2017), the denominator within the exponent function
represents the neighborhood size at a given t iteration number. This formula or step
involves performing the inter-class analysis. It represents the distance of data points
within classes. According to Hongrui et al. (2017), the neighborhood size similar to the
winning neuron becomes close to an input vector selected by the SOM algorithm.
Based on Kamath and Choppella (2017), the SOM algorithm uses an exponential
decay function that decreases a given neighborhood size (distance) through iterations.
Eventually, a BMU search through applying the Euclidean distance may cause in an
improper identification of a winning neuron (Quang-Van et al., 2021). Kamath and
Choppella (2017) demonstrate the formula of the exponential decay function as follows.

62
Based on Natita et al. (2016), σₒ is the initial learning rate, t is the iteration number, and τₒ
is the number of iterations.
The adaptive phase is the “learning process” (Akinduko et al., 2016, p. 214).
According to Kamath and Choppella (2017), during this phase, the winning neurons
decrease their discriminant values considering neighboring neurons, and their topological
weights. Afterward, the SOM algorithm updates the weight of winning neuron, and its
neighboring neurons (Kamath & Choppella, 2017). The formula (weight function) for the
adaptive phase is below, where t is the learning rate similar to exponential decay function
(Kamath & Choppella, 2017). In this case, the winning neuron and its neighboring
neurons incline (learn) to modify their weights in the direction of input patterns
(Akinduko et al., 2016). This step enables the preservation of the topology that the
algorithm produces (Akinduko et al., 2016). Kamath and Choppella (2017) present the
formula as follows.
On the other hand, the k-means algorithm divides network traffic data instances
into k clusters, where k is the number of clusters. The k-means algorithm assigns network
traffic data points with the nearest average of a cluster to that cluster. I used the k-means
algorithm for the following reasons. It is a popular algorithm (Alguliyev et al., 2019), can
handle large data (Sangve & Kulkarni, 2017,), and is simple (Chunyong et al., 2017).

63
The k-means algorithm starts to initialize cluster centroids (Sangve & Kulkarni,
2017) randomly (Hailun et al., 2019). This algorithm does the centroids initialization
through random selection of data points of k randomly chosen network traffic data
instances in a dimensional feature space. Afterward, the iteration happens in two steps
(Sangve & Kulkarni, 2017). Based on Mehrotra et al. (2017), this algorithm tries to
assign data points to nearest clusters. The first step conducts intra-cluster analysis. The
second step conducts inter-cluster analysis. According to Kamath and Choppella (2017),
the formula for the intra-cluster analysis is given below, where k is the number of cluster
centroids, x is an input feature (data point) at the position of j, and average(x) is the
average of the entire feature vector. This formula represents between-cluster analysis that
computes distance of data points between clusters. According to Sangve and Kulkarni
(2017), this is cluster assignment.
Based on Sangve and Kulkarni (2017), the formula for the inter-cluster analysis is
below, where c is the number of data points within a cluster, x is an input feature at the
position of i, and average(c) is the average of centroids within a cluster, given the
respective iteration. This formula represents within-cluster (inter-cluster) analysis. This
algorithm calculates the centroid value of each respective cluster, and subsequently, it
updates the same value through iterations, after re-association of every data point to the
centroid of the current cluster (Mehrotra et al., 2017). According to Sangve and Kulkarni

64
(2017), this is centroid shift. This algorithm adjusts the centroid of the current cluster to
the average that is obtained from the analysis within the cluster (Sangve & Kulkarni,
2017).
Based on Sangve and Kulkarni (2017), the learning process of the k-means
algorithm is shown below. The k-means algorithm conducts the cluster assignment and
centroid shift through iterations until no change occurs in the current cluster (Sangve &
Kulkarni, 2017). According to Mehrotra et al. (2017), if we have two categories, and the
centroids of the two groups are closest to data points within respective categories, no
more change will happen.
To address the curse of dimensionality of the clustering method, I added the filter
and wrapper methods prior to the clustering method in preventing generation of equal
feature weights between categories for normal and DDoS attack traffic data to identify
effective DDoS attack detection methods. The filter method selects data properties
without incorporating machine learning algorithms (Moran & Gordon, 2019) and has
simplicity (Pragadeesh et al., 2019). It provides a subset of data properties that is
independent of learning models (Moran & Gordon, 2019). The chi-squared and
information gain are algorithms that the filter method uses to produce the worth of a data
property.

65
I used the chi-squared algorithm for the following reasons. This algorithm enables
the filter method to find significant features during training (Divyasree & Shely, 2018).
The chi-squared algorithm measures the predictive power between a feature and a label
(Spencer et al., 2020). This algorithm allows the filter method to realize the dependence
between the two attributes (Moran & Gordon, 2019). The filter method is able to extract
useful features by incorporating the chi-squared algorithm, and it enables machine
learning algorithms to classify data instances properly (Rehman et al., 2019).
The chi-squared algorithm computes data deviation from the expected distribution
(Corrales et al., 2018). It produces the predictive power of a data property according to a
label (Corrales et al., 2018). The lower is the predictive power of a given data property,
the higher is the independency of the property to that label. The filter method removes
independent data properties (Corrales et al., 2018). If some data properties have
predictive powers less than a given threshold in the ranker search method, the filter
method considers them independent. The removal of data properties is based on a
predetermined threshold in the ranker search method. The filter method uses the ranker
search method to remove independent network traffic data below a given threshold.
Based on Ikram and Cherukuri (2017), the formula for the chi-squared algorithm is
presented below. If t is an attribute, and c is a label; then, A is the number of t occurrence
with c, B is the number of t occurrence without c, C is the number of c occurrence
without t, D is the number of times that c and t do not occur, and N represents the total
data instances (Ikram & Cherukuri, 2017). The resulting value is a chi-squared score
determining the worth of a feature.

66
The information gain algorithm evaluates data properties according to a label and
assesses their importance (Ahmad et al., 2019). I used the information gain algorithm for
the following justifications. The information gain algorithm is the most used algorithm to
enable feature selection (Ahmad et al., 2019). It is simple and quicker compared to other
approaches (Salo et al., 2018). This algorithm is based on the entropy, a well-established
concept in the dominion of the information theory (Siddique et al., 2017). An entropy is
the measure of uncertainty of a random data object (Yonghao et al., 2019).
The information gain algorithm enables the filter method to choose features
according to classes (Ahmad et al., 2019, p). This algorithm is about expressing
relevancy between an attribute and its type (Tunç, 2019). The relevancy of each feature is
based on information gain ratio. The higher, the information gain ratio of a given feature,
the higher is the relevancy of the feature to the respective class. The removal of data
properties is based on a predetermined threshold in the ranker search method. The filter
method uses the ranker search method to remove least data properties below a given
threshold. The calculation of information gain ratio is dependent upon the entropy of the
class. According to Ahmad et al. (2019), the presentation of information gain algorithm is
shown below, where n is the number of classes, and pi is the probability of selecting a
data point from the class of position.

67
The filter method that incorporates either the chi-squared or information gain
algorithm uses the ranker search method to remove features below a predefined
threshold. A threshold in the ranker search method is between the range of [0, 1]. I used
the value of 0.5 as the threshold for the ranker search method for the following reasons.
DDoS attacks network traffic data have a dynamic nature (Khalaf et al., 2019). Therefore
network traffic features are not informative. Selecting network traffic features from a
high dimensional data set is difficult (Manbari et al., 2019). The filter method should
select features with a proper threshold in the ranker search method. Feature selection
methods have the objective of reducing data dimensions from a high dimensional data set
(Henni et al., 2020). Informative features have high (above the chosen threshold)
predictive powers to a categorization label. A predictive power is the worth or importance
of a network traffic feature with respect to a label. The value of 0.5 is the middle value of
the range of [0, 1] for the ranker search method. As the result, I considered values above
0.5 to be high predictive powers, and any value below 0.5 to be a low predictive power.
The wrapper method depends on a learning model to evaluate network traffic
properties. This method uses the accuracy of a learning model (Shu et al., 2020). It
attempts to make improvement of the performance of a selected classifier (Visalakshi &
Radha, 2017), and it predicts data properties (Jadhav et al., 2018). The accuracy of that
classifier determines a subset of data properties.
The J48 and Naïve Bayes classifiers are machine learning algorithms that
construct learning models by analyzing a data set. The J48 classifier is a decision tree
algorithm. It creates a decision tree structure as the learning model (Daraei & Hamidi,

68
2017). The Naïve Bayes classifier is a conditional probability model that is able to
forecast classes in accordance to a probability that is generated based on the number of
classes (Barki et al., 2016).
I incorporated the J48 classifier in the wrapper method. It can deal with both
alphabetical and numeric data (Onye et al., 2018). This classifier divides features based
on the “highest information gain ratio” (Srivastava et al., 2019, p. 4), and it can assign
features to its branches accurately (Panigrahi & Borah, 2018b). This may lead to high
accuracy of the wrapper method as the result of its evaluation of network traffic data.
The Naïve Bayes classifier forms the conditional probability model to determine
the classes of data points in accordance to a probability based on the number of labels
(Barki et al., 2016). I incorporated the Naïve Bayes classifier in the wrapper method. This
classifier is the simplest form of the conditional probability model based on the Bayesian
network (Liangjun et al., 2020). The Naïve Bayes classifier is a famous classifier
(Shenglei et al., 2020). It uses the “relative frequency” (Zhen et al., 2020, p. 40757) for
approximating the probability (Zhen et al., 2020). Features with high probability values
with respect to labels will increase the accuracy of the wrapper method.
Evaluation
This phase facilitates the evaluation of results (Michalak & Gulak-Lipka, 2017). I
used the 10-fold cross validation method to evaluate DDoS attack detection methods.
This method manages any bias (Wahab & Haobin, 2019), it achieves the highest accuracy
(Keleş, 2019), and it provides an estimate of generalization (Li et al., 2019).

69
Deployment
DDoS attacks cause devastations to online sites and servers (Hoque et al., 2017),
and detecting these attacks is the crucial and the initial step to confront them (Yonghao et
al., 2019). Intrusion detection systems are powerful and successful tools for obtaining
security that is of high level (Bostani & Sheikhan, 2017). DDoS attack detection methods
are intrusion detection systems for identifying DDoS attacks. On the other hand, a DMZ
is the zone between internal organizational networks and the internet. A DMZ area acts
as an intermediator between exterior and interior networks (Chard et al., 2018). In
achieving a best network security posture, the requirement is constant detection and
discovery of network security violations (Bopche & Mehtre, 2017). DMZ networks
provide a security level that is considered to be medium (Alvarez et al., 2021). These
networks involve having the goal of providing a clean path between external and internal
computational resources (Chard et al., 2018). A clean path refers to provision of safe
network communication connections among external and internal networks. Therefore,
the placement of DDoS attack detection methods outside of DMZ areas will help
organizations to better protect their systems and identify DDoS attacks directly from the
internet.
Critical Analysis and Synthesis of the Independent Variables
Filter Method
As the consequence of dynamic increase in the dimensionality of network traffic
data, feature selection is important for intrusion detection systems (Ambusaidi et al.,
2016). This dynamic change (growth) in the number of network traffic data is as the

70
result of continuous adjustment of the dimensionality with respect to rapid complexity
advancements of network topologies (Xiang, 2020). This incurs the difficulty for learning
algorithms to detect attacks (Xiang, 2020). Evaluation of network traffic data is
extremely challenging (Qi et al., 2018). Redundant features avoid proper detection of
attacks by learning algorithms (Ambusaidi et al., 2016). Therefore, feature selection can
improve the generalization performance of DDoS attack detection methods based on the
clustering method.
The filter method is fast and applies a statistical measure to produce a merit score
(predictive power) for evaluating features (Elhariri et al., 2020). The merit score is a
value from an implemented metric within a procedure or an algorithm such as the chi-
squared or information gain. A metric is an “independent measure” (Ambusaidi et al.,
2016, p. 2987). The filter method does not apply learning models (Moran & Gordon,
2019).
Wrapper Method
The filter method has one drawback. The “feature interaction problem”
(Dowlatshahi et al., 2018, p. 2) lowers the effectiveness of filter method (Dowlatshahi et
al., 2018). The feature interaction problem means that as the filter method assesses
features in a dimensional feature space, the combination of features together for assessing
them has negative impact on its performance (Dowlatshahi et al., 2018). The combination
of features together for assessment can lower the effectiveness of the filter method in
selecting appropriate features. The filter method does not take into account the relation
that should exist between features and a learning model (Roozbahani et al., 2017).

71
The wrapper method produces high accuracy (Shu et al., 2020). This method uses
the accuracy of a learning model (Shu et al., 2020). It attempts in increasing the
performance of a classifier (Visalakshi & Radha, 2017) to forecast the features from a
data set (Jadhav et al., 2018).
Clustering Method
According to Rodriguez et al. (2019) the clustering method provides information
about composite data. Composite data involve compound and multipart structure of data.
This data structure represents the categories of data objects and their relations to
categories based on feature weights. Using the clustering method, data objects belong to a
group, if they have similarities (Pérez-Suárez et al., 2019). This method categorizes data
objects without requiring labels (Rodriguez et al., 2019). It performs a cluster analysis
which is a statistical-based approach. This method is a major data mining technique for
discovering useful information that is able to determine the groups of data objects (Pérez-
Suárez et al., 2019).
The clustering method comprises conducting data mining tasks by performing a
cluster analysis (Zou, 2020). A cluster analysis involves examining characteristics of data
objects in categorizing similar ones (Zou, 2020). This analysis is based on maching data
properties (Schuh et al., 2017). The clustering method will have data points with larger
similarity under one cluster and data points with lesser similarity under another cluster
(Zou, 2020).
The aim of DDoS attack detection methods based on the clustering method is to
have data points between clusters at their maximum distances and data points within

72
clusters at their minimum distances. This leads these unsupervised DDoS attack detection
methods to distinguishably categorize DDoS attacks. However, based on Idhammad et al.
(2018b), in high dimensional network traffic data that have a lot of features, distance
among data points leads to being inconsequential. As the result, the learning process of an
unsupervised DDoS attack detection method produces homogenized feature weights
known as the curse of dimensionality (Idhammad et al., 2018b). Redundancy of attributes
in data causes the curse of dimensionality (Salimi et al., 2018). A process for
dimensionality reduction is necessary for the clustering method (Mohamed, 2020). It
involves the removal of redundant attributes from data (Henni et al., 2020). Therefore,
my objective was to determine whether adding the filter and wrapper method prior to the
clustering method produces greater performance in terms of lowering false positive rates
of DDoS attacks detection methods. Appendix A presents the algorithms that the filter,
wrapper, and clustering methods used to evaluate the DDoS attacks detection methods.
Critical Analysis and Synthesis of the Dependent Variable
DDoS Attack Detection Methods
DDoS attacks are easy to be launched (Hoque et al., 2017). The main objective of
DDoS attacks is to consume computational assets and bandwidths (Hoque et al., 2017).
Nevertheless, intrusion detection systems are great to gain high level security (Bostani &
Sheikhan, 2017).
There are two types of detection systems: misuse-based DDoS (MD) and
anomaly-based (AD) DDoS attack detection systems (Yonghao et al., 2019). Misuse-
based attack detection systems use attacks’ signatures in detecting attacks, while

73
anomaly-based attack detection systems apply machine learning models to identify
attacks (Yonghao et al., 2019). DDoS attacks’ signatures are exclusive organizations of
DDoS attacks information that are used to identify these attacks. Misuse-based attack
detection methods are appropriate in detecting known attacks (Yonghao et al., 2019).
However, they have difficulty identifying unknown attacks (Yonghao et al., 2019). DDoS
attacks do not use common network traffic data to facilitate the detection of attacks
(Khalaf et al., 2019).
Anomaly-based DDoS attack detection systems are appropriate for unknown
attacks (Yonghao et al., 2019). Based on Yonghao et al. (2019), anomaly DDoS attack
detection systems represent the implementation based on supervised and unsupervised
learning algorithms. According to Idhammad et al. (2018b), supervised learning involves
training on prelabelled data to identify DDoS attacks while unsupervised learning does
not.
Anomaly-based DDoS attack detection methods have statistical reliability (Khalaf
et al., 2019). They are able to use the statistical implementations to enable the prediction
of attacks that are unknown. These methods are intrusion detection methods. Intrusion
detection systems are great in providing security that is high (Bostani & Sheikhan, 2017).
But, a major issue of anomaly-based DDoS attack detection methods based on the
clustering method is the curse of dimensionality. Anomaly-based DDoS attack detection
methods involve applying machine learning algorithms (Yonghao et al., 2019). The curse
of dimensionality is a major issue of data mining tasks conducted by machine learning
algorithms (Gahar et al., 2019). With respect to DDoS attack detection methods that use

74
unsupervised learning algorithms, in high dimensional network traffic data that have
numerous attributes, distance among data points leads to have no consequence
(Idhammad et al., 2018b). As the result, the learning processes of DDoS attack detection
methods produce equal weights, which this phenomenon is recognized as the curse of
dimensionality (Idhammad et al., 2018b). Based on Idhammad et al. (2018b), the curse of
dimensionality lowers the effectiveness of the unsupervised DDoS attack detection
methods to distinguish between attack and non-attack network traffic data. This problem
may not lead organizations to achieve security that is of high level. For this reason, I
added the filter and wrapper method preceded by the clustering method to identify
effective DDoS attack detection methods in detecting attacks.
Measurement of Variables
I used the metric of false positive rate to assess the performance of DDoS attack
detection methods based on the clustering method. The false positive rate metric
calculates the ratio between the number of falsely categorized normal network traffic
events as attack events and the total normal network traffic events (Yonghao et al., 2019).
DDoS attacks are large attacks (Hoque et al., 2017). These attacks overwhelm systems
with redundant network traffic requests. If DDoS attack detection methods do not select
appropriate features or properties from high dimensional network traffic data, their
detection models have to analyze large network traffic properties of network traffic
requests to realize attacks. Unsupervised DDoS attack detection methods for analyzing
high dimensional data are not effective due to the curse of dimensionality (Idhammad et
al., 2018b). The detection models of DDoS attack detection methods produce high false

75
positive rates (Ying et al., 2018). These methods should analyze network traffic data
effectively.
The objective of the false positive rate metric is to measure the effectiveness of
DDoS attack detection methods to recognize between attacks and legitimate requests for
services (Khalaf et al., 2019). This metric assesses a DDoS attack detection method
performance (Idhammad et al., 2018b). I investigated whether adding the filter and
wrapper methods to the clustering method lowers false positive rates of DDoS attack
detection methods. Based on Yonghao et al. (2019), the formula for the false positive rate
metric is below, where FP represents the number of occurrences of the false positive, and
TN represents the number of occurrences of the true negative.
Comparing Different Views
A DDoS attack is comparable to a crowded individuals that block the entrance of
normal customers to a shop, leading to interruption of regular conduction of trade by the
shop (Yonghao et al., 2019). DDoS attacks cause devastations (Khalaf et al., 2019). They
involve sending network traffic requests simultaneously and repeatedly to the victim
systems (Khalaf et al., 2019). They block the access of legitimate network traffic requests
to organizational services, leading to financial damages. Financial damages from DDoS
attacks is between $50,000 to $2.3 million annually (Lopez et al., 2019).
The clustering method uses unsupervised learning algorithms. Ying et al. (2018)
found that unsupervised learning algorithms constantly fail to produce acceptable
outcomes. The curse of dimensionality causes the true positive rate of DDoS attack

76
detection methods based on unsupervised learning algorithms to be reduced (Yonghao et
al., 2019). The true positive rate is the ratio of the number of correct identification of
network traffic data instances to the entire network traffic data instances of the dataset
(Binbusayyis & Vaiyapuri, 2019). The curse of dimensionality is a concern for DDoS
attack detection methods. Based on Idhammad et al. (2018b), the phenomenon of the
curse of dimensionality prevents DDoS attack detection methods to properly detect
attacks.
Critical Analysis and Synthesis of the Literature
DDoS attacks make online services inaccessible by overwhelming online services
with network traffic requests (Yonghao et al., 2019). This involves the degradation of
services (Khalaf et al., 2019). DDoS attacks congest computational assets and bandwidths
with unnecessary and excessive network traffic requests (Hoque et al., 2017).
Application of clustering algorithms for detecting anomalies is effective
(Alguliyev et al., 2019). Clustering algorithms do not require prior data distribution
knowledge of attributes (Yonghao et al., 2017). However, the curse of dimensionality
lowers the performance of DDoS attack detection methods based on the clustering
method to distinguish between attacks and legitimate network traffic requests. The
clustering method is not effective in analyzing data sets with lots of dimensions (Yuanjie
et al., 2020).
Classifying a data set that has a lot of dimensions is a problem for the clustering
method (Rathore et al., 2019). Many features will be redundant (Yanfang et al., 2020).
The curse of dimensionality is caused by redundant properties (Salimi et al., 2018).

77
Redundant properties do not allow the extraction of patterns (Azhar et al., 2019). When
unsupervised DDoS attack detection methods assess a high dimensional network traffic
data set, distance between data points leads to have no impact (Idhammad et al., 2018b).
This has a consequence in the computation of the learning process of an unsupervised
DDoS attack detection method to generate equal feature weights known as the curse of
dimensionality (Idhammad et al., 2018b).
Reducing data dimensions is required for the clustering method (Mohamed,
2020). It removes redundant properties (Henni et al., 2020) and may increase accuracy
(Manbari et al., 2019). Dimensionality reduction enables inappropriate features to be
excluded (Visalakshi & Radha, 2017).
Summary and Transition
In this study, I attempted to determine if false positive rates of DDoS attack
detection methods based on the clustering method can be improved by adding the filter
and wrapper methods. A problem of DDoS attack detection methods that apply
unsupervised learning algorithms is the curse of dimensionality. According to Idhammad
et al. (2018b), the curse of dimensionality lowers the effectiveness of DDoS attack
detection methods based on unsupervised learning techniques to distinguish between
attacks and normal network traffics. In a high dimensional network traffic data set,
distance among data points leads to being not consequential (Idhammad et al., 2018b).
Because of this, the calculation of the learning process of a DDoS attack detection
method produces equal feature weights (Idhammad et al., 2018b). The false positive rate
metric involves conducting the calculation of the effectiveness of DDoS attack detection

78
methods to distinguish between DDoS attacks and normal network traffic data (Khalaf et
al., 2019). My goal in this study was to decide whether incorporating the filter and
wrapper methods prior to the clustering method is effective in terms of lowering false
positive rates of DDoS attack detection methods.
Subsequently, I explained the social contribution of this study in terms of
identifying effective DDoS attack detection methods to help organizations to protect their
assets. In this case, organizations may be able to offer uninterrupted services to
communities. I explained the reasons for the use of the quantitative methodology over the
qualitative methodology. Also, I made the justification for the use of the ex post facto
design of A-B-A-BC. I presented the research questions and hypotheses to examine the
effectiveness of DDoS attack detection methods. Likewise, I provided the justifications
for the use of the CRISP-DM, as well as the significance of the study to organizations
and society regarding detecting DDoS attacks.
I presented the definition of terms as well as the assumption, limitation, and
delimitation of this study. Then, I provided the literature review of the filter, wrapper, and
clustering methods. Likewise, I provided the literature review of the CICIDS2017
dataset, the WEKA workbench, and DMZ networks. Consequently, I explained the
relevancy of the literature review to the applied IT problem using the CRISP-DM
framework. I provided the justifications to use the false positive rate metric to measure
the effectiveness of DDoS attack detection methods. Finally, I presented a literature
review of the variables.

79
In the next chapter, I restated the purpose statement to identify effective DDoS
attack detection methods, and I explained my role in this study. I expanded to explain the
use of the quantitative method and the ex post facto design of A-B-A-BC single-group. In
the next chapter, I justified the use of the CICIDS2017 dataset, provided an ethical
research statement, and presented the details of instrumentation, data analysis, and study
validities. Consequently, I conducted the experimentation and presented the findings in
the third or final chapter. Afterward, I provided the explanation of the usefulness of the
findings of this experimentation to the professional IT practice, and their implications to
the social change. Lastly, I provided recommendations for professional IT actions and
future study in that final chapter.

80
Section 2: The Project
Purpose Statement
The purpose of this quantitative study was to examine whether adding the filter
and wrapper methods prior to the clustering method is effective in terms of lowering false
positive rates of DDoS attack detection methods. I used ex post facto known as causal
comparative study with the A-B-A-BC single group phase design. Ex post facto designs
facilitate realization of causation in natural settings (Iqbal et al., 2020). The A-B-A-BC
design involves providing opportunity to control an intervention independently during the
B phase, and in a combination with a second intervention during the BC phase (Tanious
& Onghena, 2019). The first and second interventions were the filter and wrapper
methods. The single group was network traffic data. Using single group experiment, in
this study, enabled me not to divide network traffic data between the A, B, and BC
phases. Features involve impacting learnability of machine learning algorithms (Lamba et
al., 2018). The independent variables were the filter, wrapper, and clustering methods.
The dependent variable was false positive rates of DDoS attack detection methods that
applied the filter, wrapper, and clustering methods. The false positive rate represents the
ratio of the number of categorized normal network traffic events as attack events and
normal network traffic events (Yonghao et al., 2019). The population was network traffic
data of the CICIDS2017 dataset. The CICIDS2017 dataset contains realistic network
traffic data (Abdulhammed et al., 2019). This study may contribute to positive social
change by identifying effective DDoS attack detection methods. This may help

81
governments, foundations, and other social service organizations better protect their
systems from service interruptions and offer uninterrupted services to their communities.
Role of the Researcher
Role of the Researcher in Selecting the CICIDS2017 Dataset
My role in this study was to locate a comprehensive network traffic dataset that
represents real network traffic data. In this case, I chose the CICIDS2017 dataset. This
dataset contains up-to-date network traffic data (Chiba et al., 2019).
Code of Ethics
I applied two ethic items of the American Sociological Association (ASA) Code.
The first ethic item of the ASA Code was integrity in research. This item necessitates that
a researcher must realize his or her competency limitations in doing a research (Galliher,
1975). It requires a researcher to seek guidance of experts, in accordance to the
competency level of the researcher (Galliher, 1975). Integrity facilitates provision of
clarity in research (Resnik & Elliot, 2019). The second ethic item of the ASA Code was
objectivity in research. This ethic item requires researchers to uphold “scientific
objectivity” (Galliher, 1975, p. 115). Objectivity is provable and reproducible
(Lindemann, 2019). Therefore, scientific objectivity necessitates the presentation of data-
driven results without revealing opinions and perspectives to make the outcomes of this
study provable and reproducible.
I did not use the Belmont Report protocol. The Belmont Report protocol offers
suggestions for research activities aimed toward human subjects (Cragoe, 2019). I did not
include human subjects. I only focused on enhancing the performance of DDoS attack

82
detection methods based on the clustering method in detecting attacks by adding the filter
and wrapper methods to administer dimensionality reduction in eliminating redundant
features. The clustering method does not perform well to analyze high dimensional data
(Yuanjie et al., 2020).
Research Method
The specific research method that I used was the quantitative method for the
following justifications. A quantitative research involves testing a null hypothesis
(Bloomfield & Fisher, 2019), collecting numeric data (Ahmad et al., 2019), and making
use of numbers (Rutberg & Bouikidis, 2018). The quantitative methodology allows for
statistical analysis (Ahmad et al., 2019), and it involves using experimentation (Rutberg
& Bouikidis, 2018). Experimentation allowed me to verify data-driven results.
I did not use the qualitative method. The qualitative method is applicable in
studies with unclear problems (Rutberg & Bouikidis, 2018). Qualitative investigations
explore problems (Rutberg & Bouikidis, 2018), and they involve providing narratives
(Rutberg & Bouikidis, 2018). Qualitative research studies reveal opinions (Haven &
Grootel, 2019), and they are not scientific (House, 2018). They rely on common sense of
individuals to articulate statements (House, 2018). I examined whether adding the filter
and wrapper methods prior to the clustering method will improve the effectiveness of
DDoS attack detection methods by reducing their false positive rates. The incorporation
of the qualitative method was not appropriate in this study.
I did not use the mixed methods design. This design considers the “quantity-
quality dichotomy” (Piccioli, 2019, p. 427). This design aids in balancing weaknesses

83
that exist in both quantitative and qualitative studies (Al-Zboon et al., 2020). The mixed
methods design facilitates the organization and conduction of both quantitative and
qualitative data gathering and assessment (Pei & Nianyi, 2019). This design is suitable
when researchers have problems to make conclusions from current theories and
viewpoints (Califf et al., 2020). The CRISP-DM framework enables assessment of
voluminous data and discovery of important information (Castro et al., 2019). As the
result, this study did not require the qualitative approach to allow the researcher to make
conclusions.
Research Design
I considered ex post facto design of A-B-A-BC for the following reasons. An ex
post facto design is a causal comparative research. A causal comparative research type
facilitates evaluating causation of an event that previously occurred (Yenice et al., 2019).
Ex post facto designs will not involve changing conditions of a sample of a population or
a population (Dölek & Hamzadayı, 2018). The capture of network traffic data, to create
the CICIDS2017 dataset, by Sharafaldin et al. (2018) was based on an actual attack
scenario (Yong et al., 2019). Sharafaldin et al. (2018) launched DDoS attacks by sending
“UDP, TCP, or HTTP requests” (Chiba et al., 2019, p. 306), and they used switches and
routers to manage these network traffic requests between the attack network and victim
network in their study. Features have major impact for learnability of machine learning
algorithms (Lamba et al., 2018). In this regard, with respect to the CICIDS2017 dataset,
network traffic features impact the effectiveness of machine learning algorithms in

84
predicting DDoS attacks. Ex post facto designs evaluate impacts to recognize plausible
causations (Zia et al., 2017).
The A-B-A-BC design allows for administeration of an intervention
independently during the B phase, and jointly with a second intervention during the BC
phase in an experimentation (Tanious & Onghena, 2019). This design allowed me to
examine the filter method independently during the B phase, and jointly with the wrapper
method during the BC phase. The filter method extracts features that have the highest
predictive powers (Visalakshi & Radha, 2017), and the wrapper method depends on a
learning model to extract features (Fei et al., 2018).
I did not consider true-experimental designs. These designs involve investigating
causalities among variables (Bloomfield & Fisher, 2019). They involve manipulating
variables (Bloomfield & Fisher, 2019). I did not manipulate the filter, wrapper, and
clustering methods. Ex post facto designs involve testing causations among categorical
and numeric arguments (Eskici & Çetinkaya, 2019), and they involve finding differences
that exist between a sample of a population or a population and their conclusions (Dölek
& Hamzadayı, 2018). The numeric network traffic data of the CICIDS2017 dataset will
enable classification (learnability) based on its categorical values of DDoS and BENIGN
in measuring the effectiveness of DDoS attack detection methods.
I did not consider pre-experimental designs. Pre-experimental designs are suitable
when quantitative factors are unknown (Farooq et al., 2016). One significant quantitative
factor that I realized is that DDoS attack detection methods based on the clustering
method produce high false positive rates. Also, I used the CICIDS2017 dataset to enable

85
DDoS attack detection methods based on the clustering method to construct attack
detection models. In clustering analysis object categories are reliant on knowledge from
data (Moslehi et al., 2018). Furthermore, I used the WEKA workbench. This tool has
reached its level of adequacy or maturity. It includes a series of machine learning
algorithms in order to facilitate knowledge discovery process for data mining tasks
(Verma & Ranga, 2018b). Therefore, the use of pre-experimental designs were
inappropriate in this study.
Population and Sampling
The CICIDS2017 dataset was the population in this study for the following
reasons. This dataset comprises network traffic analysis results of the CICFlowMeter
(Andreatos & Moussas, 2019). The CICFlowMeter is a flow-based network traffic
feature extractor (Sharafaldin et al., 2018). Also, this dataset contains the information of
normal traffics and DDoS attacks. The capture of normal network traffics was on
Monday of July 3rd, 2017, with the capture of DDoS traffic data on Friday of July 7th,
2017 (Chiba et al., 2019).
I used the CICIDS2017 dataset, and I did not consider the KDD, NSL-KDD,
AWID, CIDDS-001, ISCXIDS2012, and UNSW-NB15 datasets. The KDD dataset has
duplicate network traffic data that are consequential to machine learning algorithms
(Protić, 2018). This leads the classification error to increase. Redundant network traffic
data will increase the error rate to classify records using the KDD dataset (Jianlei et al.,
2019). This dataset does not represent network traffic data that would be realistic (Protić,
2018). The NSL-KDD dataset does not have duplicated network traffic data as the KDD

86
dataset (Jianlei et al., 2019). Non-existence of duplicate records cause machine learning
algorithms to produce unbiased results (Protić, 2018). But in contrast to NSL-KDD, the
UNSW-NB15 has network traffic data that are representative of real scenarios (Hoang &
Tran, 2019).
According to Abdulhammed et al. (2019), the CICIDS2017 dataset is the most
comprehensive dataset in contrast to the UNSW-NB15, AWID, and CIDDS-001 datasets.
The CICIDS2017 dataset has network traffic data that are representative of real scenarios
and contains unique network traffic data compared to the UNSW-NB15, AWID, and
CIDDS-001 datasets (Abdulhammed et al., 2019). The CICIDS2017 dataset is
advantageous over ISCXIDS2012 dataset. The CICIDS2017 dataset has network traffic
data that are diversified (D’Hooge et al., 2019). The great reduction of network traffic
data instances, or the removal of vital network traffic properties from the CICIDS2017
dataset can still have outcomes that are representative of real scenarios (D’Hooge et al.,
2019).
The CICIDS2017 dataset is a dichotomous dataset that has network traffic data
instances for the DDoS and BENIGN labels. A dichotomous dataset involves
categorizing data instances with two labels. A data instance represents the organization of
a series of data in accordance to a label. The CICIDS2017 dataset has 225,745 network
traffic data instances. This dataset consists of 128,027 DDoS attack data instances and
97,718 benign data instances. Benign network traffic data instances represent the contents
of normal human activities (Chiba et al., 2019). Sharafaldin et al. (2018) used the
CICFlowMeter to enable the random capture of 80 flow-based network traffic data.

87
Flow-based network traffic data are the captures of network traffic flow. Sharafaldin et
al. (2018) started network traffic flow among victim systems and attack systems. Based
on Lopez et al. (2019), Sharafaldin et al. (2018) accomplished this by transmitting
network traffic data packets among source IP and port of a system to a destination IP and
port of another system.
I used the entire population of the CICIDS2017 dataset that contains 225,745
network traffic data instances and did not consider any sampling of this dataset. The
reasons are as follows. Attributes are influential in learnability of machine learning
algorithms (Lamba et al., 2018). The CICIDS2017 dataset has real network traffic data
(Zhidong et al., 2019). Extracting network traffic data was based on realistic criteria
(Prasad, et al., 2019). this dataset represents true capture of data (Andreatos & Moussas,
2019). It contains 84 network traffic features. The 84th feature is the label containing the
values of DDoS for DDoS attack data instances and BENIGN for normal data instances.
According to Chiba et al. (2019), the suitability criteria of this CICIDS2017 dataset are
the anonymity, complete capture, complete interaction, complete network configuration,
available protocols, complete traffic, feature set, metadata, heterogeneity, and labeling.
As the consequence, these 10 criteria signify the true capture of benign and DDoS
network traffic data instances.
The anonymity criterion involves concealing contents of network traffic data. In
adhering to the anonymity criterion, Sharafaldin et al. (2018) applied statistical metrics of
“minimum, maximum, mean, and standard deviation” (Abdulhammed et al., 2019, 5).
The complete capture criterion involves using a mirror port to capture and record all

88
network traffic data in a server (Sharafaldin et al., 2018). With respect to the creation of
the CICIDS2017 dataset, mirror ports send and capture network traffic data from the
source port of either an attack system or a victim system to the destination port of the
either of these systems. The complete interaction criterion involves requiring to cover
within and between LAN, through including two dissimilar networks and internet
connectivity among these networks (Sharafaldin et al., 2018). The complete network
configuration criterion necessitates in applying a complete network infrastructure that
contains devices such as “modem, firewall, switches, routers, and presence of variety
operating systems such as Windows, Ubuntu, and Macintosh” (Sharafaldin et al., 2018, p.
114). The network infrastructure was incorporated as a “testbed infrastructure”
(Sharafaldin et al., 2018, p. 110). This infrastructure included two networks of attack
network and victim network in encompassing all of these mentioned devices (Sharafaldin
et al., 2018).
Similarly, network traffic data for the CICIDS2017 dataset was gathered through
using common protocols (Chiba et al., 2019). To satisfy the available protocols criterion,
the creation of the CICIDS2017 dataset involved incorporating protocols such as “HTTP,
HTTPS, FTP, SSH, and email protocols” (Sharafaldin et al., 2018, p. 114). Common
protocols are protocols that organizations usually use to enable the transmission of
network traffics. The complete traffic criterion involves containing a user profile and 12
computers in the victim network, and ensuring attacks to be transmitted through the
attack network (Sharafaldin et al., 2018). A benign profile system included the user
profile of abstract human activities in the victim network, representing normal network

89
traffic communications (Sharafaldin et al., 2018). According to Sharafaldin et al. (2018),
the feature set criterion involved requiring the provision of the ability of recording
network traffic data for more than 80 features and in a CSV file. The metadata criterion
required the provision of detailed explanations of the dataset (Sharafaldin et al., 2018).
The heterogeneity criterion involved the capture of all network traffics from victim
systems during attacks (Sharafaldin et al., 2018). With respect to labeling criterion, the
network traffic data of the CICIDS2017 dataset is fully labelled.
The CICIDS2017 dataset aligned with the research question. I used the research
question to examine whether adding the filter and wrapper methods prior to the clustering
method is effective in terms of lowering false positive rates of DDoS attack detection
methods. The dataset represents the Friday afternoon DDoS attacks through “Low Orbit
Ion Canon (LOIC)” (Chiba et al., 2019, p. 306). LOIC was used by Sharafaldin et al.
(2018) to transmit UDP, TCP, or HTTP requests to the targeted victim (Chiba et al.,
2019). The CICIDS2017 dataset represents true capture of data (Andreatos & Moussas,
2019). Appendix B presents the table of network traffic data properties of the
CICIDS2017 dataset that this study used to build DDoS attacks detection models.
Ethical Research
This research did not have any human subject. Walden University Institutional
Review Board (IRB) assessed the ethical nature of this study for continuation of the
research considering the common rule reform. The common rule reform is about
protecting and safeguarding individuals that accept specific research risks (Wolinetz &
Collins, 2017).

90
Instrumentation
Instrument Introduction
I used the WEKA workbench for this study. This tool is a software package that
facilitates the conduction of data mining tasks (Aksu & Doğan, 2019) by applying
mechine learning algorithms (Ali & Hamed, 2018). They build statistical models
(Hussain et al., 2016). Also, this tool is reliable as it has “modular and extensible
architecture” (Pereira et al., 2017, p. 37) and applies maturity of “database utilities”
(Kiranmai & Laxmi, 2018, p. 3). This tool analyzes data as one relational table (Pereira et
al., 2017). The University of Waikato in New Zealand delivered this tool in 1997 (Meena
& Choudhary, 2017). In this study, this instrument enabled DDoS attack detection
methods to examine network traffic data. DDoS attack detection methods were based on
the clustering method.
The WEKA workbench involves the aim for enabling the identification of
algorithms that are able to produce accurate learning models (Pereira et al., 2017). Based
on Ali and Hamed (2018), the WEKA workbench was constructed based on the
postulation that every data point has data property stability with respect to data type and
data value. This tool involves the assumption that a data type is of a particular type and
data has normality (Ali & Hamed, 2018). Based on Ali and Hamed (2018), a dataset has
data normality, if the dataset has numeric and alphabetic values. Also, this tool
encompasses the assumption that the number of features is fixed (Kiranmai & Laxmi,
2018).

91
Description of DDoS Attack Detection Method
DDoS attack detection methods based on machine learning algorithms aim at
identifying DDoS attacks from normal events. According to Yonghao et al. (2019), these
DDoS attack detection methods represent the implementation based on supervised and
unsupervised learning algorithms. DDoS attack detection methods that are based on
supervised learning requires prelabelled data to identify attacks while methods that are
based on unsupervised learning do not (Idhammad et al., 2018b).
Nevertheless, the curse of dimensionality lowers the effectiveness of unsupervised
DDoS attack detection methods to identify attacks accurately (Idhammad et al., 2018b).
DDoS attack detection methods that use the clustering method are unsupervised DDoS
attack detection methods. The curse of dimensionality exists because of feature
redundancy (Salimi et al., 2018). Feature reduction is required for the clustering method
(Mohamed, 2020). It involves removing improper attributes (Henni et al., 2020) and may
increase the accuracy (Manbari et al., 2019). Feature reduction has the capability to
enhance the performance generality of learning algorithms (Xiaojuan et al., 2018).
I used the filtered-classifier method to build DDoS attack detection methods. The
filtered-classifier method produces better accuracy in classification with respect to the
time that it takes to analyze data (Surameery & Hussein, 2017). This method is a
supervised learning implementation. Supervised learning is suitable for calssification
(Uddin et al., 2019). Classification improves the performance of DDoS attack detection
methods to categorize network traffic data points, because it involves performing
prediction using a network traffic dataset that has labelled data objects. This is for the

92
following reasons. Supervised learning implementations involve training on data
instances that are labelled to build a prediction model (Uddin et al., 2019). Then, the
prediction model uses an unlabeled test data to classify the data instances into categories
that will be similar (Uddin et al., 2019).
In this study, DDoS attack detection methods performed the examination of
network traffic data objects and their associations to object categories using the clustering
method. The clustering method organizes a data set within categories (Sinaga & Miin-
Shen, 2020). This was with the way of realizing cluster organization of network traffic
properties to identify DDoS attacks data from benign network traffic data. DDoS attack
detection methods performed similarity-based cluster analysis and distance-based cluster
analysis. Similarity-based cluster analysis is about increasing intra-class similarities and
decreasing inter-class similarities (Anjum & Qaseem, 2019). The SOM algorithm is a
procedure of the clustering method that performs similarity-based cluster analysis.
Distance-based cluster analysis is about increasing intra-cluster distances and decreasing
inter-cluster distances. The k-means algorithm is a procedure of the clustering method
that performs distance-based cluster analysis.
The objective in this research was to have DDoS attack detection methods analyze
network traffic data objects, so that data objects between clusters are at their maximum
distances and data objects within clusters are at their minimum distances. That way, these
methods would be able to recognize DDoS attacks successfully. Results of the clustering
method will have data objects with greater similarity within one category and data objects
with smaller similarity within another category (Zou, 2020). The clustering method
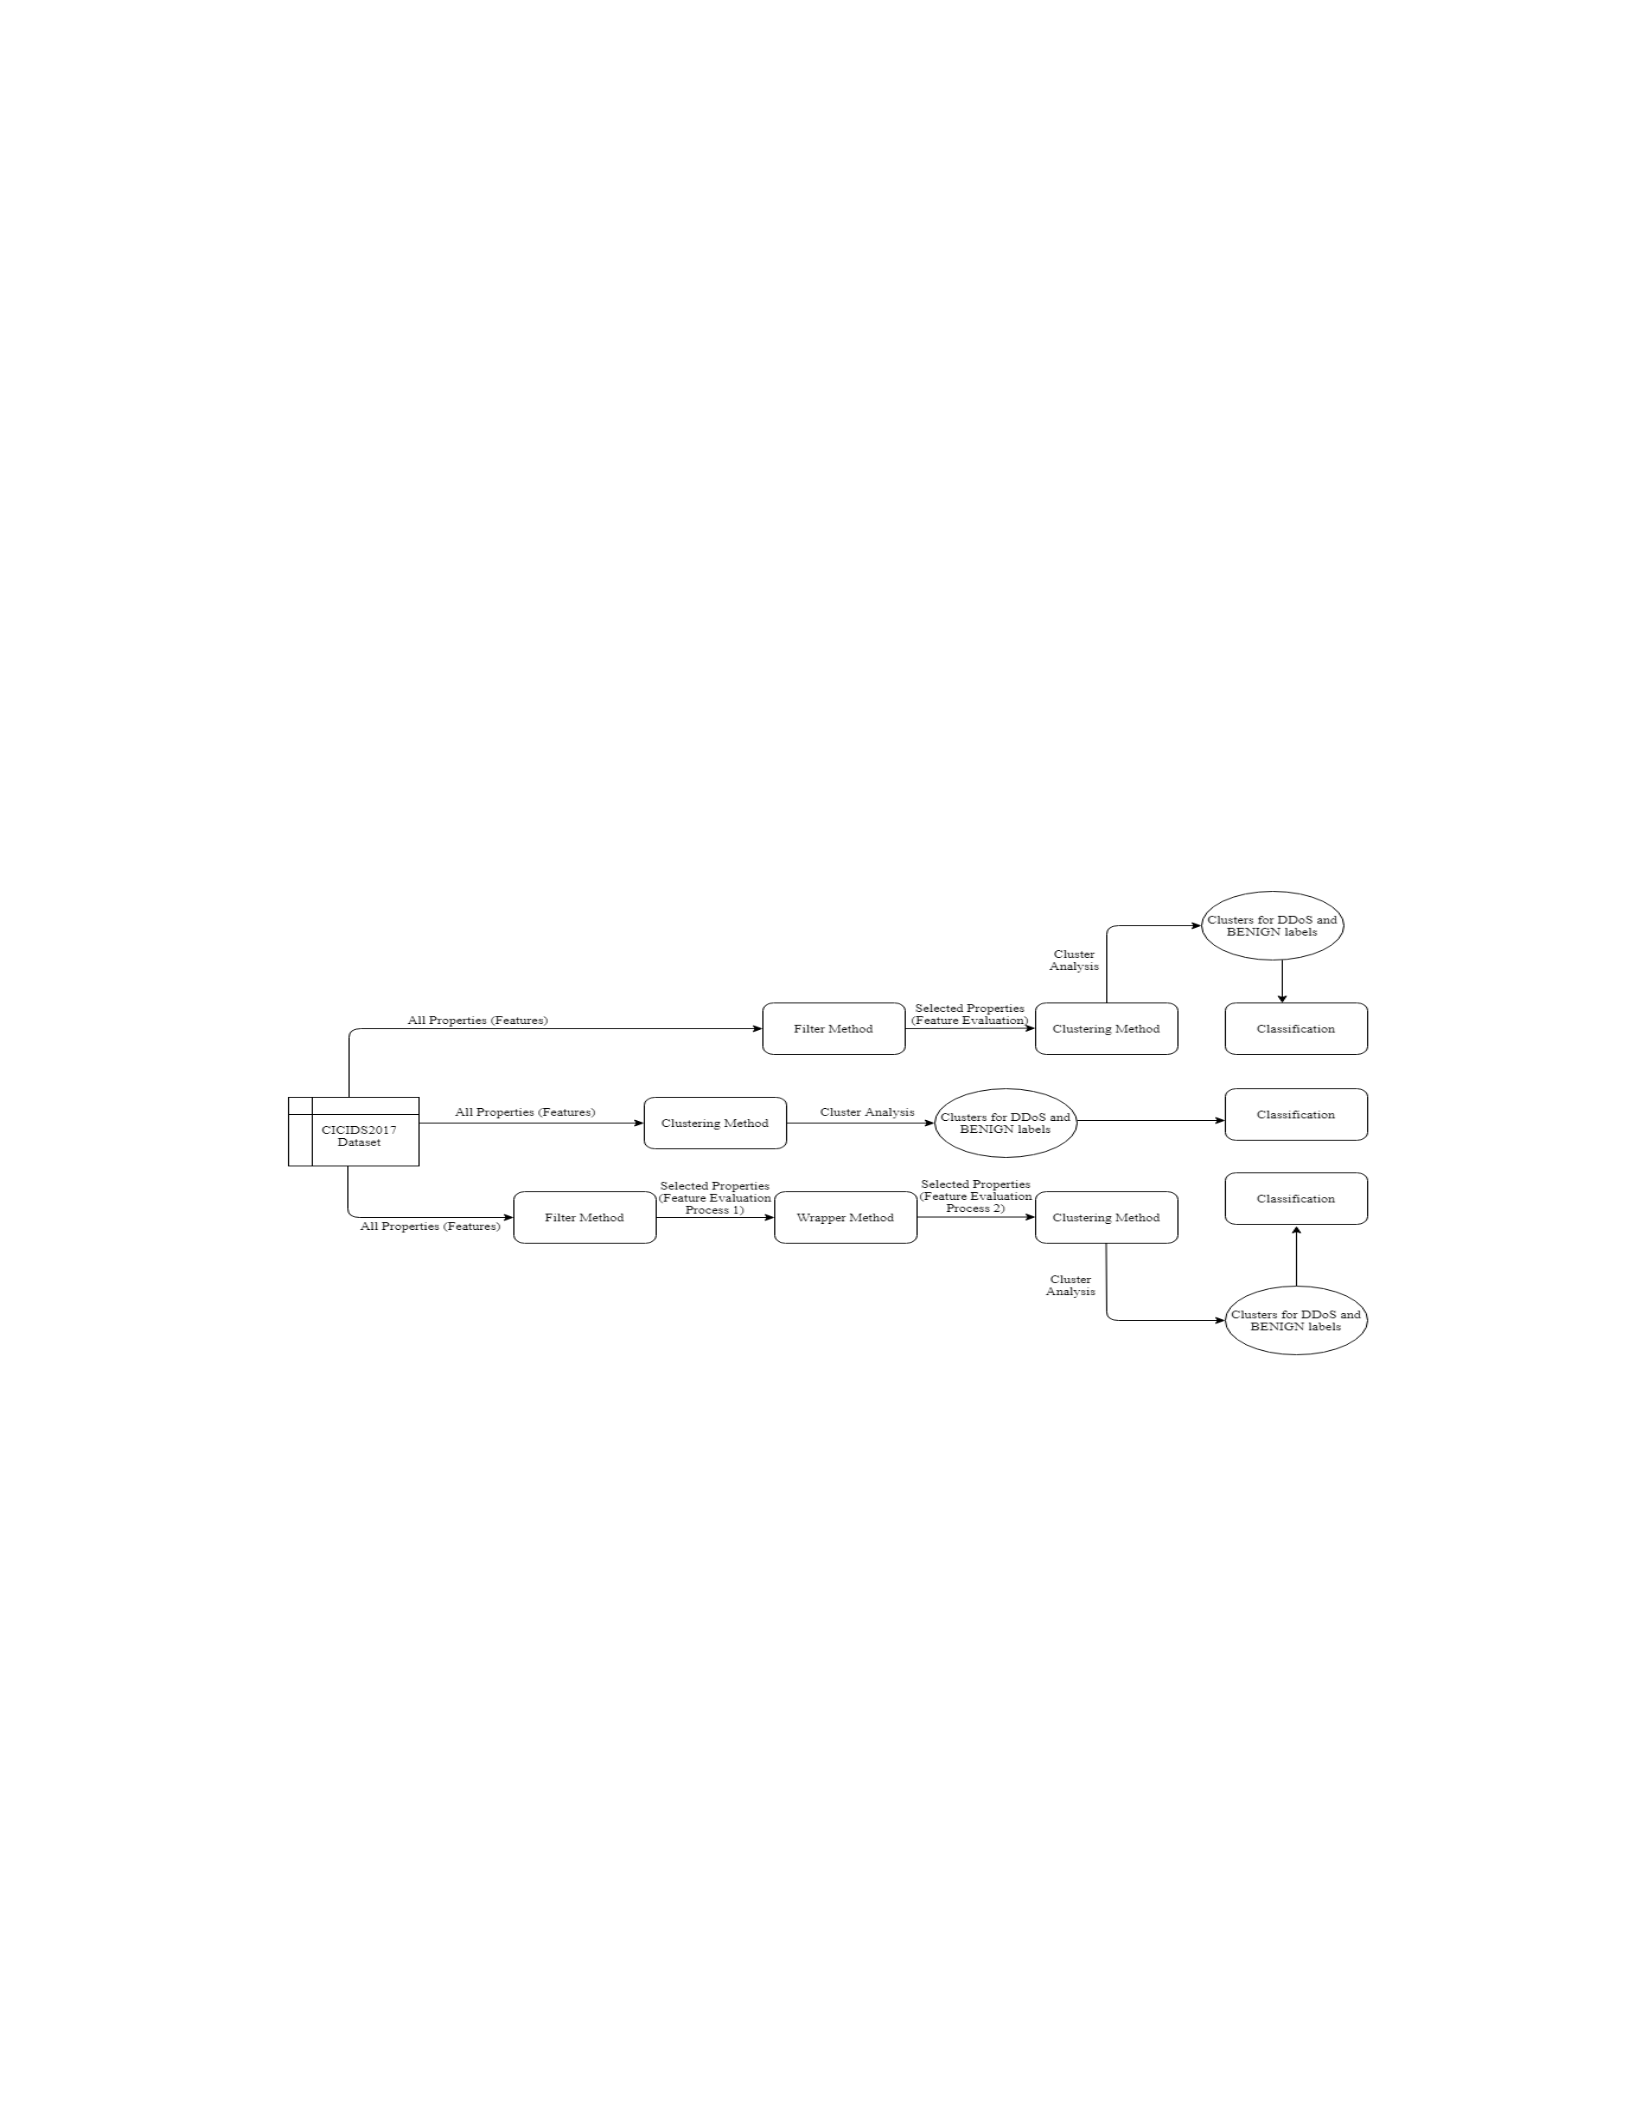
93
makes data more similar under one cluster than another one (Guan et al., 2017).
Extracting useful information is based on matching data properties (Schuh et al., 2017).
Figure 1 presents the proposed DDoS attack detection modeling. The modeling formed
two categories for the BENIGN and DDoS labels for classification. In this case, I
determined whether adding the filter and wrapper methods to the clustering method is
effective in identifying attacks in terms of lowering false positive rates of DDoS attack
detection methods.
Figure 1
DDoS Attacks Detection Mapping Diagram
Description of Data
Data for Measuring DDoS attack Detection Methods
I used the false positive rate to measure the performance of DDoS attack detection
methods. The false positive rate is the ratio between the number of misclassified benign
events as attack events and the total benign events (Yonghao et al., 2019). The objective
of the false positive rate involves measuring the effectiveness of DDoS attack detection
methods to identify attacks from normal network traffic events (Khalaf et al., 2019). This

94
metric is able to evaluate DDoS attack detection methods’ performance (Idhammad et al.,
2018b).
Data Around Network Traffic Data Categorization
The clustering method involves administering a data mining task by utilizing a
cluster analysis (Zou, 2020). Forming a model by this method will be based on matching
properties (Schuh et al., 2017). DDoS attack detection methods based on the clustering
method use feature weights to categorize associated network traffic data objects among
clusters. This event would be with respect to center weights of network traffic data
properties of the CICIDS2017 dataset. The categorization forms two clusters for DDoS
and BENIGN labels. The cluster for DDoS label represents the categorized DDoS attack
data instances. The cluster for BENIGN label represents the categorized benign data
instances.
DDoS attack detection methods tried to categorize data points under one cluster
that will have higher feature weights than the center weights of network traffic data
properties. These methods also tried to categorize data points under another cluster that
will have lower feature weights than the center weights of network traffic data properties.
Based on the formulas of the SOM and k-means algorithms presented by Kamath and
Choppella (2017), not necessarily, DDoS attack detection methods should categorize data
objects under one cluster that will have higher feature weights than these center weights.
Likewise, according to these formulas that Kamath and Choppella (2017) illustrate, not
necessarily, DDoS attack detection methods should categorize data objects under another
cluster that will have lower feature weights than these center weights. The categorization

95
depends on the calculation of the learning process of a DDoS attack detection method
under iterative process of the related cluster or object category. The clustering method
performs an analysis to have data objects with greater similarity as one group and data
objects with smaller similarity as another group (Zou, 2020).
Data Around Feature Selection
The filter and wrapper methods are able to evaluate features, so that proper
attributes are selected for learning models. The filter method selects data properties
without machine learning techniques (Moran & Gordon, 2019). It provides a subset of
features that is not reliant on learning models (Moran & Gordon, 2019). The chi-squared
and information gain are algorithms that the filter method uses to produce the worth of a
data property. The wrapper method depends on a learning model to assess network traffic
properties. The wrapper method uses the accuracy of a prediction model (Shu et al.,
2020). It tries to make the enhancement of the effectiveness of a selected classifier
(Visalakshi & Radha, 2017), and it predicts data properties (Jadhav et al., 2018). The
accuracy of that classifier identifies a subset of data properties. The J48 and Naïve Bayes
classifiers are two classifiers that build learning models by analyzing a data set. The J48
is a decision tree learning technique. It creates a decision tree structure as the learning
model (Daraei & Hamidi, 2017). The Naïve Bayes classifier is a conditional probability
model that is able to predict classes based on a probability that is generated based on the
number of classes (Barki et al., 2016).
Chi-Squared Algorithm. The chi-squared algorithm computes deviation of data
objects from the distribution that is estimated (Corrales et al., 2018). It produces the

96
predictive power of a data property based on a label (Corrales et al., 2018). The smaller is
the value of the predictive power of a given data property, the higher is the independency
of the property to that label. The filter method removes independent data properties
(Corrales et al., 2018). If some data properties have predictive powers higher than a
chosen threshold in the ranker search method, the filter method considers them dependent
to classification label. I used the chi-squared algorithm for the following reasons. This
algorithm facilitates the filter method to identify significant data properties during
training (Divyasree & Shely, 2018) and allows the filter method to identify properties that
are important (Divyasree & Shely, 2018). The chi-squared algorithm measures the
predictive power between a data property and a label (Spencer et al., 2020). It allows the
filter method to recognize the dependence among two attributes (Moran & Gordon,
2019). The filter method is able to extract useful data properties by applying the chi-
squared algorithm, and it enables machine learning algorithms to categorize data
instances correctly (Rehman et al., 2019).
Information Gain Algorithm. The information gain algorithm evaluates data
properties according to a label by evaluating their importance (Ahmad et al., 2019). The
relevancy of each data property depends on information gain ratio. The higher the
information gain ratio, the higher is the worth, and therefore the evaluated property is
considered relevant and important for classification. The removal of data properties is
based on a predetermined threshold in the ranker search method. The filter method uses
the ranker search method to remove data properties below a given threshold. I used the
information gain algorithm for the following reasons. This algorithm is a common

97
algorithm for feature selection (Ahmad et al., 2019) which is simple and quick in contrast
to other techniques (Salo et al., 2018). This algorithm is based on the entropy, a famous
concept in the information theory domain (Siddique et al., 2017). An entropy represents
the calculation of uncertainty of a random data object (Yonghao et al., 2019).
Threshold for the Ranker Search Method. A threshold in the ranker search
method has the range of [0, 1]. I used the value of 0.5 as the threshold. Properties of
network traffics for DDoS attacks have a dynamic nature (Khalaf et al., 2019). As the
consequence, network traffic properties are not informative. Selecting network traffic
properties from a high dimensional data set is difficult (Manbari et al., 2019). The filter
method must retrieve properties with a appropriate threshold in the ranker search method.
Feature selection techniques have the goal of decreasing data dimensions from a high
dimensional data set (Henni et al., 2020). The value of 0.5 is the middle value of the
range of [0, 1] for the ranker search method. As the result, the predictive powers above
0.5 signify the relevancy of a data property to a category that is able to provide useful
information.
J48 Classifier. I applied the J48 classifier in the wrapper method for the
following reasons. It is able to deal with both alphabetical and numeric data (Onye et al.,
2018). This classifier divides data properties according to the information gain ratio that
is the highest (Srivastava et al., 2019) and allocates data properties to its branches
correctly (Panigrahi & Borah, 2018b). This may lead to high accuracy of the wrapper
method by assessing network traffic data.

98
Naïve Bayes Classifier. I applied the Naïve Bayes classifier in the wrapper
method for the following reasons. This classifier is the simplest form of the conditional
probability model based on the Bayesian network (Liangjun et al., 2020). The Naïve
Bayes classifier is well known (Shenglei et al., 2020) that utilizes the relative frequency
(Zhen et al., 2020) for probability estimation (Zhen et al., 2020). Features with high
probability values may increase the performance of the wrapper method.
Scale of Measurement
The scale of measurement was ratio. The WEKA workbench involves applying
mechine learning algorithms (Ali & Hamed, 2018). These algorithms represent data
mining techniques for prediction using probability. The WEKA workbench is for data
mining purposes (Kiranmai & Laxmi, 2018). Data mining is through use of data analysis
tools with capabilities based on probability and statistical measures (Kiranmai & Laxmi,
2018). The WEKA workbench produces prediction results in ratio. The prediction
elements are false positive (FP), false negative (FN), true positive (TP), and true negative
(TN) (Verma & Ranga, 2018b). FP is the number of instances that machine learning
algorithms predict incorrectly as attacks (Verma & Ranga, 2018b). FN is the number of
instances that machine learning algorithms predict incorrectly as benign events (Verma &
Ranga, 2018b). TP is the number of instances that machine learning algorithms predict
correctly as attacks (Verma & Ranga, 2018b). TN is the number of instances that
machine learning algorithms predict correctly as benign events (Verma & Ranga, 2018b).
Metrics such as false positive rate and accuracy involve applying these prediction

99
elements to produce resulting ratios accordingly. Therefore, ratio was the only
appropriate scale of measurement in this study.
Appropriateness of WEKA Workbench
The WEKA workbench was appropriate in this study. This tool provides the
settings for knowledge discovery (Kiranmai & Laxmi, 2018). The WEKA workbench
enables data preprocessing, clustering, and classification (Naik & Samant, 2016). These
three steps were the main concerns of this study in the knowledge dicovery process in
detecting DDoS attacks. This tool provides the opportunity for testing machine learning
algorithms (Ali & Hamed, 2018).
Instrument Administration
The instrument administration was through launching the WEKA workbench.
This tool comprises “machine learning algorithms, data pre-processing, and visualization
tools” (Fynn & Adamiak, 2018, p. 86) and allows conducting classification process
(Surameery & Hussein, 2017). Classification enables the application of machine learning
algorithms for training and prediction related to data mining tasks (Aksu & Doğan,
2019).
Description of Score Calculation
I applied the SOM and k-means algorithms to produce the feature weights of
network traffic data between the clusters for DDoS and BENIGN labels. I used the SOM
algorithm for the following reasons. It can analyze large data (Eslami et al., 2017). The
SOM algorithm is able to cluster data properties with no prior knowledge of data input
clusters (Verma & Ranga, 2018a). Distinctive representation of a feature vector has the

100
capability to sustain the topology of an input space (Khalifa et al., 2019). I used the k-
means algorithm for the following reasons. This algorithm is an efficient algorithm
(Chunyong et al., 2017), is a famous algorithm (Alguliyev et al., 2019), and can handle
large data (Sangve & Kulkarni, 2017).
I used the chi-squared score and information gain ratio in the filter method and the
accuracy of the J48 and Naïve Bayes classifiers within the wrapper method to produce
the predictive powers for selecting appropriate network traffic properties. The curse of
dimensionality lowers the performance of DDoS attack detection methods that use
unsupervised learning algorithms (Idhammad et al., 2018b). This problem is as the result
of redundant data properties (Salimi et al., 2018). A dimensionality reduction process is
crucial for the clustering method (Mohamed, 2020). It gets rid of redundant properties
(Henni et al., 2020) and can enhance the accuracy (Manbari et al., 2019). A
dimensionality reduction process eliminates unsuitable features (Visalakshi & Radha,
2017) and may enhance the “generalization performance” (Xiaojuan et al., 2018, p. 595) .
I used the false positive rate metric for enabling the calculation of false positive
rates of DDoS attack detection methods. The false positive rate metric produces the ratio
between the number of misclassified normal events and the total number of normal
events (Yonghao et al., 2019). The objective of the false positive rate metric is to
calculate the performance of DDoS attack detection methods to recognize attacks (Khalaf
et al., 2019). This metric is able to evaluate the effectiveness of DDoS attack detection
method (Idhammad et al., 2018b).

101
Description of Feature Weight Calculation of the SOM
The SOM algorithm will initialize weights by picking random data values in the
dimensional feature space (Kamath & Choppella, 2017, p. 115). Subsequently, based on
Kamath & Choppella (2017), in the competition phase of the SOM algorithm, the
neurons will compute their distance. According to Quang-Van et al. (2021), the winning
neuron has the closest distance to a randomly input vector chosen by the SOM algorithm.
According to Kamath and Choppella (2017), the formula of this distance function is
below, where d is a distance at the position of j for a given feature vector, x is a data point
at the position of i, w is the weight of a neuron at the lattice position of (j, i), and n is the
number of iterations. This step is the intra-class analysis. It represents the distance of data
points among classes.
In the cooperation phase, the winning neurons will calculate their best position in
their neighborhood topology (Kamath & Choppella, 2017). According to Hongrui et al.
(2017), the neighborhood size like the winning neuron becomes small. Based on Kamath
and Choppella (2017), the presentation of the formula is shown below, where I(x) is the
winning neuron at the lattice position, and S in the numerator of the exponent function
represents the distance. According to Kamath and Choppella (2017), the denominator
within the exponent function represents the neighborhood size at a given t iteration

102
number. This formula or step performs the inter-class analysis. It presents the distance of
data points within classes.
Kamath and Choppella (2017) mentions that the SOM algorithm uses an
exponential decay function. Based on Kamath and Choppella (2017), this function
decreases a given neighborhood size (distance) through iterations. The formula is as
follows, where, according to Natita et al. (2016), σₒ is the initial learning rate, t is the
iteration number, and τₒ is the number of iterations.
The adaptive phase is the “learning process” (Akinduko et al., 2016, p. 214).
Based on Kamath and Choppella (2017), during this phase, the winning neurons will
decrease their distance considering neighboring neurons, and their topological weights.
Afterward, the algorithm will update the weight of winning neuron, and its neighboring
neurons (Kamath & Choppella, 2017). According to Kamath & Choppella (2017), the
formula for the adaptive phase is below, where (t) is the learning rate similar to
exponential decay function. In this case, the winning neuron and its neighboring neurons
incline to modify their weights toward input patterns (Akinduko et al., 2016). This step
enables the preservation of the topology that this algorithm produces.

103
Description of Feature Weight Calculation of the K-means
The k-means algorithm initializes cluster centroids (Sangve & Kulkarni, 2017)
randomly (Hailun et al., 2019). Afterward, the iteration occurs in two steps (Sangve &
Kulkarni, 2017). The first step performs intra-cluster analysis and the second step
performs inter-cluster analysis. According to Kamath and Choppella (2017), the formula
for the intra-cluster analysis is given below, where k is the number of cluster centroids, x
is an input feature (data point) at the position of j, and average(x) is the average of the
whole feature vector.
According to Sangve and Kulkarni (2017), the formula for the inter-cluster
analysis is below, where c is the number of data points within a cluster, x is an input
feature at the position of i, and average(c) is the average of centroids within a cluster,
given the respective iteration. Based on Mehrotra et al. (2017), this algorithm involves
computing the centroid value of each cluster and updating the same value through
iterations, after re-associating each data point to the centroid of the current cluster.
Consequently in the next step, the algorithm adjusts the centroid of the respective
cluster to the average that is calculated based on the analysis within the cluster (Sangve &
Kulkarni, 2017). Using the k-means algorithm, if there are two groups, and the centroids

104
of the two groups are nearest to data points within the groups, no more change occurs
(Mehrotra et al., 2017). According to Sangve and Kulkarni (2017), the learning process
of the k-means algorithm is as follows.
Description of Predictive Power Calculation of the Chi-Squared
The chi-squared algorithm performs a statistical test to compute a feature
deviation from the estimated distribution (Corrales et al., 2018). This algorithm measures
the worth of a feature according to a class (Corrales et al., 2018). According to Ikram and
Cherukuri (2017), the formula for the chi-squared algorithm is presented below. If t is an
attribute, and c is a label; then, A is the number of t occurrence with c, B is the number of
t occurrence without c, C is the number of c occurrence without t, D is the number of
times that c and t do not occur, and N represents the total data instances (Ikram &
Cherukuri, 2017). The computed value is a chi-squared score in determining the worth of
a feature.
Description of Predictive Power Calculation of the Information Gain
The information gain algorithm enables the filter method to choose network
traffic properties according to classes (Ahmad et al., 2019). This algorithm involves
expressing relevancy between a data property and its type (Tunç, 2019). The relevancy of
each network traffic property will be based on the information gain ratio. The higher, the
information gain ratio of a given network traffic property, the higher will be the

105
relevancy of the property to the respective class. According to Ahmad et al. (2019), the
presentation of information gain is shown below, where n is the number of classes, and pi
is the probability of selecting a data point from the class of position i.
Description of Performance Score Calculation of the Wrapper method
The wrapper method depends on the performance of the J48 and Naïve Bayes
classifiers to remove irrelevant network traffic properties. This method uses the accuracy
of these classifiers to evaluate network traffic properties. It tries to enhance the accuracy
of the J48 and Naïve Bayes classifiers to predict network traffic data. The accuracy of
these classifiers chooses a subset of network traffic properties. The accuracy is the ratio
of the number of occurrences of the true negative and true positive divided by the entire
size of a dataset (Binbusayyis & Vaiyapuri, 2019). Based on Verma & Ranga (2018b),
the metric of accuracy is presented below, where TP is the number of occurrences of the
true positive, TN is the number of occurrences of the true negative, FP is the number of
occurrences of the false positive, and FN is the number of occurrences of the false
negative.
Description of False Positive Rate Calculation
I used the false positive rate to measure the effectiveness results of DDoS attack
detection methods. The false positive rate is the ratio among the number of misclassified
events that are benign and the total number of benign events (Yonghao et al., 2019). The

106
objective of the false positive rate metric encompasses the evaluation of the effectiveness
of DDoS attack detection methods in recognizing attacks (Khalaf et al., 2019). The metric
of FPR is presented below, where according to Yonghao et al. (2019), FP represents the
number of occurrences of the false positive, and TN represents the number of occurrences
of the true negative.
Reliability and Validity Properties of the WEKA Workbench
The first property that makes the WEKA workbench reliable and valid is that this
tool has a modular and extensible architecture for enabling data mining procedures
(Pereira et al., 2017). The second property that makes this tool reliable and valid is that
the WEKA workbench is one data mining tool that involves applying capabilities of
database utilities (Kiranmai & Laxmi, 2018). The WEKA workbench encompassess the
presumption that a provided dataset is a flat file or a relational dataset (Ali & Hamed,
2018). This tool facilitates the analysis of data as one relational table (Pereira et al.,
2017). The third property of this tool is its statistical analysis capabilities. It is a software
package that conducts data mining projects (Aksu & Doğan, 2019). This tool applys
mechine learning algorithms (Ali & Hamed, 2018). These algorithms construct statistical
models (Hussain et al., 2016). Through statistical analysis capabilities, the WEKA
workbench is able to provide probabilistic measures to forecast events. As the result, the
WEKA workbench would be able to ensure internal validity. Internal validity is the
indication that manipulation of intended methods or variables will actually result in
observed changes of the experimentation in this study.

107
Predictive and Conclusion Validities
I used the 10-fold cross validation evaluation method to ensure predictive validity
and conclusion validity in this experimentation. Predictive validity is the validation of
prediction ability of DDoS attack detection methods. It is the validation of occurrences of
the true positive and true negative resulted from applying these methods. Conclusion
validity validates type I error and type II error of these methods. Type I error represents
occurrences of the false positive while type II error represents occurrences of the false
negative resulted from applying these methods. Cross validation method is a “statistical
validation technique” (Sangeorzan, 2019, P. 484). It examines a “fixed number of folds”
(Sangeorzan, 2019, P. 484). Using the 10-fold cross validation, the method will be able to
hold each subsequent fold for testing, while training on other nine folds (Aksu & Doğan,
2019). The fundamental principle of the cross validation method is that this method
applies an “independent test set” (Anjum & Qaseem, 2019, p. 483) to assess the
performance, rather than training dataset (Anjum & Qaseem, 2019). The independent test
set evaluation will ensure that results are reflective of real scenarios.
Instrument Use and Access
The WEKA workbench is an open source software (Verma & Ranga, 2018b).
This tool is under “GNU general public license agreement” (Kiranmai & Laxmi, 2018, p.
5). The home web page for downloading the WEKA Workbench is
https://www.cs.waikato.ac.nz/.

108
Data Analysis
I used the research question in this study to examine whether adding the filter and
wrapper methods prior to the clustering method is effective in terms of lowering false
positive rates of DDoS attack detection methods. I identified one null hypothesis and one
alternative hypothesis. The null hypothesis was that adding the filter and wrapper
methods prior to the clustering method is not effective in terms of lowering false positive
rates of DDoS attack detection methods. The alternative hypothesis was that adding the
filter and wrapper methods prior to the clustering method is effective in terms of lowering
false positive rates of DDoS attack detection methods.
Analysis and Evaluation
I used the 10-fold cross validation method for evaluation. This method is time
efficient (Yuan et al., 2020), it decreases the chance of overfitting (Sharma et al., 2019),
and it reduces the learning model deviation via randomly dividing data (Yuan et al.,
2020). This method is able to construct a model through use of a training data, which
consequently, the method applies the model for a testing set to forecast labels (Kerbaa et
al., 2019).
I did not consider parametric and non-parametric statistical tests to evaluate
statistical significance among false positive rates of DDoS attack detection methods. The
10-folds cross validation method was able to validate the results of this study. The 10-
fold cross validation method performs 10 evaluations of a dataset (Wei & Wenfeng,
2020). This method validates each fold independently (Rooij & Weeda, 2020). The 10-
folds cross validation mthod is a common method for prediction evaluation of machine

109
learning algorithms to introduce low bias (Kerbaa et al., 2019). Therefore, this study did
not require any statistical significance testing. I examined whether adding the filter and
wrapper methods to the clustering method is effective to lower false positive rates of
DDoS attack detection methods.
Data Cleaning
The data preparation phase of the CRISP-DM framework involves enabling a data
cleaning process to be established (Michalak & Gulak-Lipka, 2017). It encompasses
fixing and arranging data (Castro et al., 2019, p. 77). Data cleaning is the process of
correcting or removing incorrect data (Manimekalai & Kavitha, 2018). This process does
not let to the construction of an incorrect model (Manimekalai & Kavitha, 2018).
The first problem of the CICIDS2017 dataset is that it has 6 data properties that
are not appropriate in DDoS attack detection modeling. Chongzhen et al. (2021) state 5 of
these data properties. These data properties are Flow ID, Source IP, Source Port,
Destination IP, and Time stamp (Chongzhen et al., 2021). These data properties impact
the capability of machine learning algorithms to build models for generalization
(Chongzhen et al., 2021). The Destination Port is another one. D’ Hooge et al. (2019)
reflect on the Flow ID, Source IP, Source Port, Destination IP, and Destination Port in
being redundant. Features influence learnability of machine learning algorithms (Lamba
et al., 2018). Consequently, I removed these 6 attributes.
The second problem of the CICIDS2017 dataset is that the dataset does not have
normalized attribute values. Some data properties are in a varied range between the
maximum and minimum values in the CICIDS2017 dataset (Chongzhen et al., 2021).

110
These data properties are not appropriate for processing (Chongzhen et al., 2021).
Nevertheless, normalization requires numeric data cleansing process for values of
attributes that are too far away from a specified range. Normalization has vulnerability
with outliers (Xi et al., 2016).
The third problem is that the CICIDS2017 dataset has one attribute named Flow
Bytes that misses values in four places, or within four data instances. The Flow Bytes
attribute represents the number of bytes in every second in the flow transition of network
traffics (Lopez et al., 2019). Machine leaning algorithms do not accept null values
(Abdulraheem & Ibraheem, 2019). Therefore, missing values are invalid.
The fourth problem is that the CICIDS2017 is not balanced, as it has 128,027
DDoS attack data instances and 97,718 BENIGN data instances. This dataset is inclined
to have class disproportion (Panigrahi & Borah, 2018a). The unbalanced data leads an
inaccurate model to be generated to prefer DDoS attack data instances than benign data
instances. Unbalanced data causes learning techniques to favor in learning from large
network traffic data instances in identifying attacks (Abdulraheem & Ibraheem, 2019).
This might cause to misrepresentation of the analysis in this study to identify effective
DDoS attack detection methods.
The fifth problem of the CICIDS2017 dataset is that DDoS attack data instances
in this dataset are alongside each other and benign data instances are together. This may
cause the 10-fold cross validation method to produce biased results. This method will
randomly partition network traffic data from this dataset into 10 equal partitions for
evaluation. This method utilizes the error rate (Aksu & Doğan, 2019). The error rate

111
function is sensitive to the balance of labels in each fold. Some folds might hold more
network traffic data instances of a label than another in having learning models to favor
them, and therefore resulting to inaccurate outcomes. Uneven data causes bias in
identifying attacks (Abdulraheem & Ibraheem, 2019).
Therefore, this study required the six steps of manual removal of the six attributes
of Flow ID, Source IP, Source Port, Destination Port, Destination IP, and Time stamp;
numeric data cleansing; normalization; data imputation; correction of unbalanced data;
and randomization. This data cleaning process in this study would not allow an incorrect
DDoS attack detection model to be generated. Figure C1 in Appendix C presents the
entire mapping diagram that will include the six steps of the proposed data cleaning
process. This research justified these steps further below.
Manual Attribute Removal
The CICIDS2017 dataset contains 6 features that are not suitable for DDoS attack
detection modeling. Chongzhen et al. (2021) state 5 of these features. These features are
Flow ID, Source IP, Source Port, Destination IP, and Time stamp (Chongzhen et al.,
2021). These features impact learning ability of machine learning algorithms for
generality (Chongzhen et al., 2021). They bias models to a particular dataset (Chongzhen
et al., 2021). This is for the following reason. The 10-fold cross validation method
performs the calculation of the prediction error (Rooij & Weeda, 2020). Features have the
ability to impact learning models of machine learning algorithms (Lamba et al., 2018),
and learning models are prediction models. The Destination Port is another similar one,
based on the study by Chongzhen et al. (2021) that mentioned the Source Port attribute.

112
In another study, D’ Hooge et al. (2019) mention that Flow ID, Source IP, Source Port,
Destination IP, and Destination Port are considered to be redundant. Therefore, I
removed the 6 attributes of Flow ID, Source IP, Source Port, Destination IP, Destination
Port and Time stamp before applying the subsequent data cleaning steps explained and
justified below in facilitating DDoS attack detection modeling.
Numeric Data Cleansing
The NumericCleaner procedure applies data cleaning on network traffic feature
values that are either too large or too small from given minimum and maximum
thresholds, and it sets the values to a predefined default value. NumericCleaner procedure
will set the data values to -1.7976931348623157E308 or 1.7976931348623157E308 for
the values that are beyond this range. These are the default values predetermined by the
weka. The weka workbench provides the settings for extracting patterns (Kiranmai &
Laxmi, 2018). This tool provides the opportunity for assessing machine learning
algorithms (Ali & Hamed, 2018). Extracting useful information in data mining projects is
by using data analysis tools with capabilities based on probability and statistical measures
(Kiranmai & Laxmi, 2018).
I used the NumericCleaner procedure for the following reasons. Normalization is
the most important step of pre-processing (Ramasamy & Kandhasamy, 2018). It
guarantees that both input and output data have distribution that is alike (Cakir &
Konakoglu, 2019) and data is comparable (Eesa & Arabo, 2017). However, based on Xi
et al. (2016), normalization method creates problems for data mining tools. When
unobserved data is not in the range of observed data, the scaled values will be outside of

113
the range of [0, 1] in leading the normalization method to cause problems for applications
(Xi et al., 2016). Without normalization, it would be difficult to perform computation and
comparison analysis among unscaled data (Pandey & Jain, 2017). The NumericCleaner
procedure enabled the normalization process of the CICIDS2017 dataset.
Data Normalization
The min-max and z-Score algorithms are two procedures of normalization
method. The min-max algorithm deducts the current value of a network traffic property
by a given minimum value (Chiba et al., 2019). Next, the algorithm divides the resulting
value by the difference that exists among the maximum and minimum values (Chiba et
al., 2019). The z-Score algorithm involves the use of mean and standard deviation to
normalize data values (Cakir & Konakoglu, 2019).
I used the min-max algorithm for the following reasons. This algorithm scales
data in a new range (Cakir & Konakoglu, 2019). It tries to fit data into a specific interval
(Manimekalai & Kavitha, 2018). This gives assurance that network traffic data will be
comparable. This is because normalization retains the relations that exist in original data
values (Folorunso et al., 2018). The min-max algorithm is the most well-known
algorithm to perform normalization (Santoso et al., 2018).
I did not use the z-score algorithm. The min-max algorithm is desirable over the
z-score algorithm (Kanagaraj et al., 2020). The z-score algorithm is appropriate for
scenarios that minimum and maximum values cannot be known (Bílge & Yargiç, 2017).
This algorithm is suitable for data sets that present data objects with uninterrupted order.
It will normalize data to follow its original data pattern (Bui & Duong, 2016). Therefore,

114
the z-score algorithm is not suitable for network traffic datasets. Network traffic datasets
do not follow time series data patterns that have uninterrupted orders. The z-score
algorithm encompasses the assumption that data has a distribution that is normal
(Shahriyari, 2019). Normal distribution represents uninterrupted data distribution.
Data Imputation
The EM and mean algorithms are two procedures of data imputation method. The
EM algorithm is an iterative process that imputes the beginning missing value
approximations using a regression model that includes a random error (Kalkan et al.,
2018). During the next step, this algorithm performs the computation of the covariance
matrix and a series of average scores (Kalkan et al., 2018). The covariance matrix
generalizes the variance among two network traffic data points to several dimensions.
Afterward, this algorithm uses the covariance matrix and average scores to estimate the
missing values, in subsequent regression model (Kalkan et al., 2018). Based on Kalkan et
al. (2018), this algorithm uses the last imputed values for replacing missing values. The
mean algorithm involves substituting missing values with average, median, or mode
(Jadhav et al., 2019).
I used the EM algorithm and I disregarded the mean algorithm. The collection of
network traffic data for the CICIDS2017 dataset was by using the CICFlowMeter which
is a flow-based network feature extractor (Sharafaldin et al., 2018). Based on Sharafaldin
et al. (2018), The CICFlowMeter has the capability to extract 80 flow-based network
traffic properties. This may result data properties to miss values at random. The EM
algorithm is effective to address missing values at random for realistic data sets (Malan et

115
al., 2020). It involves the assumption that missing values have linear association to the
observed data (Casleton et al., 2018). This algorithm predicts missing values using
known distribution probability of data points that is obtained from its maximum
likelihood estimation function (Junsheng et al., 2020).
I did not use the mean algorithm. This algorithm generates the same value for all
missing values of a feature (Casleton et al., 2018). The mean algorithm disregards
“feature variances” (Youngdoo & Wonjoon, 2020, p. 2), and it can result in biased
estimated data values (Tianhong et al., 2018).
Correction of Unbalanced Data
The CICIDS2017 dataset has class disproportionality (Panigrahi & Borah, 2018a).
The spreadsubsample and SMOTE are two procedures that correct unbalanced data. The
spreadsubsample procedure is of the type of the RUS method that reduces network traffic
data instances from majority class. The SMOTE procedure is of the type of the ROS
method that based on Salunkhe & Mali (2018) increases network traffic data instances of
minority class. In this study, the majority class was the DDoS label or category, and the
minority class was the BENIGN label.
I used the spreadsubsample procedure. This procedure is able to balance the data
based on a maximum spread that exists among majority and minority labels (Mishra et
al., 2020). This algorithm applies systematic procedure (Dag et al., 2017) and randomly
removes data instances from majority class (Bashir et al., 2019).
I did not use the SMOTE procedure. It is of the type of the ROS method that leads
to overfitting problem (Pes, 2020). It leads to generation of artificial data instances based

116
on similarities among data instances of the minority class (Yafei & Ya, 2020). This
procedure does not select data instances of minority class through uniform randomness as
it prioritizes the data instances that are close to the borders of classes based on distributed
weights (González et al., 2019). This procedure calculates the weights for every data
instance as the ratio of data instances of a different label (González et al., 2019).
Randomization
I used the Randomize procedure to perform the randomization of the data
instances within the CICIDS2017 dataset, as I applied the 10-fold cross validation
method to evaluate the results. The 10-fold cross validation method is able to divide a
data set into 10 independent subsets (Yuan et al., 2020). The CICIDS2017 dataset has
DDoS attack data instances alongside each other, and it has benign data instances
alongside each other. The 10-fold cross validation method might have produced biased
results, if I would not have randomized the data. Some folds might have contained data of
the same label in the course of the execution time. The K-fold cross validation method
can produce unacceptable high evaluation variance among folds (Airola et al., 2019).
Each fold that the 10-fold cross validation method generates should be representative of
the entire dataset (Aksu & Doğan, 2019). The 10-fold cross validation method measures
the prediction error (Rooij & Weeda, 2020). Prediction is susceptible to the balance of
data instances in each fold. The data that is uneven causes learning techniques to lean
toward large network traffic data instances for learning in attacks recognition
(Abdulraheem & Ibraheem, 2019). This method might cause bias toward the majority
class for generating prediction error of each fold. Training set and testing set treated by

117
the 10-fold cross validation should comprise most of the classes that the CICIDS2017
dataset holds.
Data Analysis Validation
I used the 10-fold cross validation method to validate the results. This method is
able to have two data sets, in which one will be the calibration (training) set and the other
will be the validation (testing) set (Rooij & Weeda, 2020). It shifts evaluation between a
training set and a testing set in a cyclic approach (Wei & Wenfeng, 2020). This method
treats each fold as a testing set while it trains on the remaining sets (Kerbaa et al., 2019).
Study Validity
I used the WEKA workbench to ensure internal validity. There is no threat to
internal validity using this tool as it is reliable. This tool provides the settings for
extracting useful information (Kiranmai & Laxmi, 2018). The WEKA workbench has an
architecture that is modular and extensible for facilitating the process of data mining
(Pereira et al., 2017). It includes capabilities of utilities that databases have (Kiranmai &
Laxmi, 2018). The WEKA workbench encompasses the supposition that a provided
dataset is a relational dataset (Ali & Hamed, 2018). Also, this tool has statistical analysis
capabilities. The WEKA workbench involves the utilization of machine learning
algorithms (Ali & Hamed, 2018, p. 234). These algorithms build statistical models
(Hussain et al., 2016).
One threat to conclusion and predictive validities is that the CICIDS2017 dataset
is unbalanced. The CICIDS2017 has 128,027 DDoS attacks data instances and 97,718
BENIGN data instances. When machine learning algorithms are trained on an unbalanced

118
data set, they incline to learn from large network traffic data instances for detecting
attacks (Abdulraheem & Ibraheem, 2019). Each fold generated by the 10-fold cross
validation method has to be representative of the entire dataset that is being used for
analysis (Aksu & Doğan, 2019).
I used the spreadsubsample procedure to address the threat of unbalanced data to
conclusion and predictive validities. This procedure is able to eliminate data instances
from the majority class (Fotouhi et al., 2019). This procedure represents the
implementation of the RUS method. The spreadsubsample procedure reduces network
traffic data instances of the the majority class until they are equal with the data instances
with the minority class. The spreadsubsample uses distribution spread value of 1 to
balance the data. The balanced data instances increase the effectiveness of learning
algorithms (Salunkhe & Mali, 2018). The RUS method is the best method that is effective
(Viloria et al., 2020).
The second threat to conclusion and predictive validities is that the CICIDS2017
dataset has DDoS attack data instances alongside each other and benign data instances
together. I used the Randomize procedure to accomplish the randomization of the data
instances in preventing this threat. If I would not have conducted randomization, some
folds might have resulted to have more data of the same class in the course of the
execution time. The K-fold cross validation method may result in generating improper
evaluation variance among folds (Airola et al., 2019). Each fold in the 10-fold cross
validation method must represent the whole dataset that is being assessed (Aksu &
Doğan, 2019). The 10-fold cross validation method calculates the prediction error (Rooij

119
& Weeda, 2020). Prediction has vulnerability to the balance of data instances in each
fold. The data that is imbalanced causes learnability of machine learning algorithms in
the direction of large network traffic data instances in attacks recognition (Abdulraheem
& Ibraheem, 2019).
I did not conduct external validity. I used the entire CICIDS2017 dataset that is
the population of this study. The dataset comprises the capture of network traffics from
the analysis of the CICFlowMeter (Lopez et al., 2019). This tool is able to retrieve upto
80 flow-based network traffic properties (Sharafaldin et al., 2018). Network traffic flow
transmit network traffic data packets from a source IP and port to a destination IP and
port (Lopez et al., 2019). Also, the CICIDS2017 dataset comprises the information of
normal traffic data and DDoS attack traffic data. The capture of normal network traffics
was on Monday of July 3rd, 2017, and the capture of DDoS attack traffic data was on
Friday of July 7th, 2017 (Chiba et al., 2019). Correspondingly, extracting network traffic
data was established using realistic criteria (Prasad, et al., 2019). The dataset represents
the friday afternoon DDoS attacks through Low Orbit Ion Canon to transmit UDP, TCP,
or HTTP network traffic requests to the victims’ systems (Chiba et al., 2019). Likewise,
features greatly impact learnability of machine learning algorithms (Lamba et al., 2018).
Therefore, this study did not require sampling the CICIDS2017 dataset, in which, the
external valility might have been considered essential to be conducted.
Summary and Transition
A problem of DDoS attack detection methods based on the clustering method is
the curse of dimensionality that impacts their effectiveness to distinguish between attacks

120
and normal network traffic data. In high dimensional network traffic data sets, the
calculation of the learning processes of unsupervised DDoS attack detection methods
produces homogenized feature weights, which is known as the curse of dimensionality
(Idhammad et al., 2018b). The clustering method is not able to perform effectively to
categorize high dimensional data (Yuanjie et al., 2020). My purpose, in this study, was to
decide whether the incorporation of the filter and wrapper methods prior to the clustering
method is effective in reducing false positive rates of DDoS attack detection methods
based on the clustering method. I directed the study to prevent the generation of equal
feature weights among clusters in identifying effective DDoS attack detection methods.
In this chapter, I presented the purpose statement in identification of effective
DDoS attack detection methods and explained my role in this study. I expanded on
explaining the use of quantitative method and the ex post facto phase design of A-B-A-
BC single-group; and I presented justification for the use of the CICIDS2017 dataset.
Likewise, I provided an ethical research statement and presented the details of the
instrumentation, data analysis, and study validities of this study.
The next step was conduction of the experimentation, which I incorporated the
filter and wrapper methods prior to the clustering method. I performed comparison
analysis of false positive rates between DDoS attack detection methods using the ex post
facto phase design of A-B-A-BC single-group. I presented the findings with explanation
on the usefulness of the findings to the professional IT practices, and their implications to
the social change along with recommendations for IT action and future research.

121
Section 3: Application for Professional Practice and Implications for Social Change
Introduction
The purpose of this research was to determine whether incorporating the filter and
wrapper methods prior to the clustering method is effective in lowering false positive
rates of DDoS attack detection methods. I considered the entire network traffic data of
the CICIDS2017 dataset. After the data cleaning process, the network traffic data was
normalized, balanced, and randomized, with no missing value. The resulting data set had
97,718 data instances for the DDoS label, and it had 97,718 data instances for the
BENIGN label.
The DDoS attack detection methods that involved incorporating the SOM and k-
means clustering algorithms without any dimensionality reduction process produced the
false positive rates of 0.191 and 0.172 in detecting attacks respectively. The DDoS attack
detection method that involved applying the SOM algorithm along with incorporating the
filter and wrapper methods using the chi-squared algorithm and Naïve Bayes classifier in
network traffics feature evaluation produced lowest false positive rate of 0.013 in
detecting DDoS attacks. The DDoS attack detection methods that involved applying the
SOM and k-means algorithms along with incorporating the filter and wrapper methods
using the information gain algorithm and Naïve Bayes classifier in evaluating features
produced the second lowest false positive rate of 0.014 in attacks detection. The DDoS
attack detection method that involved applying the SOM algorithm with the filter and
wrapper methods using the chi-squared algorithm and J48 classifier in feature evaluation
generated the third lowest false positive rate of 0.016 in DDoS attacks detection. That

122
means that addition of the filter and wrapper methods to the clustering method can be
effective for DDoS attack detection methods in detecting attacks.
Presentation of Findings
Describing Evaluation and Variables
Evaluation Method and Purpose of Examination
I used the 10-fold cross validation method to evaluate the DDoS attack detection
methods. The 10-fold cross validation method divides a data set into 10 subsets that are
independent (Yuan et al., 2020). This method computes the prediction error (Rooij &
Weeda, 2020) and evaluates the performance (Anjum & Qaseem, 2019). The purpose of
evaluation in this study was to compare the false positive rates among DDoS attack
detection methods to identify effective ones. I compared the false positive rates between
DDoS attack detection methods that involved incorporating the clustering method and
DDoS attack detection methods that involved applying the filter method prior to the
clustering method. Subsequently, I compared the false positive rates between DDoS
attack detection methods that involved employing the clustering method and DDoS attack
detection methods that involved applying the filter and wrapper methods prior to the
clustering method.
Filter Method
The filter method chooses features without having to rely on machine learning
algorithms (Moran & Gordon, 2019). This method can prepare a subset of attributes that
is not dependent on learning models (Moran & Gordon, 2019). The chi-squared and
information gain are algorithms that the filter method uses to evaluate features. The chi-

123
squared algorithm computes the deviation of an attribute from the expected distribution
(Corrales et al., 2018). This algorithm generates the predictive power of an attribute
based on a label (Corrales et al., 2018). The lower this value is, the higher is the
independency of the attribute to the associated label. The filter method removes attributes
that are independent (Corrales et al., 2018). If some attributes generate lower predictive
powers than a given threshold in the ranker search method, the filter method considers
them independent.
The information gain algorithm performs evaluation of attributes based on labels
(Ahmad et al., 2019). This algorithm is based on the entropy that is well-established
within the domain of the information theory (Siddique et al., 2017) and is able to
recognize the importance of attributes (Ahmad et al., 2018). The importance of every
attribute is reliant on information gain ratio. The higher the information gain ratio is, the
higher is the significance of an attribute to a label. The filter method applies the ranker
search method to eliminate attributes that have information gain ratio lower than a given
threshold.
Threshold for the Ranker Search Method. A threshold in the ranker search
method has the range of [0, 1]. I used the value of 0.5. Network traffics attributes for
DDoS attacks are with a dynamic nature (Khalaf et al., 2019). Because of this, features of
network traffics are not informative. Choosing network traffic features from high
dimensional data is with difficulty (Manbari et al., 2019). Dimensionality reduction
involves the objective of reducing attributes from a high dimensional data set (Henni et
al., 2020). The filter method must select them through use of a threshold in the ranker

124
search method. The value of 0.5 is the middle value in the range of [0, 1] for the ranker
search method. Therefore values above 0.5 provide high predictability to categorize
network traffics data properties.
Wrapper Method
The wrapper method is an alternative approach for attribute evaluation. This
method is reliant on a learning model. This method uses the accuracy of a learning model
(Shu et al., 2020) and attempts to increase the accuracy of that classifier (Visalakshi &
Radha, 2017). The performance of that classifier is able to identify a subset of attributes
(Jadhav et al., 2018). The wrapper method is able to produce improved results in
performance than the filter method (Pragadeesh et al., 2019). The J48 and Naïve Bayes
are two classifiers that the wrapper method can use to evaluate attributes.
The J48 classifier is a decision tree learning algorithm. This classifier has the
implementation of the decision tree structure (Onye et al., 2018). It can handle both
alphabetical and numeric data (Onye et al., 2018). This classifier is able to divide
attributes according to the “highest information gain ratio” (Srivastava et al., 2019, p. 4),
and it can allocate them to branches correctly (Panigrahi & Borah, 2018b).
The Naïve Bayes classifier generates a model based on the conditional probability
to recognize the classes of data points based on a probability, in accordance to the
number of labels (Barki et al., 2016). This classifier is the simplest procedure of the
conditional probability model based on the Bayesian network (Liangjun et al., 2020). It
applies the “relative frequency” (Zhen et al., 2020, p. 40757) for estimating the
probability (Zhen et al., 2020).

125
Clustering Method
The clustering method classifies a data set in clusters (Sinaga & Miin-Shen,
2020). The clustering method is a famous unsupervised learning approach (Yonghao et
al., 2019). Similarity-based and distance-based cluster analyses classify a data set in
clusters. Similarity-based cluster analysis is able to perform maximization and
minimization of intra-class and inter-class similarities respectively (Anjum & Qaseem,
2019). The SOM algorithm is an algorithm of the clustering method that applies
similarity-based cluster analysis. Distance-based cluster analysis is able to perform
maximization and minimization of intra-cluster and inter-cluster distances. The k-means
algorithm is an algorithm of the clustering method that applies distance-based cluster
analysis. The two algorithms of SOM and k-means incorporate the Euclidean distance to
apply similarity-based and distance-based cluster analyses respectively. The Euclidean
distance computes the square root of the feature value variation between two data points
(Faizah et al., 2020).
DDoS Attacks Detection Methods
The curse of dimensionality is a problem of unsupervised DDoS attack detection
methods. The curse of dimensionality lowers the effectiveness of unsupervised DDoS
attack detection methods to precisely detect attacks (Idhammad et al., 2018b). In a high
dimensional network traffic data set, distance between data points becomes
inconsequential in having the learning process of an unsupervised DDoS attack detection
method to produce equal feature weights known as the curse of dimensionality
(Idhammad et al., 2018b). The curse of dimensionality is as the consequence of

126
redundancy in attributes (Salimi et al., 2018). DDoS attack detection methods that
involve incorporating the clustering method are unsupervised DDoS attack detection
methods. This method is not effective in grouping high dimensional data (Yuanjie et al.,
2020). The aim in this research was in determination of whether applying the filter and
wrapper methods prior to the clustering method is effective in lowering false positive
rates of DDoS attack detection methods by removing redundant features. DDoS attack
detection methods based on the clustering method consider the weights of network data
properties in classifying data points among categories. The process of categorizing data
points depends on center weights of network traffic data properties. In this
experimentation, the categorization produced two clusters for DDoS and BENIGN labels.
The cluster for DDoS label represented the categorized DDoS attack data instances. The
cluster for BENIGN label represented the classified benign data instances.
I used the ex post facto phase design of A-B-A-BC single-group. The A-B-A-BC
design provides the opportunity to administer an intervention, separately in the course of
the B phase, and with combination of a second intervention in the course of the BC phase
(Tanious & Onghena, 2019). This design allowed me to evaluate the filter, wrapper, and
the clustering methods across all examined DDoS attack detection methods in this study.
DDoS attack detection methods attempted to group data points under one category that
had higher feature weights than their center weights. These methods also attempted to
classify data points under another cluster that had lower feature weights than their center
weights. Not necessarily, DDoS attack detection methods categorized data points under
one cluster that had higher feature weights than their center weights. Likewise, not

127
necessarily, DDoS attack detection methods categorized data points under another cluster
that had lower feature weights than their center weights. The categorization depended on
the computation of the learning process of a DDoS attack detection method under
iterative process of the related cluster. The clustering method encompasses an analysis of
data objects to include them in one group with greater similarities and in another group
with smaller similarities (Zou, 2020). Appendix D presents 14 tables for the produced
center and feature weights of DDoS attack detection methods that applied filter, wrapper,
and the clustering methods.
Report of Results
Incorporation of Filter and Clustering Methods
The DDoS attack detection methods that involved incorporating only the SOM
and k-means clustering algorithms generated the false positive rates of 0.191 and 0.172 in
detecting attacks correspondingly. The DDoS attack detection methods based on the
SOM and k-means that involved applying the filter method using the chi-squared for
feature evaluating network traffic data of the CICIDS2017 dataset generated the same
false positive rates of 0.191 and 0.172 in detecting attacks accordingly. The DDoS attack
detection methods that involved incorporating the filter method using the information
gain for feature evaluation produced the false positive rate of 0.139 using the SOM, and
the false positive rate of 0.180 using the k-means. The Table E1, under Appendix E,
presents the false positive rates between DDoS attack detection methods that applied the
filter and the clustering methods in detecting attacks.

128
Incorporation of Filter, Wrapper, and Clustering Methods
With respect to incorporation of the filter and wrapper methods, the results
showed that using the information gain and Naïve Bayes prior to the SOM for feature
evaluation reduced the false positive rate from 0.191 to 0.014 in detecting attacks. The
DDoS attack detection method that involved adding the chi-squared and Naïve Bayes
preceded by the SOM decreased the false positive rate from 0.191 to 0.013. The DDoS
attack detection method that involved adding the chi-squared and J48 before the SOM
decreased the false positive rate from 0.191 to 0.016. However, addition of the filter and
wrapper methods preceded by the SOM procedure using the information gain and J48
increased the false positive rate from 0.191 to 0.214.
With respect to the DDoS attack detection method that involved applying the
information gain and Naïve Bayes preceded by the k-means algorithm from when only
the k-means was employed, it reduced the false positive rate from 0.172 to 0.014 in
detection attacks. The DDoS attack detection method that involved incorporating the chi-
squared and J48 compared to only when the k-means was applied, it decreased the false
positive rate from 0.172 to 0.108 in recognizing attacks. The DDoS attack detection
method based on the k-means clustering algorithms that involved applying the chi-
squared and Naïve Bayes produced the false positive rate of 0.211, and the one that
involved incorporating the information gain and J48 produced the false positive rate of
0.173. The Table F1, under Appendix F, displays the false positive rates between DDoS
attack detection methods that applied filter, wrapper, and the clustering methods in
detecting attacks.

129
Comparison Across DDoS Attack Detection Methods
The experimentation from this research showed that applying the filter and
wrapper methods prior to the SOM procedure using the information gain and J48 had the
worst performance with the false positive rate of 0.214, comparing to the time this
experimentation allowed for examination of the filter and the clustering methods. The
DDoS attack detection method that involved incorporating the chi-squared and Naïve
Bayes classifier preceded by the k-means algorithm had the second worst performance in
false positive rate among the rest. With respect to the filter method, implementation of
the chi-squared prior to the SOM had the third worst performance in false positive rate
among other DDoS attack detection methods. That means that implementation of the
filter and wrapper methods would not be effective in every DDoS attack detection
method implementation. The Table G1, under Appendix G, displays the false positive
rates across all DDoS attack detection methods. Appendix H presents 14 figures for the
produced false positive rates of DDoS attack detection methods that applied the filter,
wrapper, and the clustering methods.
Summary of Answers to the Research Question
Addressing High False Positive Rates of DDoS Attacks Detection Methods
The curse of dimensionality results in reducing the effectiveness of unsupervised
DDoS attack detection methods to recognize attacks (Idhammad et al., 2018b). In a high
dimensional network traffic data set that has numerous attributes, distance among data
points becomes inconsequential in leading the learning process of an unsupervised DDoS
attack detection method to generate equal feature weights which is the curse of

130
dimensionality (Idhammad et al., 2018b). The curse of dimensionality results from
redundancy in features (Salimi et al., 2018). Numerous attributes in high dimensional
data would be redundant (Yanfang et al., 2020). Dimensionality reduction gets rid of
redundant features (Henni et al., 2020), and it can enhance the performance of learning
models (Xiaojuan et al., 2018).
RQ
. Is adding the filter and wrapper methods prior to the clustering method
effective in terms of lowering false positive rates of DDoS attack detection methods?
I used the metric of false positive rate to identify effective DDoS attack detection
methods. The false positive rate metric encompasses the goal of measuring the
effectiveness of DDoS attack detection methods (Khalaf et al., 2019). This metric
evaluates their performance (Idhammad et al., 2018b).
The DDoS attack detection methods that used only the SOM and k-means
procedures were able to produce the false positive rates of 0.191 and 0.172 in attacks
identification. Likewise, the DDoS attack detection methods that involved applying the
filter method using the chi-squared prior to the procedures of the clustering method
produced the false positive rates of 0.191 and 0.172 in detecting attacks accordingly. That
means that the chi squared was not effective to reduce the false positive rates.
The DDoS attack detection methods that involved employing the filter method
using the information gain were able to result in the false positive rate of 0.139 using the
SOM and result in the false positive rate of 0.180 using the k-means. That means that the
DDoS attack detection method based on the SOM clustering procedure that involved
incorporating the filter method using the information gain procedure was more effective

131
than the ones that involved applying only the SOM and the chi-squared procedure as
well. That was not true in regard to the DDoS attack detection method based on the k-
means algorithm that involved incorporating the filter method using the information gain
procedure.
With regard to including the wrapper method besides the filter method preceded
by the clustering algorithms, results showed that using the information gain and Naïve
Bayes before the SOM was able to decrease the false positive rate from 0.191 to 0.014 in
detecting attacks. The DDoS attack detection method that involved applying the chi-
squared and Naïve Bayes prior to the SOM clustering algorithm was able to decrease the
false positive rate from 0.191 to 0.013. The DDoS attack detection method that involved
adding the chi-squared and J48 preceded by the SOM was capable to reduce the false
positive rate from 0.191 to 0.016. That means that applying the wrapper method in these
scenarios were effective to remove redundant features and increase the performance of
DDoS attack detection methods in identifying attacks. However, addition of the filter and
wrapper methods preceded by the SOM procedure using the information gain and J48
increased the false positive rate from 0.191 to 0.214 which was not effective.
The DDoS attack detection method that involved incorporating the information
gain and Naïve Bayes prior to the k-means algorithm in comparison to the application of
only the k-means, the method was able to decrease the false positive rate from 0.172 to
0.014 in detection attacks. The DDoS attack detection method that involved applying the
chi-squared and J48 in comparison to employing only the k-means, the method decreased
the false positive rate from 0.172 to 0.108 in recognizing attacks. That means that the

132
DDoS attack detection methods in these two scenarios were effective to eliminate
redundant features and enhance their performance. The DDoS attack detection method
based on the k-means clustering algorithms that used the chi-squared and Naïve Bayes
generated the false positive rate of 0.211, and the one that involved applying the
information gain and J48 was able to generate the false positive rate of 0.173. That means
that the DDoS attack detection method based on the k-means clustering algorithms were
not effective to reduce the false positive rates compared to when only the k-means was
employed.
I used the research question in this study to examine whether incorporating the
filter and wrapper methods prior to the clustering method is effective in terms of lowering
false positive rates of DDoS attack detection methods. I identified one null hypothesis
and one alternative hypothesis. The null hypothesis was that adding the filter and wrapper
methods prior to the clustering method is not effective in terms of lowering false positive
rates of DDoS attack detection methods. The alternative hypothesis was that adding the
filter and wrapper methods prior to the clustering method is effective in terms of lowering
false positive rates of DDoS attack detection methods.
I focused on the curse of dimensionality to address high false positive rates of
DDoS attack detection methods based on the clustering method. The curse of
dimensionality causes the reduction of the effectiveness of unsupervised DDoS attack
detection methods in recognizing attacks correctly (Idhammad et al., 2018b). In a high
dimensional network traffic data set that has a lot of data dimensions, distance among
data points will lead to be inconsequential in causing the learning process of an

133
unsupervised DDoS attack detection method to produce equal feature weights known as
the curse of dimensionality (Idhammad et al., 2018b). The curse of dimensionality exists
because of redundancy in features (Salimi et al., 2018). I incorporated the filter and
wrapper methods prior to the clustering method to administer feature reduction to remove
redundant attributes, and to identify effective DDoS attack detection methods using the
CICIDS2017 dataset.
Based on the results between the filter and clustering methods, addition of the chi-
squared was not effective to reduce the false positive rates in contrast to the time that
only the clustering method was applied. Similarly, addition of the information gain was
not effective to reduce the false positive rates in contrast to when the k-means clustering
algorithm was applied.
Likewise, incorporating the wrapper method was not effective for all DDoS attack
detection methods. Results from this research showed that applying the filter and wrapper
methods prior to the SOM procedure using the information gain and J48 had the
performance with the lowest false positive rate of 0.214 in comparison to when this study
examined the filter and clustering methods. The DDoS attack detection method that
involved employing the chi-squared and Naïve Bayes classifier preceded by the k-means
algorithm had the second worst performance with score of 0.211 in false positive rate
among all others using the filter and clustering methods. Implementing the information
gain procedure and J48 classifier preceded by the k-means algorithm was not effective, as
it was able to produce the false positive rate of 0.173 contrary to only the application of
the k-means that generated the score of 0.172 in false positive rate.

134
Therefore, based on the results of this experimentation, I could not disapprove the
null hypothesis that adding the filter and wrapper methods to the clustering method is not
effective in terms of lowering false positive rates of DDoS attack detection methods.
Consequently, I could not accept the alternative hypothesis that adding the filter and
wrapper methods to the clustering method is effective in terms of lowering false positive
rates of DDoS attack detection methods. Incorporating the filter and wrapper methods
preceded by the clustering method was not effective for every DDoS attack detection
methods.
Confirmation and Disconfirmation to the Existing Literature
The way that the findings confirm the literature and variables is as follows. In one
study, Gahar et al. (2019) stated that machine learning algorithms suffer from the curse of
dimensionality. In another study, Salimi et al. (2018) stated that redundant attributes will
cause the curse of dimensionality. Dimensionality reduction gets rid of redundant features
(Henni et al., 2020), and it is with the benefit of addressing the curse of dimensionality
(Kondo et al., 2019). Reducing features is essential for the clustering method (Mohamed,
2020). Based on the results of the experimentation in this study, incorporating the filter
and wrapper methods using the chi-squared algorithm and Naïve Bayes classifier in
network traffics feature evaluation prior to the SOM procedure was most effective with
the false positive rate of 0.013 in DDoS attack detection. The application of the filter and
wrapper methods using the information gain algorithm and Naïve Bayes classifier in
assessing features prior to the SOM and k-means procedures presented the second
effective DDoS attack detection methods respectively, with the false positive rate of

135
0.014 in attacks detection. The DDoS attack detection method that involved employing
the SOM procedure through the application of the filter and wrapper methods using the
chi-squared algorithm and J48 classifier for attribute assessment was able to produce the
third lowest false positive rate of 0.016 in DDoS attack detection. That means that
addition of the filter and wrapper methods to the clustering method was effective and
essential to eliminate redundant features from the CICIDS2017 dataset to prevent the
generation of equal feature weights and allow the DDoS attack detection methods to
perform well in comparison to applying only the clustering method.
The way that the findings disconfirm the literature and variables is as follows. In
one study, Idhammad et al. (2018b) stated that the curse of dimensionality lowers the
effectiveness of unsupervised DDoS attack detection methods to identify attacks
correctly. Xiaojuan et al. (2018) articulated that feature reduction has the ability to
enhance the performance. The results of this study showed that implementation of the
chi-squared algorithm prior to both the SOM and k-means procedures is not able to lower
the false positive rates of DDoS attack detection methods. Implementation of only the
information gain was effective for the DDoS attack detection method using SOM, by
decreasing the false positive rate from 0.191 to 0.139. This was not true in the case of the
k-means implementation as it generated the false positive rate 0.180. Applying the filter
and wrapper methods prior to the SOM procedure using the information gain and J48
lowered the effectiveness by increasing the false positive rate from 0.191 to 0.214 in
comparison to only the use of the SOM. This was the highest false positive rate among
the rest of the DDoS attack detection methods. The DDoS attack detection method that

136
involved applying the chi-squared and Naïve Bayes classifier prior to the k-means
algorithm produced the second highest false positive rate of 0.211 among all the
examined DDoS attack detection methods. Implementing the information gain procedure
and J48 classifier preceded by the k-means algorithm was not effective by producing
false positive rate of 0.173 in comparison to only the use of the k-means with the false
positive rate of 0.172. That means application of the filter and wrapper methods prior to
the clustering methods using these mentioned procedures and classifiers in these cases is
not effective to lower false positive rates of DDoS attack detection methods.
In the study that was conducted by Idhammad et al. (2018b) to address the curse
of dimensionality of unsupervised learning algorithms using the k-means algorithm, they
introduced a co-clustering method through analysis of proper network traffic attributes
that involved applying information gain ratio using entropies of network traffic data to
improve perfomance in detecting DDoS attacks. The results of the research by Idhammad
et al. (2018b) showed that using the NSL-KDD dataset, the implemented method
achieved the false positive rate of 0.33%, it achieved the false positive rate of 0.35%
using the UNB ISCX 12 dataset, and it obtained the false positive rate of 0.46% using the
UNSW-NB15 dataset. In one study, Yonghao et al. (2019) applied the filter method by
incorporating the symmetric uncertainty prior to the k-means procedure in achieving the
false positive rate of 0.30% using the CICIDS2017 dataset. Based on Fahad et al. (2020),
the symmetric uncertainty procedure is a correlation-based approach that the filter
method uses to select appropriate features. This procedure is more effective than the
information gain to remove the attributes that are redundant (Fahad et al., 2020). In

137
another study, when Hajisalem and Babaie (2018) applied the filter method using the
CFS procedure in their study to evaluate network traffic features, they were able to
reduce the false positive rate in detecting attacks to the lowest of 0.13% using the
UNSW-NB15 dataset.
In one research, Mohammadi et al. (2019) examined the false positive rates of
intrusion detection methods that applied the wrapper method independently, and their
proposed detection method in having the filter method prior to the wrapper method in
assessing their performance using the KDD dataset. Mohammadi et al. (2019) proposed
the feature grouping based on linear correlation coefficient (FGLCC) procedure to be
applied by the filter method, and the wrapper method be applied using the cuttlefish
algorithm (CFA). The CFA is a heuristic-based approach to extract features (Mohammadi
et al., 2019, p. 82). In the study by Mohammadi et al. (2019), the intrusion detection
method that involved incorporating only the CFA was able to achieve the false positive
rate of 1.86%, and the method that involved applying the FGLCC-CFA resulted in the
false positive rate of 0.19%.
Sakr et al. (2019) compared the performance of intrusion detection methods that
involved applying the filter and wrapper methods independently and jointly. In an
examination, Sakr et al. (2019) had the filter method to use the information gain and CFS,
and had the wrapper method to use the genetic algorithm which is an evolutionary-based
approach based on Darwin’s theory. The results of the study by Sakr et al. (2019) showed
that the attacks detection methods that involved incorporating the information gain and
CFS, separately, achieved the false positive rates of 0.015% and 0.068%. When Sakr et

138
al. (2019) applied the wrapper method preceded by the filter method using the
information gain, the intrusion detection method achieved the false positive rate of
0.029%, and when they applied the CFS after the wrapper method, it obtained the false
positive rate of 0.051%. After Sakr et al. (2019) incorporated the filter method preceded
by the wrapper method using the information gain, the intrusion detection method was
able to obtain the false positive rate of 0.084%, and when they applied the CFS before the
wrapper method, it was able to achieve the false positive rate of 0.015%.
In contrast to the disconfirmation of the results of this study to the literature and
variables, provided above, in the beginning of this section, and contrary to the results of
studies reflected above, except in one instance explicated below, I could achieve the best
performances adding the filter and wrapper methods to the clustering method in detecting
attacks. This is because, addition of the filter and wrapper methods using the chi-squared
and Naïve Bayes to SOM had the lowest false positive rate of 0.013 in detecting attacks.
Incorporation of the filter and wrapper methods using the information gain and Naïve
Bayes produced the second lowest false positive rate of 0.014 among DDoS attack
detection methods that applied the SOM and k-means algorithms. The DDoS attack
detection method that involved applying the SOM algorithm along with the filter and
wrapper methods using the chi-squared algorithm and J48 classifier in feature evaluation
generated the third lowest false positive rate of 0.016 in attacks detection. The false
positive rate of 0.016 obtained in this study was lower than 0.015, when only Sakr et al.
(2019) incorporated the filter method preceded by the wrapper method using the CFS and
genetic algorithms. Feature reduction is able to excavate useful information from a

139
dataset (Yanfang et al., 2020), and is with the capability to enhance the “generalization
performance” (Xiaojuan et al., 2018, p. 595) of learning models (Xiaojuan et al., 2018).
Feature reduction process is common in intrusion detection methods (Almomani, 2020).
It will eliminate data properties that are redundant (Henni et al., 2020, p. 62841) and is
necessary for the clustering method (Mohamed, 2020).
Interpretation of Findings in the Context of the CRISP-DM Framework
The objective of the CRISP-DM framework encompasses transforming
organizational issues into data mining tasks (Huber et al., 2019). This framework
facilitates conducting data mining tasks that are separate from application area and the
technology that is incorporated (Huber et al., 2019). That makes the DDoS attack
detection methods that I evaluated implementable in any organization. This framework is
able to resolve major problems that organizations have by way of incorporating
knowledge discovery methods (Moslehi et al., 2018).
I assessed DDoS attack detection methods based on the clustering method using
the SOM and k-means procedures in the evaluation phase of the CRISP-DM using 10-
fold cross validation to identify effective ones. The 10 fold cross validation method is
able to administer any bias (Wahab & Haobin, 2019). This method produces the highest
accuracy (Keleş, 2019) and it generates an approximation of generalization (Li et al.,
2019). I had the objective to evaluate whether employing the filter and wrapper methods
prior to the clustering method is effective to lower false positive rates of DDoS attack
detection methods.

140
I found that the DDoS attack detection methods that involved applying the filter
and wrapper methods using the chi-squared and Naïve Bayes to SOM was able to lower
the false positive rate to 0.013 in detecting attacks. This was the lowest false positive rate
among all the examined DDoS attack detection methods. The DDoS attack detection
methods that involved incorporating the filter and wrapper methods using the information
gain and Naïve Bayes prior to both the SOM and k-means procedures lowered the false
positive rate to 0.014 in categorizing attacks. This was the second lowest false positive
rate among all the DDoS attack detection methods that this study evaluated. The DDoS
attack detection method that involved incorporating the SOM algorithm along with the
filter and wrapper methods prior to this clustering algorithm to evaluate features using the
chi-squared and J48 was the third effective one among all others.
Through analyzing the implementation of the examined DDoS attack detection
methods in the deployment phase of the CRISP-DM, I found that the placement of DDoS
attack detection methods outside of DMZ areas will help organizations to better protect
their systems. Based on Miloslavskaya (2018), this area is with the objective of providing
the opportunity to include knowledge discovery methods for detecting attacks and to
reduce systems’ exposures to undesirable network traffic events. Intrusion detection
systems are powerful and successful tools in achieving security that is high (Bostani &
Sheikhan, 2017). The application of procedures of the clustering method to identify
anomalies is effective (Alguliyev et al., 2019). DMZ areas have firewalls to provide
security. A firewall performs filtration of network traffics from one network to another
(Alvarez et al., 2021). Incorporation of DDoS attack detection methods outside of a DMZ

141
area is able to signal a designated firewall that is connected directly to the Internet of
discovered attacks by these methods in a timely manner. Then, the firewall prevents the
attacks. Likewise, DMZ areas provide security level that is medium (Alvarez et al.,
2021). According to Miloslavskaya (2018), if attacks were successful in penetrating
organizational networks, DMZ areas increase quicker response and recovery of
organizational assets. As the consequence, security leaders are able to harden their
organizational networks and systems against future DDoS attacks.
Application to Professional Practice
The event of DDoS attacks is a great issue of the Internet (Idhammad et al.,
2018b). These attacks congest victim systems with network traffic requests that are
redundant. DDoS attacks cause overloading of computational resources and bandwidths
with unimportant and rapid requests (Hoque et al., 2017). This event may cause to bring
down network services in having financial damages (Lopez et al., 2019).
To gain high level security, network security violations are required to be
continuously detected (Bopche & Mehtre, 2017). Intrusion detection systems are
effective tools to gain high level security (Bostani & Sheikhan, 2017). DDoS attack
detection methods are intrusion detection systems that are successful in attaining security
that is of high level.
Incorporating clustering algorithms in detecting irregularities is effective
(Alguliyev et al., 2019). The employment of DDoS attack detection methods outside of
DMZ areas will help organizations to better safeguard their systems. According to
Miloslavskaya (2018), these areas are with the purpose of allowing for application of

142
knowledge discovery methods in attacks identification and the decrease of systems’
experiences to undesired network traffic events. Based on Miloslavskaya (2018), if
attacks were able to pass organizational networks, DMZ areas increase greater response
and recovery of organizational assets.
Implications for Social Change
The launch of DDoS attacks is a big problem of the Internet (Idhammad et al.,
2018b). DDoS attacks cause financial damages for organizations from $50,000 to $2.3
million on a yearly basis (Lopez et al., 2019). This research may contribute to society by
placing effective DDoS attack detection methods outside of DMZ to detect attacks
directly from the Internet. Intrusion detection systems are successful in obtaining security
that is of high level (Bostani & Sheikhan, 2017). Therefore, DDoS attack detection
methods are great in attaining high level security. This may help governments,
foundations, charities, and other social service organizations to be able better safeguard
their systems from service interruptions instigated by DDoS attacks. As the result, these
organizations and institutions may be able to provide uninterrupted services to their
communities with decreased financial damages.
Recommendations for Action
It is better for IT leaders to apply the CRISP-DM framework to realize the
organizational problems with respect to DDoS attacks and their effectiveness in
detection. The use of the CRISP-DM framework will lead organizations to avert the
occurrence of major problems through incorporating effective DDoS attack detection
methods to protect their systems against service interruptions caused by DDoS attacks.

143
This framework enables organizations to solve major issues through incorporating
knowledge discovery methods (Moslehi et al., 2018). Unsupervised DDoS attack
detection methods produce high false positive rates (Idhammad et al., 2018b). The curse
of dimensionality has negative impact on the effectiveness of unsupervised DDoS attack
detection methods to have accurate identification of attacks (Idhammad et al., 2018b).
Redundancy of attributes causes the curse of dimensionality (Salimi et al., 2018).
Therefore, the objective in this study was to assess whether applying the filter and
wrapper methods prior to the clustering method is effective in lowering false positive
rates of DDoS attack detection methods using this framework. I found that incorporation
of the filter and wrapper methods using the chi-squared and Naïve Bayes to SOM was the
most effective one to decrease the false positive rates of DDoS attack detection methods.
Incorporation of the filter and wrapper methods using the information gain and Naïve
Bayes represented the second effective implementation prior to the clustering method
using the SOM and k-means. The DDoS attack detection method that involved applying
the SOM procedure along with incorporating the filter and wrapper methods using the chi
squared and J48 classifier in feature evaluation was the third effective method
implementation.
Based on the application of the CRISP-DM in the deployment phase in this study,
it is better for IT leaders to deploy DDoS attack detection methods outside of DMZ areas
to help organizations to better protect their systems from the Internet. The Internet has a
great issue with DDoS attacks (Idhammad et al., 2018b). DMZ networks deliver security
level that is intermediate (Alvarez et al., 2021). Also, Intrusion detection systems are

144
powerful in providing security that is high (Bostani & Sheikhan, 2017). As the result, the
implementation of DDoS attack detection methods outside of DMZ will obtain high level
security. According to Miloslavskaya (2018), if for any purpose, attacks were successful
in moving through organizational networks, the DMZ area is able to provide faster
response and recovery of organizational resources.
The results of this study will be disseminated via publication of this research
through Walden University. Conferences will be made, if security administrators or
organizational leaders contacted me for the purpose of discussing the results of this study.
I have provided the recommendation through the use of the CRISP-DM framework to
properly deploy effective DDoS attack detection methods, as follows. I found that
positioning DDoS attack detection methods outside of DMZ networks will assist
organizations to better protect their systems from the Internet. The Internet has a major
problem with DDoS attacks (Idhammad et al., 2018b). DMZ networks are able to avert
security vulnerabilities (Alvarez et al., 2021).
Recommendations for Future Research
The curse of dimensionality lowers the effectiveness of unsupervised DDoS
attack detection methods by avoiding proper detection of attacks (Idhammad et al.,
2018b). Redundant data dimensions cause the curse of dimensionality (Salimi et al.,
2018). Consequently, I had the aim to evaluate whether incorporating the filter and
wrapper methods preceded by the clustering method is effective in lowering false positive
rates of DDoS attack detection methods.

145
One possible future research would be to incorporate an ensemble method to
integrate machine learning algorithms to determine proper network traffic data in
addressing the curse of dimensionality. An Ensemble method combines machine learning
algorithms in constructing a better model to enhance performance (Akhter et al., 2021).
This method integrates learning models to solve similar problems (Dan et al., 2018). The
concept behind this method is that no individual machine learning algorithm is better than
other single classifiers (Moro & Masseroli, 2021).
Another possible future research would be to take the research of adding the filter
and wrapper methods that I conducted, further. That would be by incorporating
supervised learning algorithms in replacement of the clustering method to evaluate DDoS
attack detection methods in addressing their effectiveness issue caused by the curse of
dimensionality. The curse of dimensionality is challenging for machine learning tasks
(Gahar et al., 2019). Nevertheless, supervised learning algorithms are suitable to classify
data (Uddin et al., 2019). DDoS attack detection methods that rely on supervised learning
algorithms are dependent upon classified network traffic data (Idhammad et al., 2018b).
These algorithms train on data that are labelled to build a prediction model (Uddin et al.,
2019). Afterward, the prediction model applies an unlabeled test data to categorize the
data instances into relevant classes (Uddin et al., 2019).
Reflections
From the start of 2021, I had the most productive progression. The immediate
Chair of this research was an active communicator with clear and productive guidance.

146
That led to suitable and enjoyable progression to conduct the experimentation related to
this study and finish the research.
Conclusion
The curse of dimensionality reduces the performance of the DDoS attack
detection methods based on the clustering method by preventing correct detection of
attacks among categories. The CRISP-DM framework is great to evaluate DDoS attack
detection methods and their deployments to protect organizational systems. This
framework is able to make effective DDoS attack detection methods employable in any
organization.
DDoS attack detection methods are powerful tools in obtaining security that is of
high level. A recommendation to IT leaders is to deploy DDoS attack detection methods
that have great performance in attacks detection outside of a demilitarized zone to
facilitate DDoS attack identifications directly from the Internet. Implications for positive
social change may encompass providing the opportunity for organizations to better
protect their systems and provide uninterrupted services to their communities with
reduced financial damages.

