


Data Analysis and Results for Workload and Academic Staff Performance
Name
COUN 8111 - Leadership and Organizational Change
Walden University
2022

Data Analysis and Results
Data analysis was conducted using the SmartPLS 3.3.3 software through the partial least
square structural equation modeling (PLS-SEM) technique. It was chosen to test the proposed
hypotheses following Hair et al.’s (2017) advocacy on its suitability for examining from simple to
complex models as well as from small to medium sample sizes.
Assessment of Measurement Model
The measurement model was assessed for reflective indicators and the reliability and validity
of constructs were confirmed. Following Hair et al.’s (2017) guidelines, factor analysis was conducted
on the various latent constructs. The values of the constructs’ composite reliability scored from 0.759
to 0.898, which were above the threshold of 0.7 (Hair et al., 2017).
The model’s validity was confirmed by examining convergent validity. First, the results show
the value of factor loadings were above 0.70. This indicates that the items of each research variable
achieved acceptable convergent validity. The other two major measurements were the average
variance extracted (AVE) which scored above 0.50 while composite reliability (CR) scored 0.70.
Finally, the value of Cronbach’s alpha was above 0.70. This indicates that the research variables
achieved acceptable convergent validity (Hair et al., 2017) (see Table 2).
Table 2. Construct reliability and validity measure
Latent variables
Indicators loading
Cronbach's α
rho_A
CR
AVE
Academic staff performance
AP3
0.822
0.885 0.887 0.913 0.636
AP4
0.809
AP5 0.816
AP6 0.785
AP7 0.759
AP8 0.792
Career Commitment CC1 0.773 0.879 0.895 0.906 0.580
CC2 0.812
CC3 0.849
CC4 0.706
CC5 0.710
CC6 0.811
CC7 0.702
Job Satisfaction JS3 0.835 0.898 0.901 0.920 0.621
JS1 0.726
JS4 0.795
JS5 0.806
JS6 0.811
JS7 0.779
JS8 0.759
Job workload WL1 0.779 0.759 0.762 0.846 0.580
WL2 0.779
WL3 0.779
WL4 0.779
Note . AP= Academic staff performance, CC = Career Commitment, JS= Job Satisfaction, WL= Job workload,
CR= Construct reliability, AVE= Average variance extracted.
Discriminant validity uses empirical standards to distinguish the degree of one construct to
another. As proposed by researchers to combine several methods, this study applied the Fornell-
Larcker criterion with the Heterotrait-Monotrait (HTMT) ratio of correlations (Henseler et al., 2015).
Following the Fornell- Larcker criterion, the results indicated that discriminant validity was achieved
because the square root of the AVE of each construct was higher than the correlation values among
any construct pairings. Also, the values of HTMT were below the threshold value of 0.85 in all cases

as shown in Table 3. Consequently, this study confirms that academic staff performance, career
commitment, job workload, and job satisfaction could be mutually discriminated in the study.
Table 3. Measurement model: discriminant validity
Fornell-Larcker Criterion
Heterotrait-Monotrait Ratio (HTMT)
ASP CC JW JS
ASP
CC
JW
ASP
0.797
CC
0.379
0.762 0.421
JW
-0.243
-0.389 0.762 0.291
0.456
JS
0.730
0.453 -0.291 0.788 0.814
0.513
0.342
Note. ASP = Academic staff performance; CC = Career commitment; JW = Job workload; JS = Job
satisfaction.
Structural Model Assessment
A measurement model assessment was conducted, and it confirmed the validity and reliability
of the structural model proposed by this study. Given this, it was observed that the structural
relationships were established. As the target latent construct, academic staff performance yielded an
R2 of 53%, which demonstrated a moderate predictive power. Meanwhile, as the mediating latent
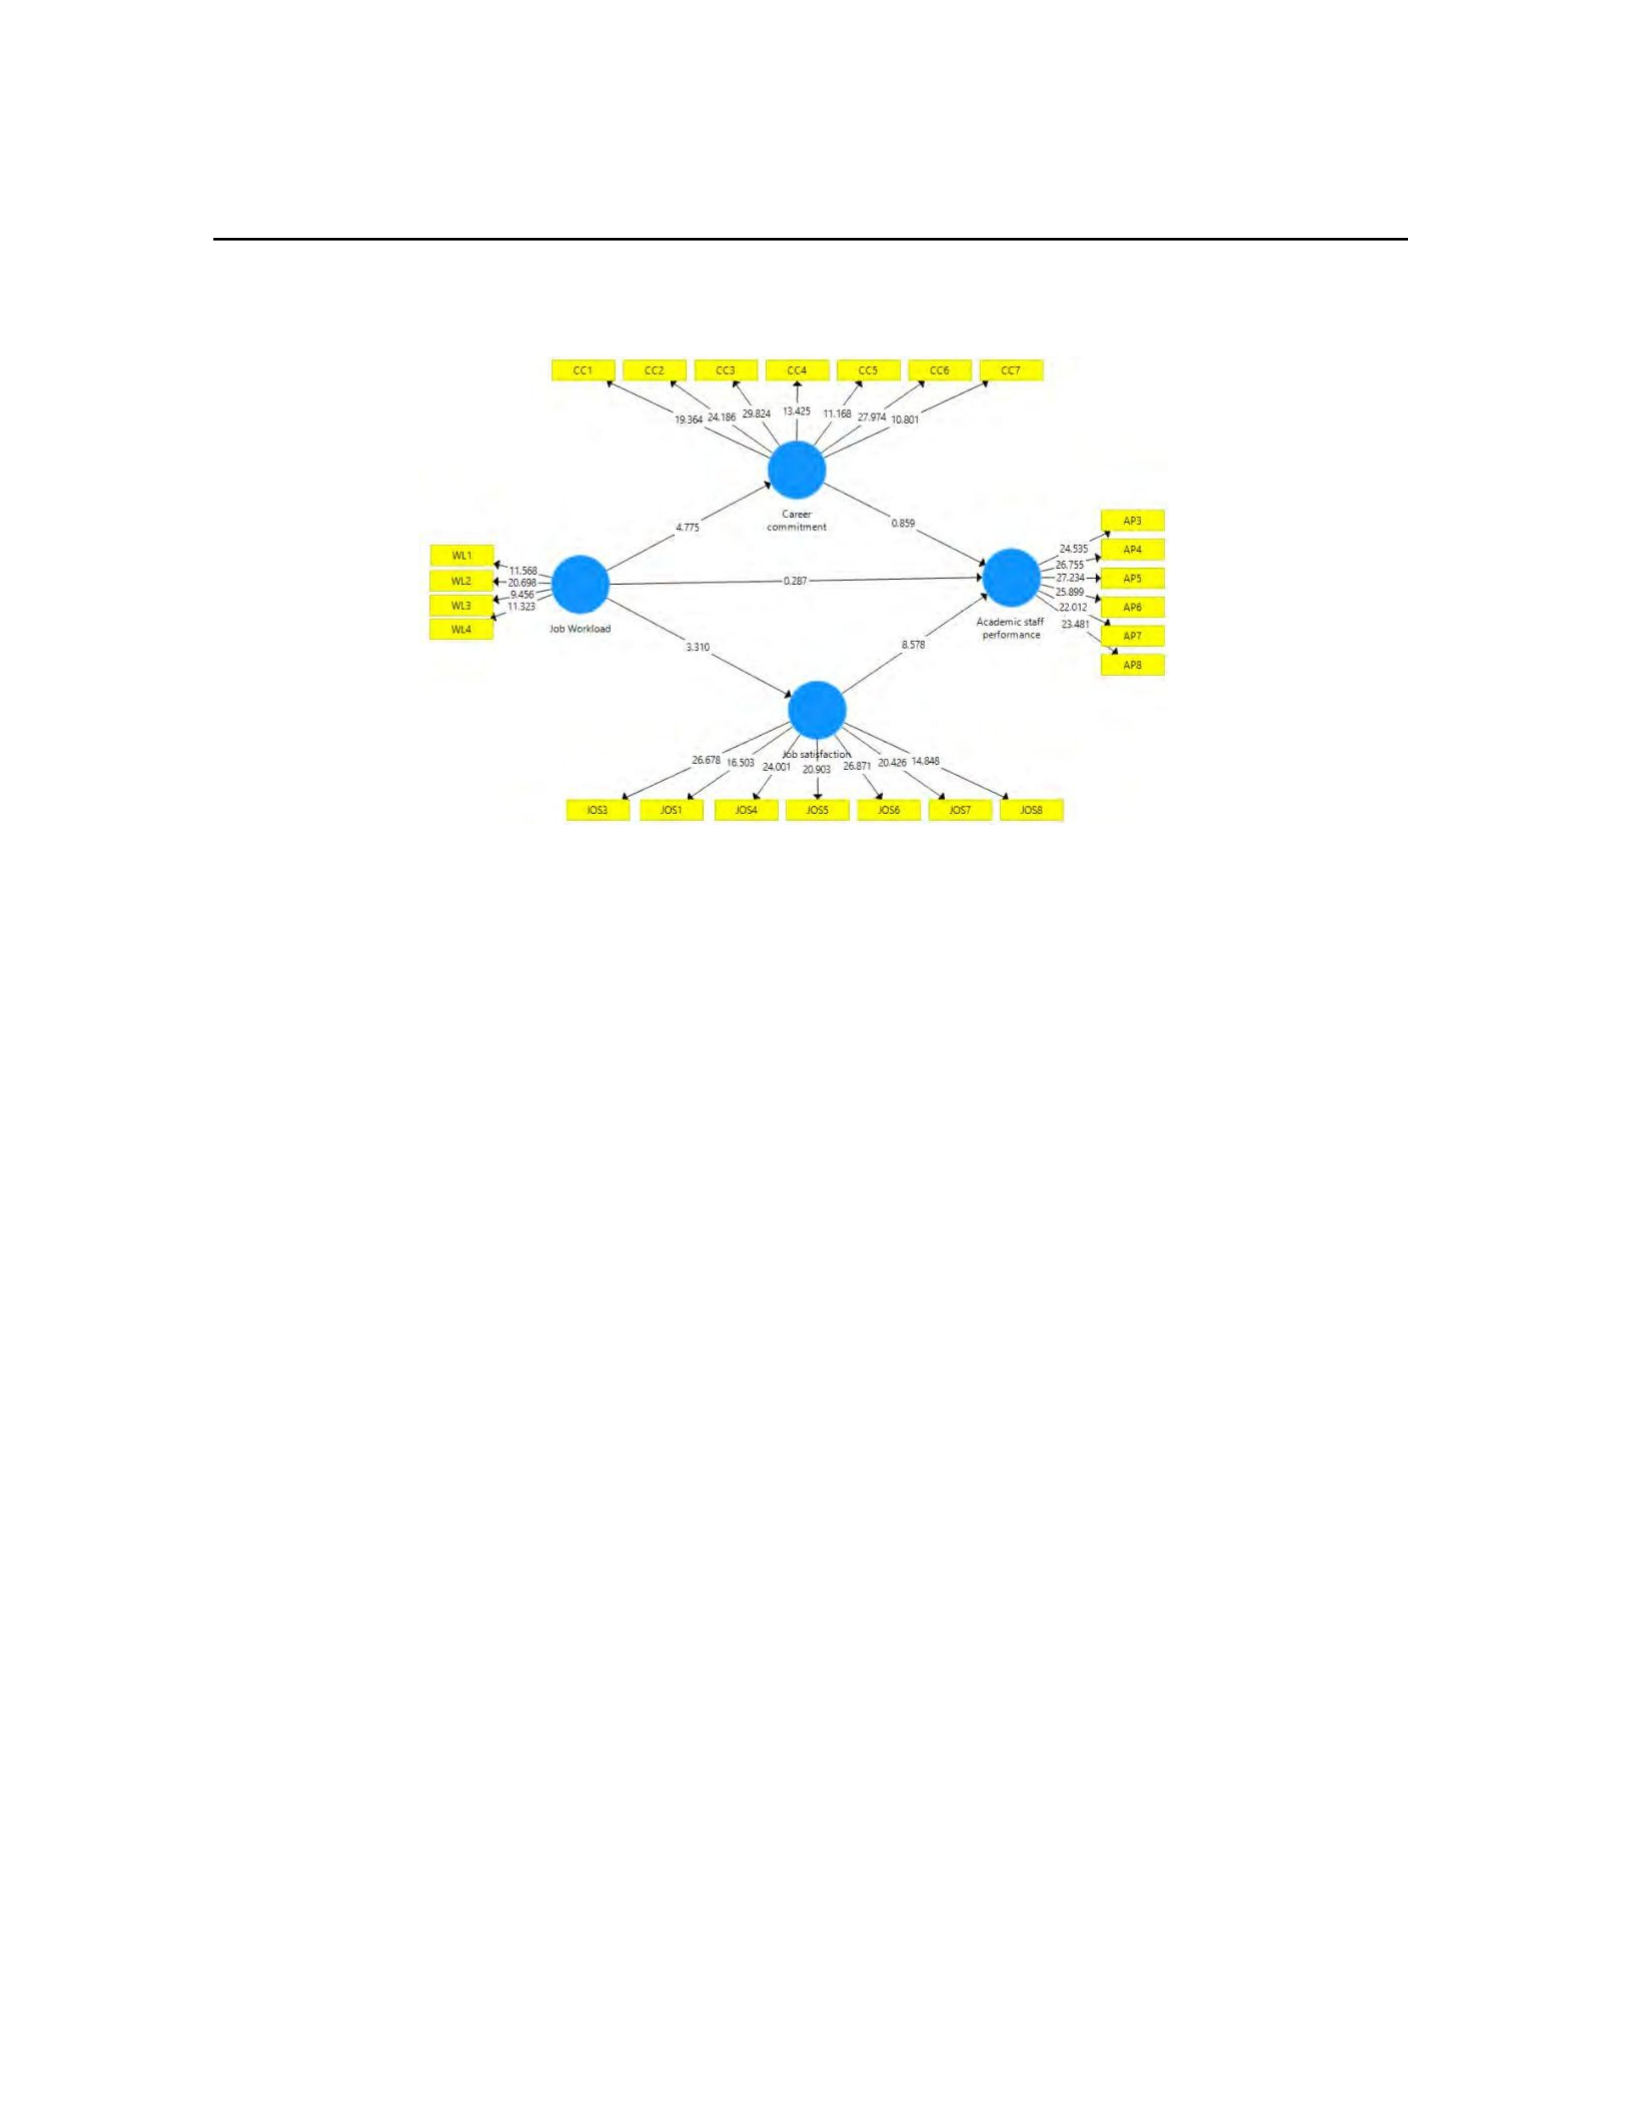
constructs, career commitment yielded an R2 of 15% and job satisfaction at an R2 of 8.5%. Figure 2
shows the structural model illustrating the direct and indirect effects of job workload on academic
staff performance via the mediating paths of career commitment and job satisfaction, respectively.
Figure 2 also presents the standardized path coefficients and explained the variance of endogenous
variables. Finally, any threats of collinearity of the focal constructs were ruled out because the
variance inflation factor (VIF) values yielded less than five (see Table 4).
Table 4. Collinearity statistics of structural model (inner VIFs)
Construct ASP CC JW JS
ASP
1.385 1.202 1.284
CC
JW 1.000 1.000
JS
1.000
Note. ASP = Academic staff performance; CC = Career commitment; JW = Job workload; JS = Job satisfaction.
In determining the significance (path coefficient) of relationships between the variables (see
Table 4), the bootstrapping technique was utilized (Hair et al., 2017). The procedure involves
resampling the sub-sample of 5,000 cases that are equal to the valid observations. It was based on the
two-tail significance level of 5%.
PLS provides the understanding of constructs in their exogenous-endogenous exchange in the
structural model because it allows for the calculation of path coefficients and the coefficient of
determination (R2) values of the endogenous constructs (Figure 1). The significance of path estimates
was calculated by performing bootstrap analysis with 5,000 resamples.
As shown in Table 4, these results fail to reject H1. The results revealed that job workload is
negatively related to academic staff performance (β= -0.243.48, t = 3.294, p < 0.001). To test the
parallel mediation, the bootstrapping technique was used by conducting the resampling procedure
with a substitution, which has insignificant characteristics to the normality distribution of data
(Preacher & Hayes, 2008). In Table 5, in the presence of mediators, the direct effect between
workload and academic staff performance is not significant (β = -0.018, t = 0.287, p > 0.001).
According to indirect effect, career commitment does not mediate the relation between job workload
and academic staff performance (β = -0.021, t = 0.783, p > 0.001), thus the results reject H3. Instead,
job satisfaction mediates the relationship between job workload and academic staff performance (β = -
0.204, t = 2.771, p < 0.001), thus the results fail to reject H3.
92

Table 5. Mediation result.
Model “A” Total Effect Model “B” Direct effect
Bias corrected
Bias corrected
bootstrap (95%
bootstrap (95% CI)
CI)
Path
Coeffici
t-value
LCI UCI Path
Coeffici
t-value
LCI UCI Path
ent ent
JW→A
- 3.294 -0.37 -0.08 JW→A
-0.018
0.287 -0.15 0.099 JW→CC→A
SP 0.243**
SP SP
*
JW→JS→A
SP
Note. ASP = Academic staff performance; CC = Career commitment; JW = Job workload; JS = Job
satisfaction.
Table 6 presents the effect size (f2) of the structural model. Comparing against Cohen’s (1988)
guideline (small = 0.02, medium = 0.15, and large = 0.35), the effect size of all the variables were small (<
0.15). The exception was the job workload effect on career commitment with a score of 0.179 and job
satisfaction on academic staff performance at 0.822, both of which indicated medium effects. Although the
direct relationship between job workload on academic staff performance is significant, we put forth a
cautionary note when interpreting this finding because the effect size is meagre at 0.093.
Table 6. Effect size (f2)
Construct ASP CC JW
JS
ASP 0.005 0.001
0.822
CC
JW 0.179
0.093
JS
In addition to R2 and f2, the predictive relevance of the structural model was also measured using
“Stone-Geisser’s Q2 value” (Woodside & Zhang, 2013). The rule suggests that the Q2 value for the
certain reflective endogenous latent variable if is larger than zero, then the structural model has
predictive relevance otherwise not (Hair et al., 2017). The blindfolding results demonstrate that academic
staff performance (Q2= 0.315), career commitment (Q2=0.078), job workload (Q2= 0.08), and job
satisfaction (Q2=0.048) have satisfactory predictive relevance (Henseler et al., 2015). We confirmed the
overall fit of the PLS structural model when the standardized root-mean square residual (SRMR) value
scored 0.06 - much less than 0.10 threshold (Henseler et al., 2015) (see Table 7).
Table 7. The predictive relevance of the structural model
Construct
SSO SSE Q² (=1-SSE/SSO)
ASP
1,146.00 784.473 0.315
CC
1,337.00
1,232.54
0.078
JW
764
764
0.081
JS
1,337.00
1,272.81
0.048
Fig 2. Model for the study.

References
Abubakar, A., Hilman, H., & Kaliappen, N. (2018). New tools for measuring global academic
performance. Sage Open, 8(3), 1–10.doi: 10.1177/2158244018790787
Ahsan, N., Abdullah, Z., Fie, D. Y. G., & Alam, S. S. (2009). A study of job stress on job
satisfaction among university staff in Malaysia: Empirical study. European Journal of
Social Science, 8(1), 121–131.
Aksoy, C., Sengül, H. İ., & Yilmaz, Y. (2018). Examination of the relationship between job
satisfaction levels and organizational commitments of tourism sector employees: A
research in the Southeastern Anatolia region of Turkey. Elektronik Sosyal Bilimler
Dergisi, 17(65), 356–365. doi: 10.17755/esosder.343032
Andrade, C. (2019). Describing research design. Indian Journal of Psychological Medicine,
41(2), 201– 202. doi: 10.4103/ijpsym.ijpsym_66_19
Aruldoss, A., Kowalski, K. B., & Parayitam, S. (2020). The relationship between quality of work
life and work life balancemediating role of job stress, job satisfaction and job
commitment: Evidence from India. Journal of Advances in Management Research, 18(1),
36–62. doi: 10.1108/jamr-05-2020-0082
Aziri, B. (2011). Job satisfaction: A literature review. Management Research & Practice, 3(4),
77–86. Basarudin, N. A., Yeon, A. L., Yaacob, N., & Yusof, R. (2016). Faculty workload and
employment benefits in public universities. International Review of Management and Marketing,
6(S7), 73–
82.
Blau, G. J. (1985). The measurement and prediction of career commitment. Journal of
Occupational Psychology, 58(4), 277–288. doi: 10.1111/j.2044-8325.1985.tb00201.x
Cao, J., Liu, C., Wu, G., Zhao, X., & Jiang, Z. (2020). Work–family conflict and job outcomes
for construction professionals: The mediating role of affective organizational
commitment. International Journal of Environmental Research and Public Health, 17(4),
1–24. doi: 10.3390/ijerph17041443
Chang, E. (1999). Career commitment as a complex moderator of organizational commitment
and turnover intention. Human Relations, 52, 1257–1278. doi:
10.1177/001872679905201002
Chhabra, B. (2015). Person–job fit: Mediating role of job satisfaction & organizational
commitment.
The Indian Journal of Industrial Relations, 50(4), 638–651.
Chin, W. S., & Mohd. Rasdi, R. (2014). Protean career development: Exploring the individuals,
organizational and job-related factors. Asian Social Science, 10(21), 203–215. doi:
10.5539/ass.v10n21p203
Colarelli, S. M., & Bishop, R. C. (1990). Career commitment: Functions, correlates, and
management.
Group & Organization Studies, 15(2), 158–176. doi: 10.5539/ass.v10n21p203
Crede, M., Chernyshenko, O. S., Stark, S., Dalal, R. S., & Bashshur, M. (2007). Job satisfaction
as mediator: An assessment of job satisfaction’s position within the nomological network.
Journal of Occupational and Organizational Psychology, 80(3), 515–538. doi:
10.1348/096317906x136180
Diamantidis, A. D., & Chatzoglou, P. (2019). Factors affecting employee performance: An
empirical approach. International Journal of Productivity and Performance Management,
68(1), 171– 193. doi: 10.1108/ijppm-01-2018-0012

Dorenkamp, I., & Ruhle, S. (2019). Work–life conflict, professional commitment, and job
satisfaction among academics. The Journal of Higher Education, 90(1), 56–84. doi:
10.1080/00221546.2018.1484644
Fernandez, J.L. (2010). An exploratory study of factors influencing the decision of students to
study at Universiti Sains Malaysia. Kajian Malaysia, 28(2), 107-136.
Fu, W., & Deshpande, S. P. (2014). The impact of caring climate, job satisfaction, and
organizational commitment on job performance of employees in a China’s insurance
company. Journal of Business Ethics, 124, 339–349. doi: 10.1007/s10551-013-1876-y
Gaither, C. A. (1999). Career commitment: A mediator of the effects of job stress on
pharmacists’ work-related attitudes. Journal of the American Pharmaceutical Association
(1996), 39(3), 353–361. doi: 10.1016/s1086-5802(16)30437-5
Hair, J. F., Hult, G. T. M., Ringle, C. M., & Sarstedt, M. (2017). A primer on partial least
squares structural equation modeling (PLS-SEM) (2nd ed.). Sage.
Han, J., Yin, H., Wang, J., & Zhang, J. (2020). Job demands and resources as antecedents of
university teachers’ exhaustion, engagement and job satisfaction. Educational
Psychology, 40(3), 318– 335. doi: 10.1080/01443410.2019.1674249
Haegele, J. A., & Hodge, S. R. (2015) . Quantitative methodology: A guide for emerging
physical education and adapted physical education researchers. The Physical Educator,
72(5), 59–75. doi: 10.18666/TPE-2015-V72-I5-6133

