


DATA ANALYSIS, RESULTS AND DISCUSSION
Introduction
This chapter entails of the data analysis, interpretation and the discussions of the
outcomes. The section hence is fragmented to four sub sections which entail: the origin of
study, socio-demographic characteristics of the participants, descriptive statistics,
inferential statistics, and interpretation and discussion of findings. Precisely this chapter
summarizes, the platform for data presentations, analysis and interpretations.
Socio-Demographic Characteristics of Participants
The research set out to determine the background and respondent characteristics of the
entire sample of respondents picked from each bank tier. Highlighted are the background
and firm characteristics derived from the Part A of this study’s questionnaire which
included: gender, marital status, age, educational level, area of specialization,
management level and work experience.
Gender
The target respondents were requested to specify their gender. This was to determine if
gender has any bearing on perception of electronic customer relationship management.
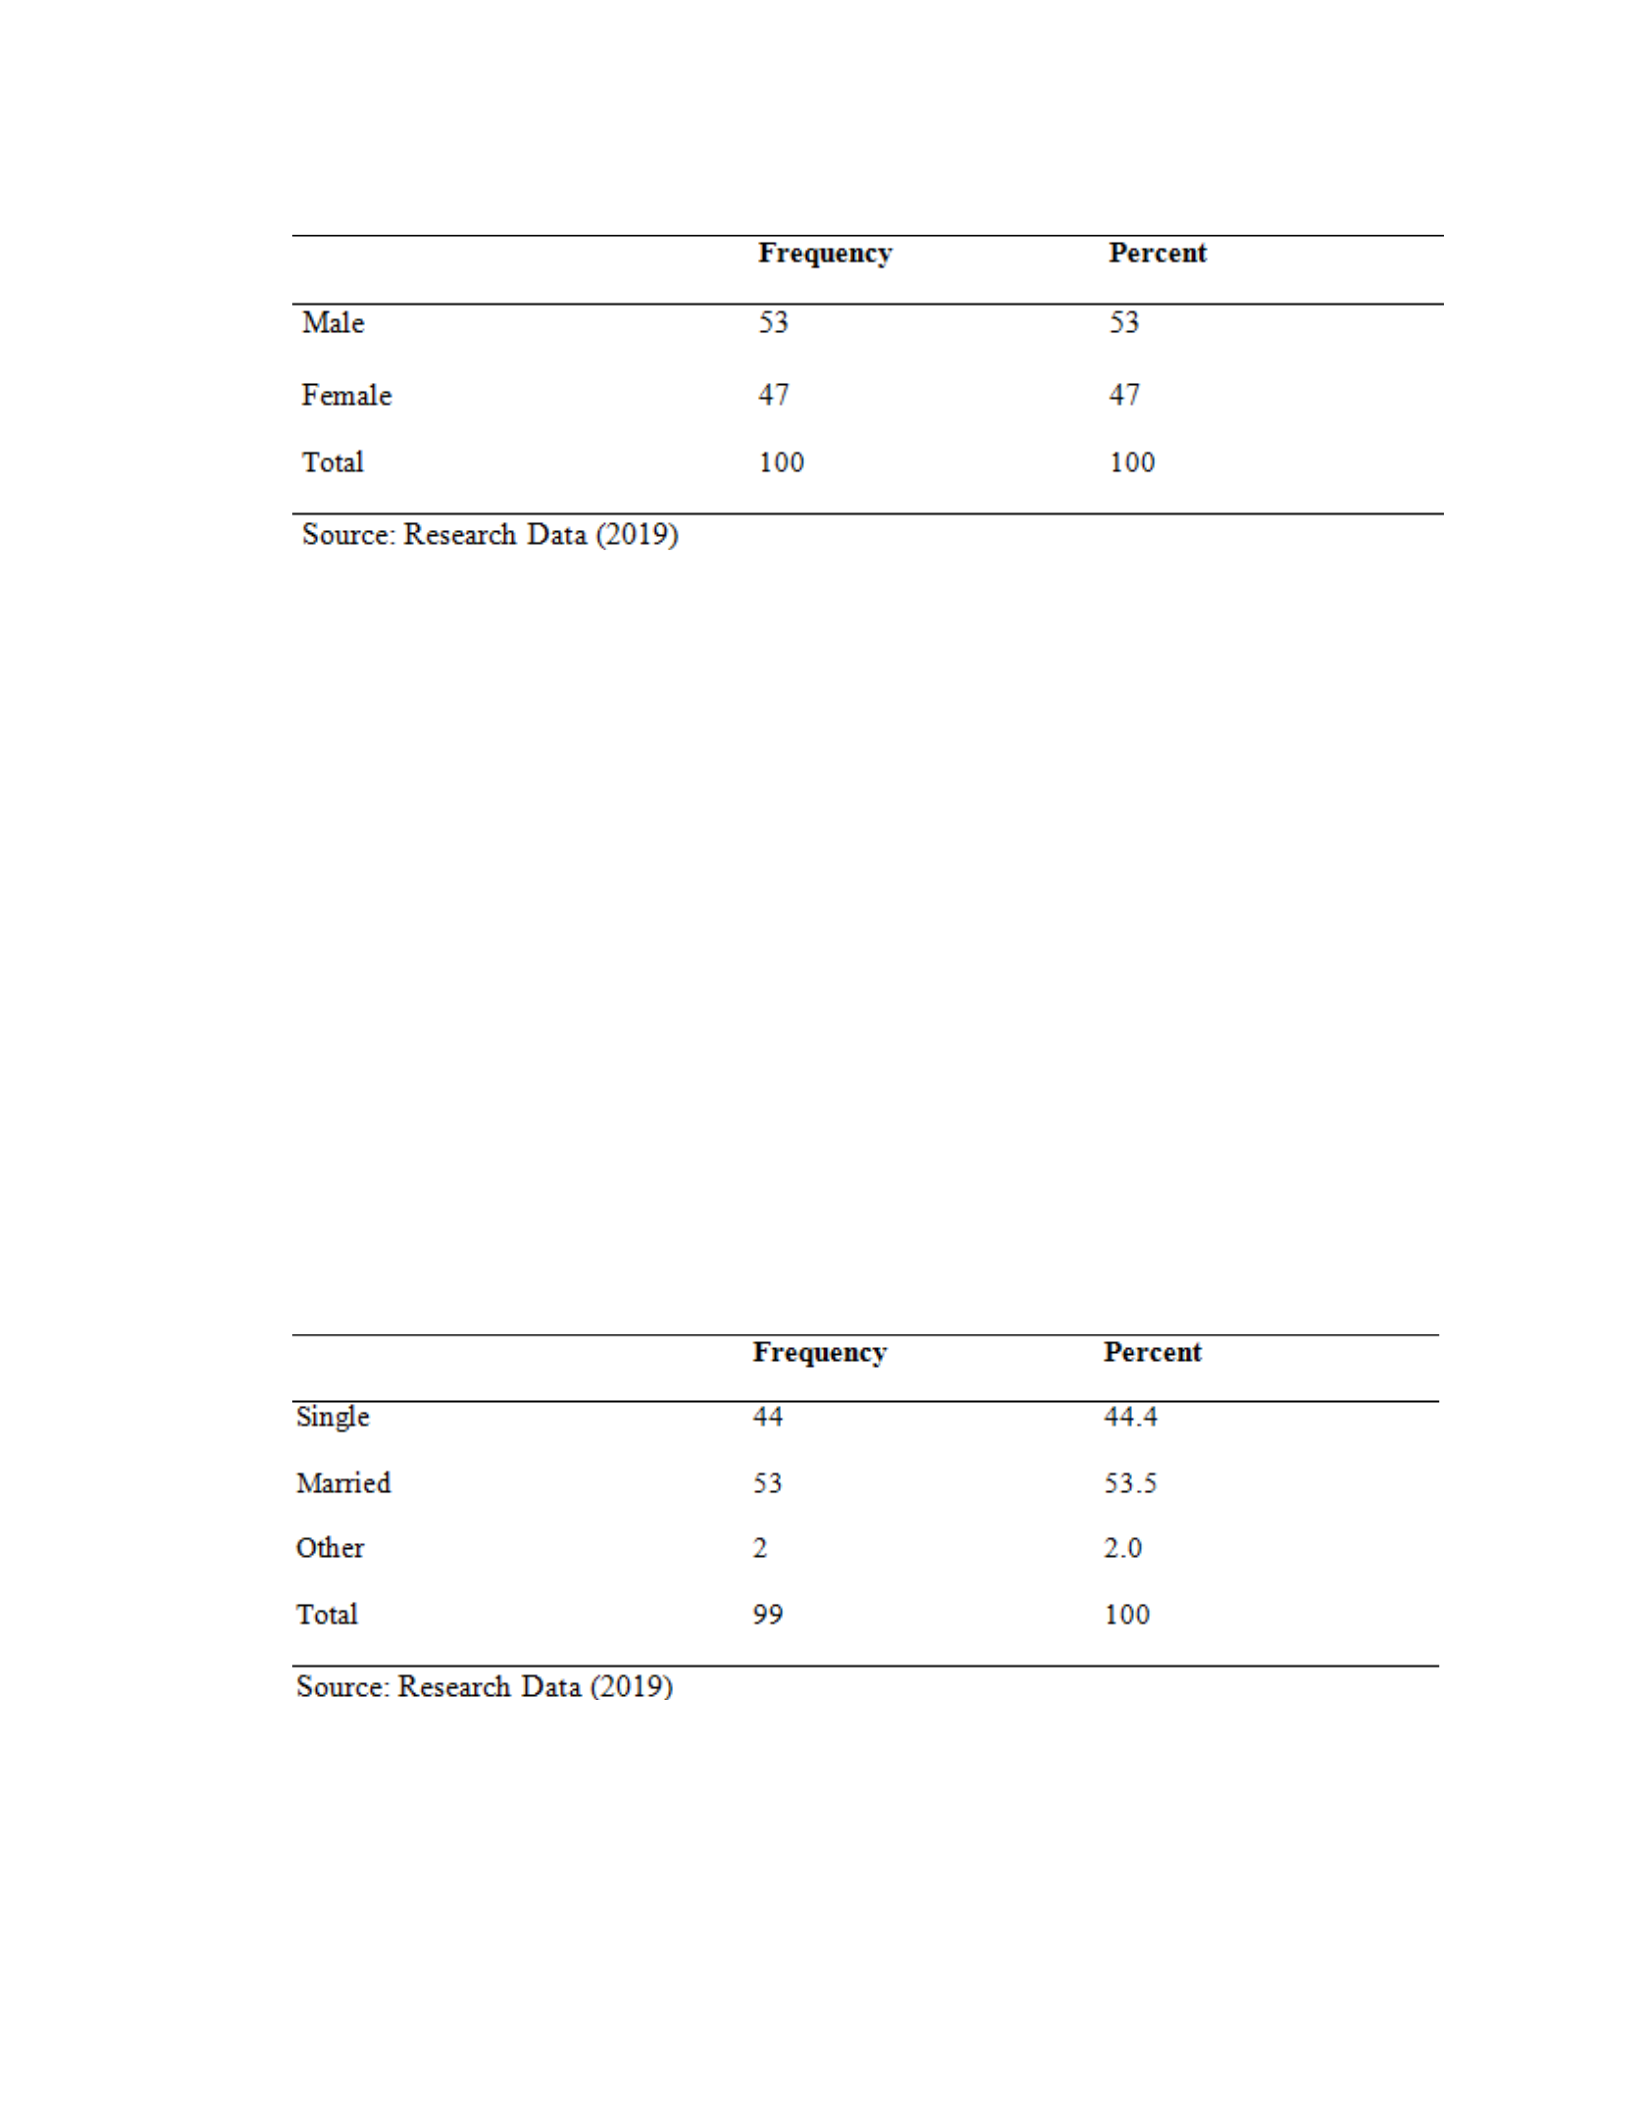
Table 4.1: Gender
Table 4.1 exhibits that the majority of the participants were males (53%) while proportion
of the female gender was 47%. The even spread of the gender is an indication of lack of
bias in the data collected because the respondents were randomly distributed. The male
gender is known to be more receptive to technology than the female gender.
Marital Status
The target respondents were requested to specify their marital status. This was to
determine if marital status has any bearing on perception of electronic customer
relationship management.
Table 4.2: Marital Status
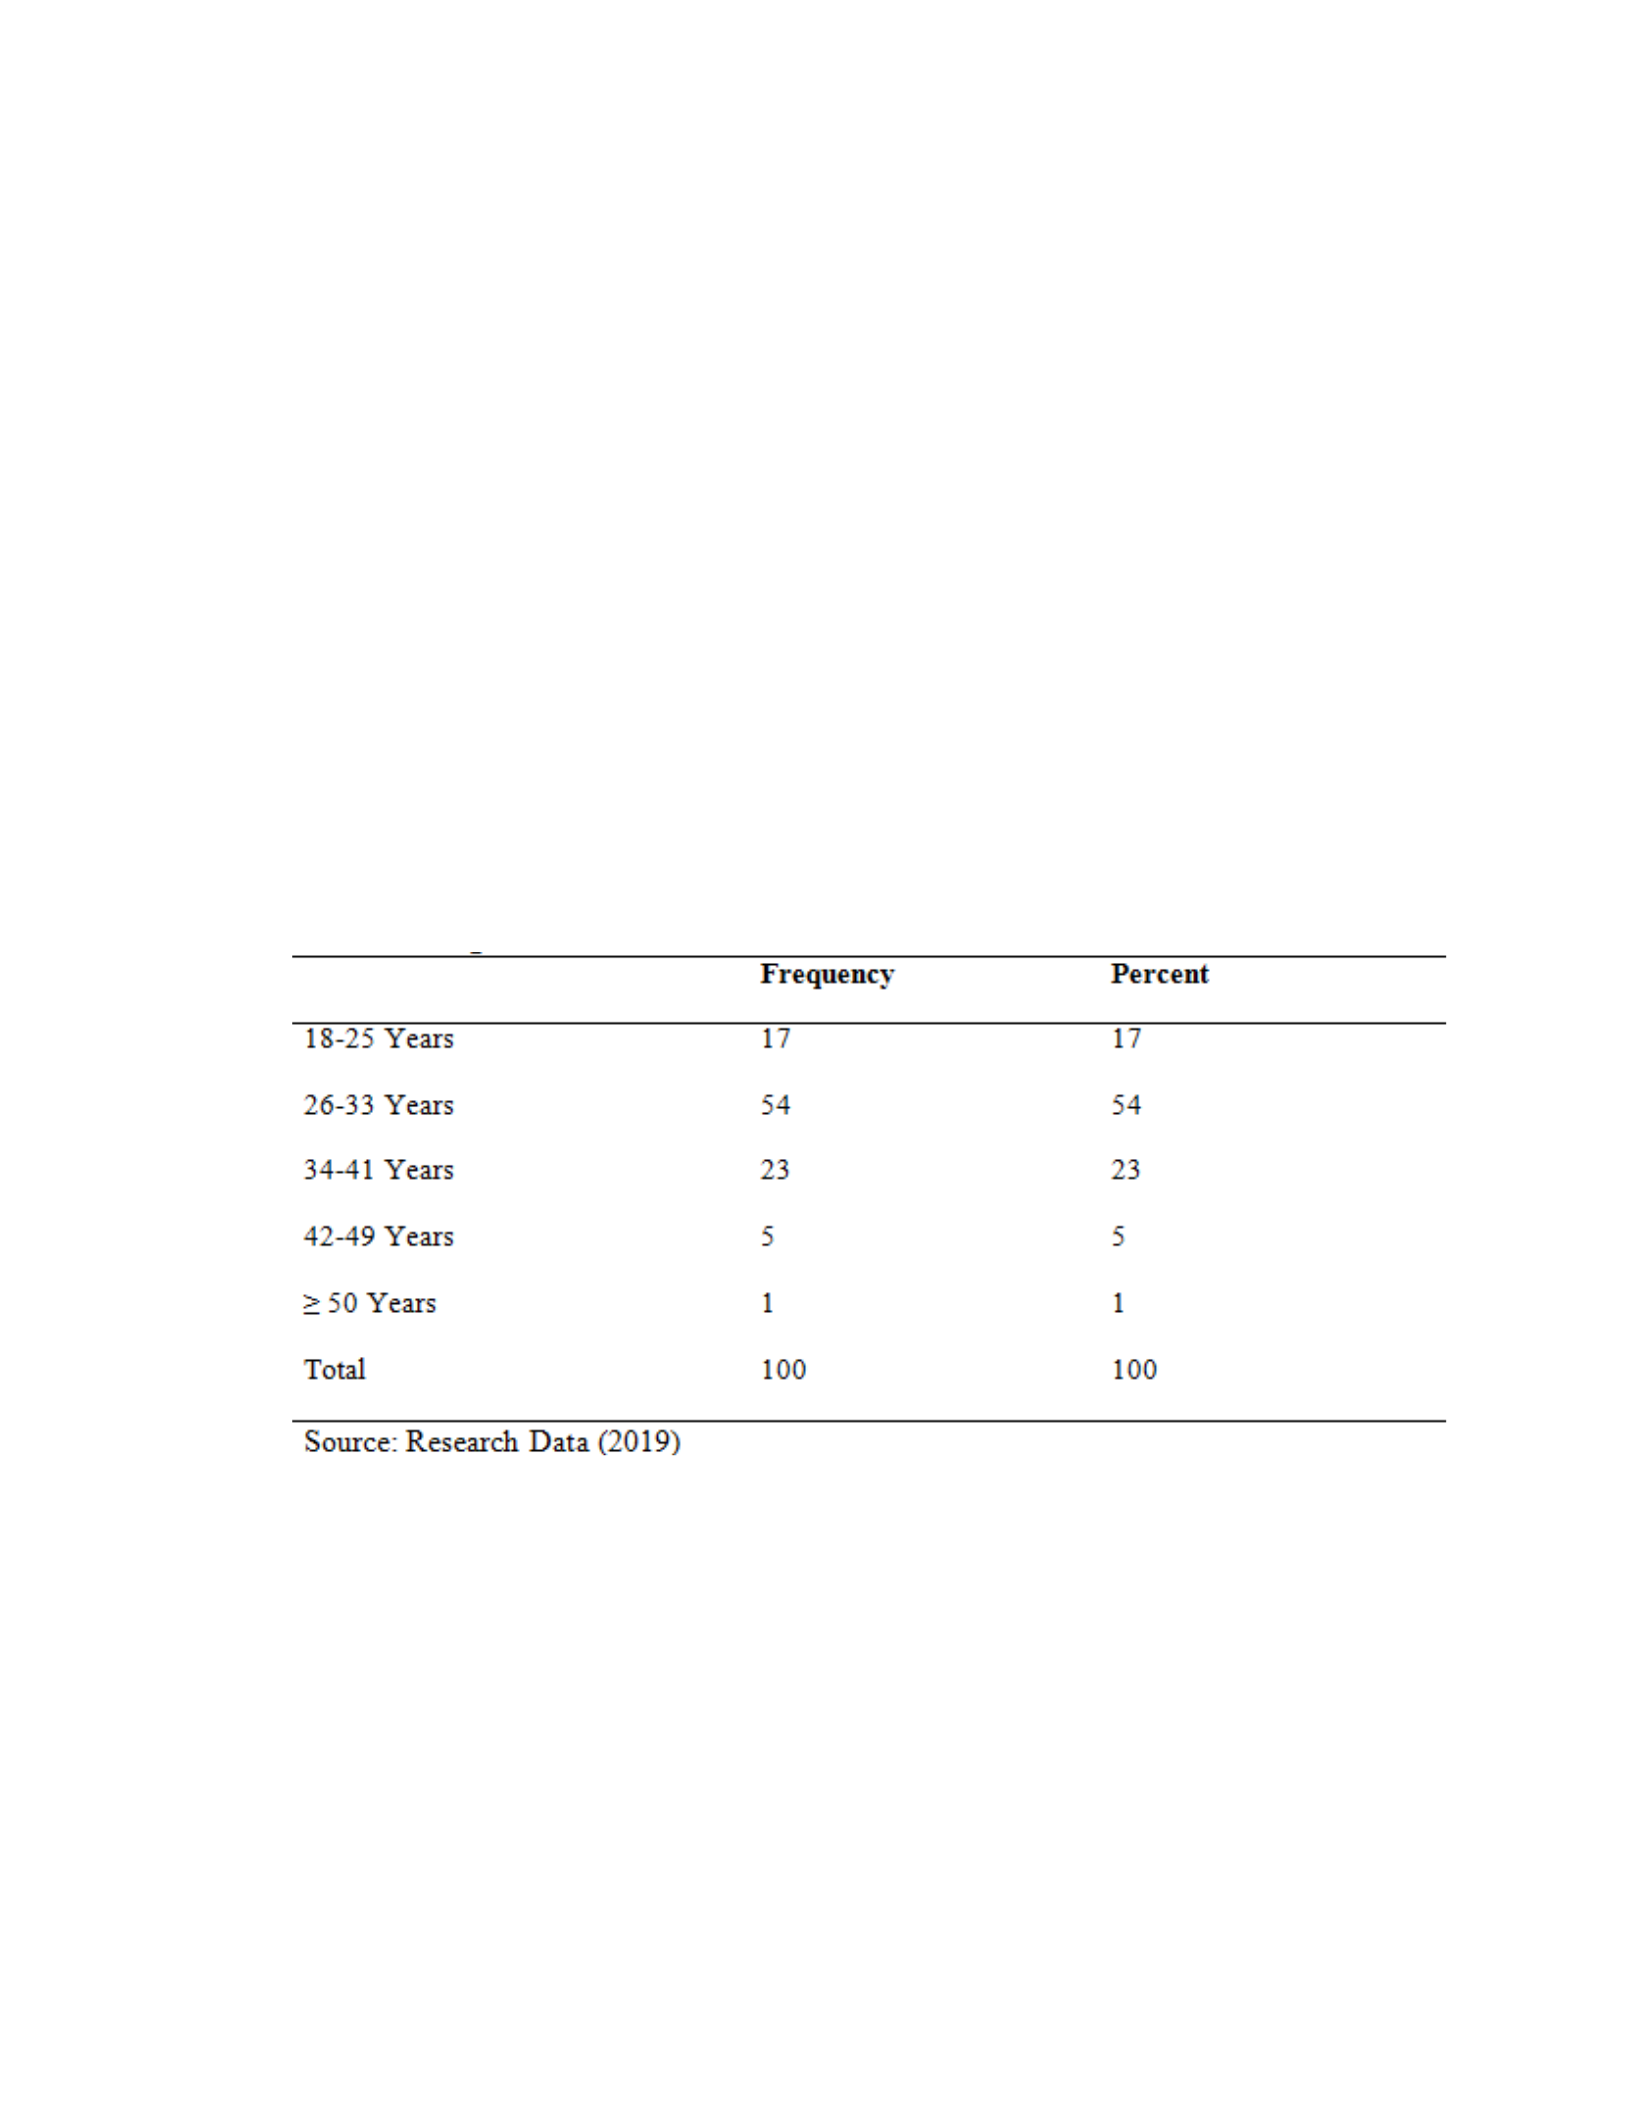
Table 4.2 displays that more than fifty percent of the respondents were married who
constituted 53% of the total respondents, followed closely by those single whose
proportion stood at 44.4%. Respondents who had other marital status were 2%. The
uneven spread of the marital status maybe an indication of bias although the respondents
were randomly distributed.
Age
The target respondents were requested to specify their age. This was to ascertain if age
has any bearing on perception of electronic customer relationship management.
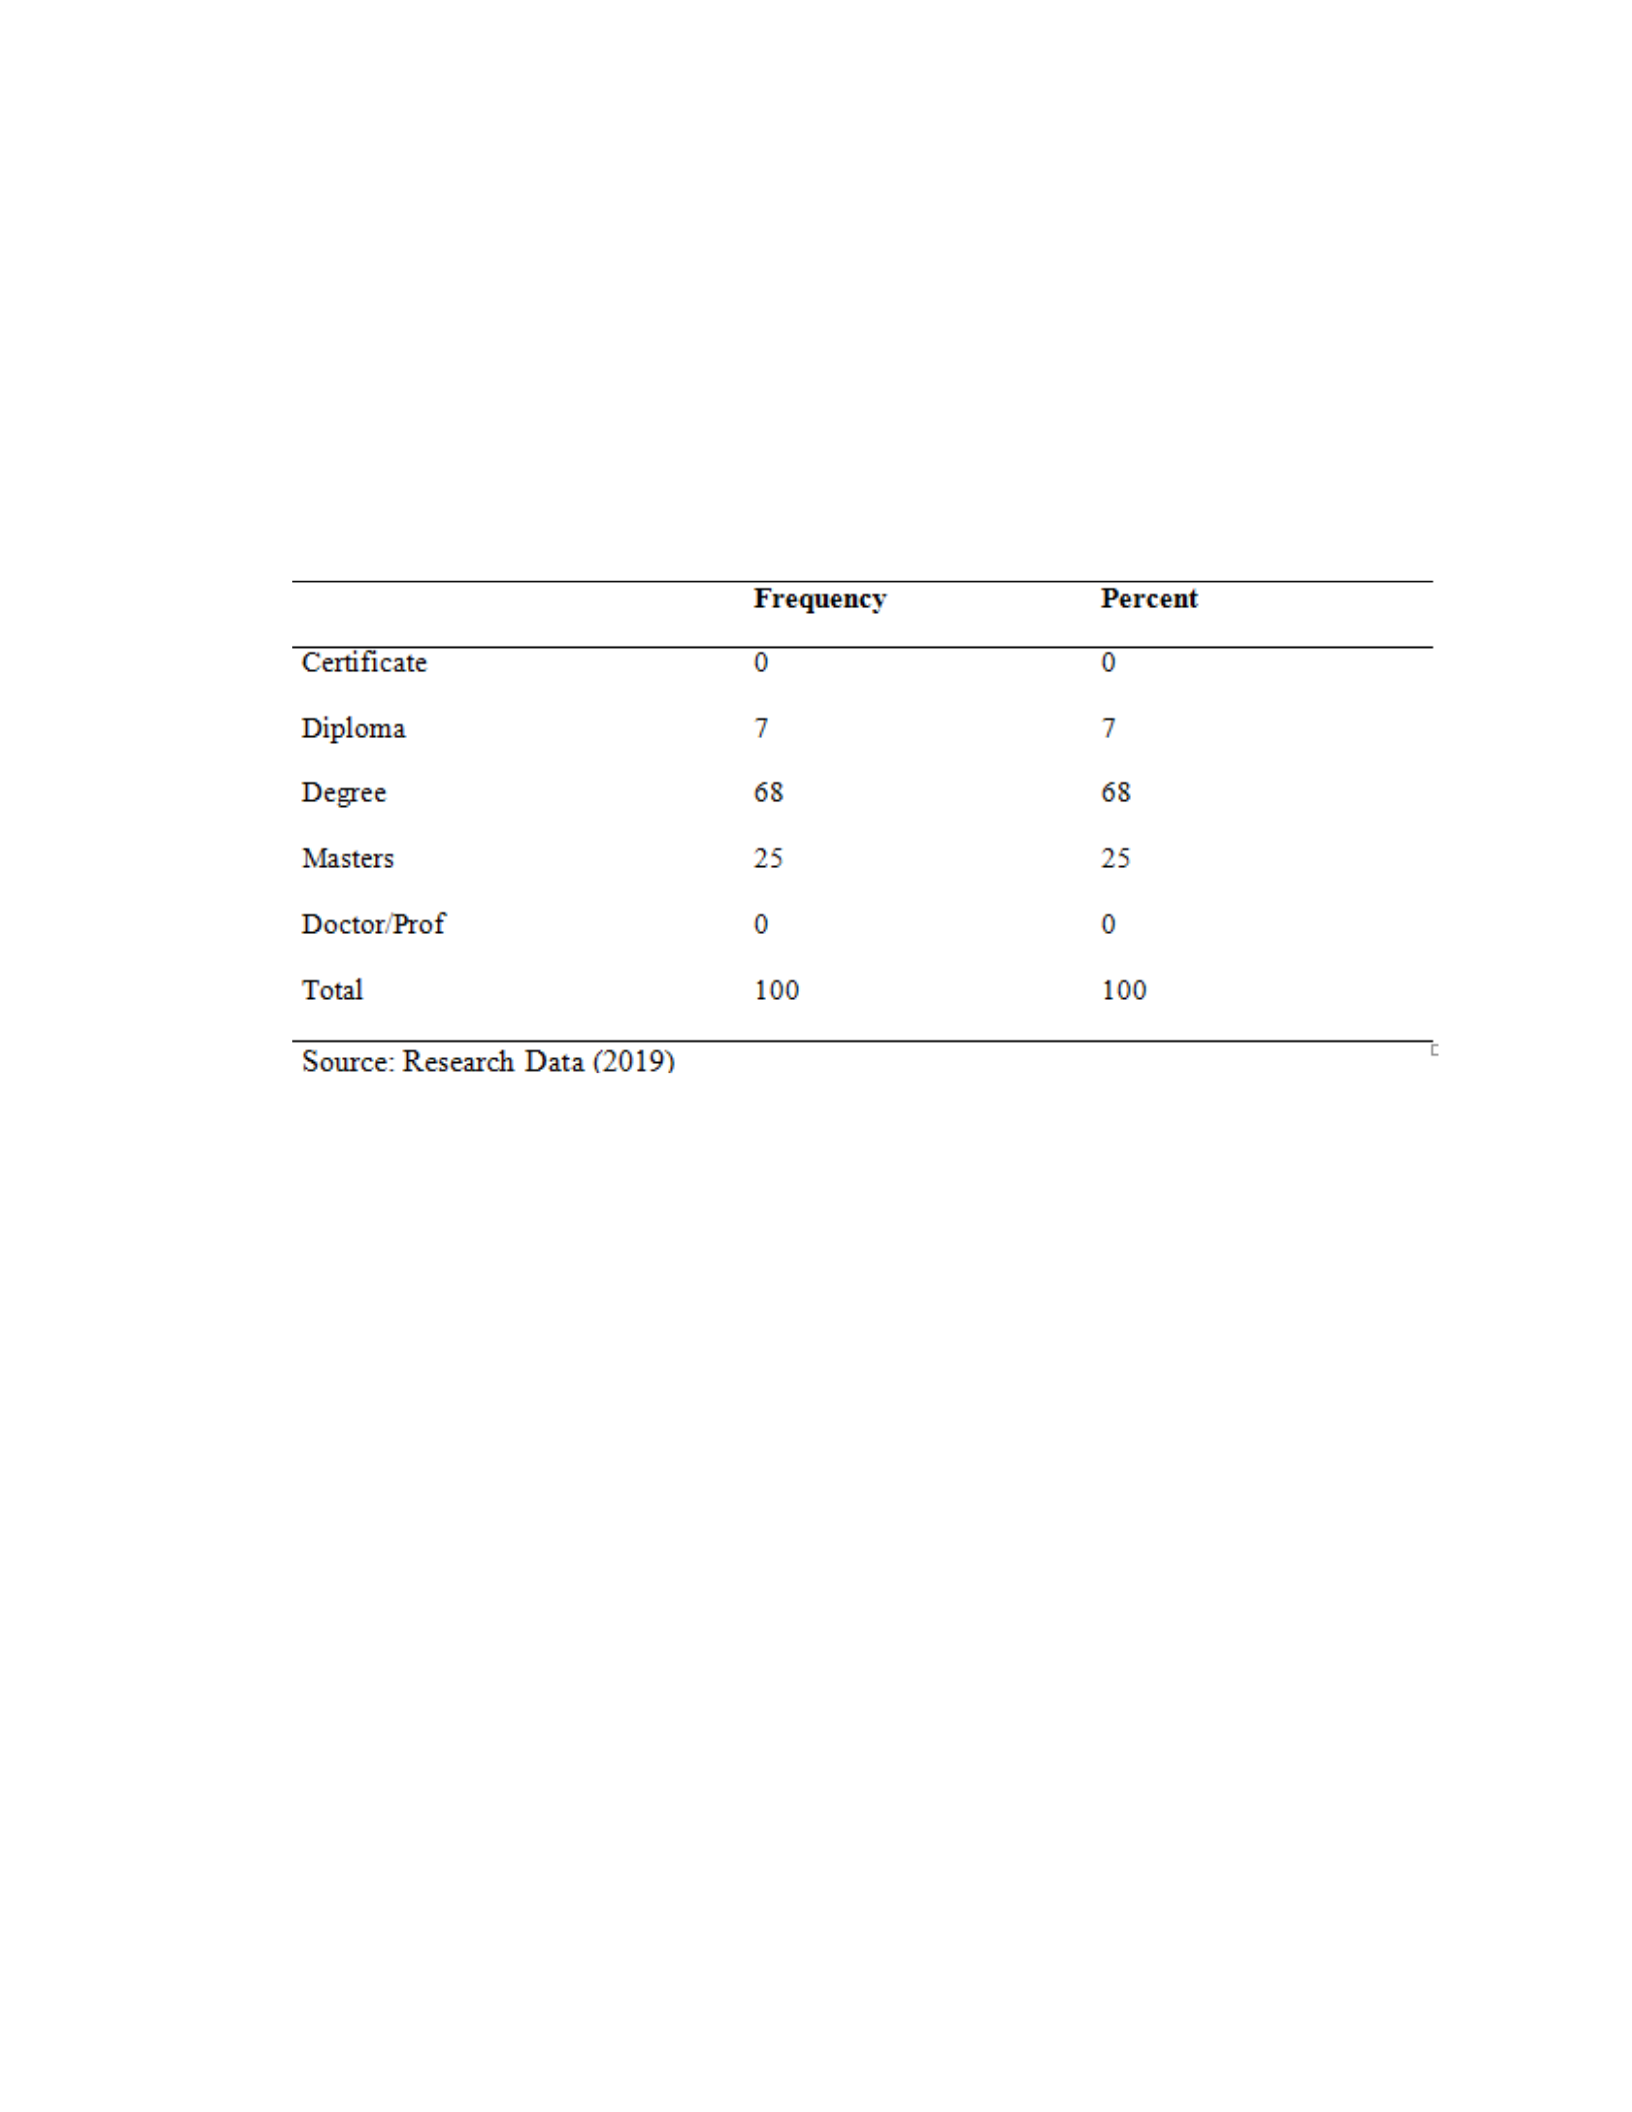
Table 4.3: Age
Table 4.3 displays that the highest proportion of the respondents that constitutes 54% are
of the ages between 26 - 33. This was followed by respondents whose ages range from 34
to 41 at 23%. The least proportion of the respondents (1%) were aged 50 years and
above. Younger individuals are known to be more receptive to technology than aged
individuals.
Education Level
The target respondents were requested to specify their education level. This was to
ascertain if education level has any bearing on perception of electronic customer
relationship management.
Table 4.4: Education Level
Table 4.4 showcases that those respondents with a degree level of education constituted
the highest proportion of 68%. Respondents with masters and diploma qualification
constituted 25% and 7% respectively. No respondent had a doctorate qualification. It is
expected that individuals with higher educational qualifications have higher exposure to
technology.
Area of Specialization
The target respondents were requested to specify their area of specialization. This was to
establish if area of specialization has any bearing on perception of electronic customer
relationship management.
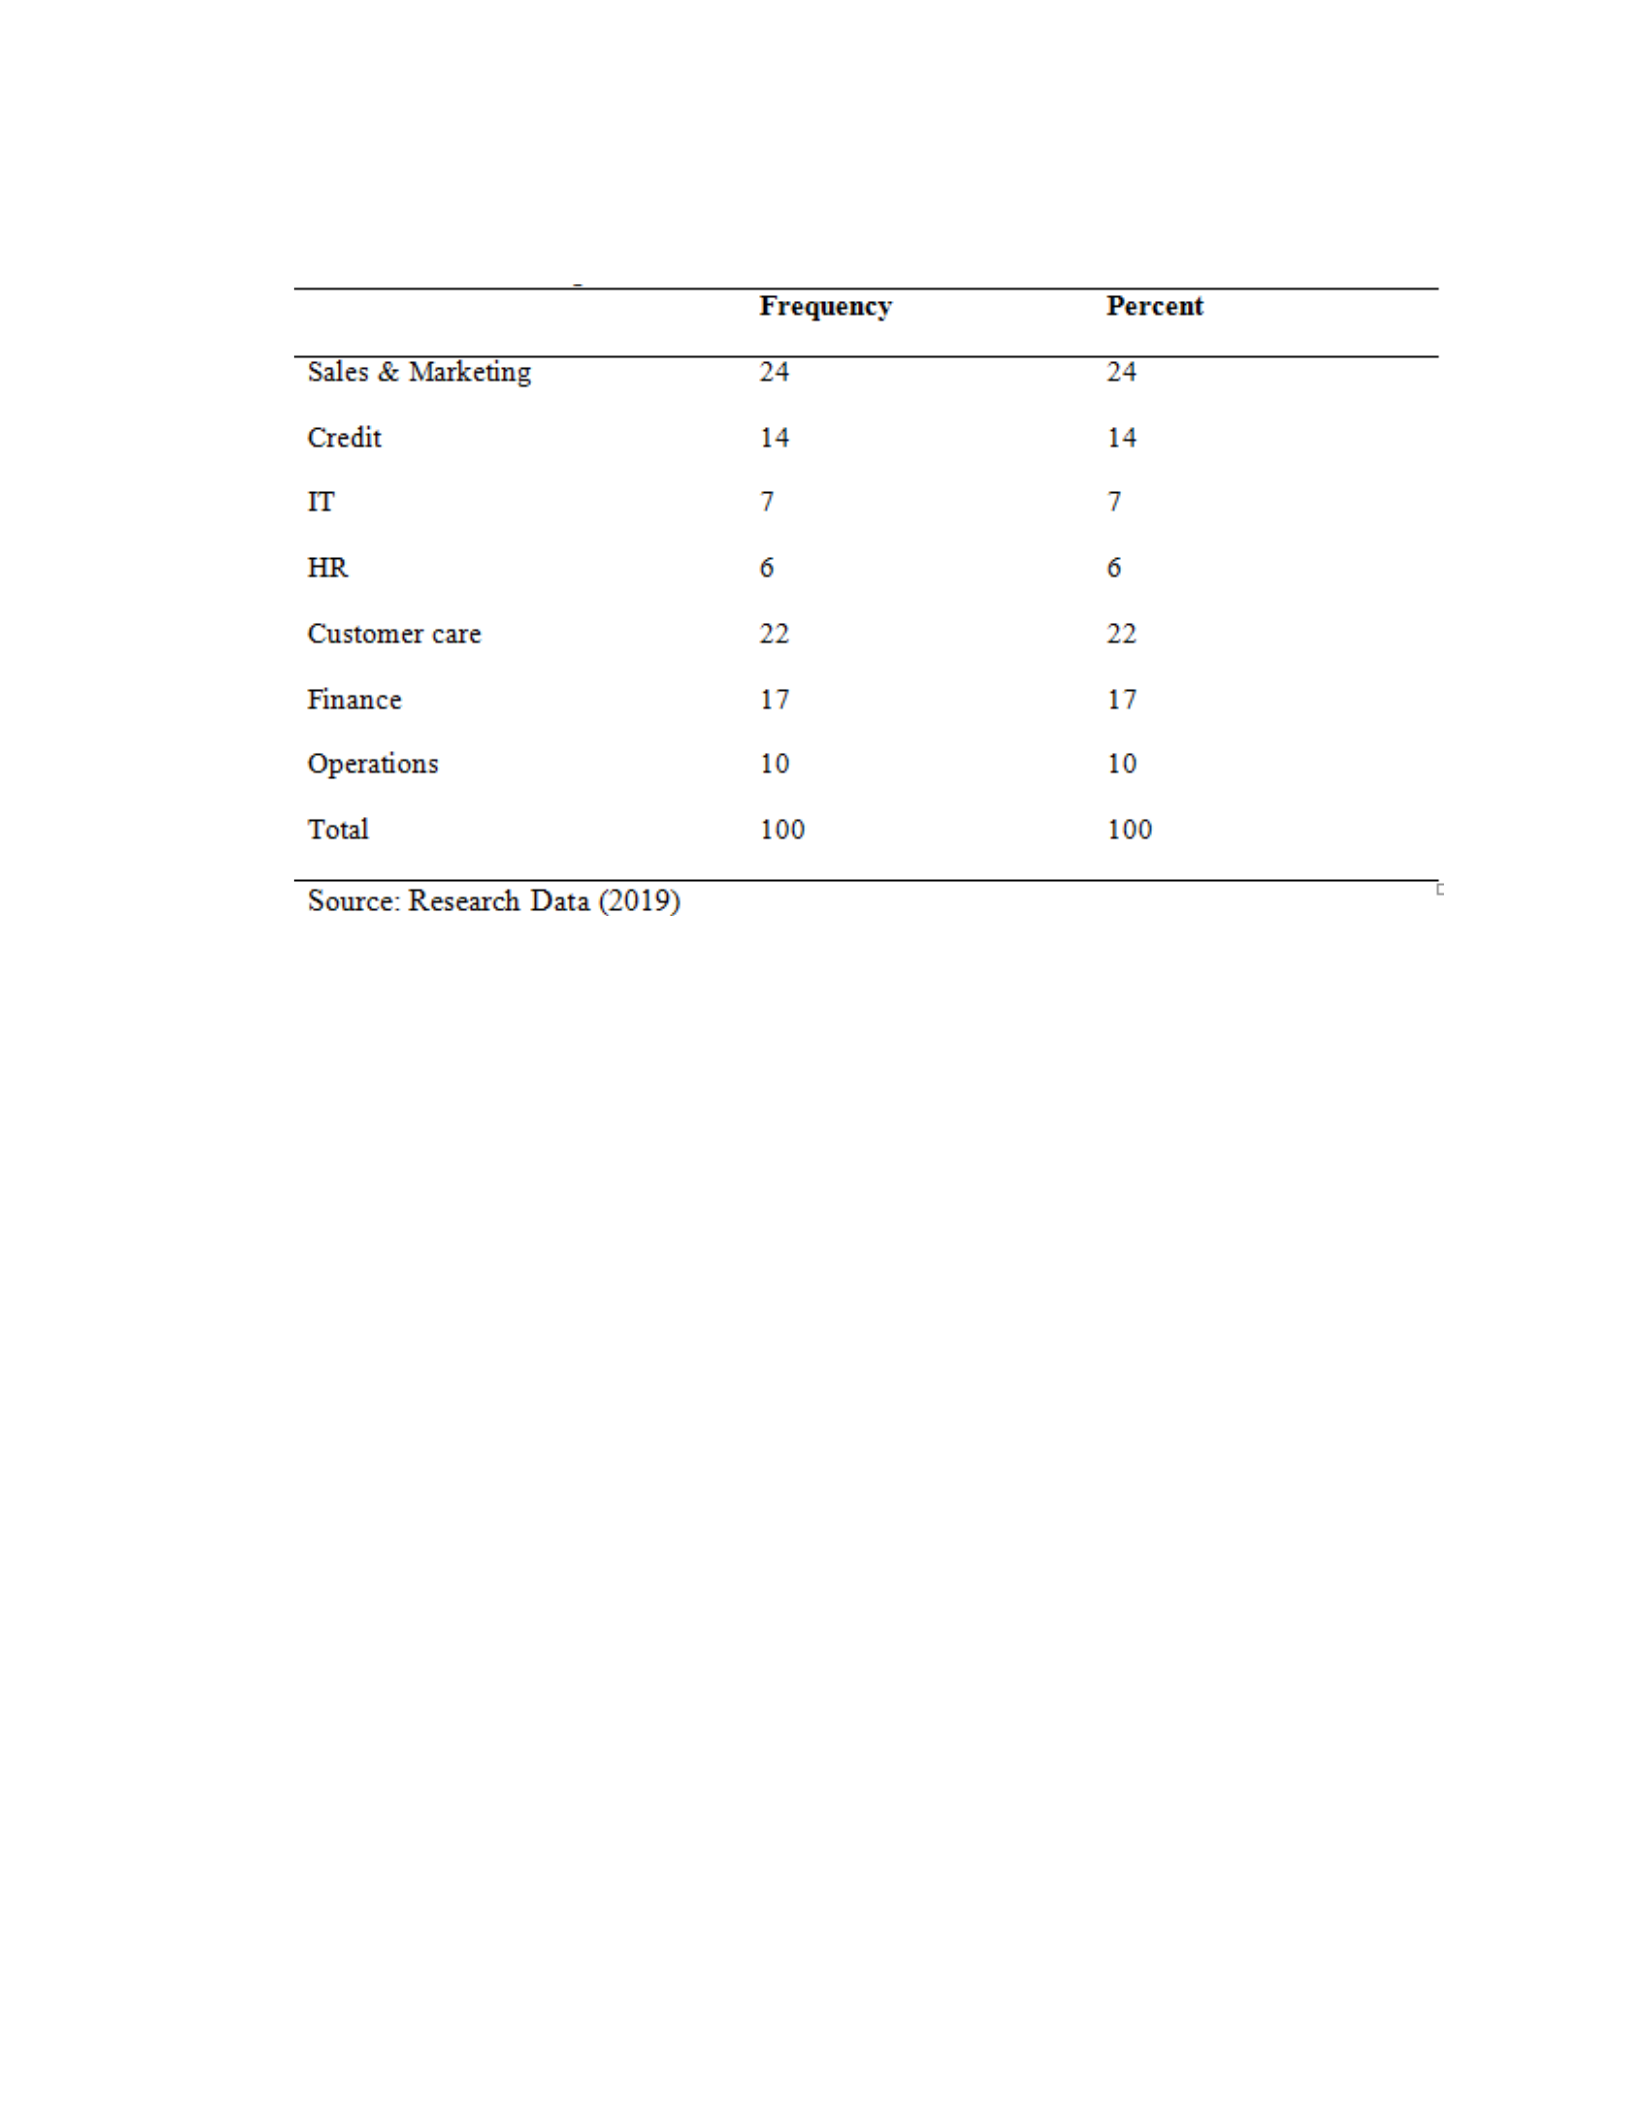
Table 4.5: Area of Specialization
Table 4.5 exhibits that the most common area of specialization of the respondents was
sales and marketing (24%) and customer care (22%). Those who worked in the finance,
credit, and operations department constituted 17%, 14%, and 10% respectively. The least
proportion of respondents were those whose area of specialization included IT and human
resources and they constituted 7% and 6% respectively. The even spread of area of
specialization is an indication of lack of bias in the data collected because the respondents
were randomly distributed. It is also expected that individuals who work in the customer
care department are more knowledgeable on matters pertaining to electronic customer
relationship management.
Management Level
The target respondents were requested to specify their management levels in their
respective organizations. This was to establish if management level has any bearing on
perception of electronic customer relationship management.
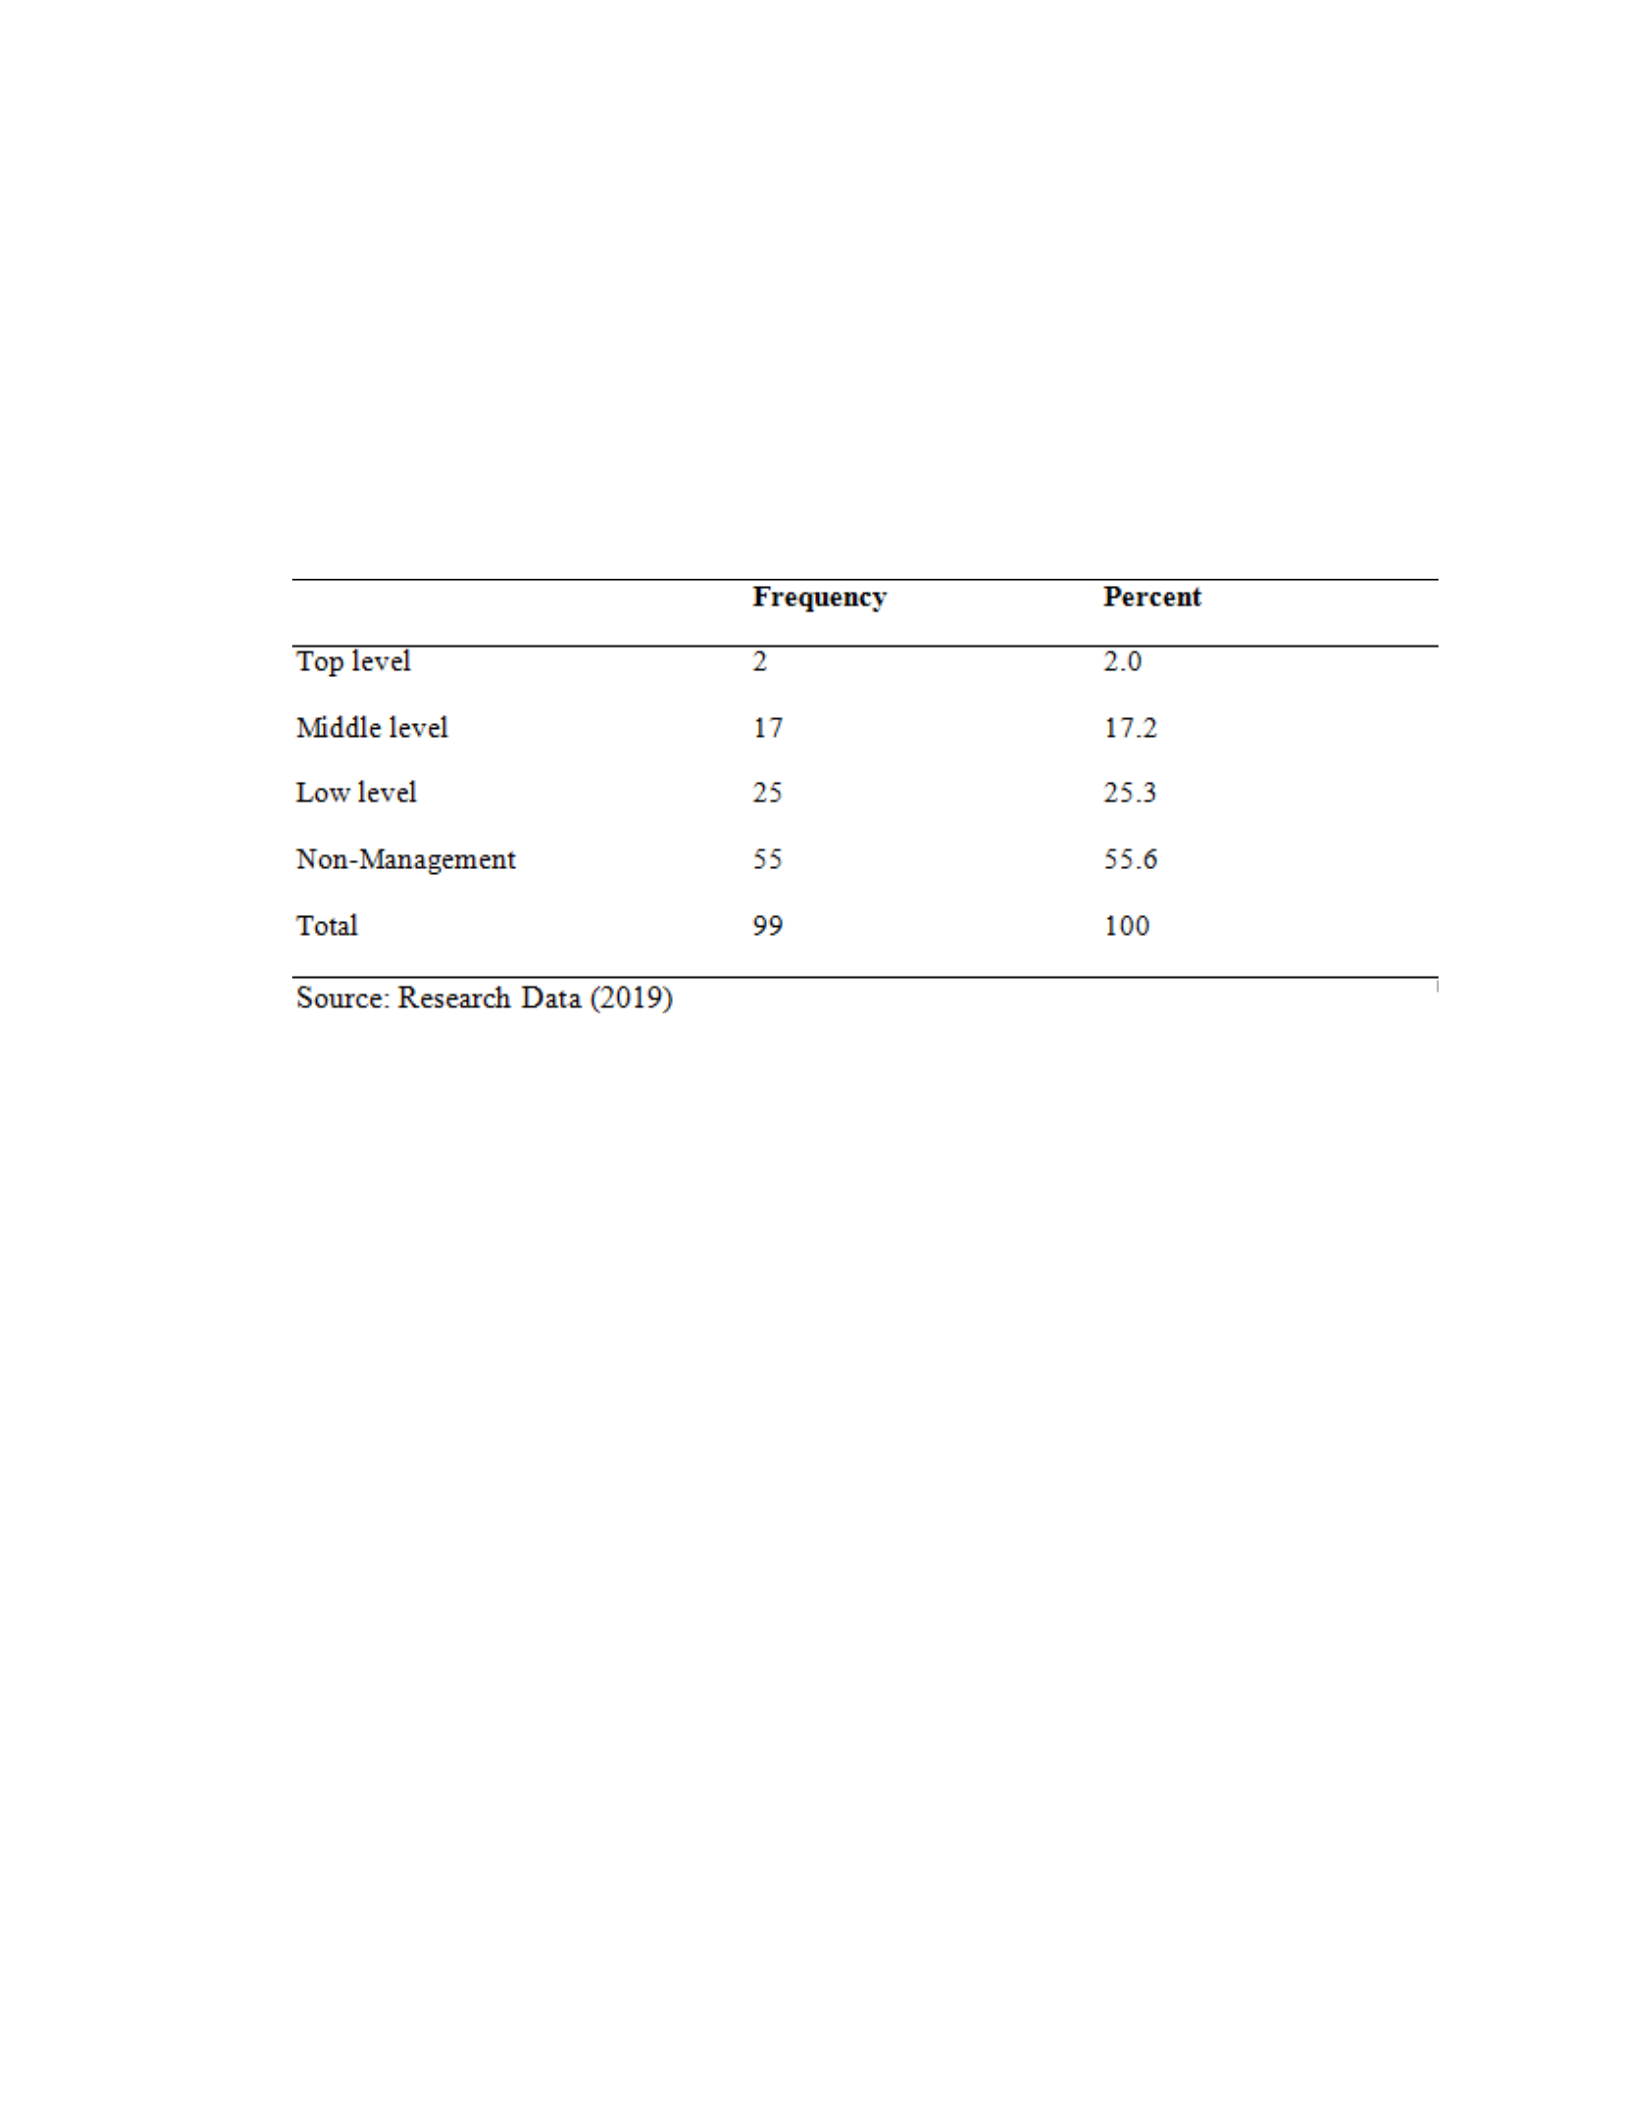
Table 4.6: Management Level
Table 4.6 shows that most of the respondents (55.6%) were at the non-management level
in their respective banks followed by 25.3% and 17.2% of the respondents were in the
low and middle management levels. The least proportion of the respondents (2%) were in
the top management level. The uneven spread of management level maybe an indication
of bias although the respondents were randomly distributed. It is also expected that
individuals in higher management levels are more conversant with electronic customer
relationship management because they are part of formulating and implementing the
strategy.
Employment Duration
The target respondents were requested to specify their duration of employment in the
banking sector. This was to establish if work experience has any bearing on perception of
electronic customer relationship management.
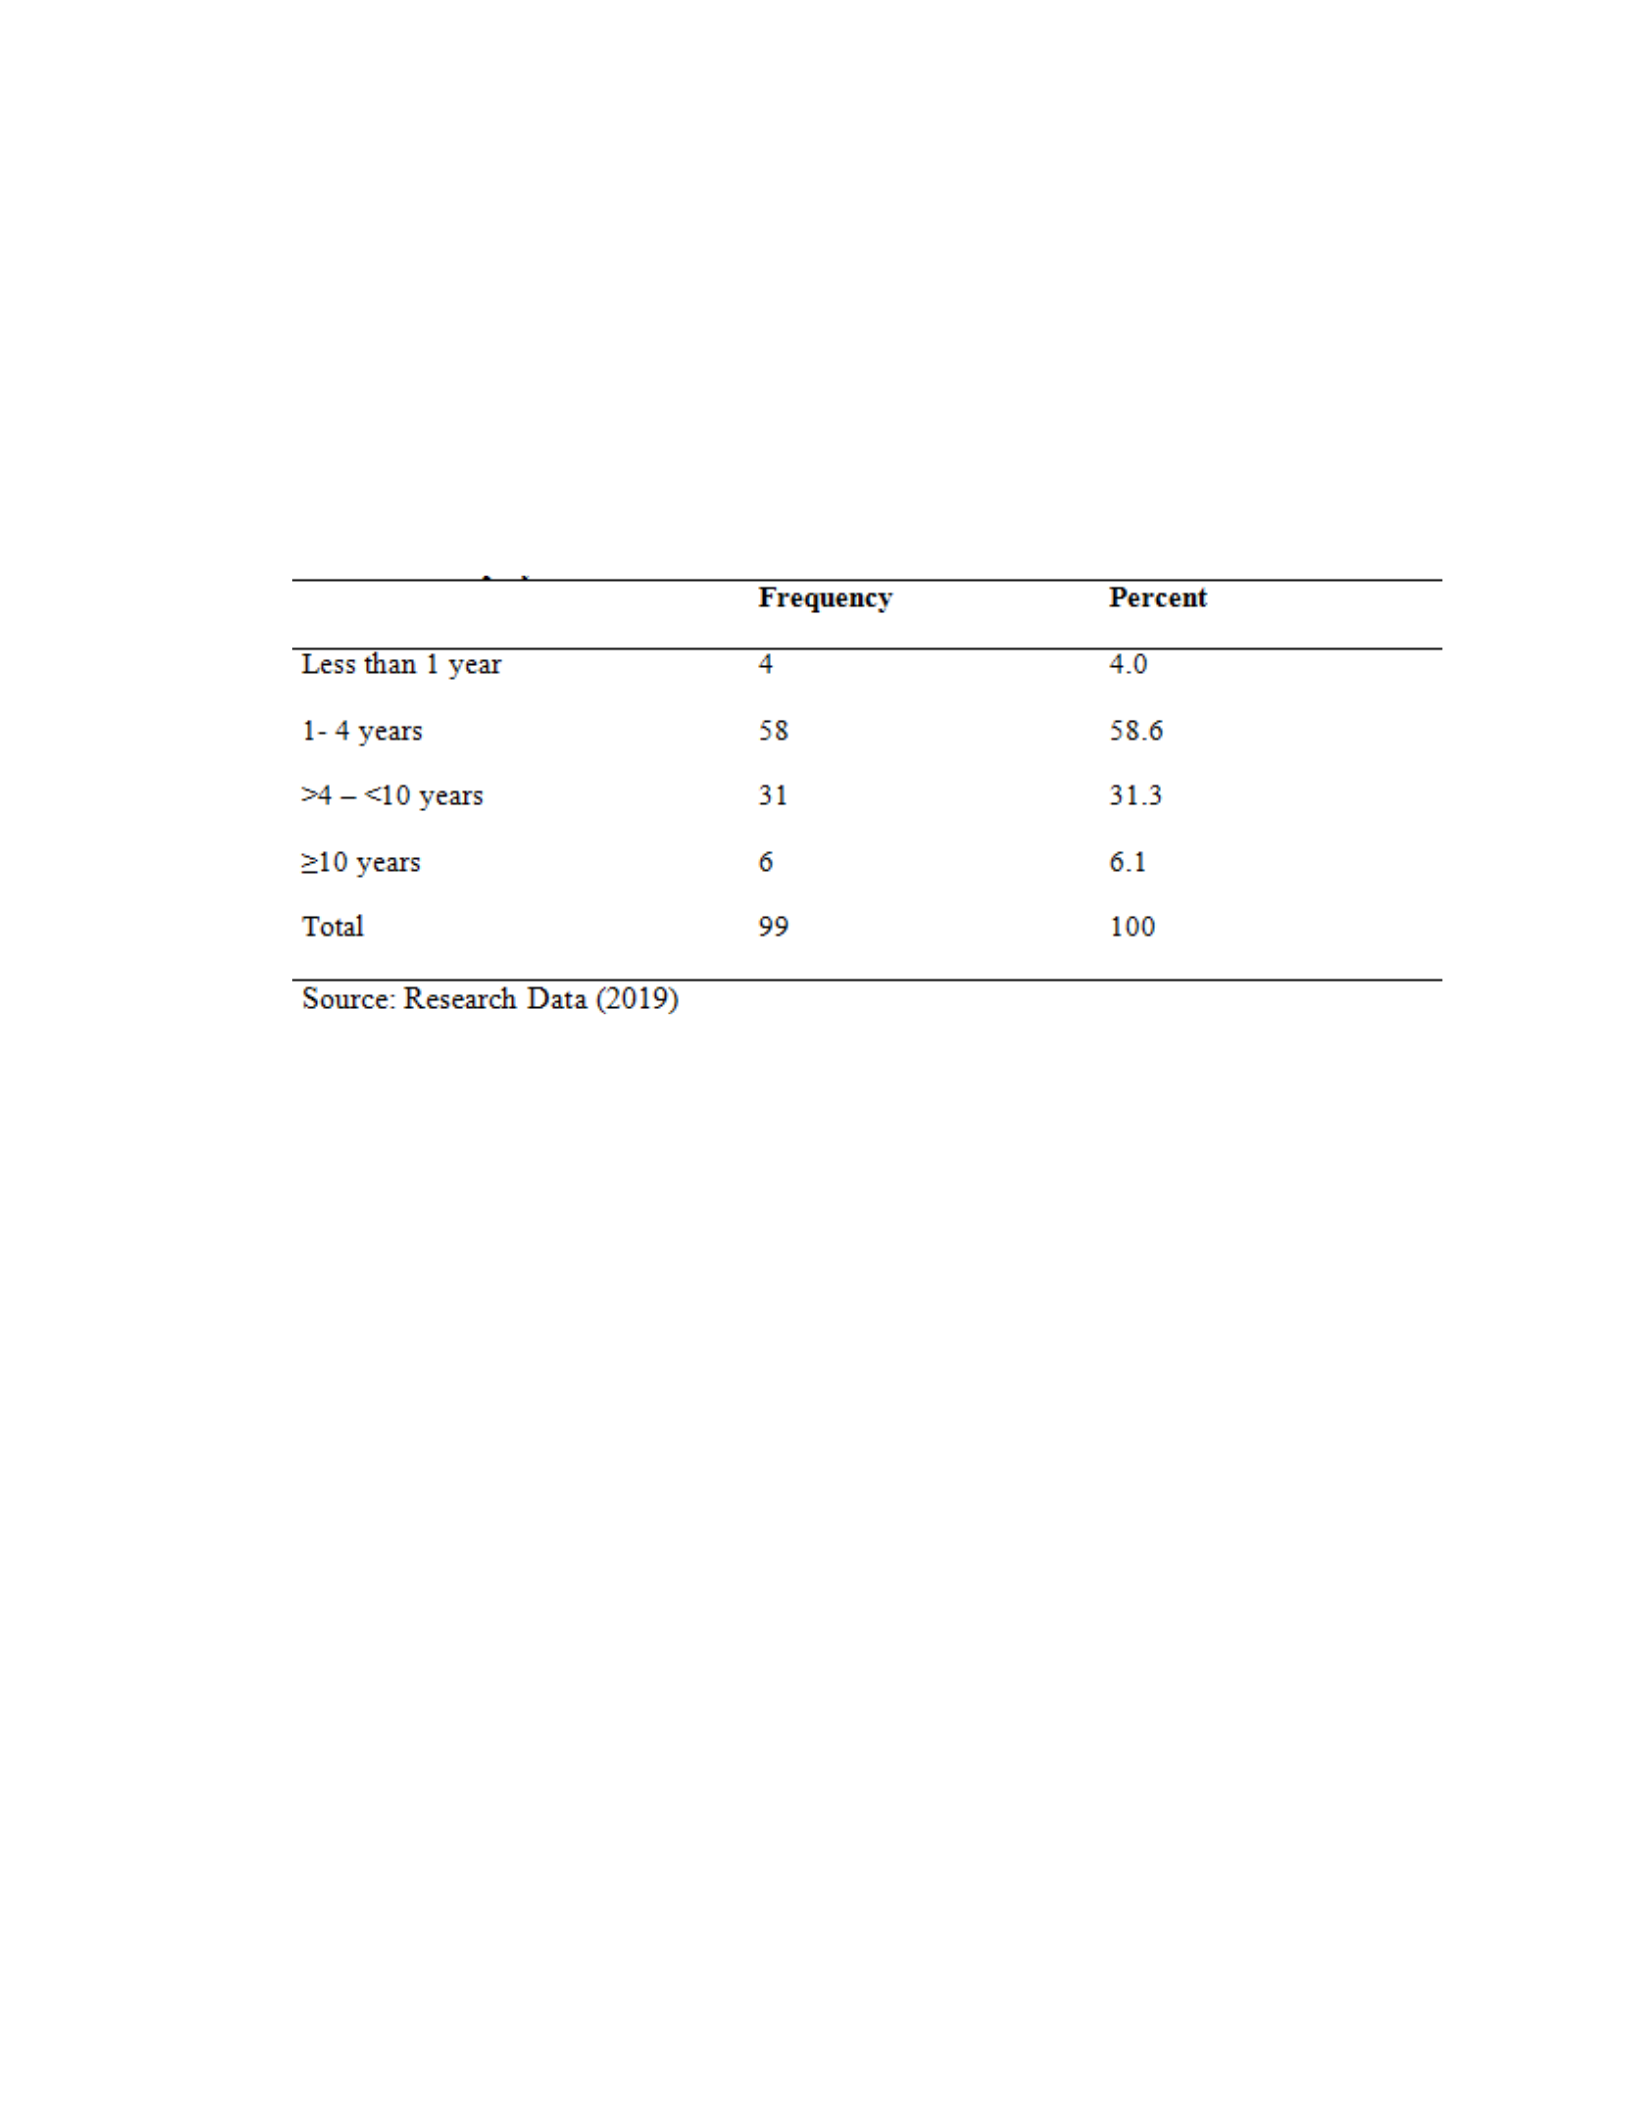
Table 4.7: Employment Duration
Tale 4.7 exhibits that the employment duration of between 1-4 years was the most
common among the respondents (58.6%). Those who had employment experience of
between 4 to 10 years and over 10 years constituted 31% and 6% respectively. Those
who had work experience of less than one year constituted the least proportion of 4%.
The even spread of employment duration is an indication of lack of bias in the data
collected because the respondents were randomly distributed. It is expected the more an
individual works in an organization the more that individual is conversant with the
organizations operations and strategies. Thus it is expected in this study that individuals
with greater work experience are more conversant with electronic customer relationship
management.
Descriptive Statistics
The study settled on descriptive cross-sectional research design since it allows findings
generalization, analysis and variables relation. Among the variables used were electronic
customer relationship management and competitive advantage, which were the predictor
variables, while organizational performance was the response variable.
Electronic Customer Relationship Management
The respondents were asked to state their most preferred mode of correspondence with
the bank as shown in Table 4.8 below.
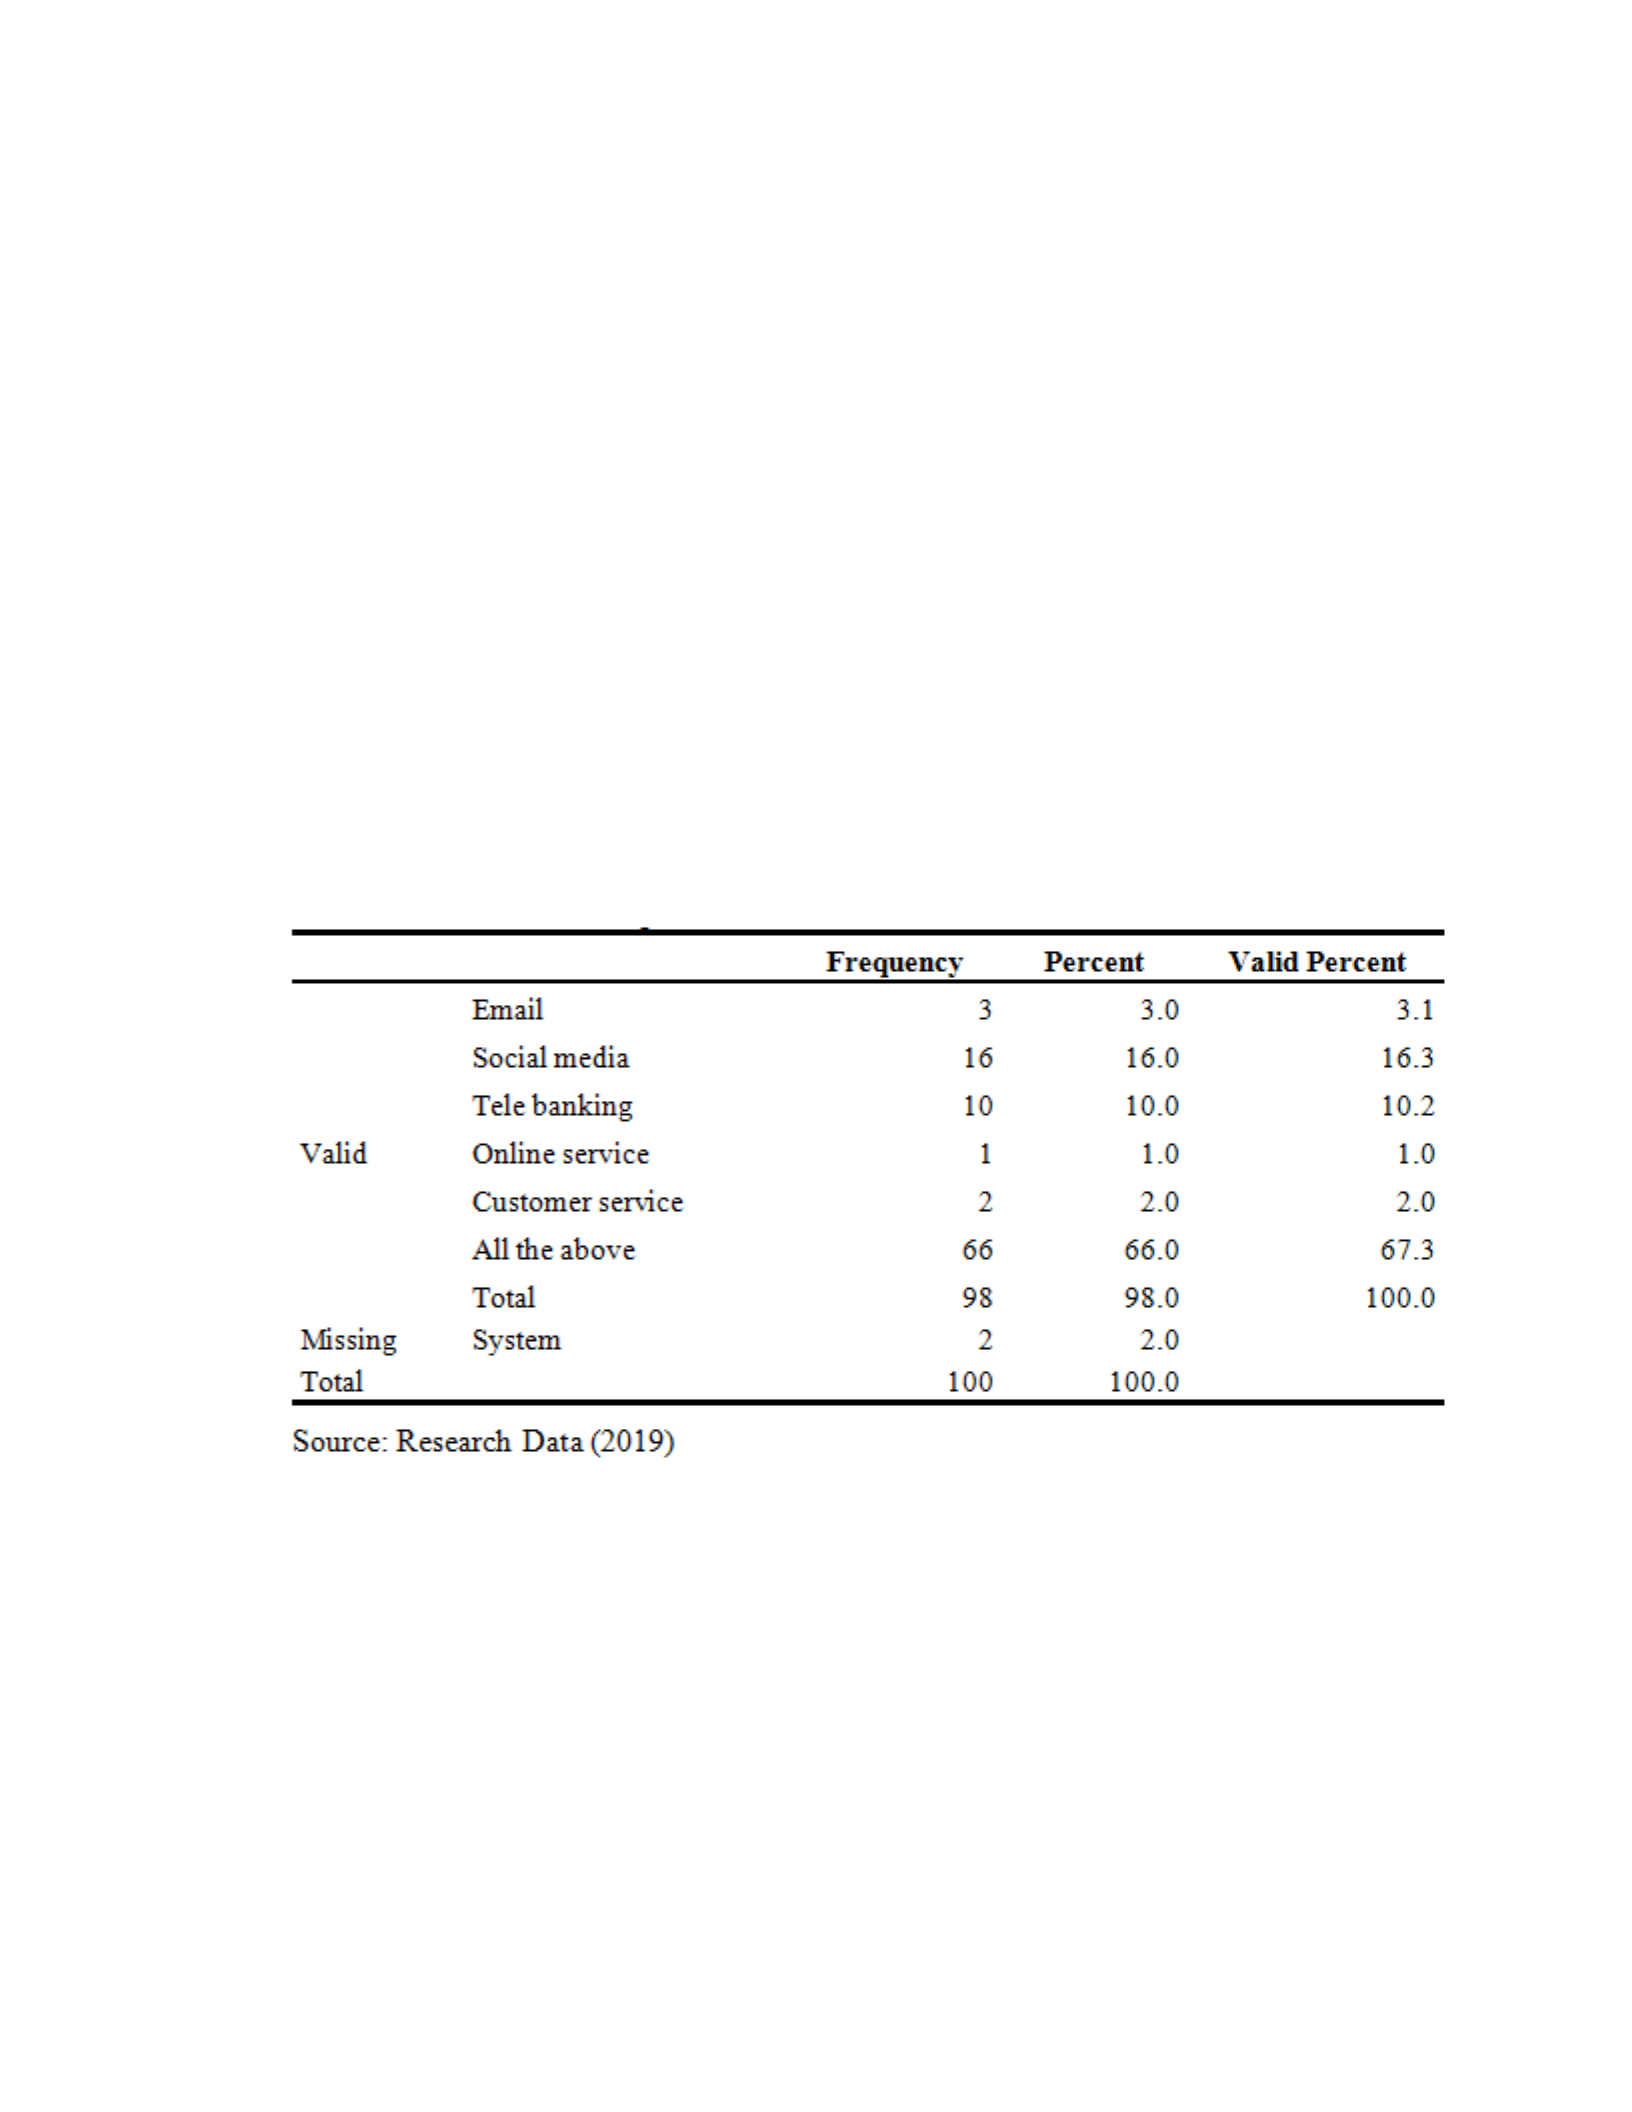
Table 4.8: Mode of Correspondence with the Bank
Table 4.8 displays that a majority of the participants (67.3%) preferred to correspond
with their banks through all the available communication modes as is displayed in Table
4.8. These were email services, social media, tele-banking, online services and customer
services. Respondents who preferred a specific single communication mode were 32.7%.
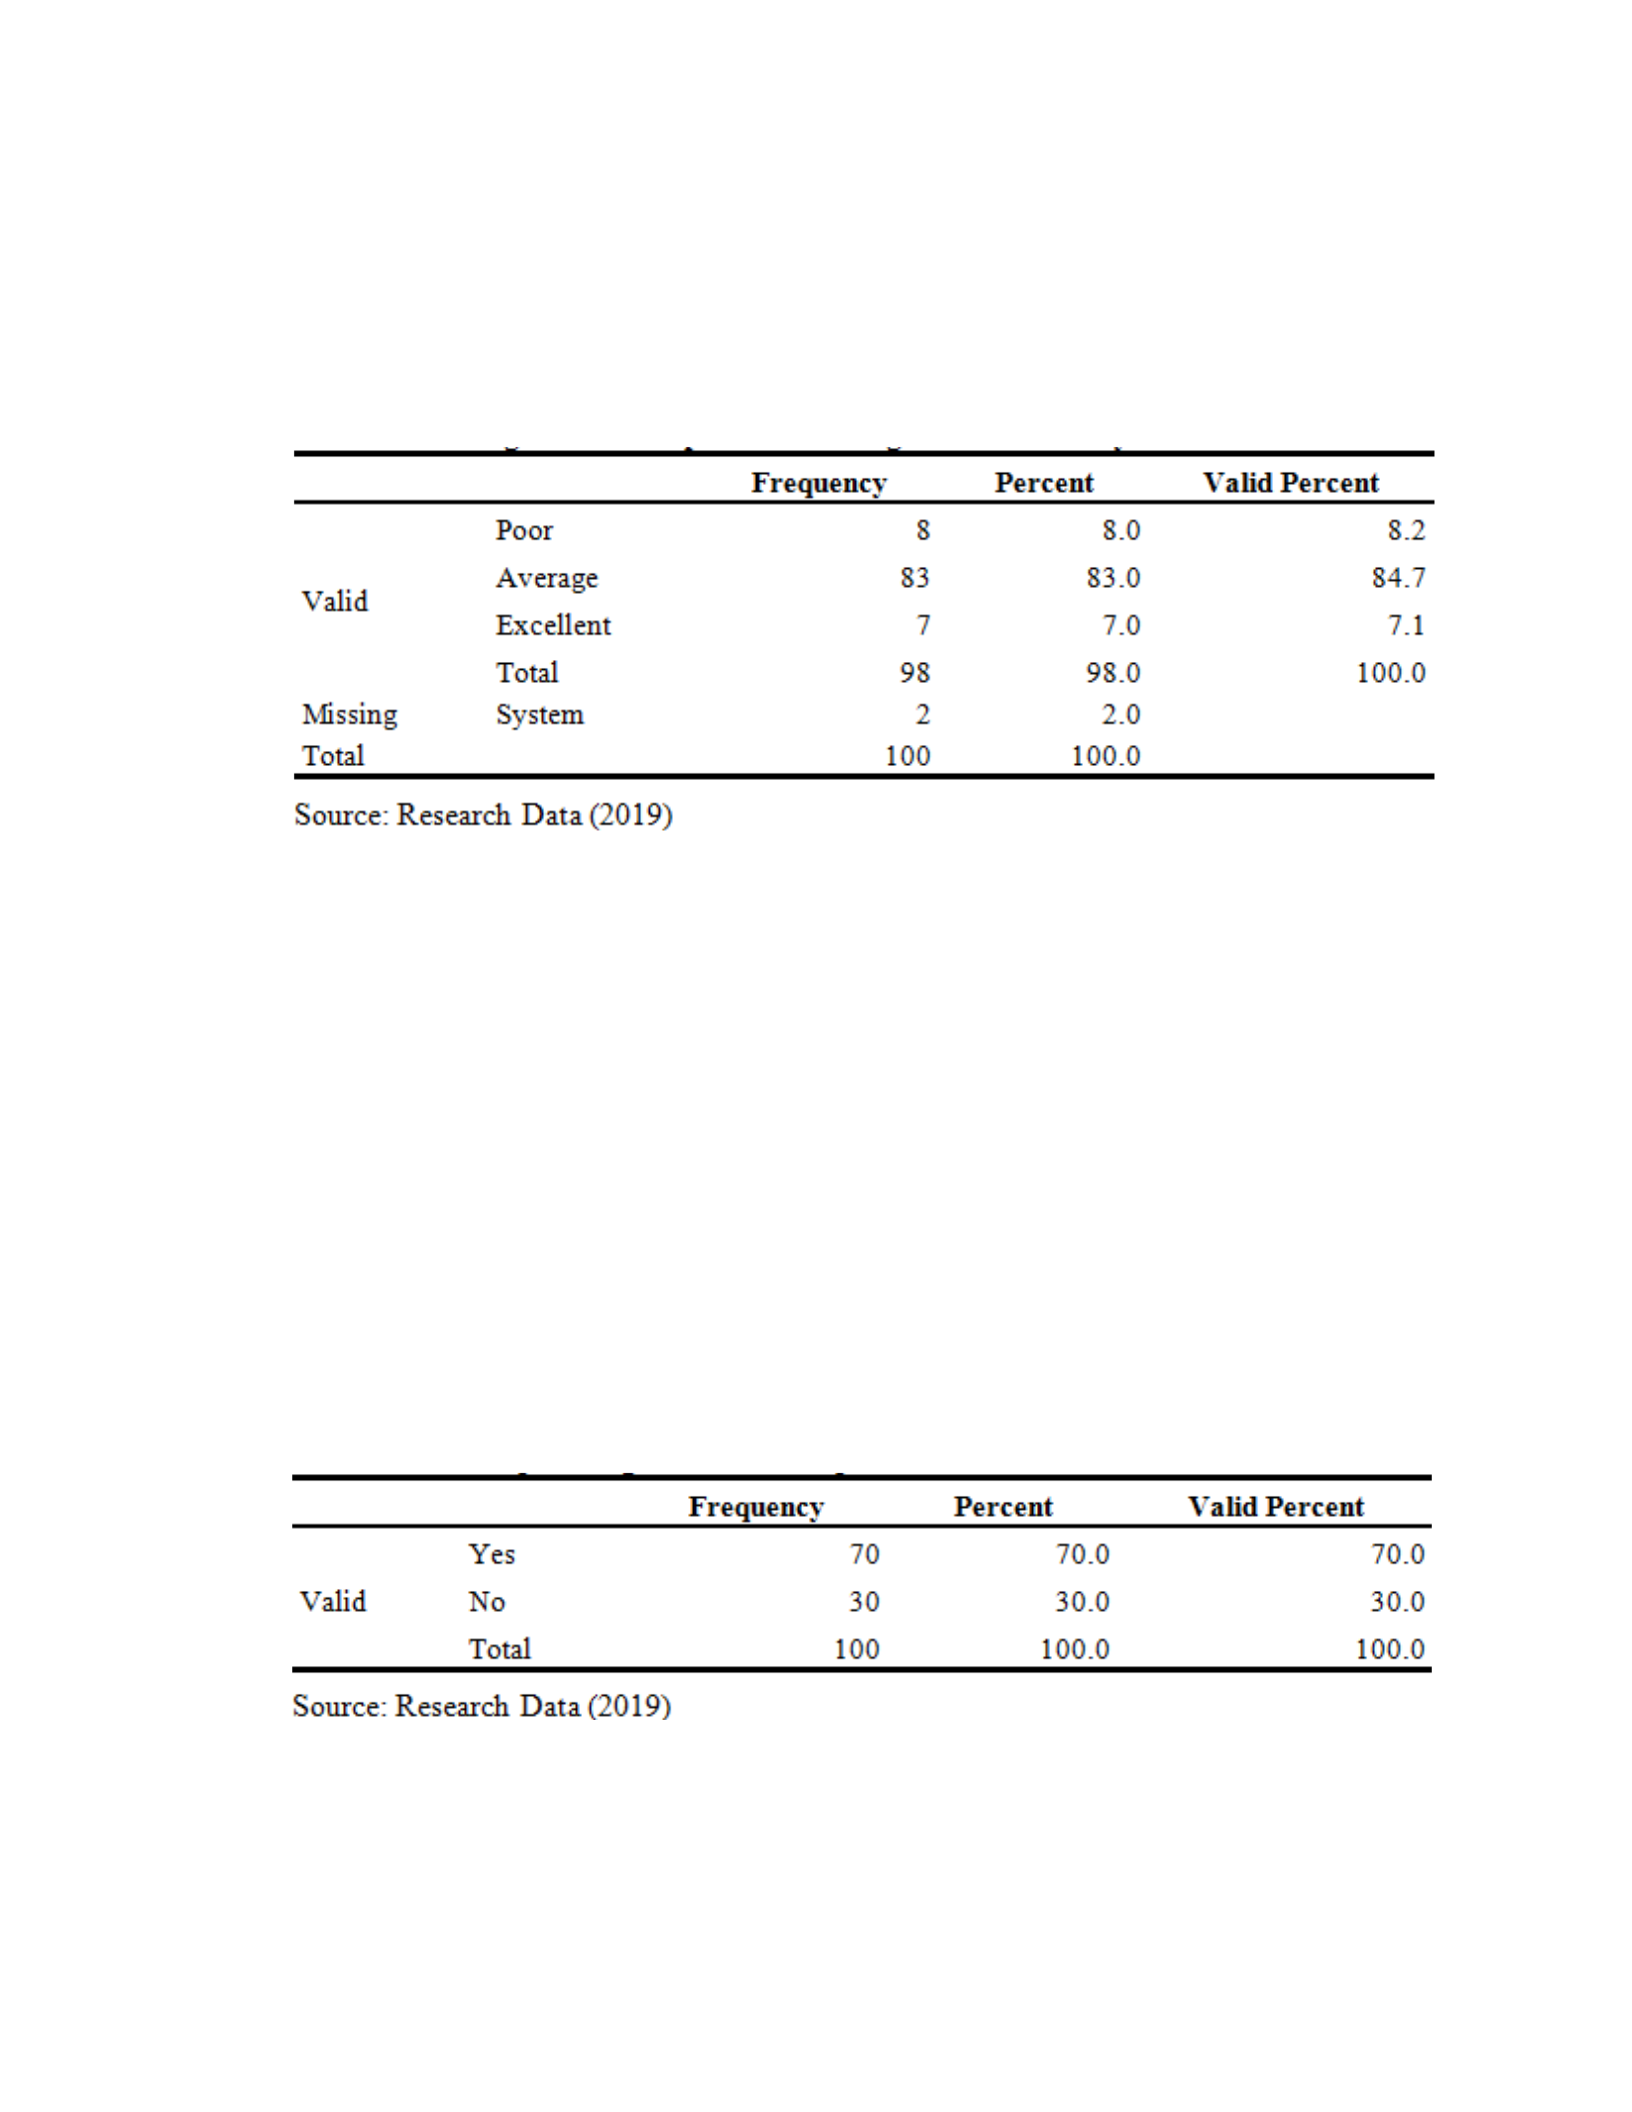
The respondents were asked to rate their respective banks response rate when using the
electronic system. They gave their ratings as shown in Table 4.9 below.
Table 4.9: Rating of Bank Response Rate using the Electronic System
Table 4.9 showcases that the banks response to general enquiries was rated by the
majority of the respondents as average (84.7%). Of the respondents, 8.2%, rated it as
poor while the least proportion of the respondents (7.1%) rated it as excellent.
The respondents were asked to indicate if the customers are in receipt of regular account
updates (Table 4.10).
Table 4.10: Receipt of Regular Account Updates
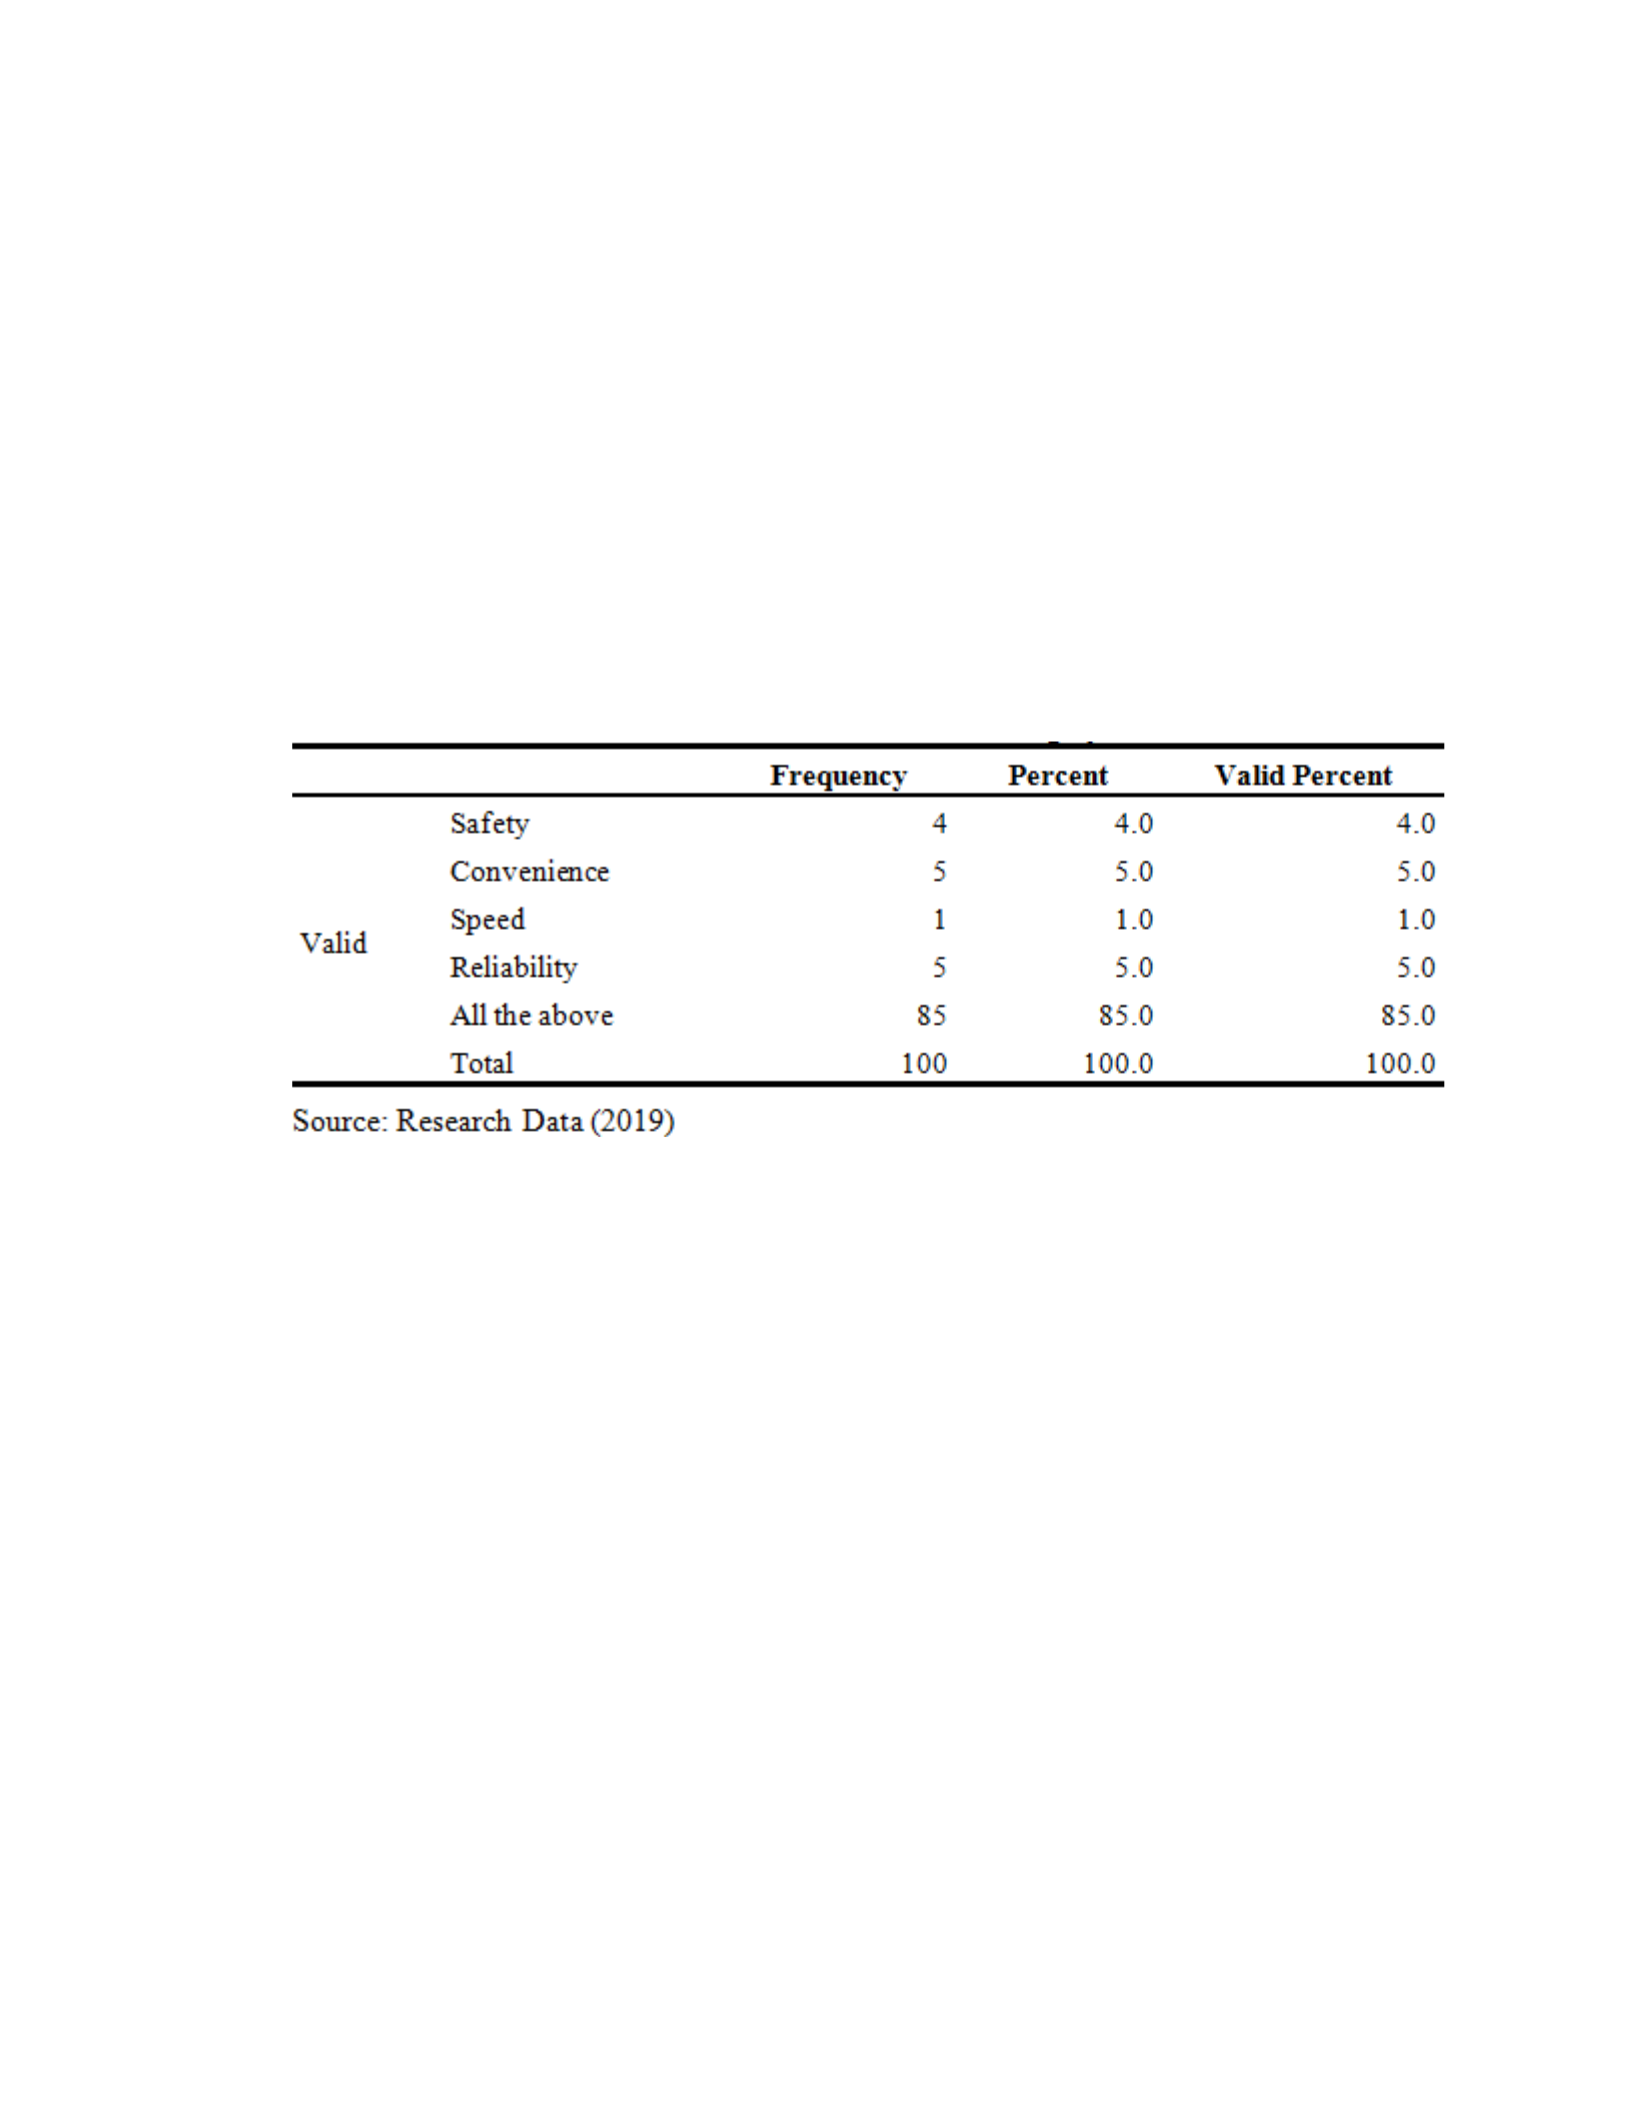
Table 4.10 exhibits that more than two-thirds of the respondents (70%) reported receiving
constant updates on their account status. Conversely, 30% of the respondents indicated
not receiving regular updates on their account status.
The respondents were also asked to indicate what attribute they valued most in an
electronic banking system (Table 4.11).
Table 4.11: Attribute valued most in an Electronic Banking System
Table 4.11 exhibits that most of the participants (85%) valued safety, convenience, speed
and reliability when using e-banking systems as shown in Table 4.11. The rest of the
respondents valued only one of the attributes.
The respondents were asked to state the issues customers mainly raised complaints about.
Findings are indicated in Table 4.12.
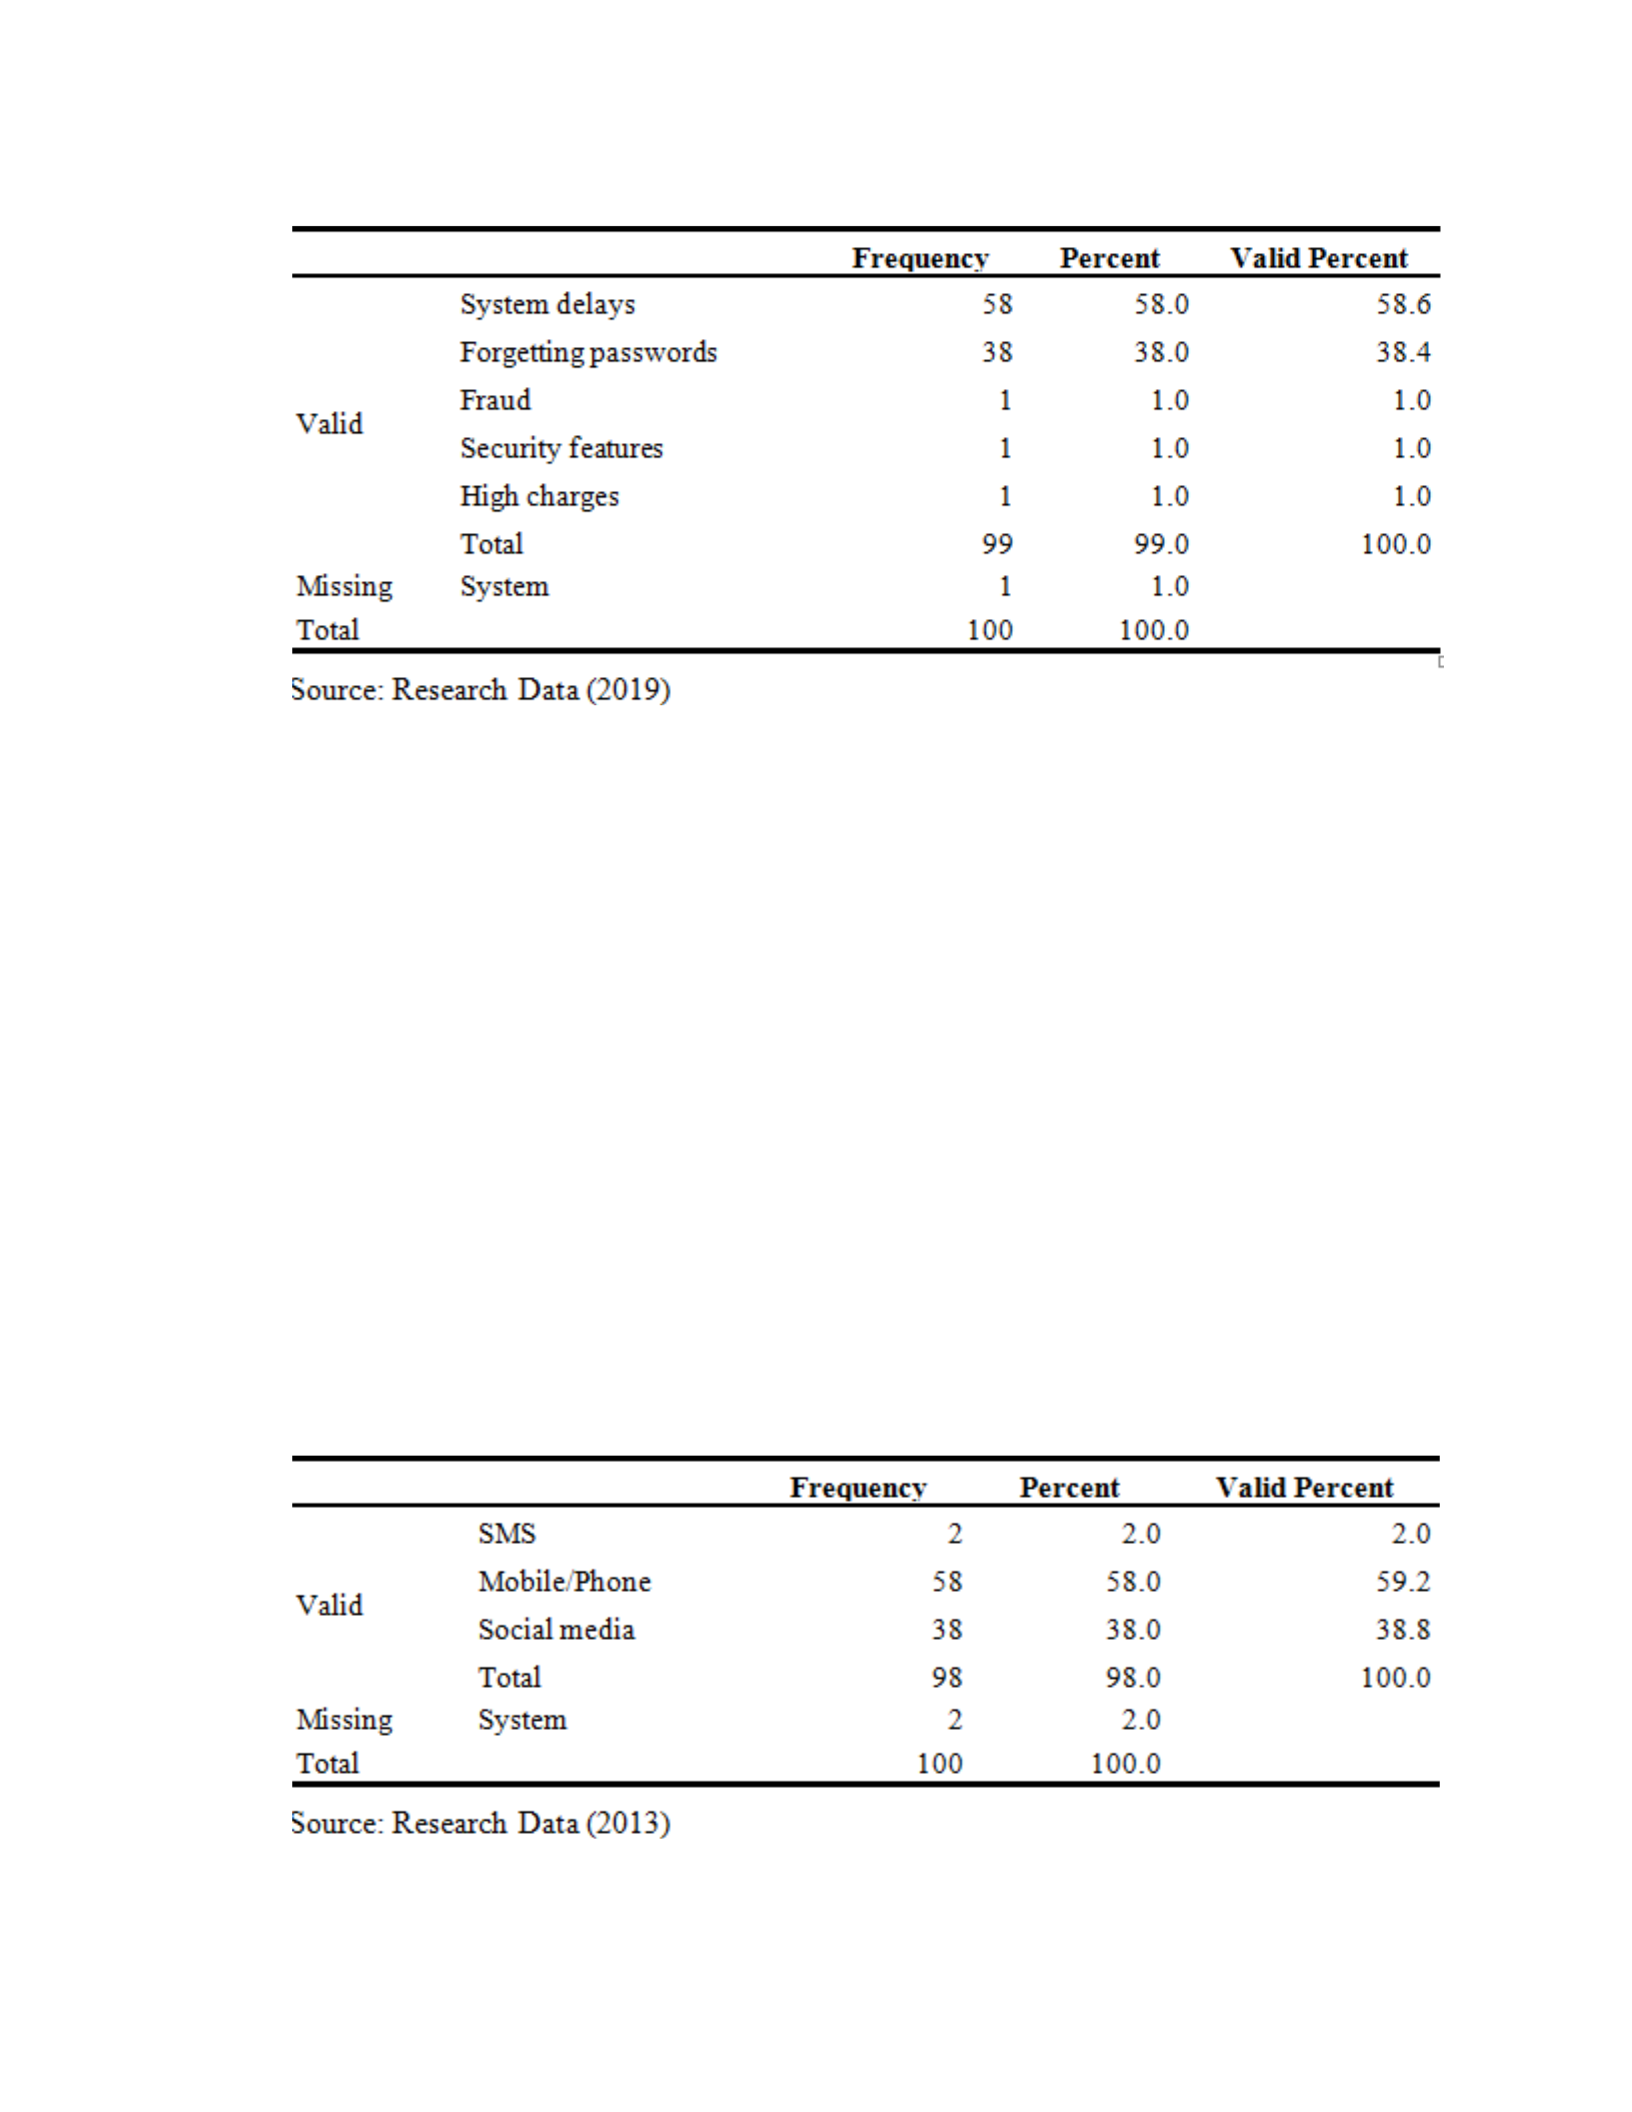
Table 4.12: Most Common Customer Complaints
The data in Table 4.12 shows that customers mainly raised complaints on system delays
with a proportion of 58.6% while 38.4% of the respondents indicated that the customers
raised complaints on forgetting passwords. The proportion of respondents that cited
fraud, security features, and high charges constituted 1% each.
The respondents were asked to state the quickest mode of communication to solve
customers’ electronic banking issues. Findings are indicated in Table 4.13.
Table 4.13: Quickest Mode of Communication to Solve Customers’ Electronic Banking
Issues

The findings in Table 4.13 indicate 59.2% of the respondents indicate that the quickest
mode of communication to solve customers’ electronic banking issues is through mobile
phone communication. Social media and SMS were cited at 38.8% and 2% respectively.
The respondents were requested to rate the attributes of electronic customer relationship
management present in their respective organizations. Consequently, electronic customer
relationship management descriptive statistics were derived and the outcomes exhibited
in Table 4.14.
The attribute with the highest mean is “bank offers regular E-CRM training”, which has a
mean of 2.75 and a standard deviation of 0.936. The attribute with the lowest mean is
“mobile banking is efficient, effective convenient, fast and reliable with friends/family”
which has a mean of 1.22 and a standard deviation of 0.440. The attributes have an
overall mean of 1.77 and a standard deviation of 0.688, which implies that E-CRM is
exhibited to a small extent in Kenyan banks.
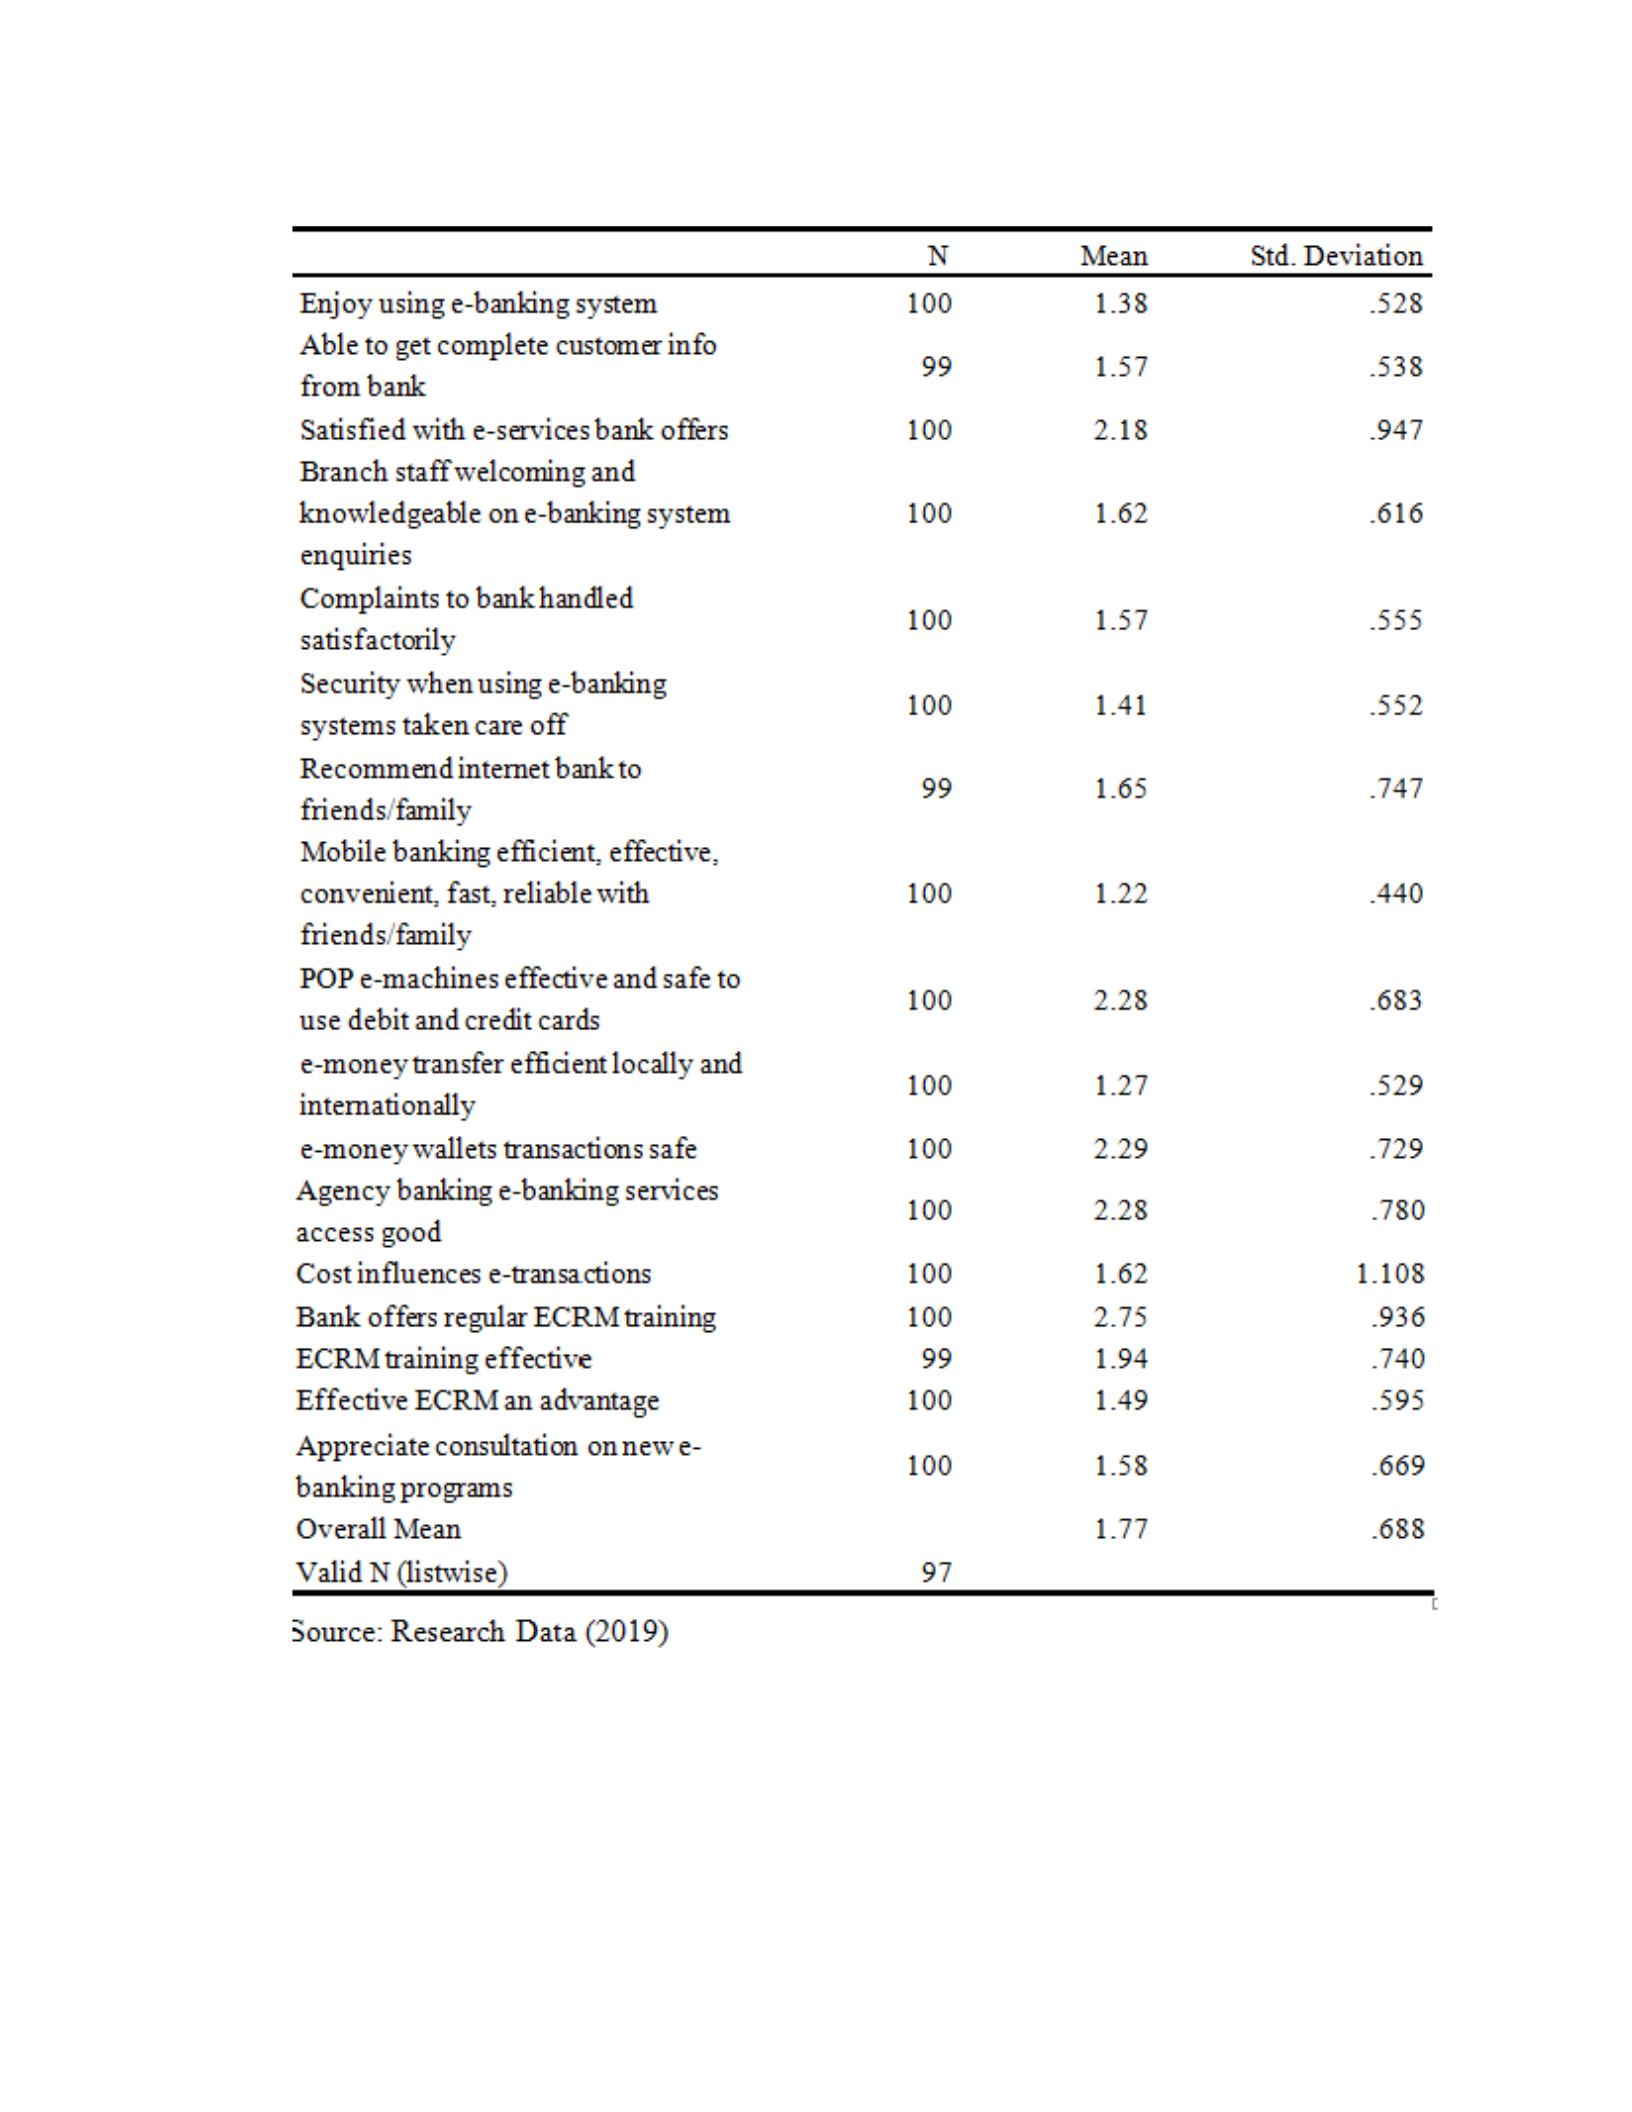
Table 4.14: Electronic Customer Relationship Management Descriptive Statistics
4.1.1 Competitive Advantage
The respondents were requested to rate the attributes of competitive advantage present in
their respective organizations. Consequently, competitive advantage descriptive statistics
were derived and the outcomes exhibited in Table 4.15.
Table 4.15: Competitive Advantage Descriptive Statistics
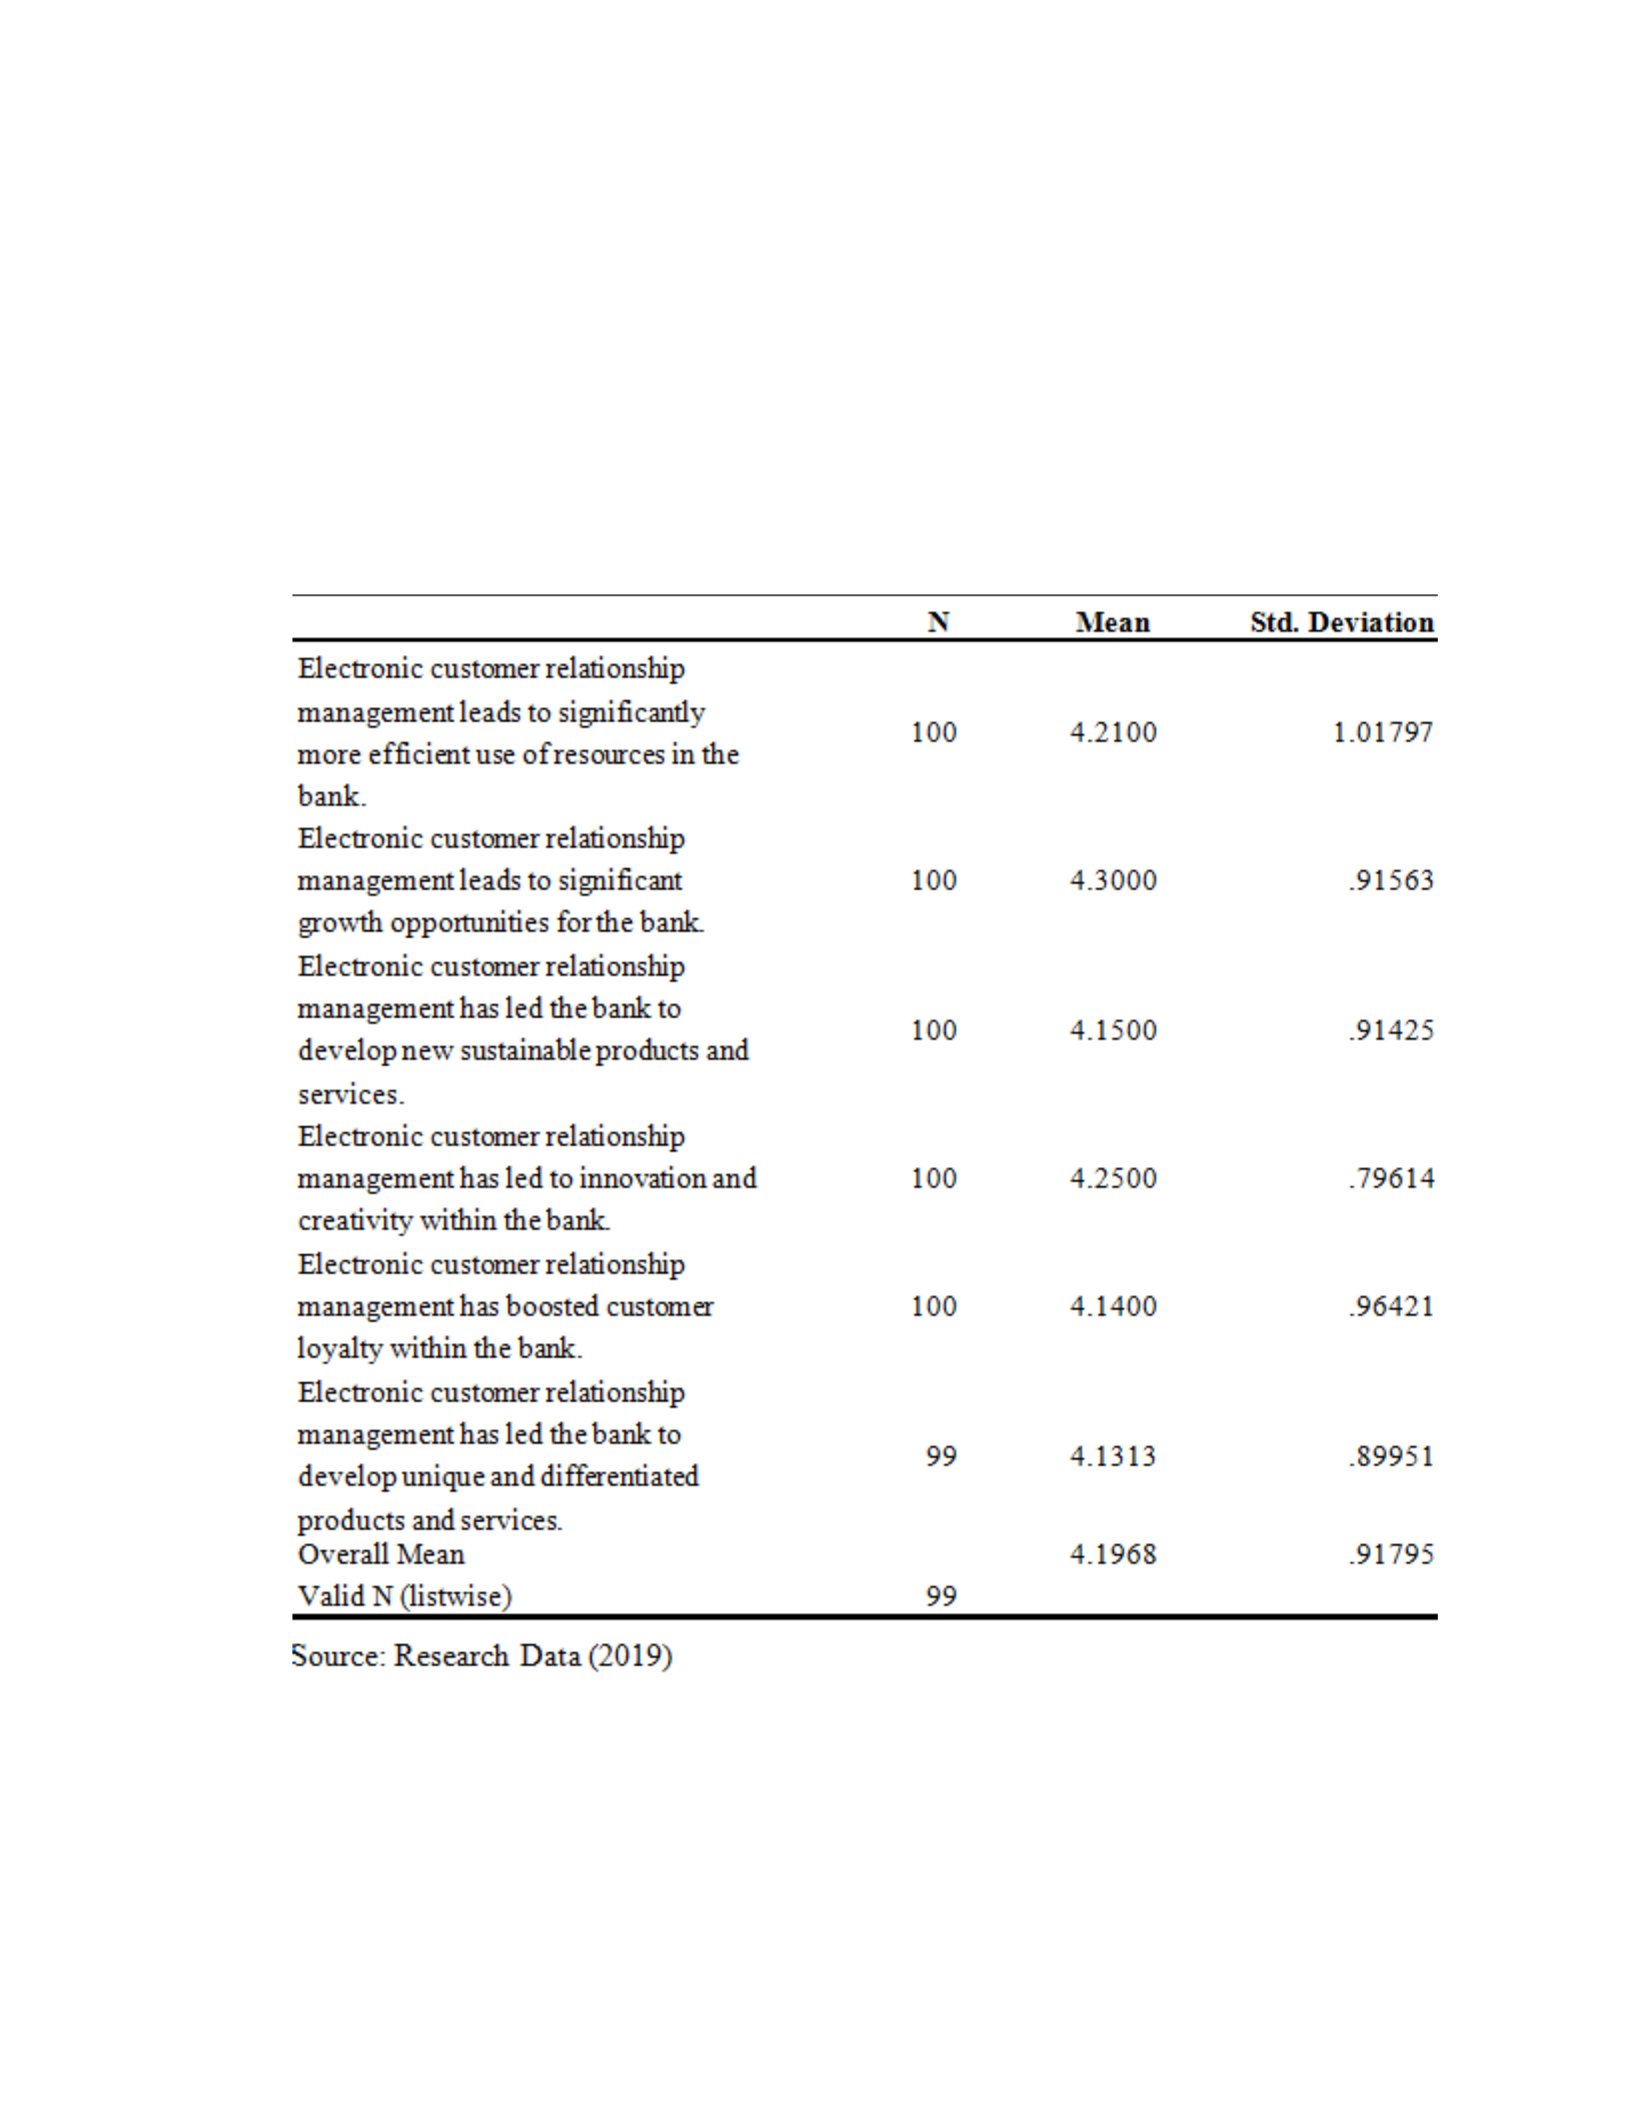
Table 4.15 displays that the attribute with the highest mean is “there is significant growth
opportunities for the bank” which has a mean of 4.3000 and a standard deviation of

0.91563. The attribute with the lowest mean is “the bank to develop unique and
differentiated products and services” which has a mean of 4.1313 and a standard
deviation of 0.89951. Overall, the attributes have a mean of 4.1968 and a standard
deviation of .91795, which implies that competitive advantage is exhibited to a great
extent in Kenyan banks.

