



Executive Summary
The project revolves around deadly storms that take place in the United States of
America, leading to the loss of lives. For conducting the research study at an integrated
level, data has been collected from National Weather Service (NWS) and National
Oceanic and Atmospheric Administration (NOAA). The objective is to investigate the
specific characteristics of storms that cause fatalities. The project has been undertaken
for predicting the possibility of whether a specific storm will lead to fatalities or not. A
total of five primary have been identified, which can help to identify whether a storm is
life-threatening or not. The analysis that has been carried out in the research study
encompasses five varying predictive models. These models have been tuned until one
of them displays the classification accuracy of 80 % or higher along with a sensitivity
of a minimum 70 %. Only by creating a reliable and accurate model it will be possible
to effectively and efficiently recognize the attributes of deadly storms. The insight can
help to expand the warning time that is issued for any storm in the nation in the future.
The success of the project can positively influence the storm survival rate within the
United States of America.

Table of Contents
Project Scope ................................................ Error! Bookmark not defined.
Problem Description ..................................... Error! Bookmark not defined.
Business Understanding ................................ Error! Bookmark not defined.
Organization ........................................... Error! Bookmark not defined.
Stakeholders ........................................... Error! Bookmark not defined.
Define Business Area .................................... Error! Bookmark not defined.
Business Objectives ............................... Error! Bookmark not defined.
Business Success Criteria ...................... Error! Bookmark not defined.
Background ................................................... Error! Bookmark not defined.
Research ................................................. Error! Bookmark not defined.
Gaps in this Problem Resolution ........... Error! Bookmark not defined.
Proposed Project ........................................... Error! Bookmark not defined.
Key Performance Indicators .................. Error! Bookmark not defined.
Project Insights of your Data Analysis .. Error! Bookmark not defined.
Project Milestones ......................................... Error! Bookmark not defined.
Completion History ....................................... Error! Bookmark not defined.
Lessons Learned............................................ Error! Bookmark not defined.
Data Set Description ..................................... Error! Bookmark not defined.
Data Set Description .............................. Error! Bookmark not defined.

High-Level Data Diagram ...................... Error! Bookmark not defined.
Data Definition/Data Profile .................. Error! Bookmark not defined.
Data Preparation/Cleansing/Transformation .................................................. 5
Data Preparation ....................................................................................... 5
Data Cleansing ......................................................................................... 6
Data Transformation ................................................................................ 7
Data Analysis ......................................................................................... 10
Data Visualization ......................................... Error! Bookmark not defined.
Data Visualization 1 ............................... Error! Bookmark not defined.
Data Visualization 2 ............................... Error! Bookmark not defined.
Data Visualization 3 ............................... Error! Bookmark not defined.
Proposed Visualizations ......................... Error! Bookmark not defined.
Predictive Models ......................................... Error! Bookmark not defined.
Predictive Model 1 ................................. Error! Bookmark not defined.
Predictive Model 2 ................................. Error! Bookmark not defined.
Predictive Model 3 ................................. Error! Bookmark not defined.
Predictive Model Review ....................... Error! Bookmark not defined.
Final Results .................................................. Error! Bookmark not defined.
Analysis Justification ............................. Error! Bookmark not defined.
Findings .................................................. Error! Bookmark not defined.

Review of Success ................................. Error! Bookmark not defined.
Recommendations for Future Analysis.. Error! Bookmark not defined.
References ..................................................... Error! Bookmark not defined.

Data Preparation/Cleansing/Transformation
After collecting the data relating to U.S. storms, the data will undergo a number of
processes so that it can help to achieve the project objectives. The main processes
that have been carried out on the data sets are data preparation, data cleansing, data
transformation and data analysis. The specific data set used in the project are storm
events database from NWS, storm casualties in 2017 and details on location and
independent storm episodes.
Data Preparation
Data preparation refers to the manipulation of raw data so that it can be transformed
prior to processing and analysis. In the research context R tool has been used for the
data preparation activity. R is a useful framework that helps to conduct operations
relating to the creation of features and handling of missing values. However, along
with R, SAS Enterprise Miner will also be utilized for performing specific data
preparation steps. It has been chosen as another important tool because of the user-
friendly interface that supports efficient calculations on diverse models. With the
help of the tools, it will be possible to tackle outliers, transforming the variables and
categorizing the data. However, it might adversely affect the model’s accuracy.
During the data preparation, firstly, data will be imported from the three datasets.
Then several packages will be used such as ‘SnowballC,’ ‘wordcloud,’ and ‘tm’ in
the text mining area for analysis purpose. Once the initialization of data is done, data
cleansing activity will be initiated. After data cleansing the datasets will be fused

using the R tool. Event ID will be used for interlinking the databases with one
another. After the merging is complete, SAS Enterprise Miner will be used for
importing the merged data and preparing data for implementation of the model. The
tool will also be used for handling variable skewness prior to building of the
predictive models. Even though there are 57,000 rows in the storm events database,
only 387 rows represent direct or indirect fatalities. Thus, the ideal cutoff threshold
for optimizing sensitivity is 0.0068.
The text mining analysis called the ‘bag-of-tokens’ analysis will be performed for
evaluating texts that have been used to describe deadly storms. Re will be used for
text mining and preprocessing purposes as it is useful when it comes to cleaning
texts and evaluating word frequencies. A corpus will be developed encompassing
event narratives relating to storms with fatalities.
Data Cleansing
For the data cleansing activity, R will be used as the chief tool. The first step in data
cleansing involves handling missing values. Even though there are 57,000 rows in
the storm details dataset, most variables are missing. For instance, the starting and
ending ranges as well as location have around 17,000 missing data cases. The main
reason for the missing variables is that they refer to specific kinds of storms only.
For example, cause of flood is applicable only for floods, whereas length of tornado
is relevant only for tornadoes.
For handling missing variables, I will omit a variable from analysis if it has over
20,000 missing cases. If fewer cases are missing then appropriate action will be

taken based on whether the variable is numeric in nature or categorical. Based on the
investigation of the database, in 17,566 rows there are missing categorical variables.
They have been removed from the data. In case they would have been numerical
variables then the missing values would be replaced using the mean. Some of the
key exceptions to the applied approach include latitude and longitude, and beginning
as well as ending ranges. They are exceptional since they are numeric. In the
casualties’ dataset, two variables are missing. The victim’s age has 104 missing
cases and the victim’s gender has 68 missing values. As gender is categorical, I will
remove the entire rows. Out of a total of 775 casualties’ case, the missing value is
small so I will replace them with the mean.
There are several variables containing outliers. Some of the most common ones are
direct and indirect deaths, damage to property, etc. For example, a specific storm
caused around 500 indirect injuries whereas a majority of storms contributed to 0
injuries. In fatalities database there are no outliers, whereas in the location dataset
there are outliers. For handling outliers, a replacement value will be computed using
SAS Enterprise Miner which will be 3 standard deviations from the mean.
Redundant variables such as state number will not be considered for data analysis.
Data Transformation
For the data analysis purpose two features will be created. The first is the target
variable i.e., casualties. It basically highlights whether a storm leads to direct or
indirect fatalities or not. As the ultimate goal is not to make predictions pertaining to
the number of deaths from a specific storm but to ascertain whether a storm will lead
to deaths or not, the specific feature is highly critical. It can help in the identification

of life-threatening storms, irrespective of direct or indirect deaths. It is a binary
categorical variable that has values in ‘yes’ or ‘no.’ This feature will be created
using the R tool. ‘Yes’, will be allocated in case the value of direct or indirect
deaths is greater than 0. If the condition is not fulfilled, ‘no’ will be assigned. As the
variable is likely to be skewed, it will be handled by modifying the cutoff threshold
for enhancing the model’s sensitivity.
The second feature that will be created is ‘injuries.’ The R tool will be used for
developing it. Even though the second variable is quite similar to the target variable,
it will showcase whether a storm to any injuries or not. This variable has been
chosen since it can help to make comprehensive comparisons with the target
variable. It is expected that there exists a strong association between casualties and
injuries. However, it will not come as a surprise if a storm leads to several injuries
but no casualties (Centers for Disease Control and Prevention, 2022). It is also a
binary categorical variable where ‘yes’ or ‘no’ values will be assigned. If a storm
leads to direct or indirect injuries, ‘yes’ will be assigned, otherwise ‘no’ will be
assigned. Initially, the variable is likely to be highly skewed. It will be resolved by
modifying the cutoff threshold with the help of SAS Enterprise Miner.
After making the two new variables, the issue pertaining to the skewness of other
variables will be addressed. The visual representation highlights the descriptive
statistics relating to numeric variables. It is observed that the most skewed variables
are direct and indirect deaths as well as injuries. It can be resolved after changing
the cutoff threshold relating to the predictive models. For addressing the skewness of
beginning and ending ranges transformations will be applied prior to building the
predictive models. It can be done using SAS Enterprise Miner. Some of the relevant
transformations are ‘maximum normal’ and ‘best’ methods.
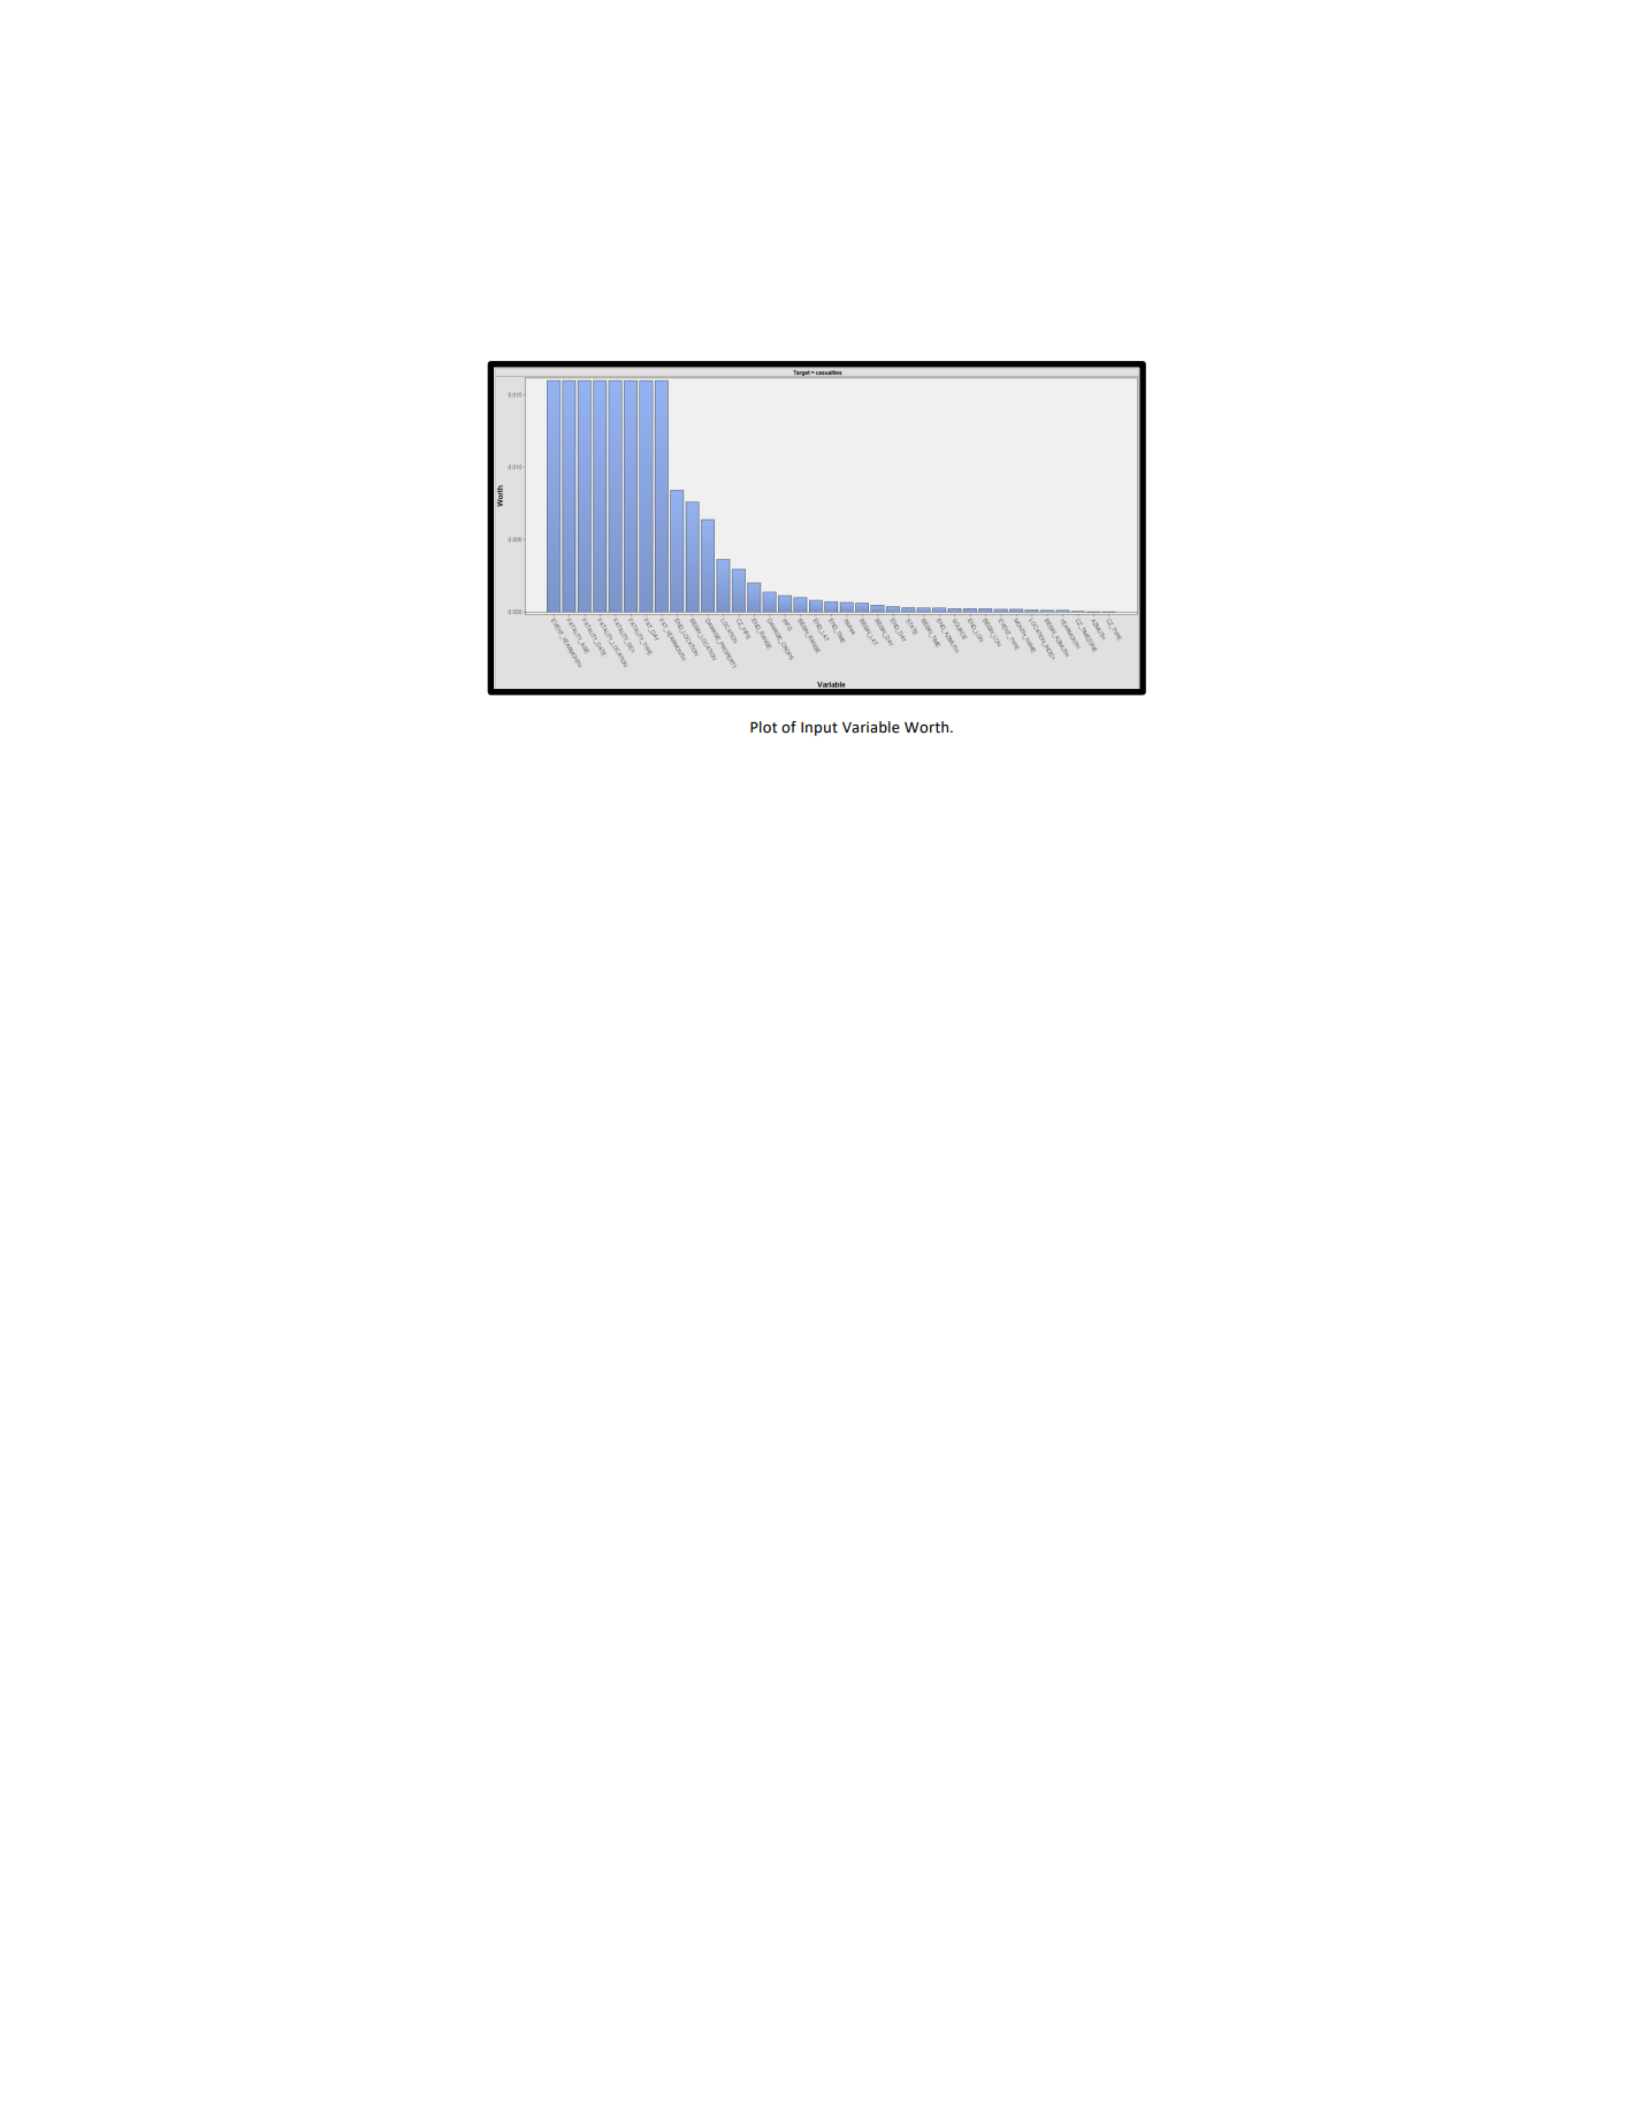
Prior to the implementation of the predictive models, the ‘StatExpore’ node will be
used for variable exploration. It will help in evaluating important features. The
figure presented below shows that the variables which have the highest worth are the
month and year of the storm event, death location, death date, victim’s gender and
age. A key observation that has been made is that most of the critical features are
extracted from the fatalities’ dataset (Centers for Disease Control and Prevention,
2022). As all variables are linked to death, it could lead to unusually high accuracy
as well as sensitivity rates. SAS Enterprise Miner has been used to test the theory. It
was found that almost every model had sensitivity and accuracy of almost 100 %. I
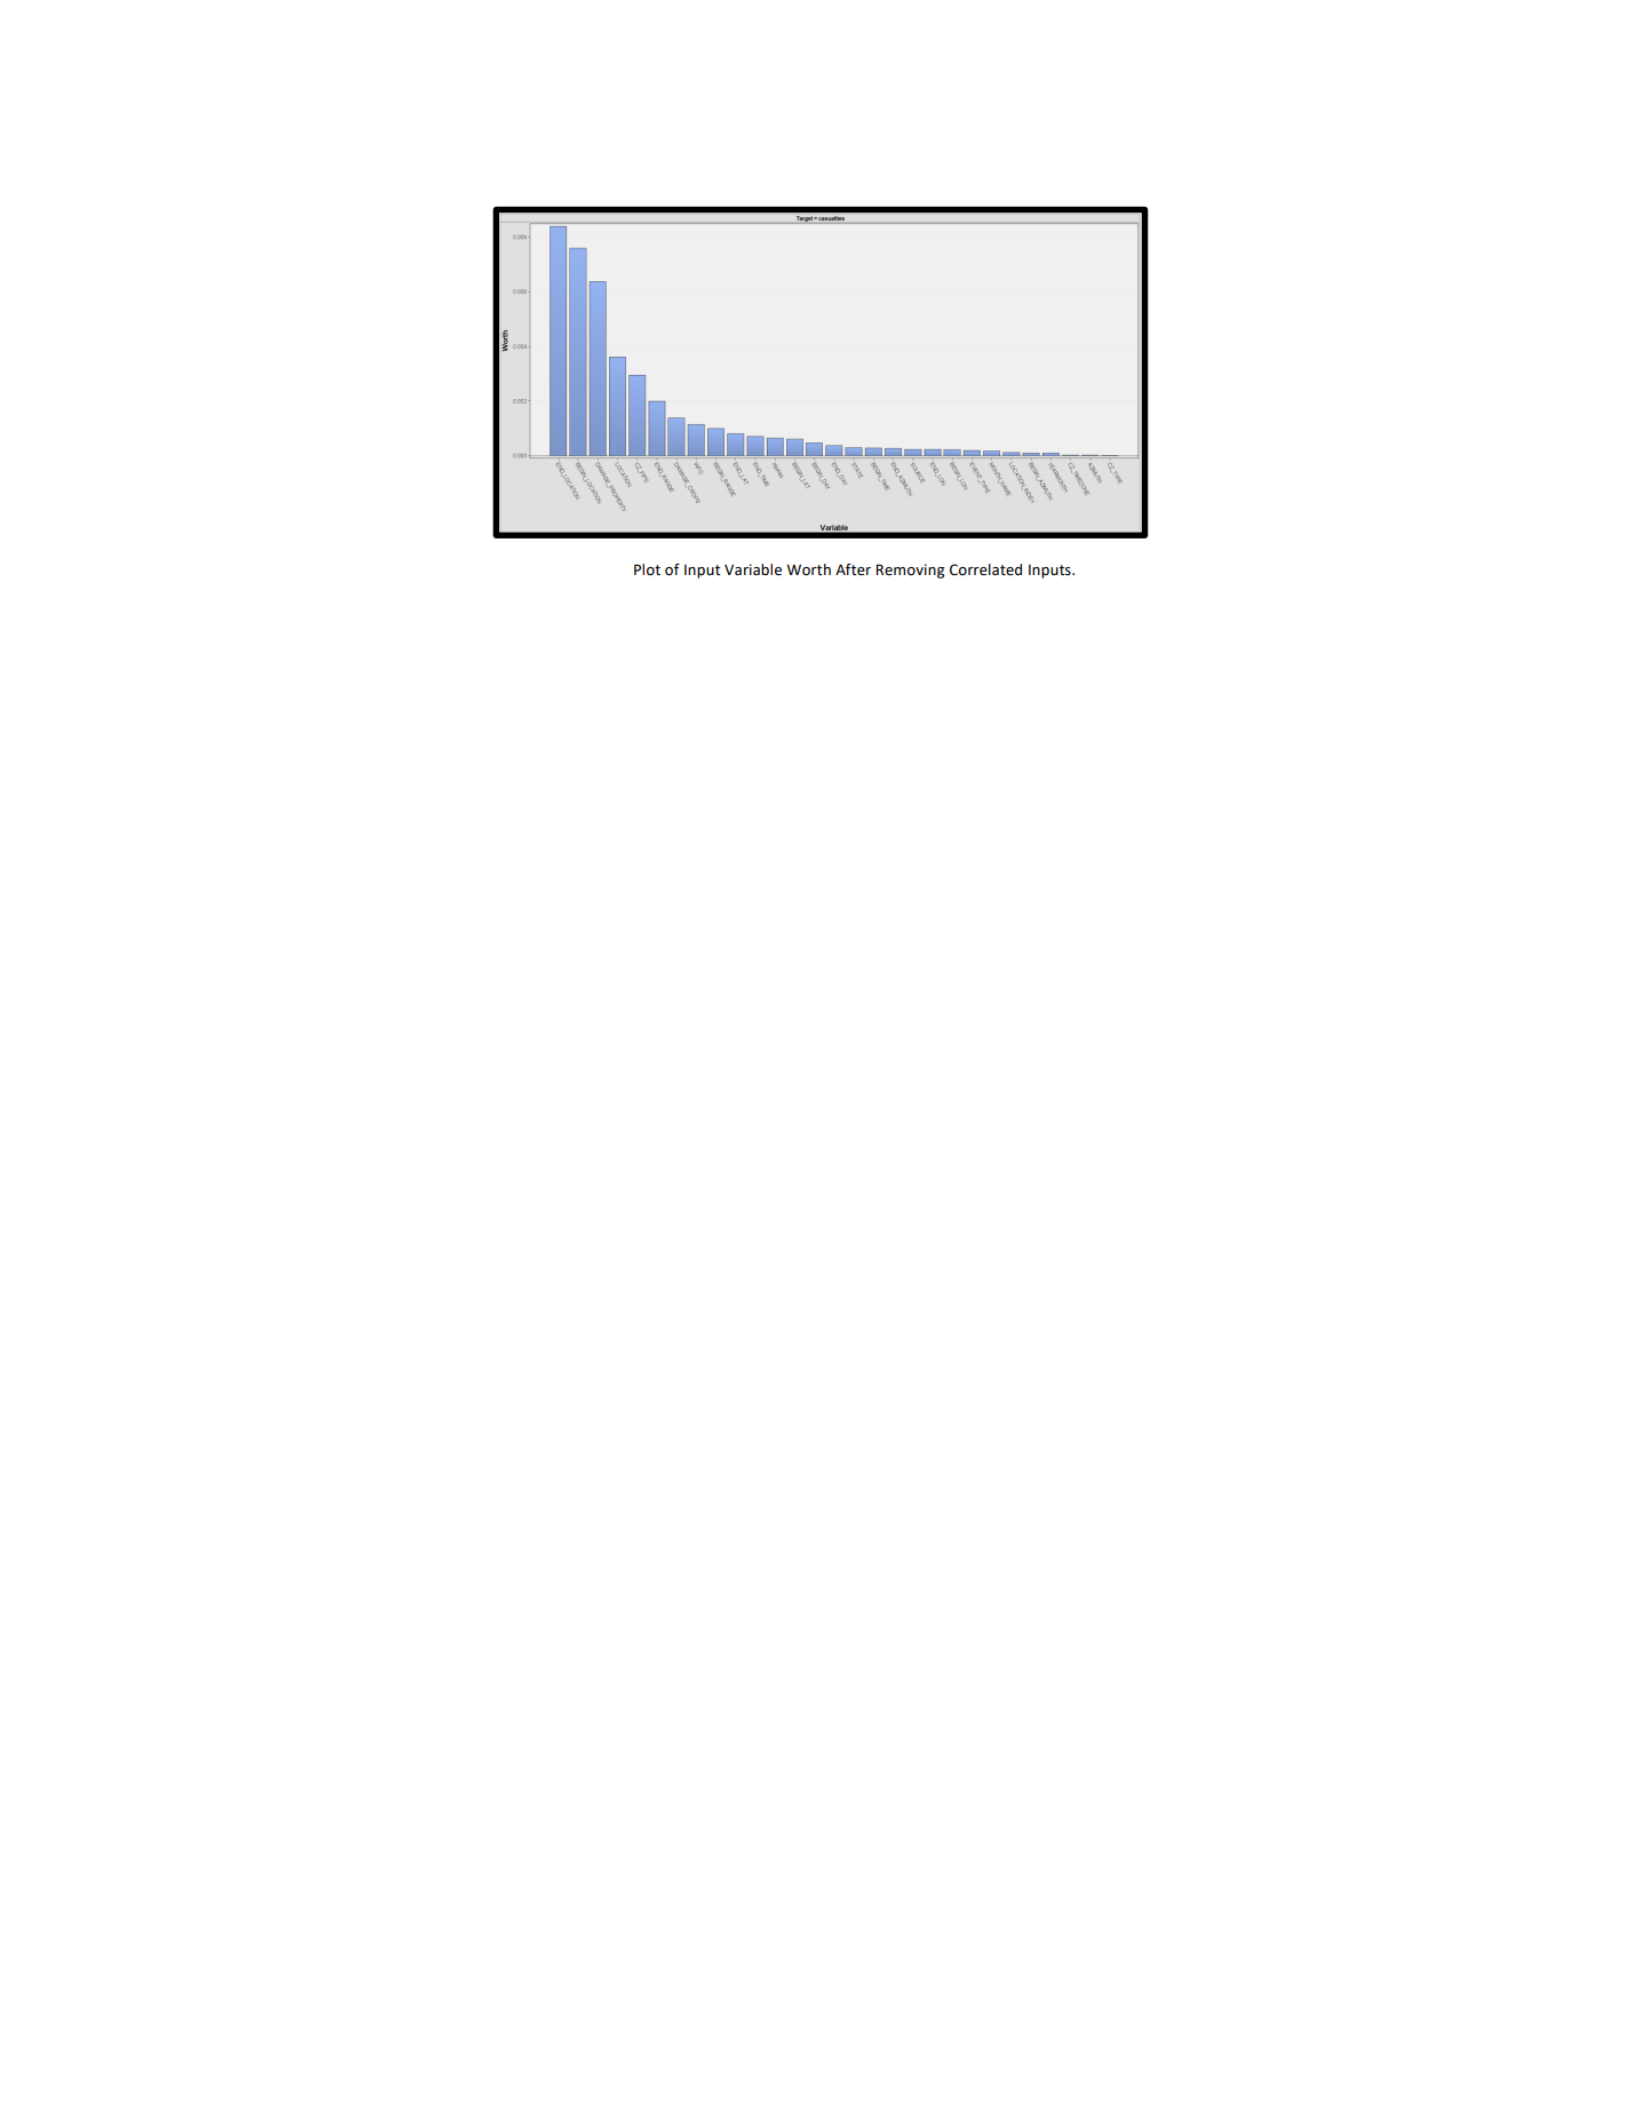
have removed the variables since they showcase correlation to the target variable.
The figures shows that several key variables relate to location. It implies that
geographical location plays an important role in the development of lethal storms.
Data Analysis
The data analysis is a critical activity that will be conducted after data preparation.
The use of visualizations is an important element of the data analysis process.
Tableau will be used for creating geospatial as well as time series graphs. The
geospatial map will display the number of storm-related deaths in the U.S.A in 2017.
It will help to identify the locations that have high vulnerability because of deadly
storms. The Tableau tool has been chosen since it can help in the identification of
location-oriented information from the available data. The time series graph will
showcase the deadly storms that have occurred during 2017 (Centers for Disease
Control and Prevention, 2022).
Apart from Tableau, R will be used for making visualizations. It will be used for
creating comprehensible visual representations relating to the test mining analysis
component. The main emphasis will be laid on keywords. It will help to identify the
terms that are most frequently used for describing storms. Wordcloud is one of the
main text mining packages that will be utilized in the project context. It will help to
locate important words relating to storms that can help in recognizing early storm
warning signs in the future.

After making the visualizations, attention will be shifted towards creating the
predictive models. A total of five predictive models will be created and their
parameters will be tuned so that at least one of them will have the minimum
accuracy level of 80 % and sensitivity of at least 70 %. The predictive models will
be implemented using SAS Enterprise Miner. It will help to modify the parameters
and enable model comparison. Several classification models will be used to identify
the predictive model that best suits the storm-related data. The models that have
been chosen for the project are neural network, logistic regression model, and
decision tree model, support vector machine (SVM) and ensemble model.
References
Centers for Disease Control and Prevention. (2022, May 4). Fast facts: Firearm violence
prevention |violence prevention | injury Center| CDC. Centers for Disease Control
and Prevention. Retrieved June 15, 2022, from
https://www.cdc.gov/violenceprevention/firearms/fastfact.html

