


3
EDUCATIONAL ASSESSMENT
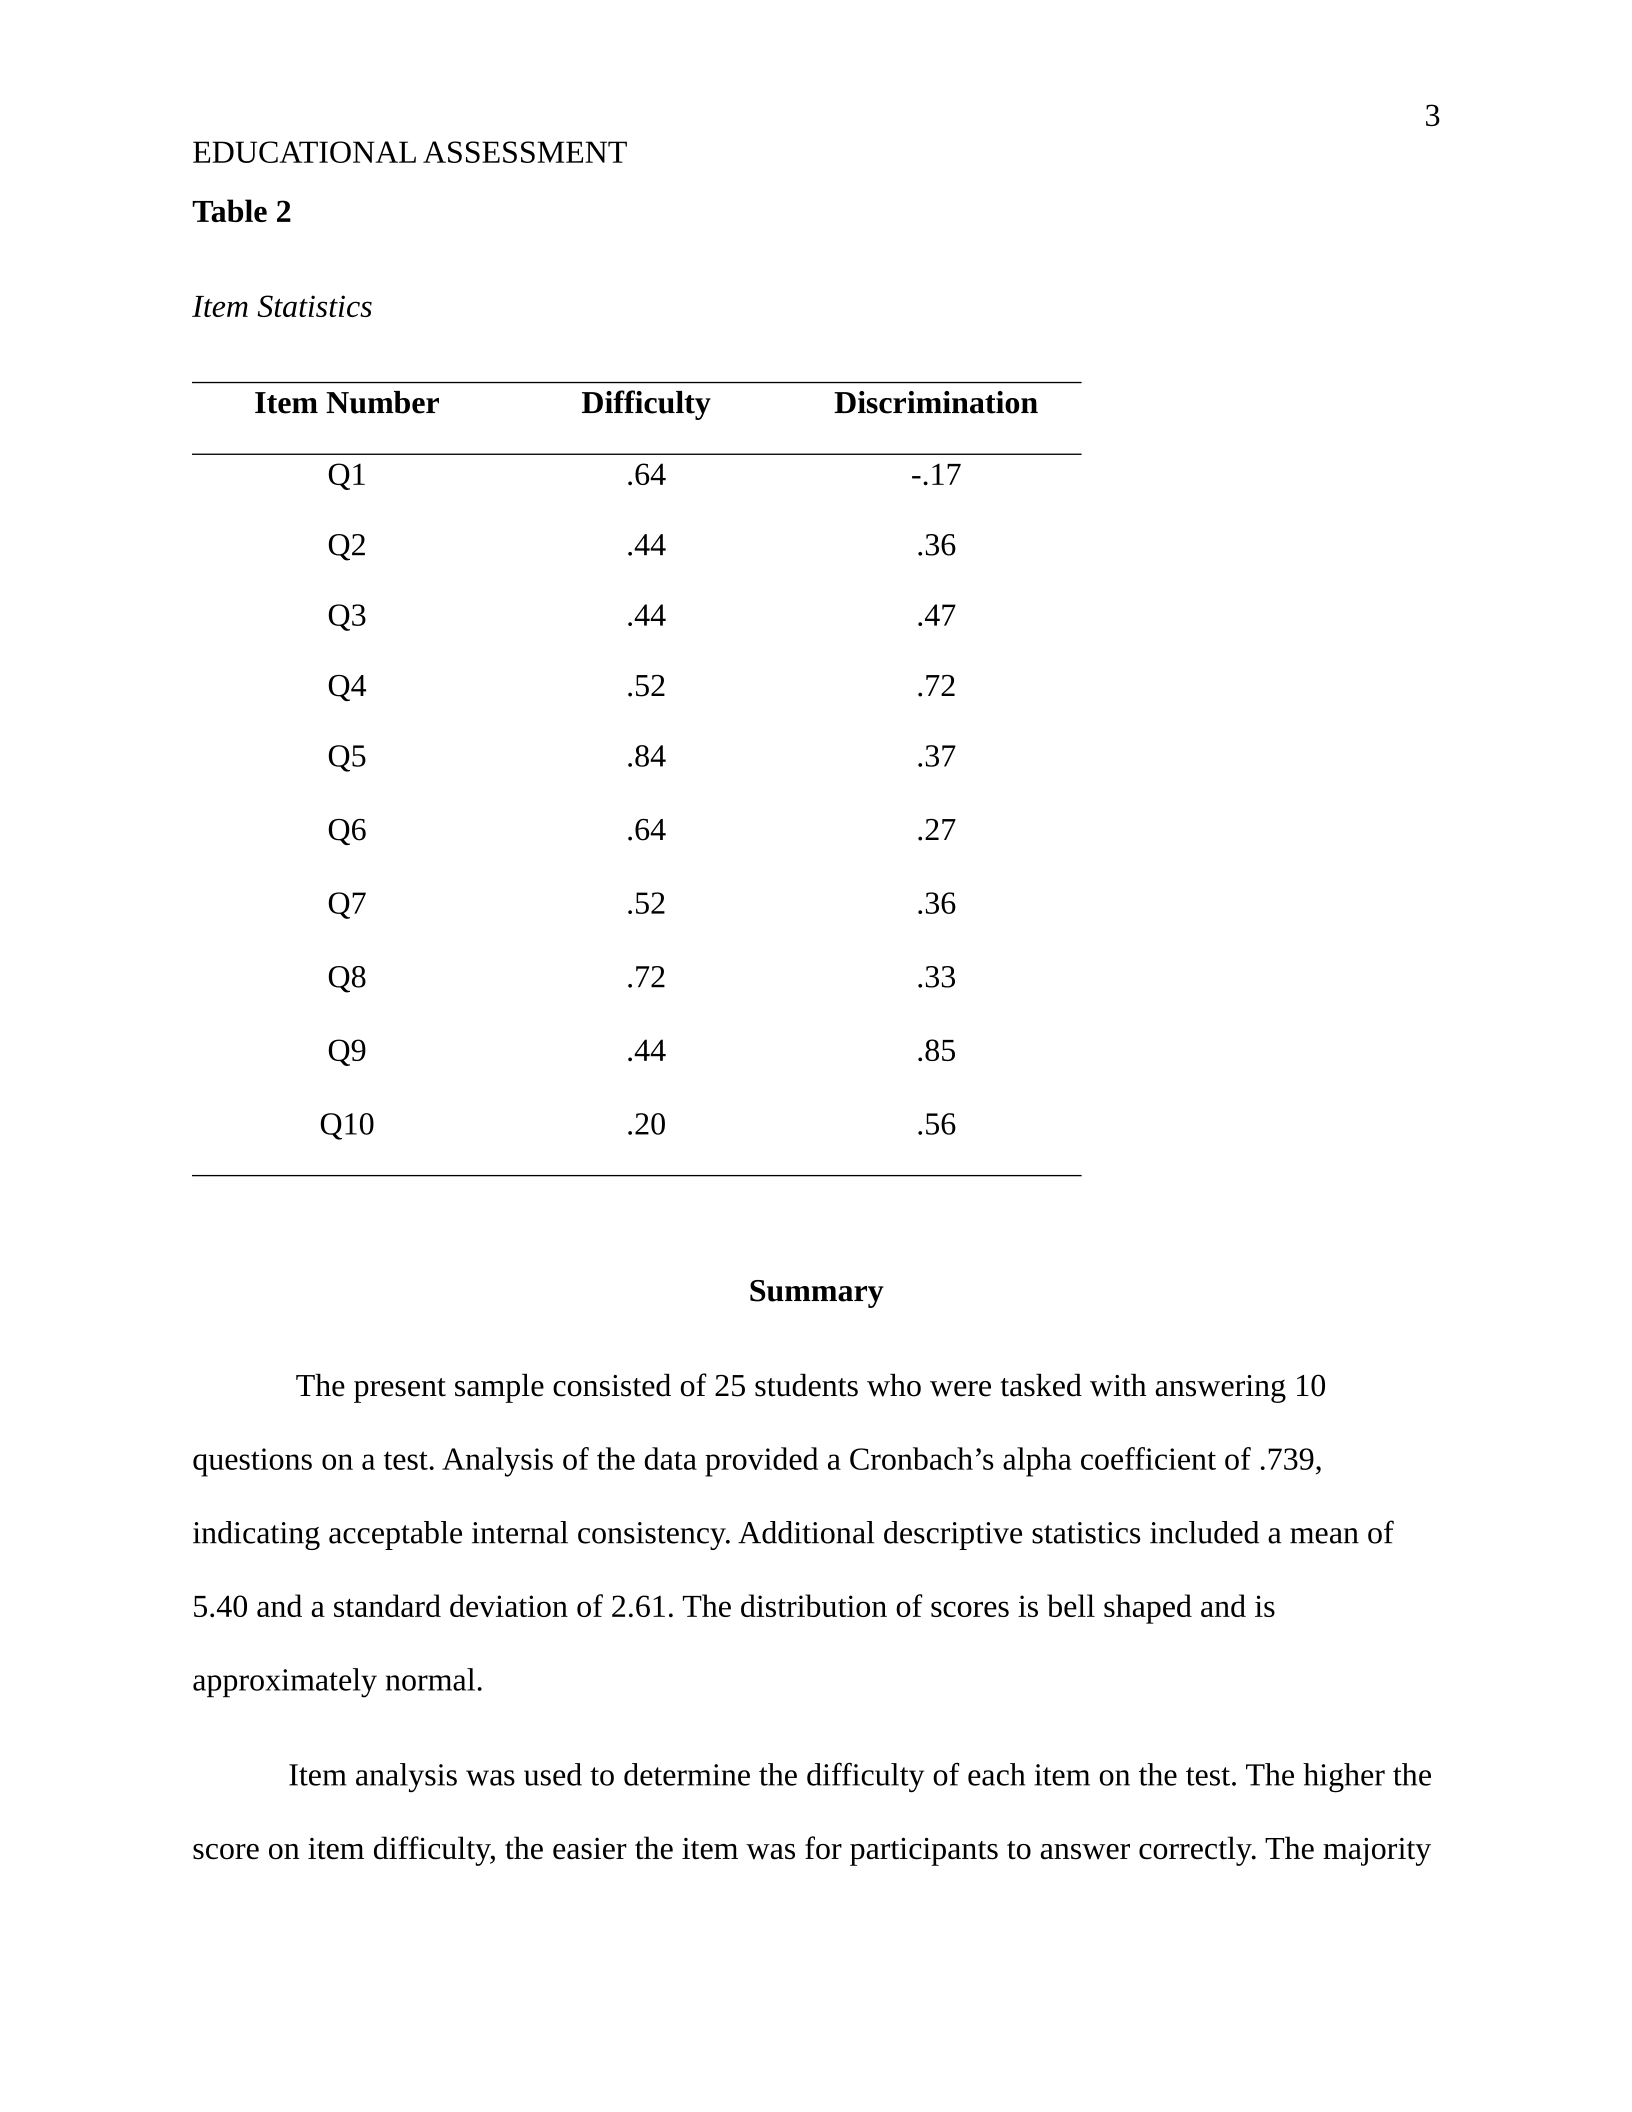
Table 2
Item Statistics
Item Number Difficulty Discrimination
Q1 .64 -.17
Q2 .44 .36
Q3 .44 .47
Q4 .52 .72
Q5
Q6
Q7
Q8
Q9
Q10
.84
.64
.52
.72
.44
.20
.37
.27
.36
.33
.85
.56
Summary
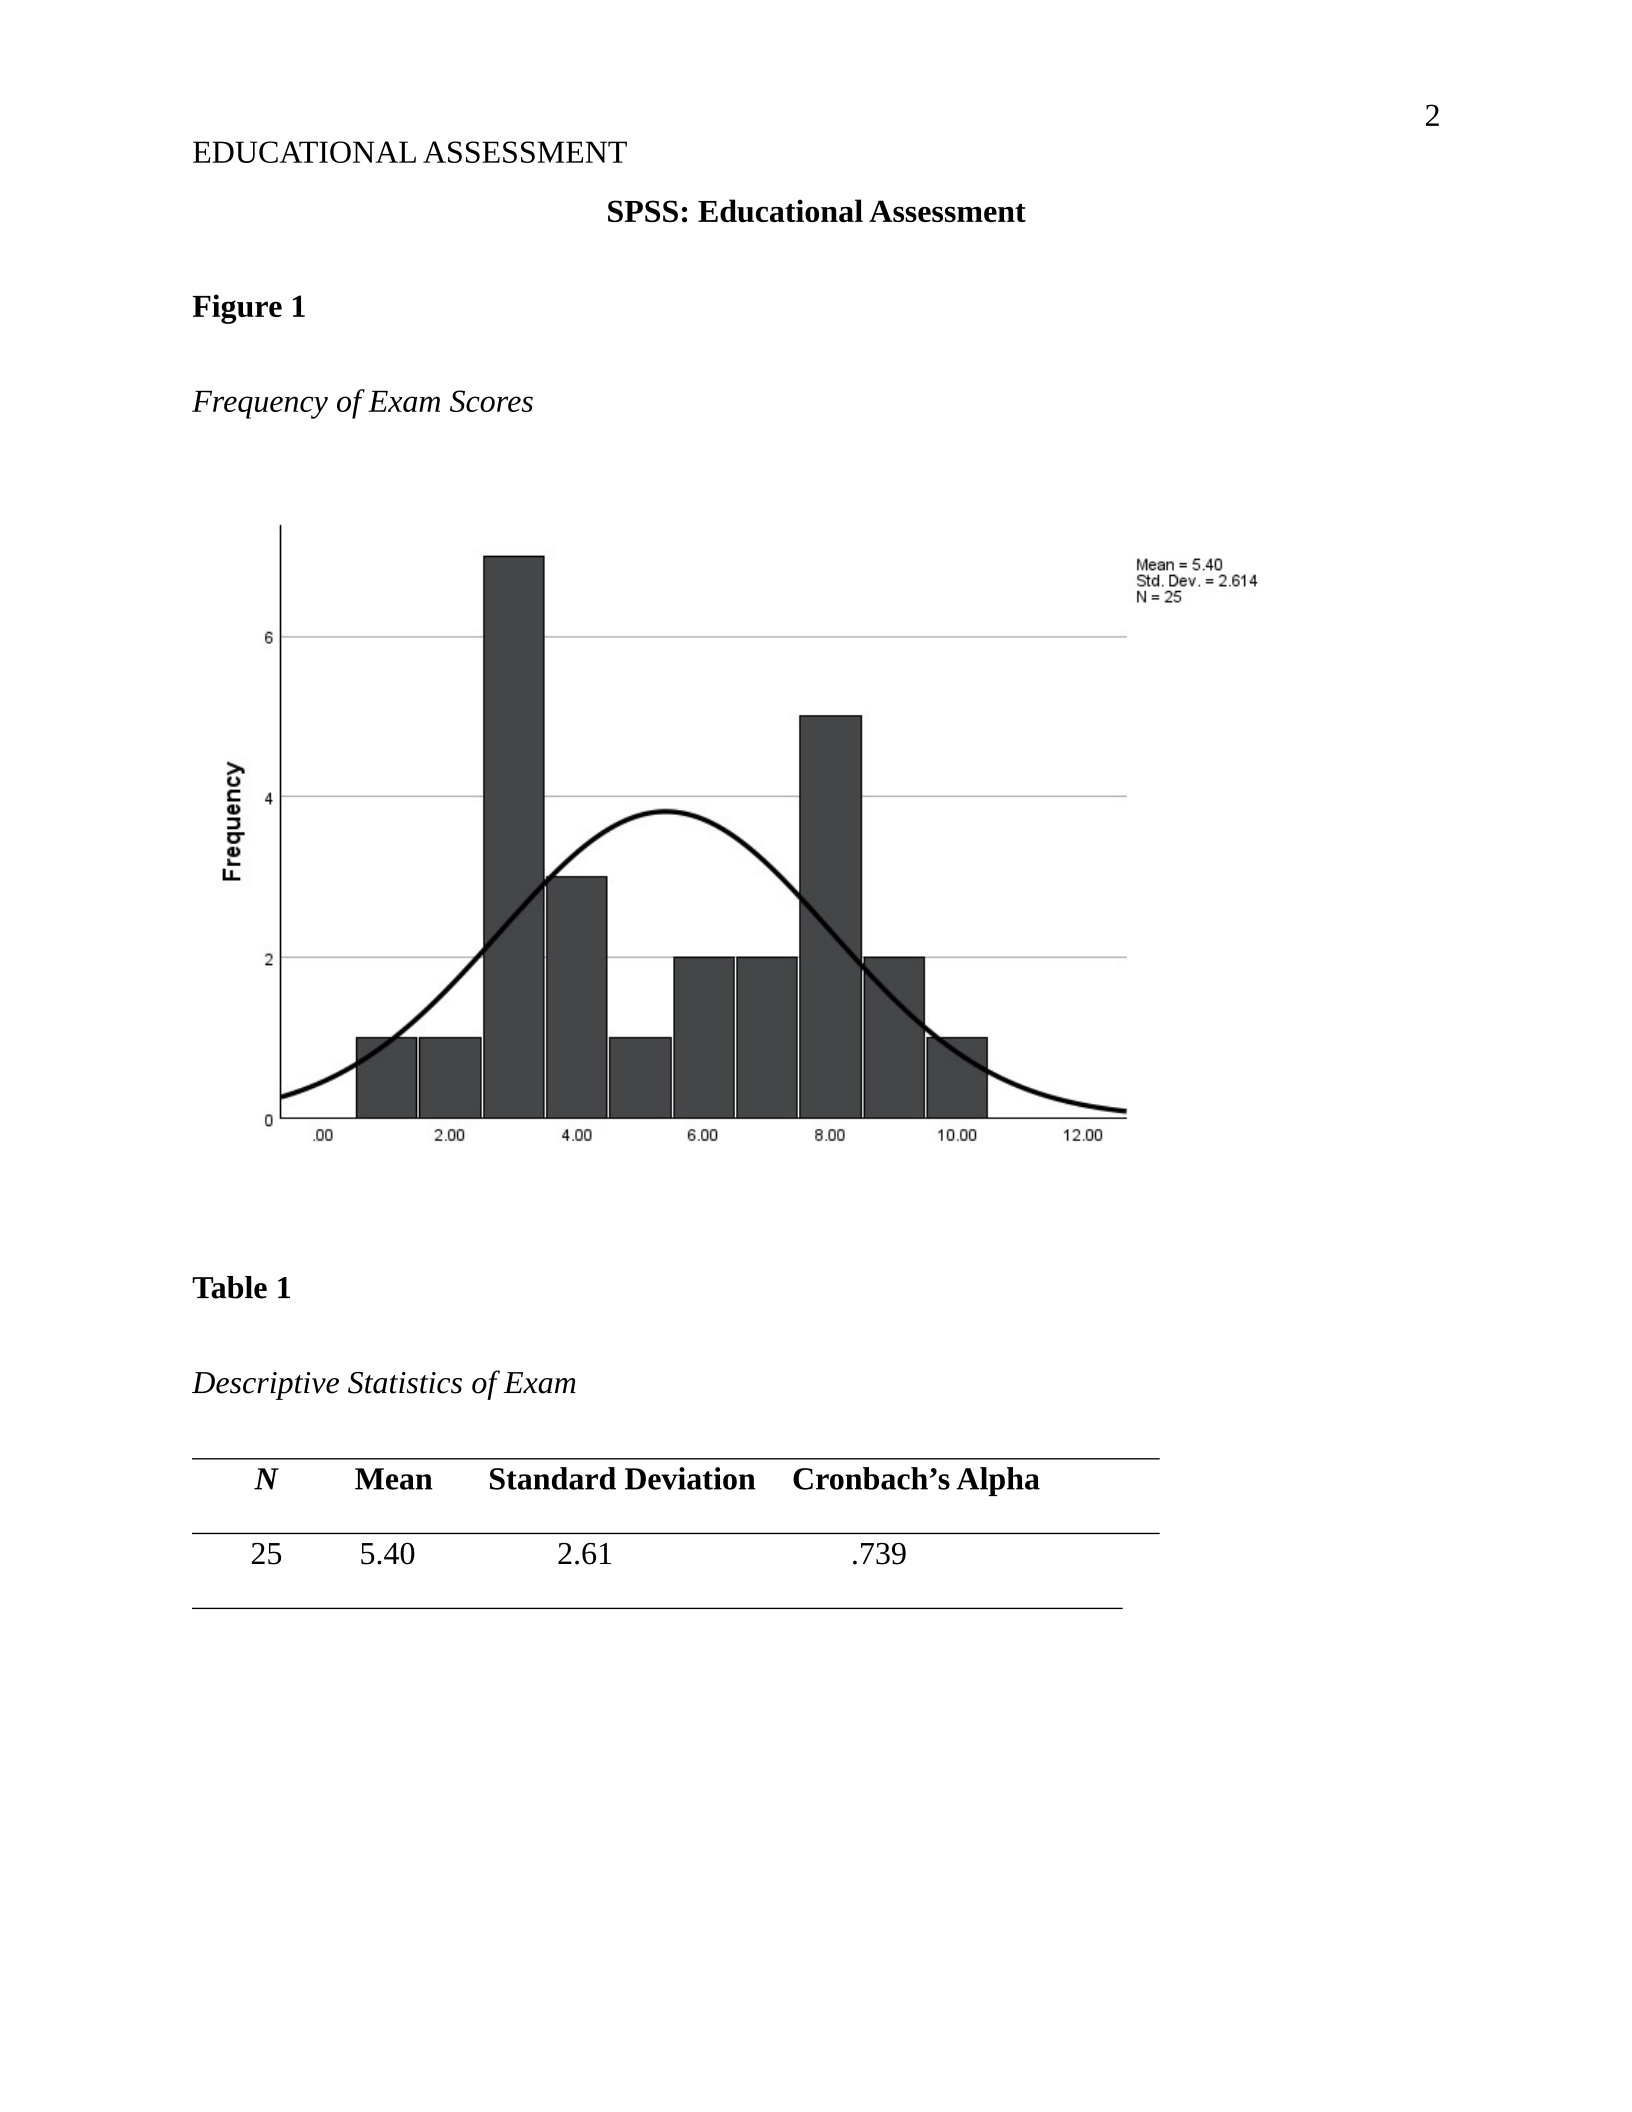
The present sample consisted of 25 students who were tasked with answering 10
questions on a test. Analysis of the data provided a Cronbach’s alpha coefficient of .739,
indicating acceptable internal consistency. Additional descriptive statistics included a mean of
5.40 and a standard deviation of 2.61. The distribution of scores is bell shaped and is
approximately normal.
Item analysis was used to determine the difficulty of each item on the test. The higher the
score on item difficulty, the easier the item was for participants to answer correctly. The majority

4
EDUCATIONAL ASSESSMENT
of item difficulty fell into the range of .44 to .72 with two outliers of .84 on item five and .20 on
item ten. The item difficulty statistic for item ten indicates that it is the most difficult item with
only 20% of participants answering correctly. Conversely, the item difficulty statistic for item
five indicates it is the easiest item on the test with 84% participants answering it correctly. The
rest of the items fell into the acceptable range of item difficulty. Item discrimination can range
from -1 to 1 with negative values indicating there is zero correlation between the item and the
rest of the items or that the item itself is measuring something besides what it was intended to
measure. Item one has the worst item discrimination with a value of -.17. If this item was
removed from the test, Cronbach’s alpha would increase from .739 to .797. The rest of the items
are within an acceptable range and if removed would decrease Cronbach’s alpha for the test.

5
EDUCATIONAL ASSESSMENT
References
Cohen, R. J., Schneider, W. J., & Tobin, R. M. (2022).DPsychological testing and
assessmentD(10th ed.). Boston, MA: McGraw-Hill. ISBN: 9781260837025.
Duckworth, A.L., Peterson, C., Matthews, M.D., & Kelly, D.R. (2007). Grit: Perseverance and
passion for long-term goals. Journal of Personality and Social Psychology, 9, 1087-1101.
Goldberg, L. R. (1992). The development of markers for the Big-Five factor structure.
Psychological Assessment, 4, 26-42.
Powered by TCPDF (www.tcpdf.org)

