


Problem Set 1: Linear Regression Analysis
Research Scenario: An admissions counselor wants to find out if TOEFL® scores are
predictive of college GPA for international students at a local university. The TOEFL is the
Test of English as a Foreign Language, which the school requires for admission, and students
can score from 0-120, with 120 being a perfect score. The data from the latest freshmen class
are in the table below. Can TOEFL scores be used as a predictor of college GPA?
Using this table, enter the data into a new SPSS data file and run a linear regression
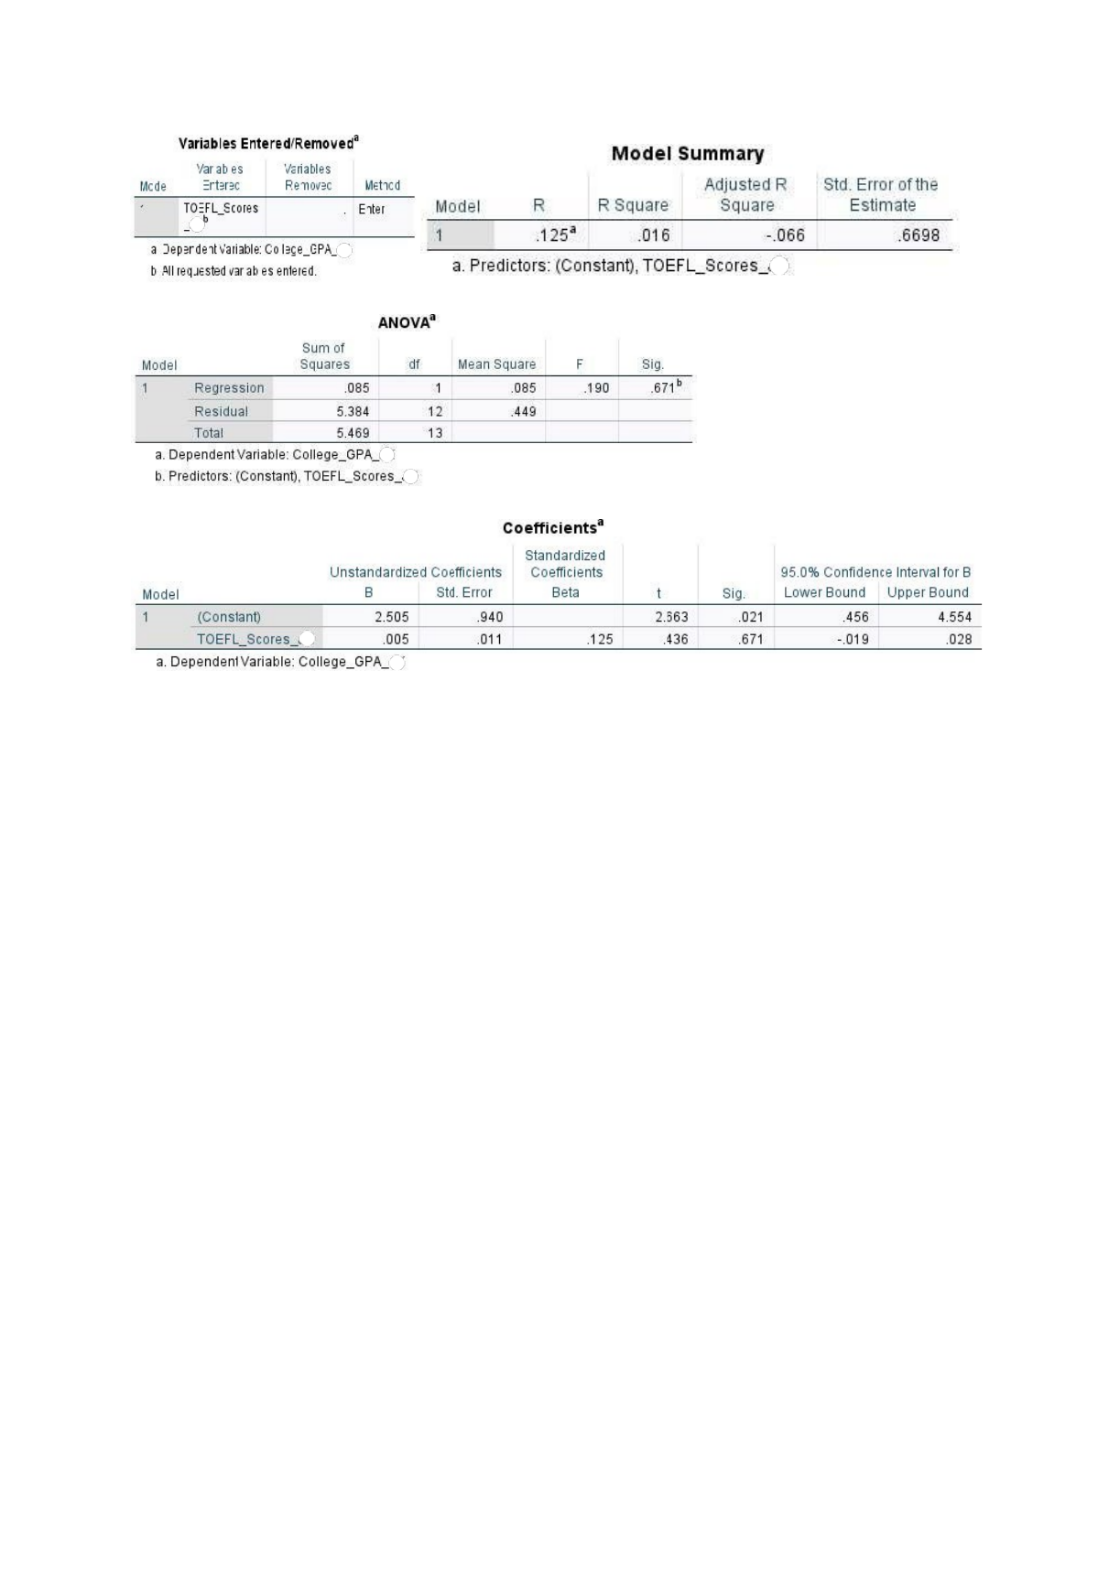
analysis to test whether TOEFL scores predict college GPA. Create a scatterplot with a
regression line to display the relationship between the variables. Remember to put your
initials within any and all variable names. Follow the directions below the table to
complete the homework.
PSYC 355
SPSS : L R HOMEWORK BIVARIATE INEAR EGRESSION: Hailey McFadden
TOEFL® Score College GPA
94 3.0
80 2.7
112 1.5
72 2.9
93 3.2
101 3.6
76 2.0
90 3.7
83 2.3
68 3.4
113 3.6
74 2.7
100 3.4
52 2.7
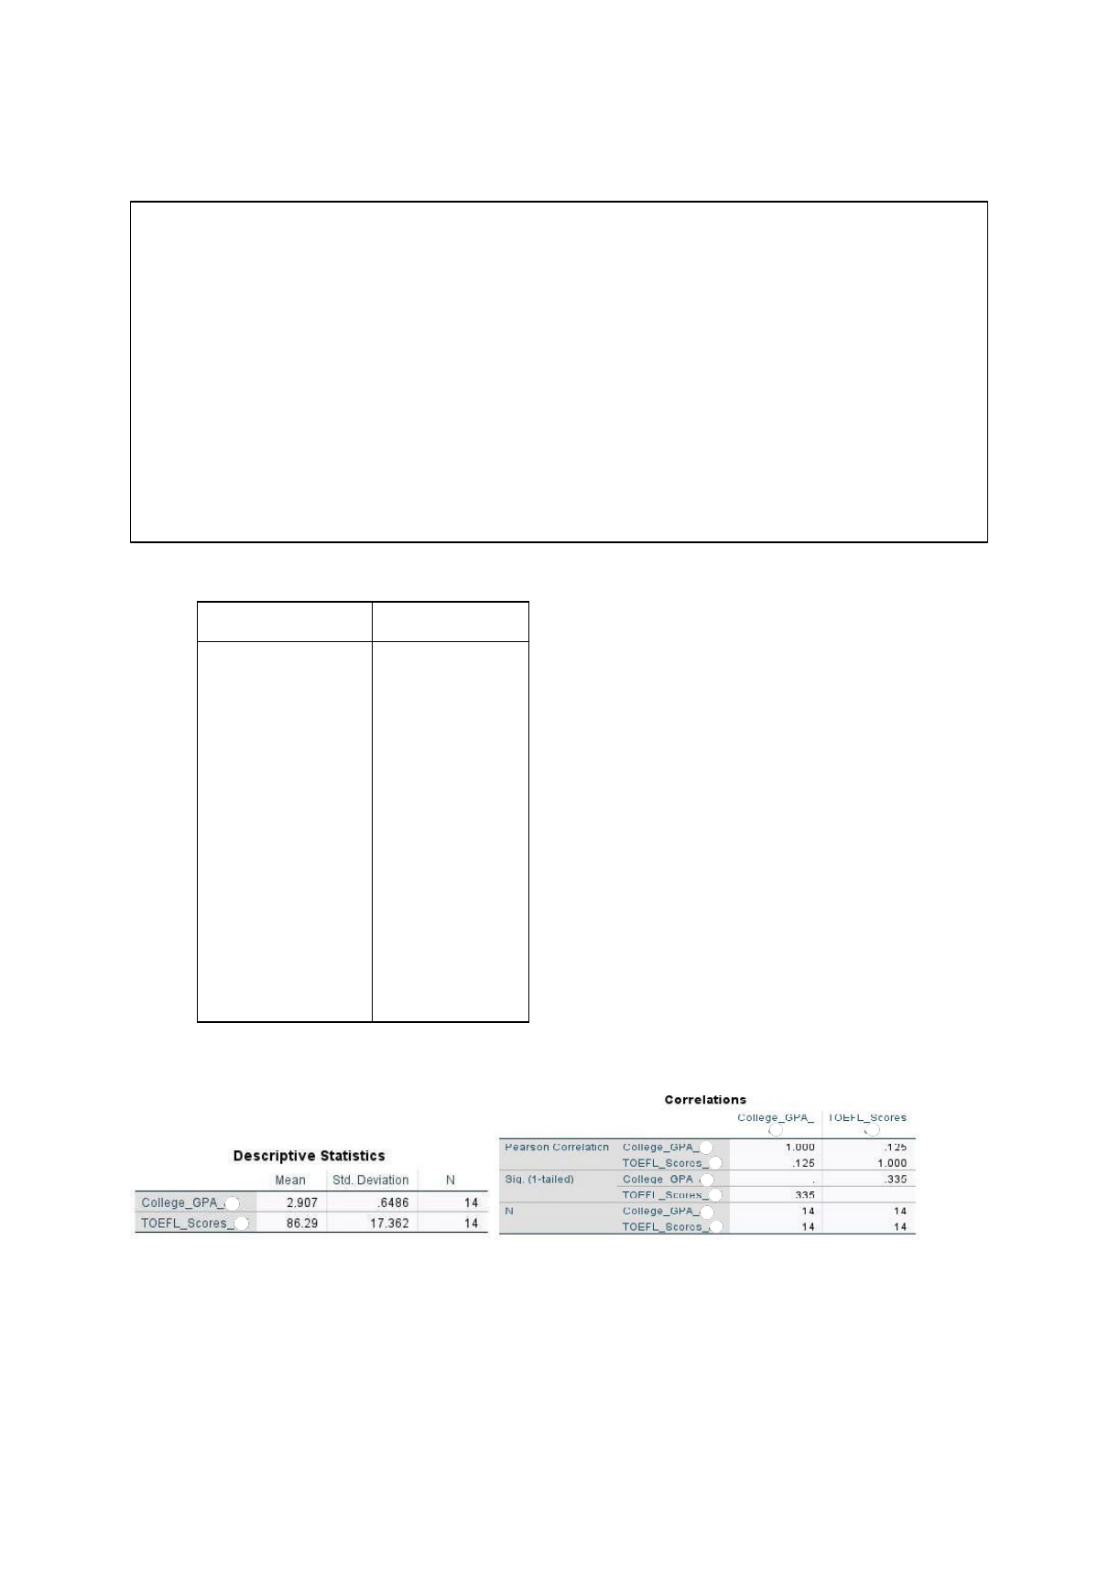
1. Paste SPSS output. (10 pts)
PSYC 355
2. Write an APA-style Results section based on your analysis. Include your scatterplot as an
APA-style Figure, with figure number and title, as demonstrated in the Results Section
presentation. (Results = 12 pts; Figure = 8 pts)
Results
A regression analysis was computed to determine whether the Test of English Language on
Foreign Language scores (TOEFL) predict College GPA in a study for international students at a
local university. The results indicated a nonsignificant positive relationship between variables, r
(12) = 0.13, p=0.34. The equation for the regression line is = 0.005 + 2.505, or Ŷ X predicted
GPA TOEFL score = 0.005 ( ) + 2.505. The standard error of the estimate provided for the
regression line is 0.67, indicating that the data points lie close to the regression line. The
confidence interval of the slope ranged from -0.02 to 0.03, an interval which contains the value
of 0. R 0.016, indicating that just 1.6% of the variance in GPA is explained by TOEFL scores.
2 =
The results of ANOVA were not significant, F (1,12) = 0.19, p = 0.67. We must fail to reject the
null hypothesis that the slope of our regression line is 0 and conclude that TOEFL scores do not
significantly predict college GPA.
PSYC 355
Problem Set 2: Linear Regression Analysis
Research Scenario: A social psychologist is interested in whether the number of days spent
in a refugee camp predicts trauma levels in recently resettled refugees. He interviews 17
refugees to determine how many days they spent in a refugee camp before being resettled,
then administers the Harvard Trauma Questionnaire Part IV (HTQ Part 4), where a higher
score indicates higher levels of trauma (Mollica et al., 1992). He compiles the information in
the table below.
Using this table, enter the data into a new SPSS data file and run a linear regression
analysis to test whether number of days in a refugee camp predicts HTQ trauma scores.
Create a scatterplot with a regression line to display the relationship between the
variables. Follow the Remember to put your initials within any and all variable names.
directions below the table to complete the homework.
Figure 1
Test of English Language on Foreign Language (TOEFL) Scores Predicts GPA Scores
Days Spent in
Refugee Camp
HTQ Part 4
Score
22 0.4
84 1.1
50 0.9
96 2.3
106 1.7
72 0.3
40 0.7
PSYC 355
172 2.6
199 3.1
215 3.0
138 1.9
290 2.5
70 0.7
67 1.2
63 1.8
184 2.9
53 0.6
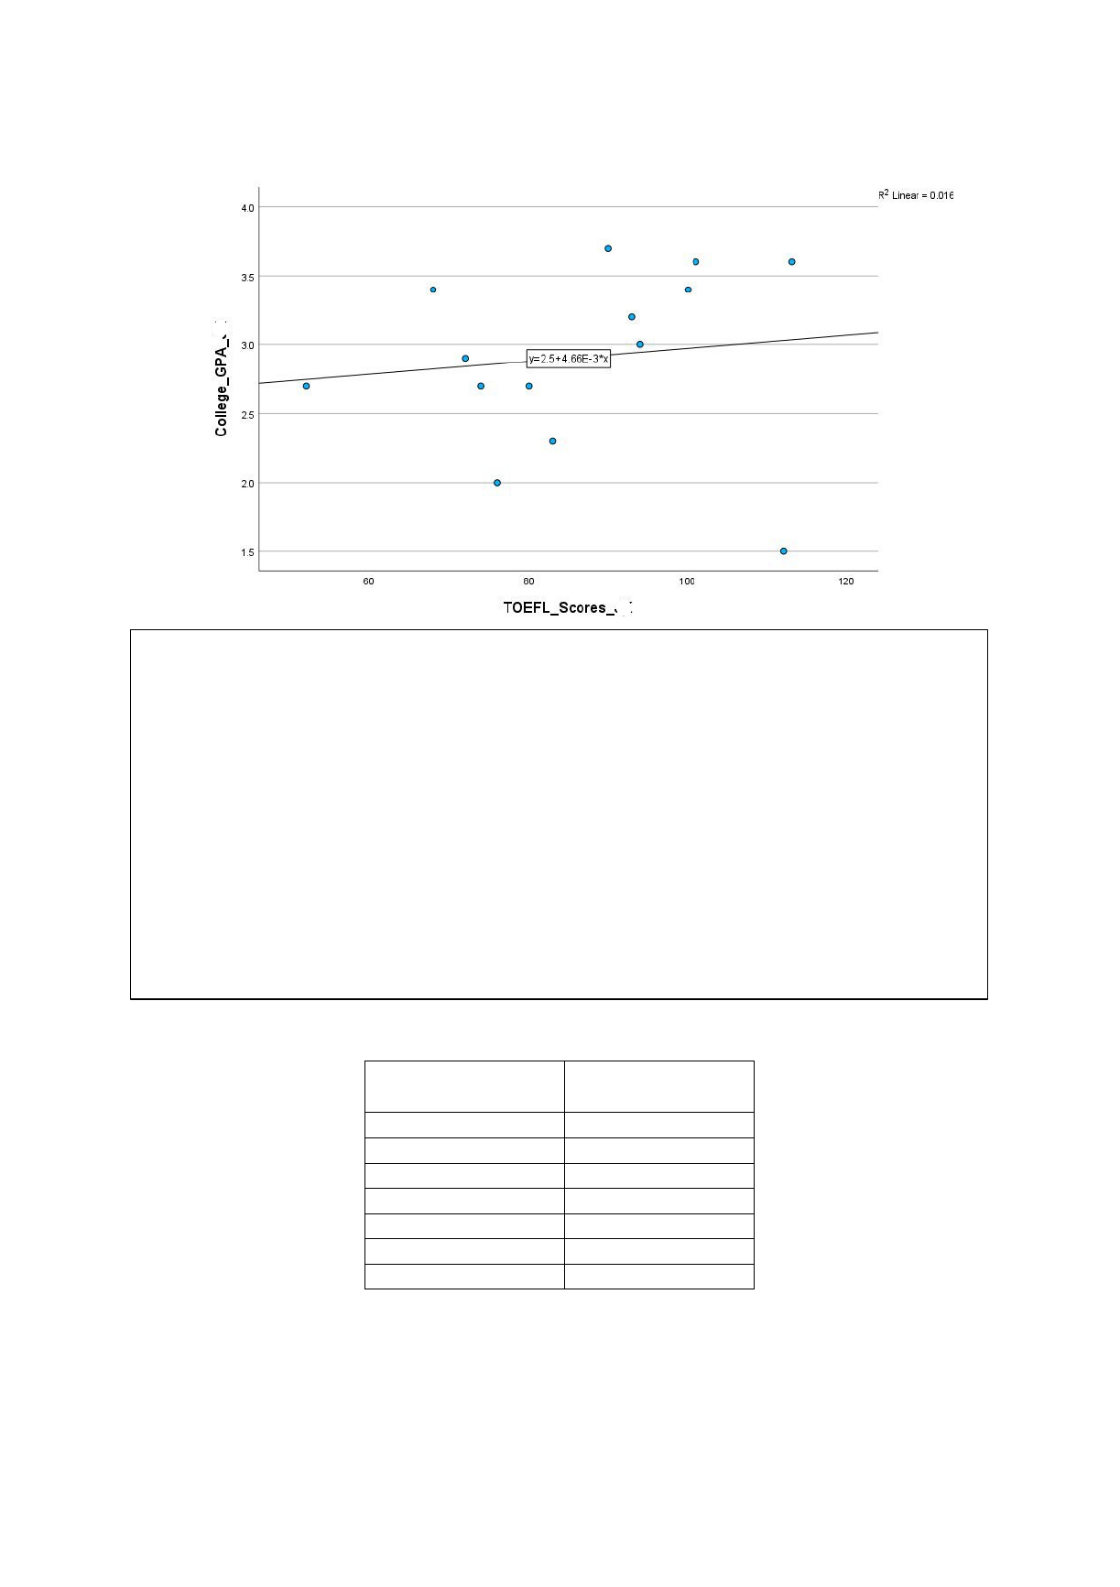
1. Paste SPSS output. (10 pts)
2. Write an APA-style Results section based on your analysis. Include your scatterplot as an
APA-style Figure, with figure number and title, as demonstrated in the Results Section
presentation. (Results = 12 pts; Figure = 8 pts)
Results
PSYC 355
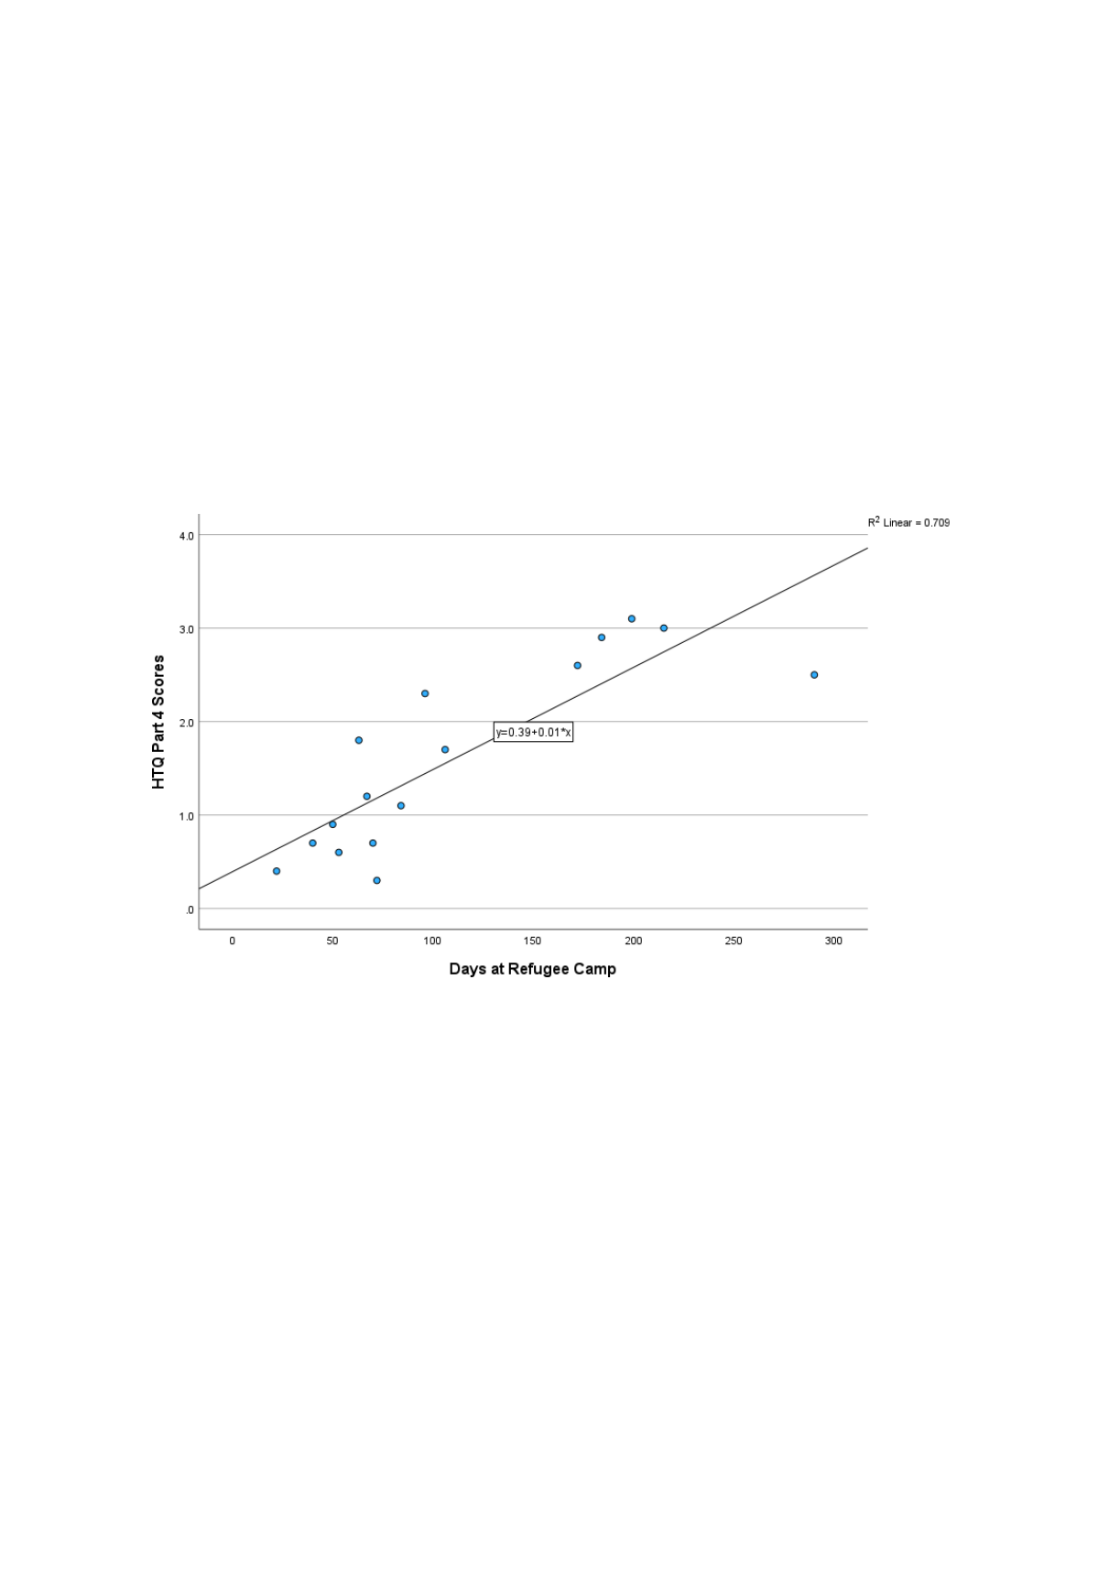
A regression analysis was computed to determine whether the Days Spent at a Refugee Camp
predicts Harvard Trauma Questionnaire Part IV (HTQ part 4) scores. The results indicated a
significant positive relationship between variables, r (12) = 0.13, p = <0.001. The equation for
the regression line is = 0.01 + 0.393, or = 0.13 ( )Ŷ X predicted HTQ score Days at Refugee Camp
+ 0.393. The standard error of the estimate provided for the regression line is 0.539, indicating
that the data points lie close to the regression line. The slope's confidence interval ranged from
0.007 to 0.015, which does not contain the value of 0. R 0.709, indicating that 70.9% of the
2 =
variance in HTQ scores is explained by days at the Refugee camp. The results of ANOVA were
significant, F (1,15) = 36.63, p = <0.001. We must reject the null hypothesis that the slope of our
regression line is 0 and conclude that Days Spent at Refugee camps do significantly predict
HTQ scores.
Figure 1
Days Spent at a Refugee Camp predicts Harvard Trauma Questionnaire Part IV
PSYC 355
SNAQ-
12
Anxiety
Interview
Scores
10 7
8 10
11 6
7 2
7 13
9 3
10 8
10 5R
8 6
9 4
11 2
9 2
10 6
7 10
8 17
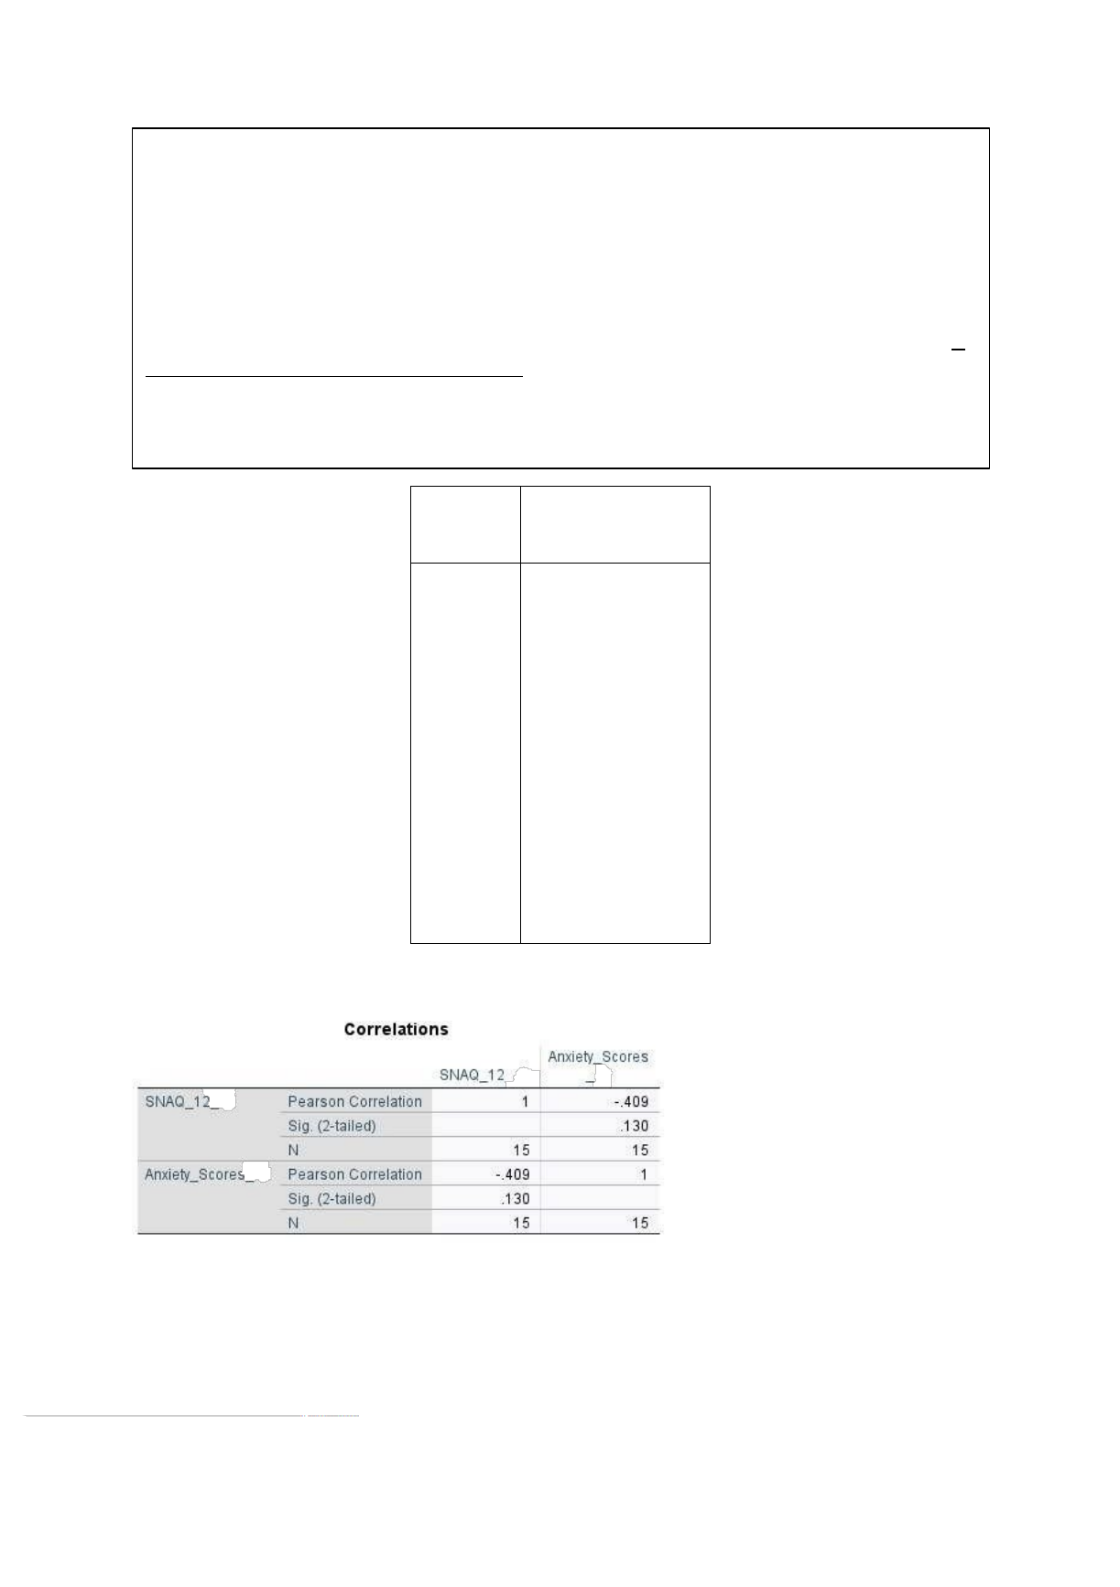
1. Paste SPSS output. (10 pts)
2. Write an APA-style Results section based on your analysis. Include the appropriate
graph as an APA-style Figure, with figure number and title, as demonstrated in the
Results Section presentation. (Results = 12 pts; Figure = 8 pts)
Problem Set 3: Cumulative Knowledge Question
Research Scenario: During intake sessions, a clinical psychologist specializing in treating
snake phobia administers a measure of snake phobia called the Snake Questionnaire (SNAQ-
12) (Zsido et al., 2018), as well as a standardized interview that measures generalized anxiety.
She wants to determine whether there is a relationship between SNAQ-12 scores and the
results of the anxiety interview.
Using this table, enter the data into a new SPSS data file. Choose the correct analysis (it
will be one learned in a previous module ) to determine whether there is a relationship
between SNAQ-12 and anxiety interview scores. Choose and create the correct graph
that corresponds with this analysis. Remember to put your initials within any and all
variable names. Follow the directions below the table to complete this part.
PSYC 355
Results
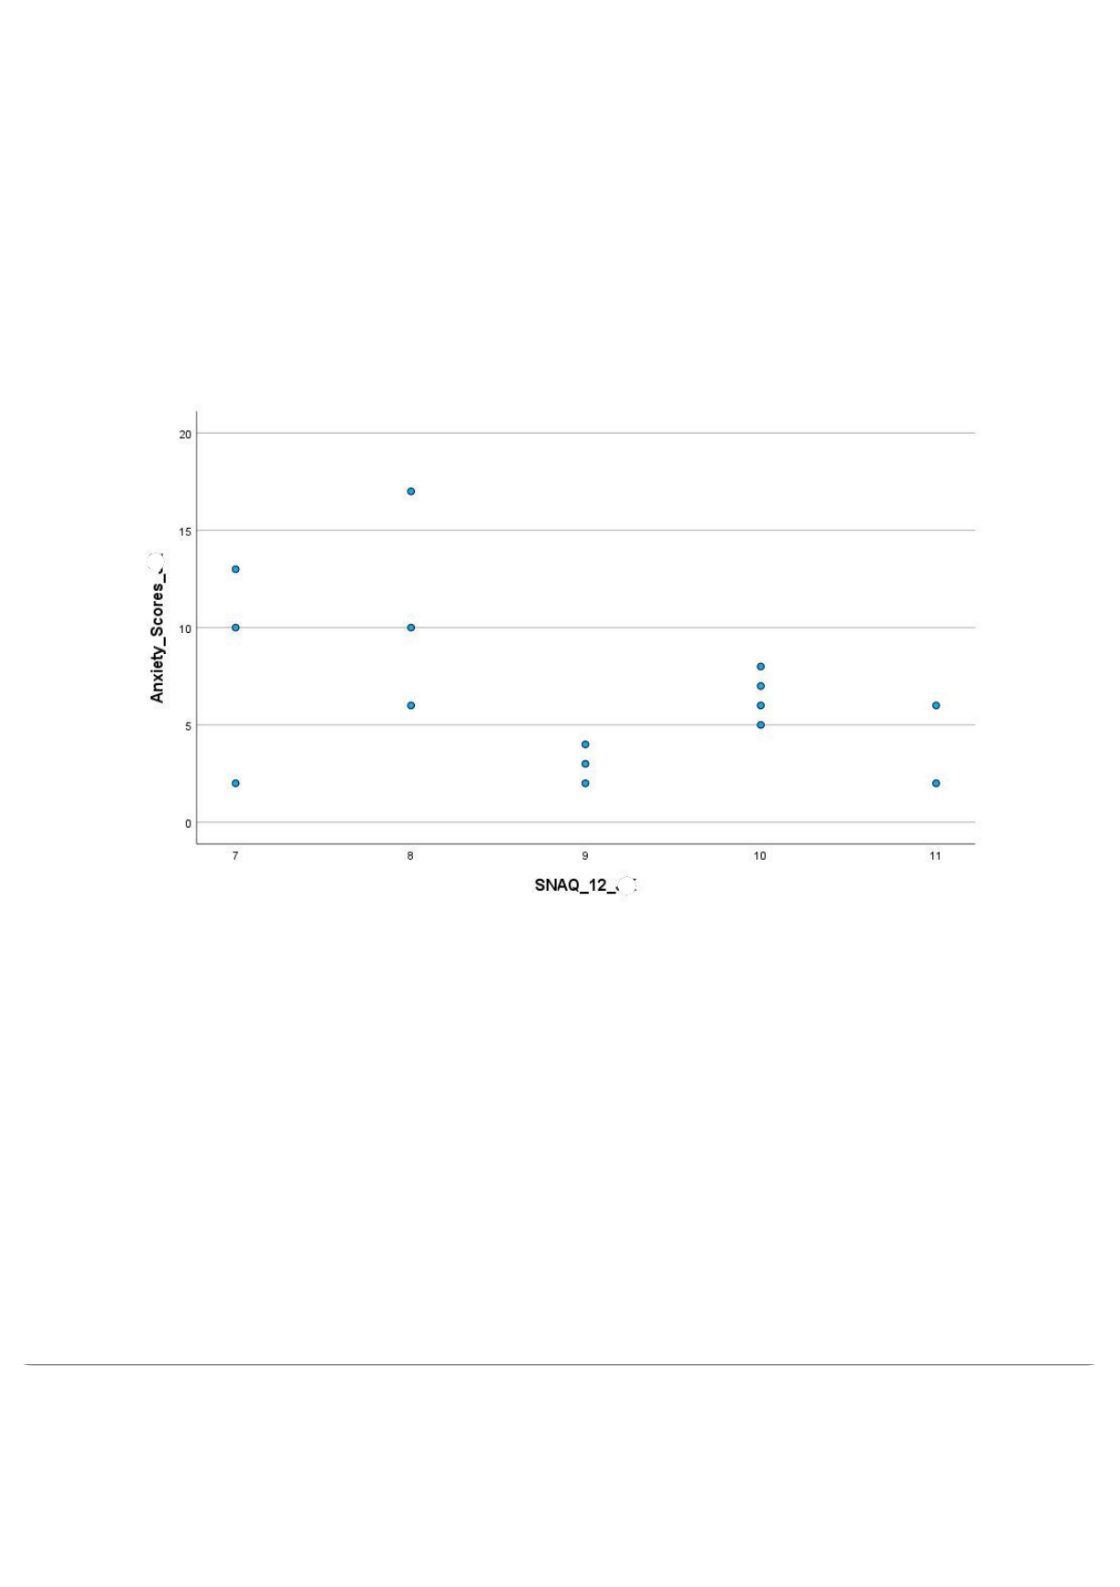
A Person correlation coefficient was computed to determine the relationship between the
Snake Questionnaire (SNAQ-12) and Anxiety Interview Scores. The results indicate a non-
significant negative relationship between the variables, r (13) =-.409, p=0.130. As Anxiety
scores increase, the SNAQ scores decrease slightly. We therefore fail to reject that the
correlation between these variables is zero.
Figure 1
Relationship Between Snake Questionnaire and Anxiety Interview Scores

