


APPLICATION EXERCISE 2
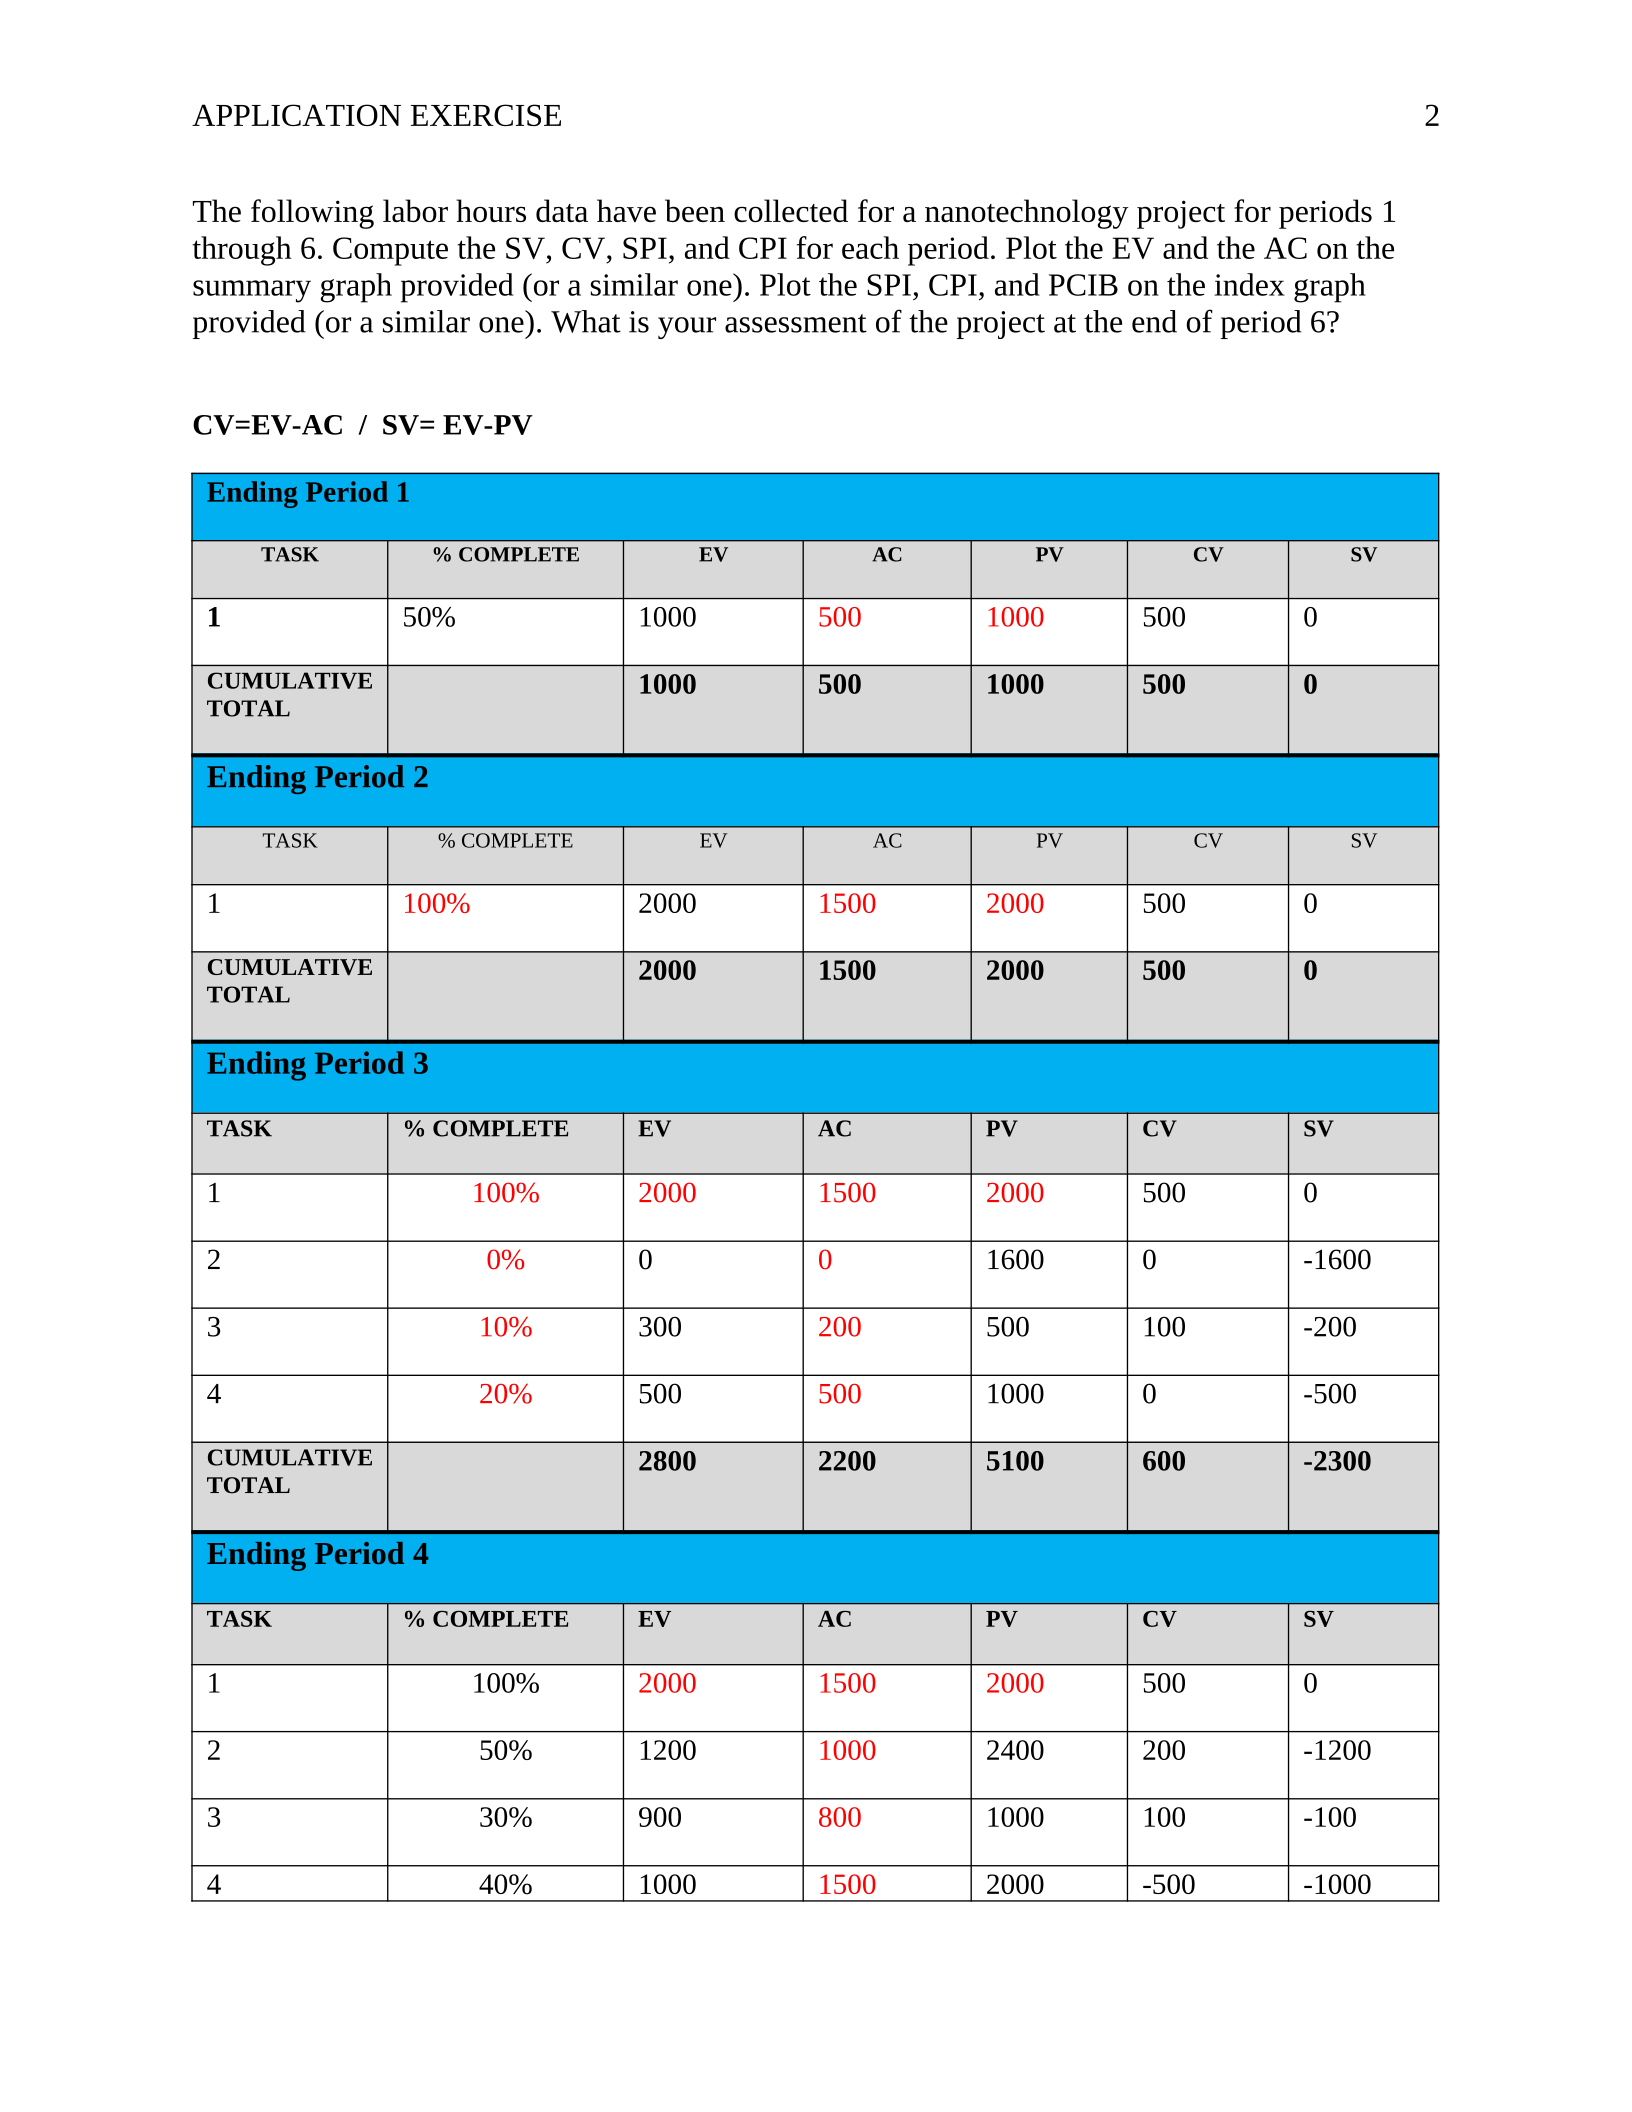
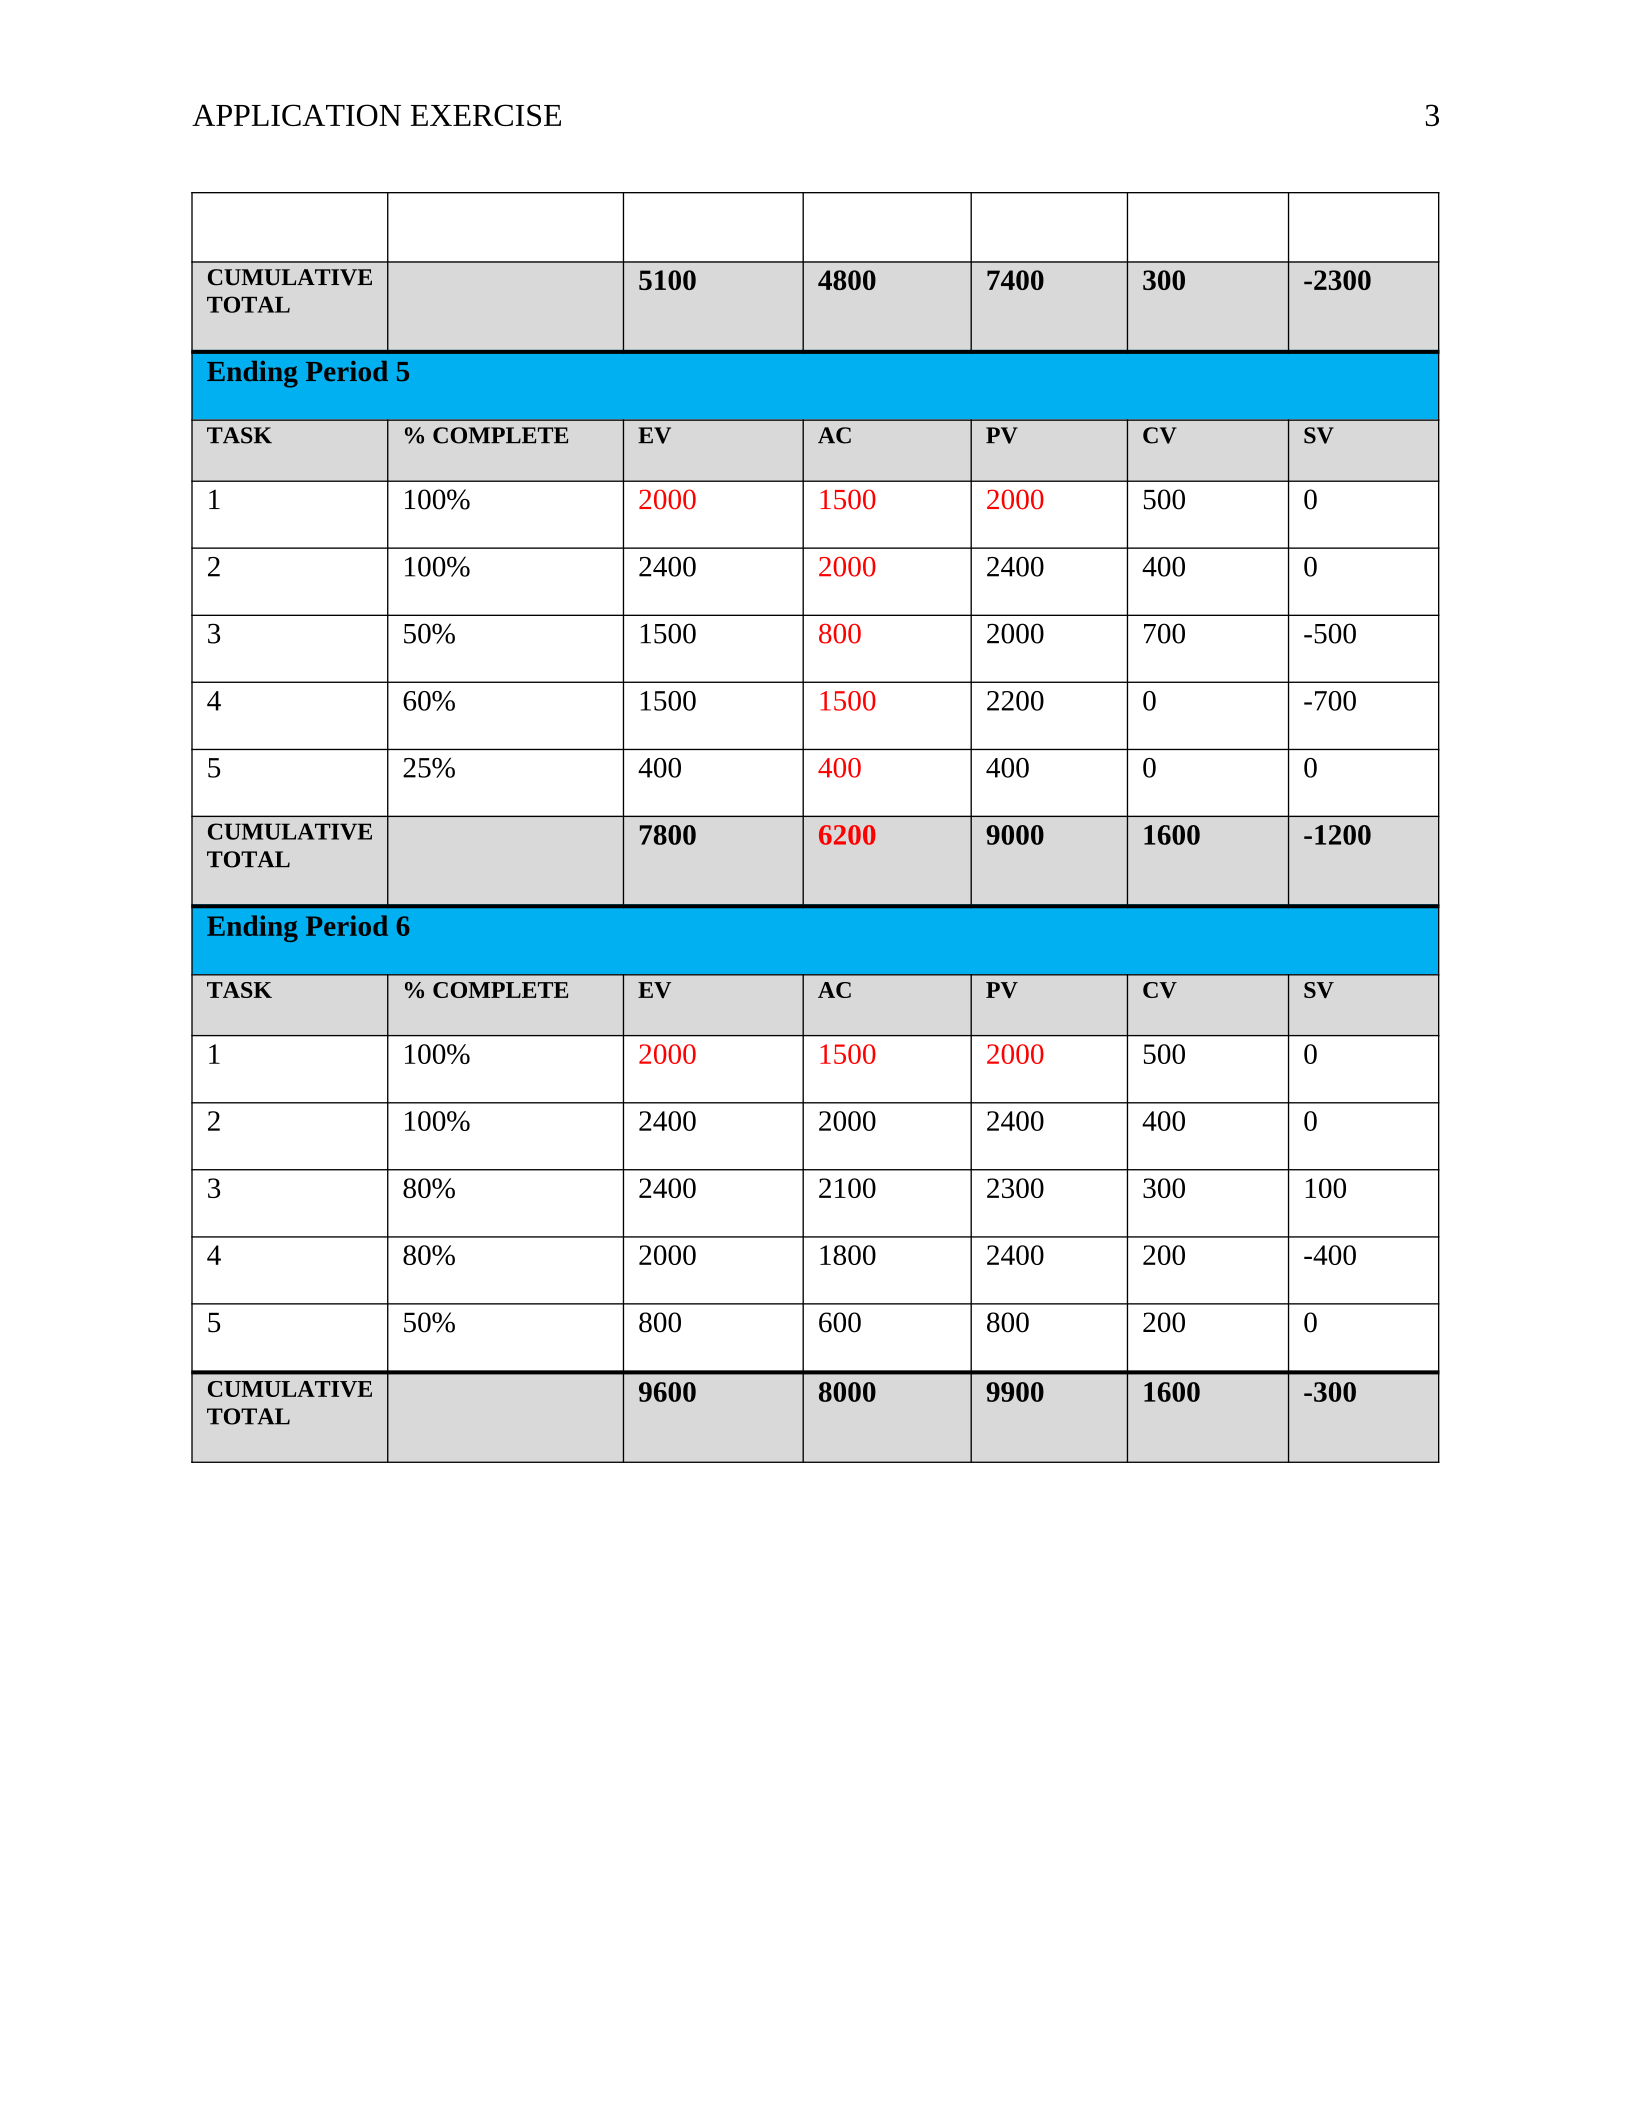
The following labor hours data have been collected for a nanotechnology project for periods 1
through 6. Compute the SV, CV, SPI, and CPI for each period. Plot the EV and the AC on the
summary graph provided (or a similar one). Plot the SPI, CPI, and PCIB on the index graph
provided (or a similar one). What is your assessment of the project at the end of period 6?
CV=EV-AC / SV= EV-PV
Ending Period 1
TASK % COMPLETE EV AC PV CV SV
150% 1000 500 1000 500 0
CUMULATIVE
TOTAL 1000 500 1000 500 0
Ending Period 2
TASK % COMPLETE EV AC PV CV SV
1100% 2000 1500 2000 500 0
CUMULATIVE
TOTAL 2000 1500 2000 500 0
Ending Period 3
TASK % COMPLETE EV AC PV CV SV
1100% 2000 1500 2000 500 0
20% 001600 0 -1600
310% 300 200 500 100 -200
420% 500 500 1000 0 -500
CUMULATIVE
TOTAL 2800 2200 5100 600 -2300
Ending Period 4
TASK % COMPLETE EV AC PV CV SV
1 100% 2000 1500 2000 500 0
2 50% 1200 1000 2400 200 -1200
3 30% 900 800 1000 100 -100
4 40% 1000 1500 2000 -500 -1000
APPLICATION EXERCISE 3
CUMULATIVE
TOTAL 5100 4800 7400 300 -2300
Ending Period 5
TASK % COMPLETE EV AC PV CV SV
1 100% 2000 1500 2000 500 0
2 100% 2400 2000 2400 400 0
3 50% 1500 800 2000 700 -500
4 60% 1500 1500 2200 0 -700
5 25% 400 400 400 0 0
CUMULATIVE
TOTAL 7800 6200 9000 1600 -1200
Ending Period 6
TASK % COMPLETE EV AC PV CV SV
1 100% 2000 1500 2000 500 0
2 100% 2400 2000 2400 400 0
3 80% 2400 2100 2300 300 100
4 80% 2000 1800 2400 200 -400
5 50% 800 600 800 200 0
CUMULATIVE
TOTAL 9600 8000 9900 1600 -300
APPLICATION EXERCISE 4
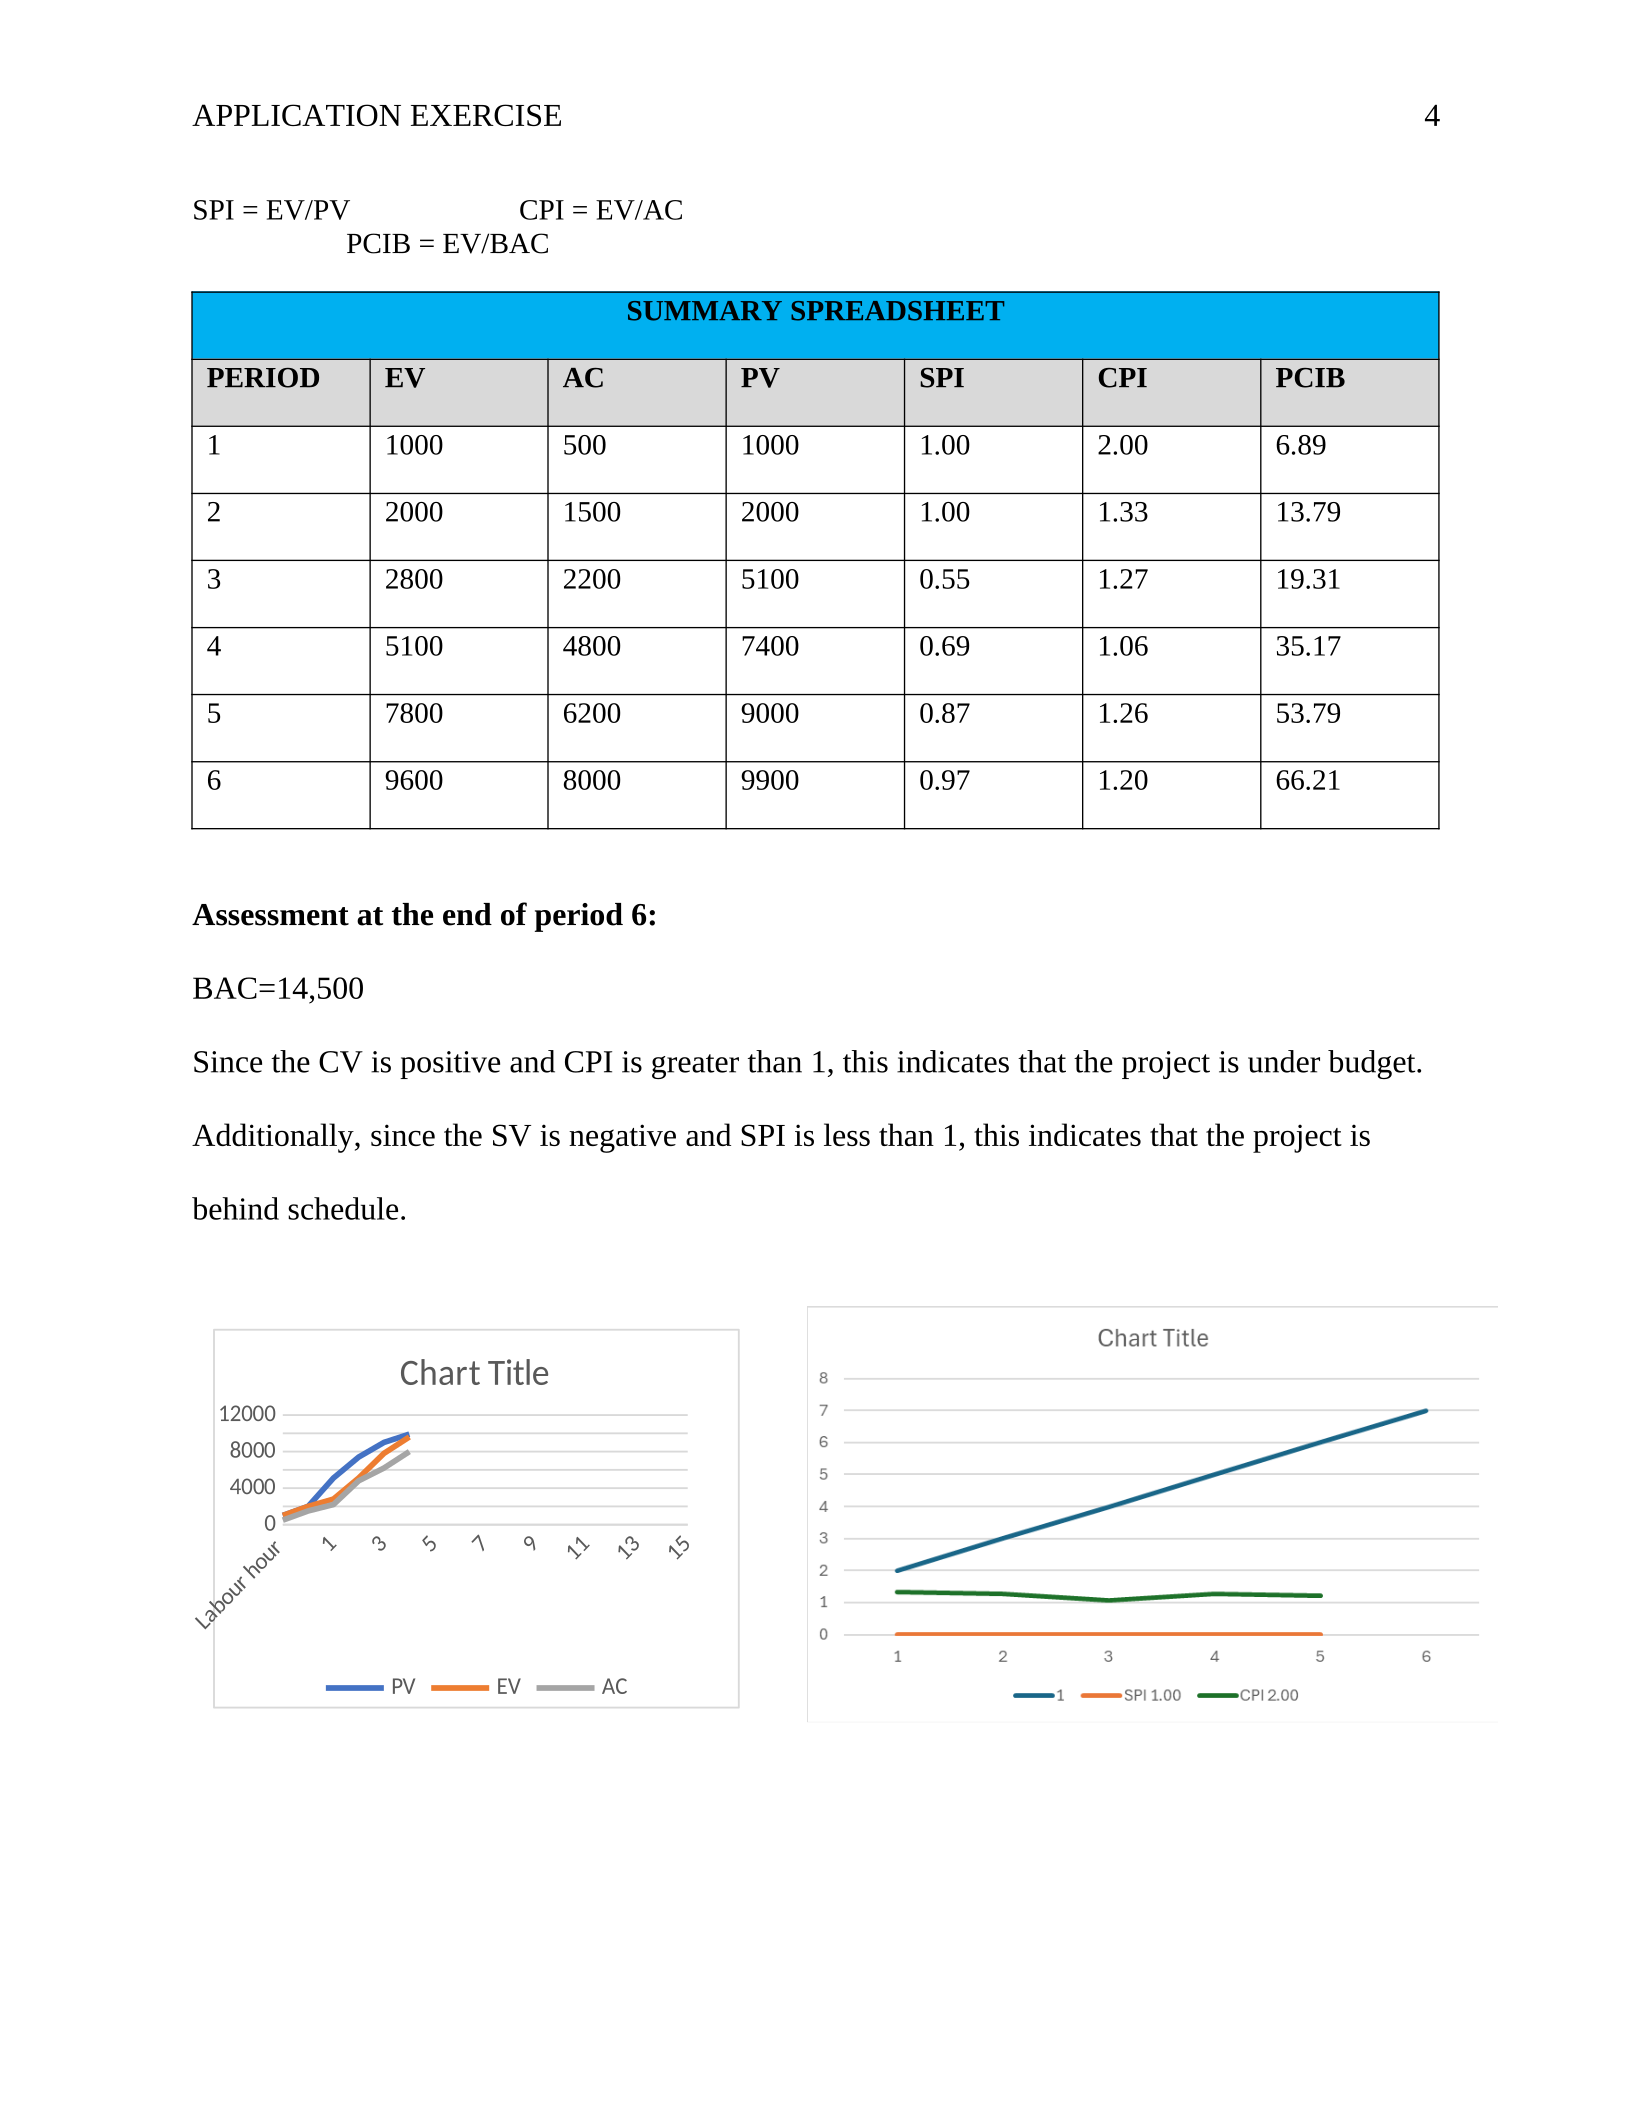
SPI = EV/PV CPI = EV/AC
PCIB = EV/BAC
SUMMARY SPREADSHEET
PERIOD EV AC PV SPI CPI PCIB
1 1000 500 1000 1.00 2.00 6.89
2 2000 1500 2000 1.00 1.33 13.79
3 2800 2200 5100 0.55 1.27 19.31
4 5100 4800 7400 0.69 1.06 35.17
5 7800 6200 9000 0.87 1.26 53.79
6 9600 8000 9900 0.97 1.20 66.21
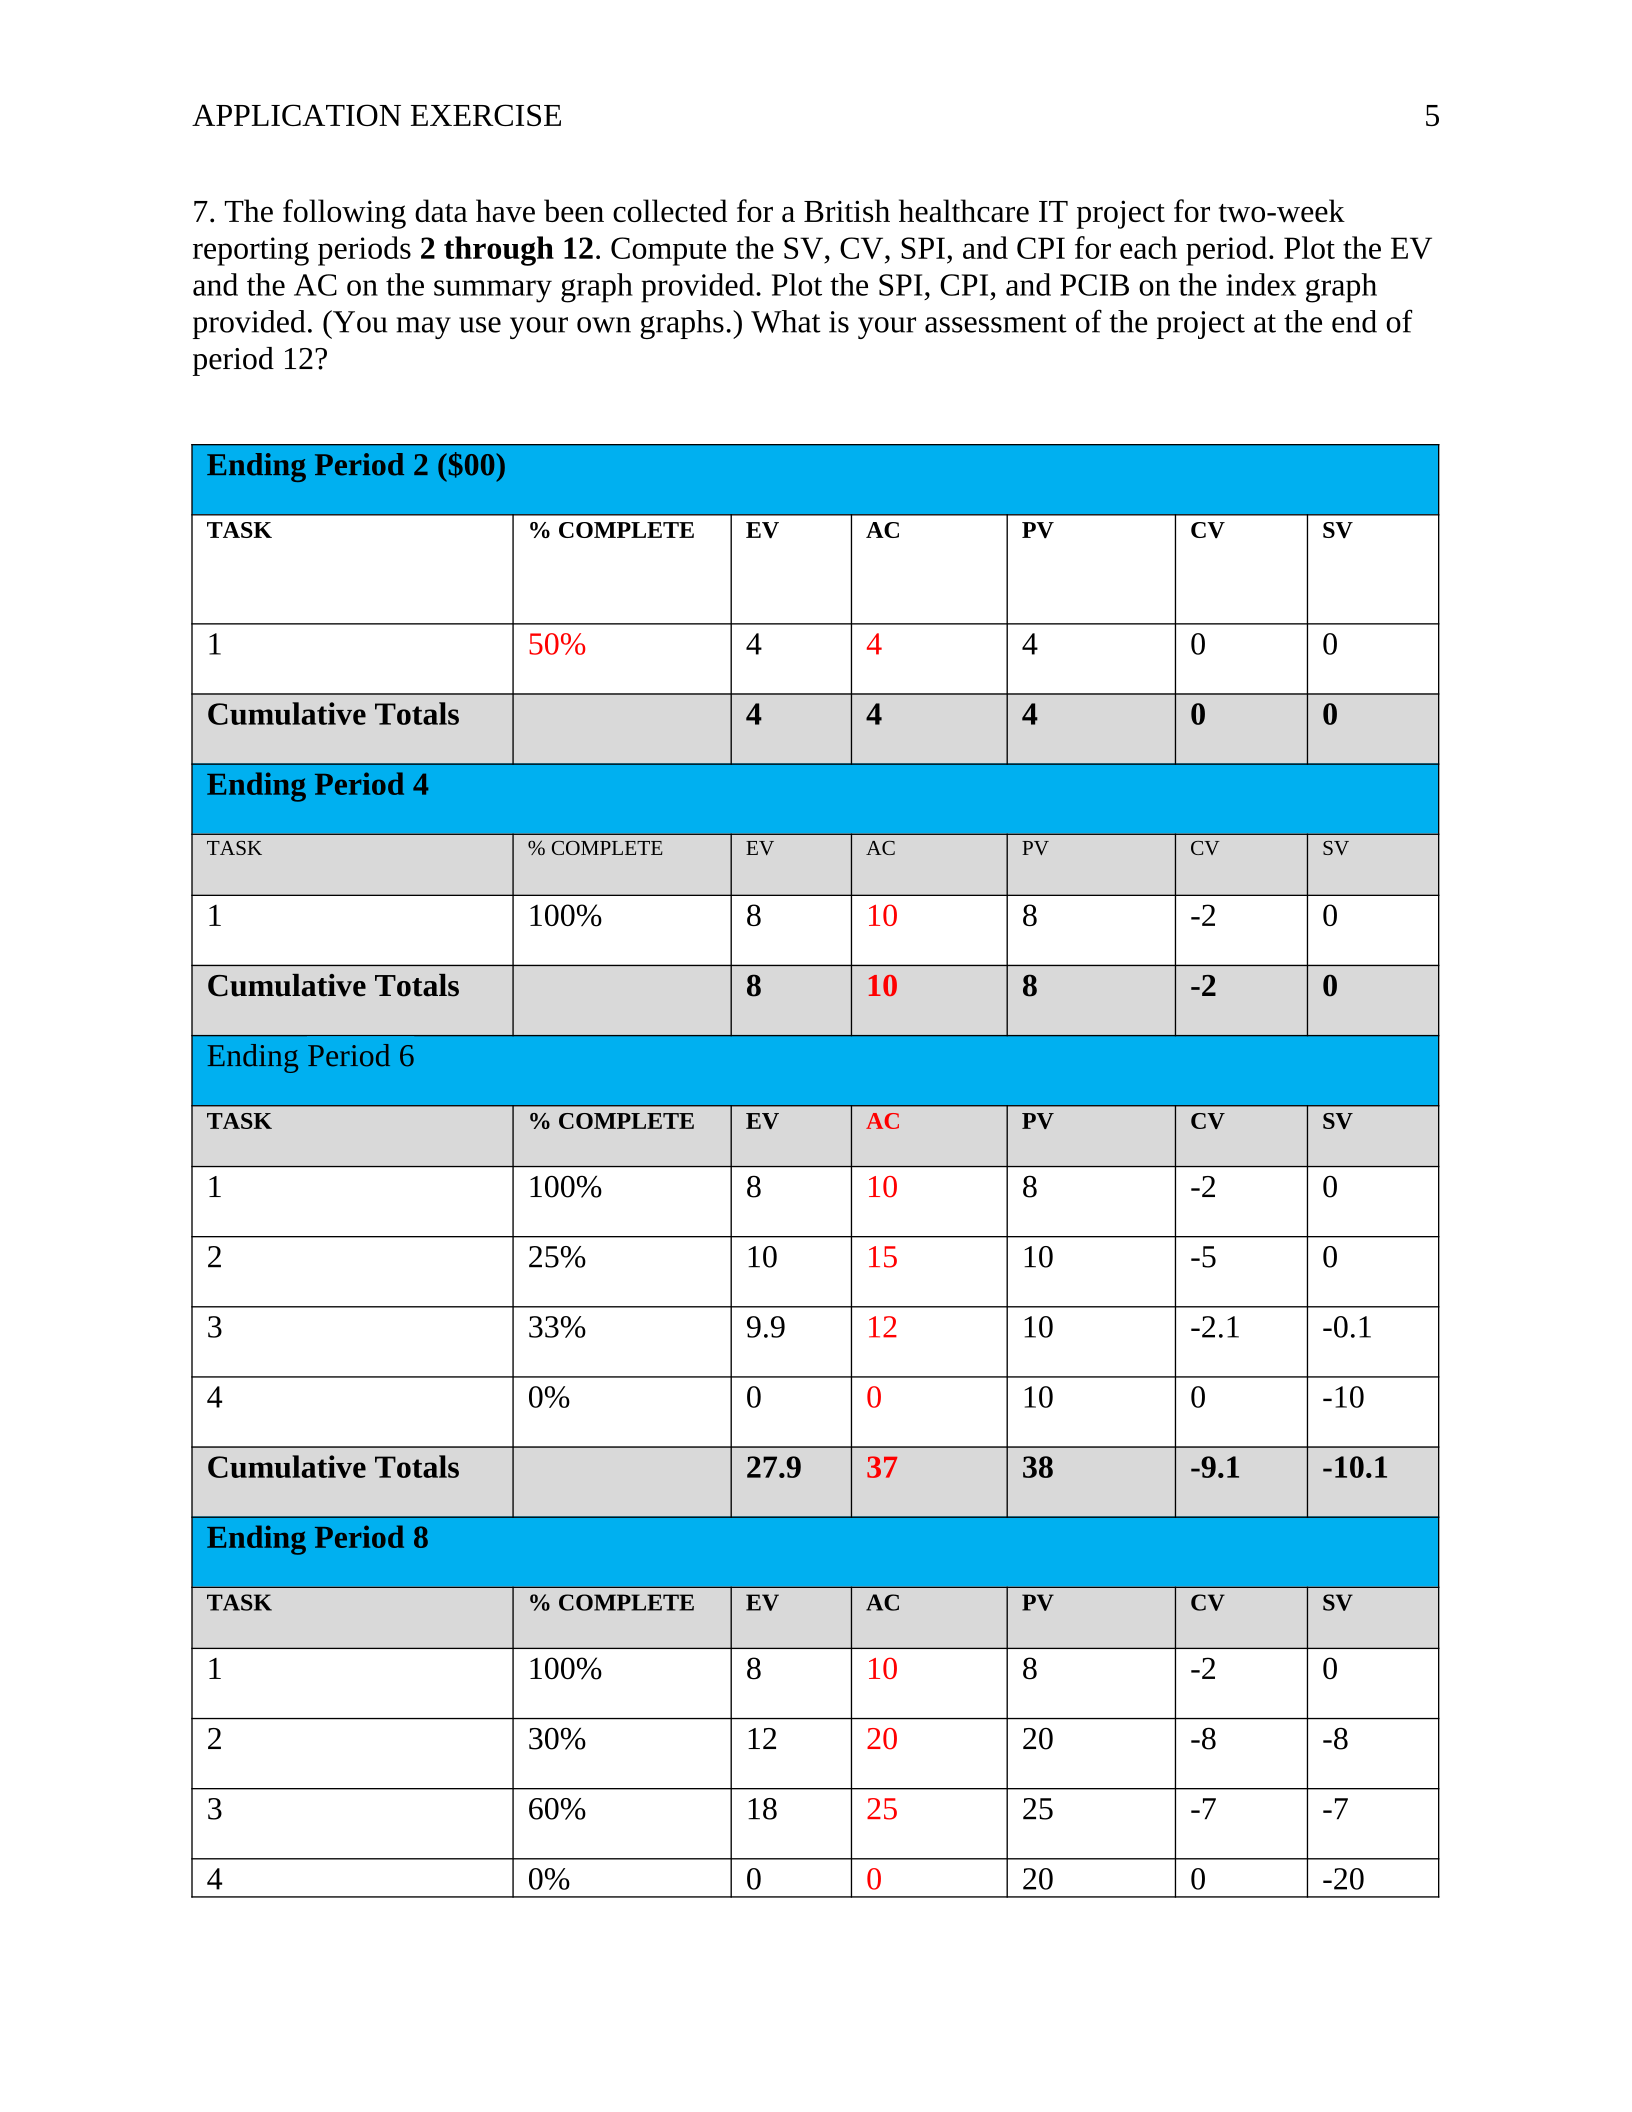
Assessment at the end of period 6:
BAC=14,500
Since the CV is positive and CPI is greater than 1, this indicates that the project is under budget.
Additionally, since the SV is negative and SPI is less than 1, this indicates that the project is
behind schedule.
0
4000
8000
12000
Chart Title
PV EV AC
APPLICATION EXERCISE 5
7. The following data have been collected for a British healthcare IT project for two-week
reporting periods 2 through 12. Compute the SV, CV, SPI, and CPI for each period. Plot the EV
and the AC on the summary graph provided. Plot the SPI, CPI, and PCIB on the index graph
provided. (You may use your own graphs.) What is your assessment of the project at the end of
period 12?
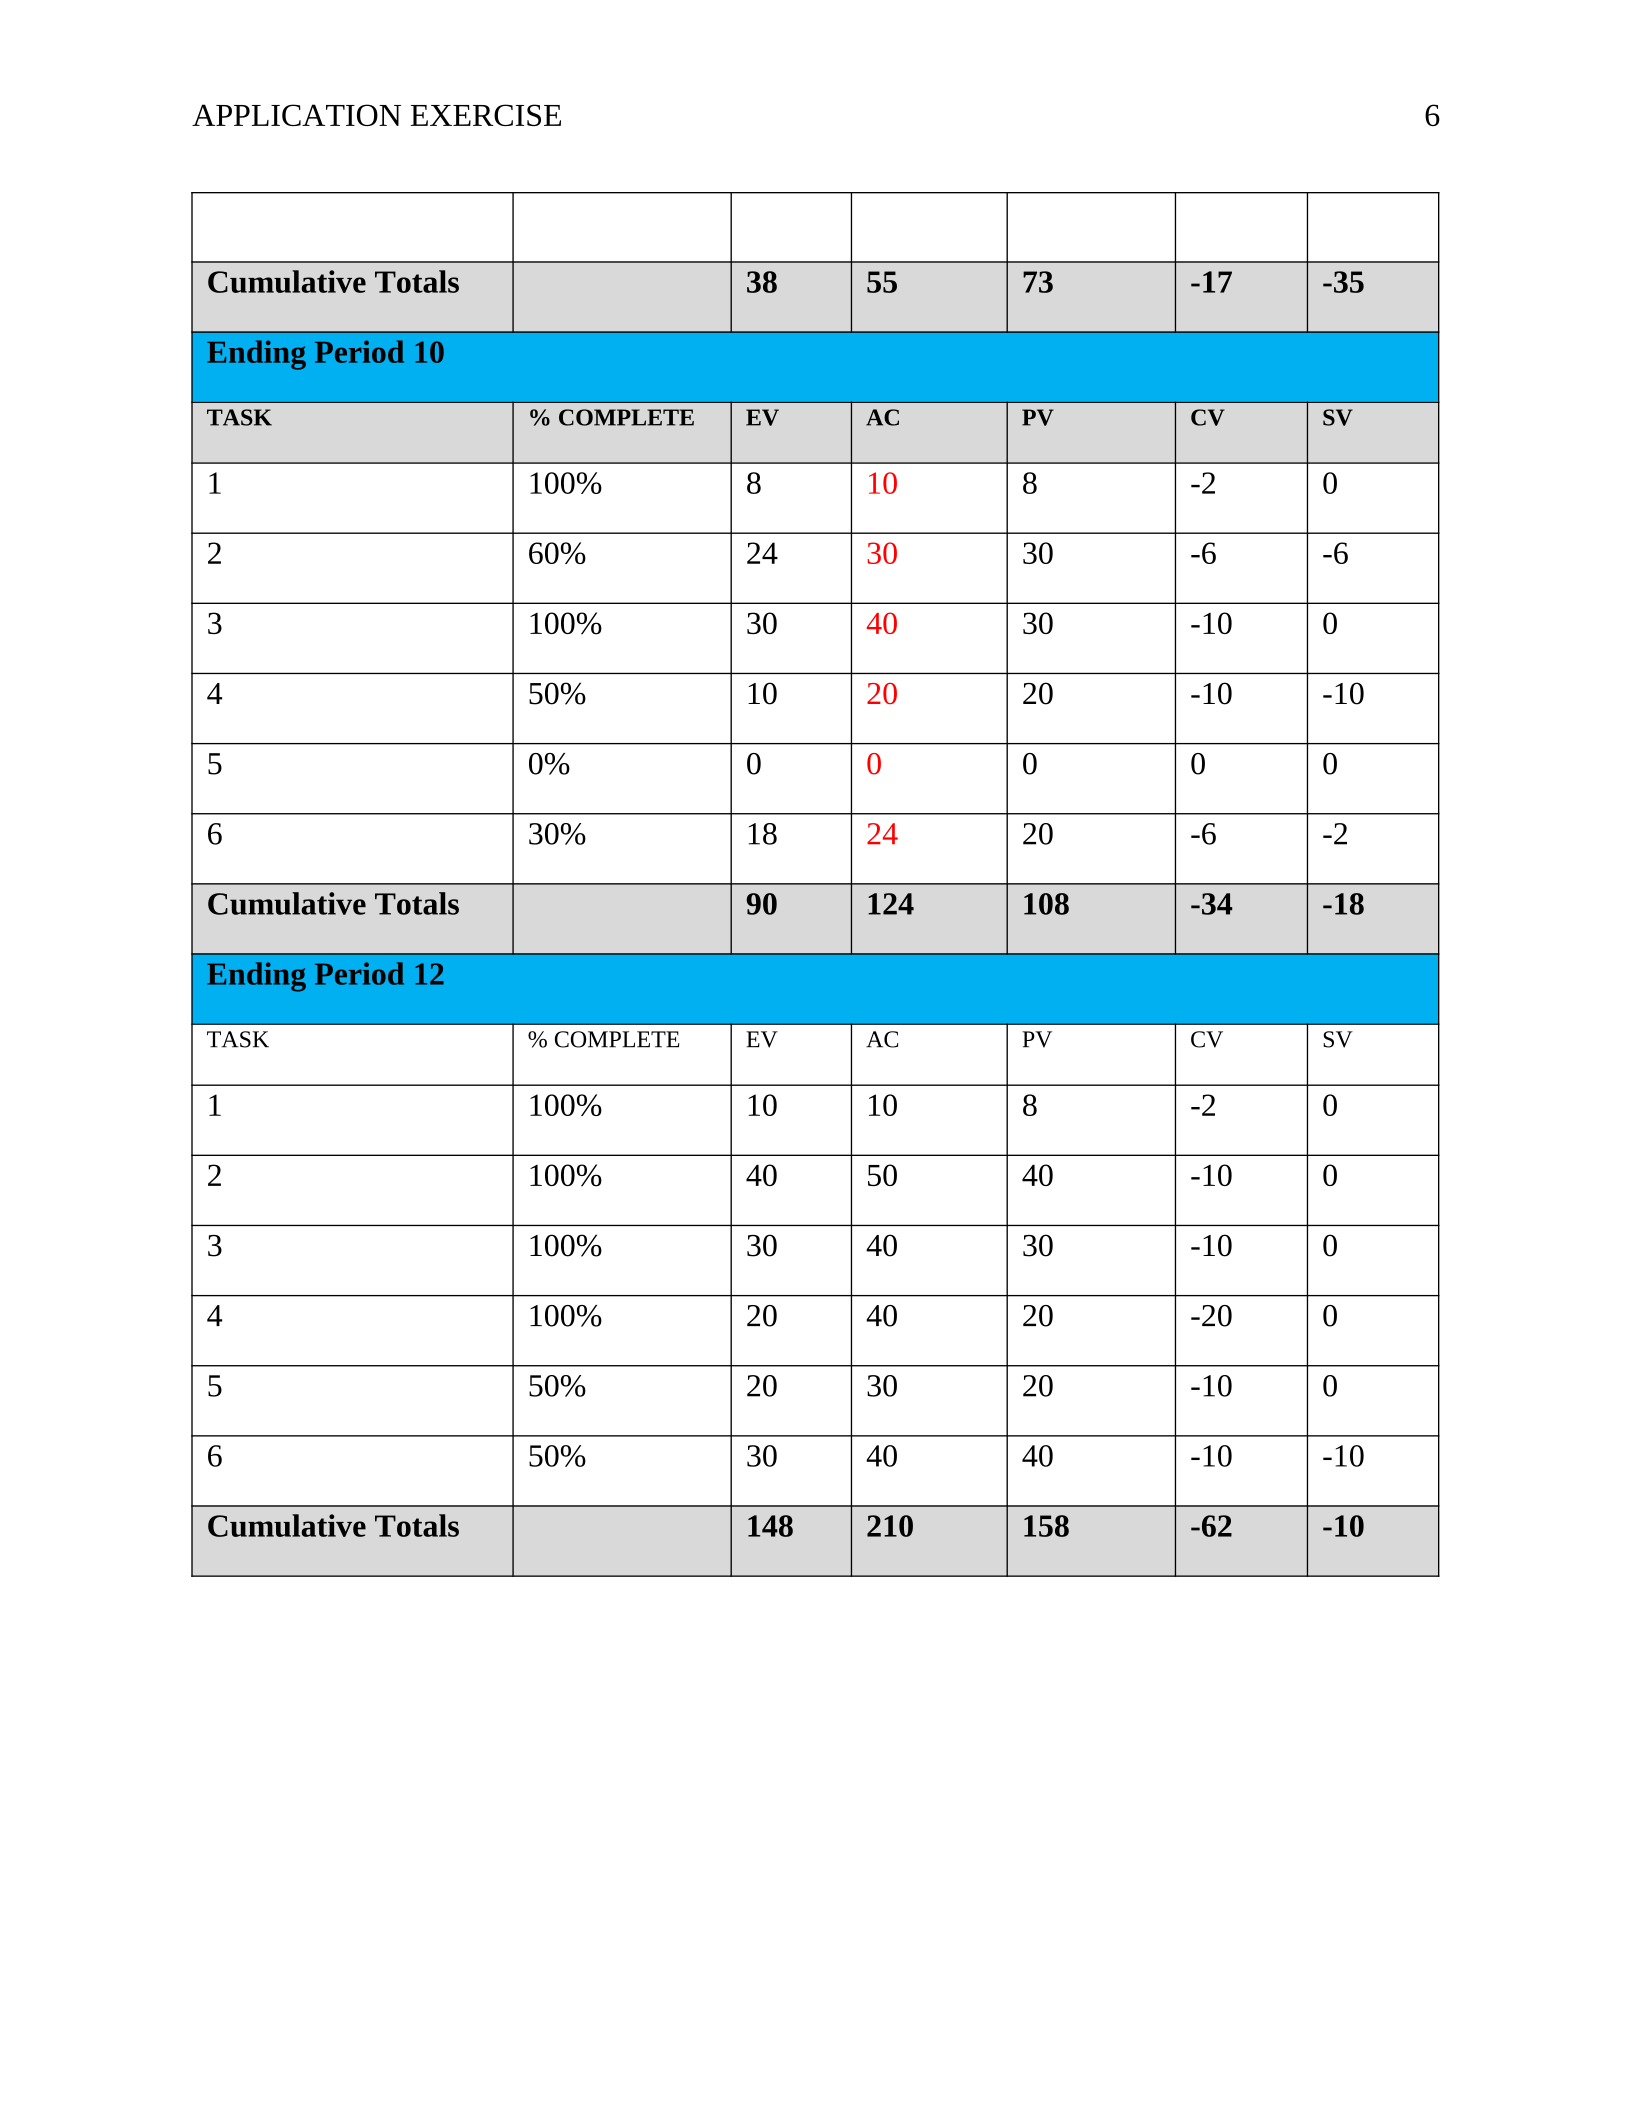
Ending Period 2 ($00)
TASK % COMPLETE EV AC PV CV SV
150% 444 0 0
Cumulative Totals 4 4 4 0 0
Ending Period 4
TASK % COMPLETE EV AC PV CV SV
1 100% 8 10 8 -2 0
Cumulative Totals 8 10 8 -2 0
Ending Period 6
TASK % COMPLETE EV AC PV CV SV
1 100% 8 10 8 -2 0
2 25% 10 15 10 -5 0
3 33% 9.9 12 10 -2.1 -0.1
4 0% 0 010 0 -10
Cumulative Totals 27.9 37 38 -9.1 -10.1
Ending Period 8
TASK % COMPLETE EV AC PV CV SV
1 100% 8 10 8 -2 0
2 30% 12 20 20 -8 -8
3 60% 18 25 25 -7 -7
4 0% 0 020 0 -20
APPLICATION EXERCISE 6
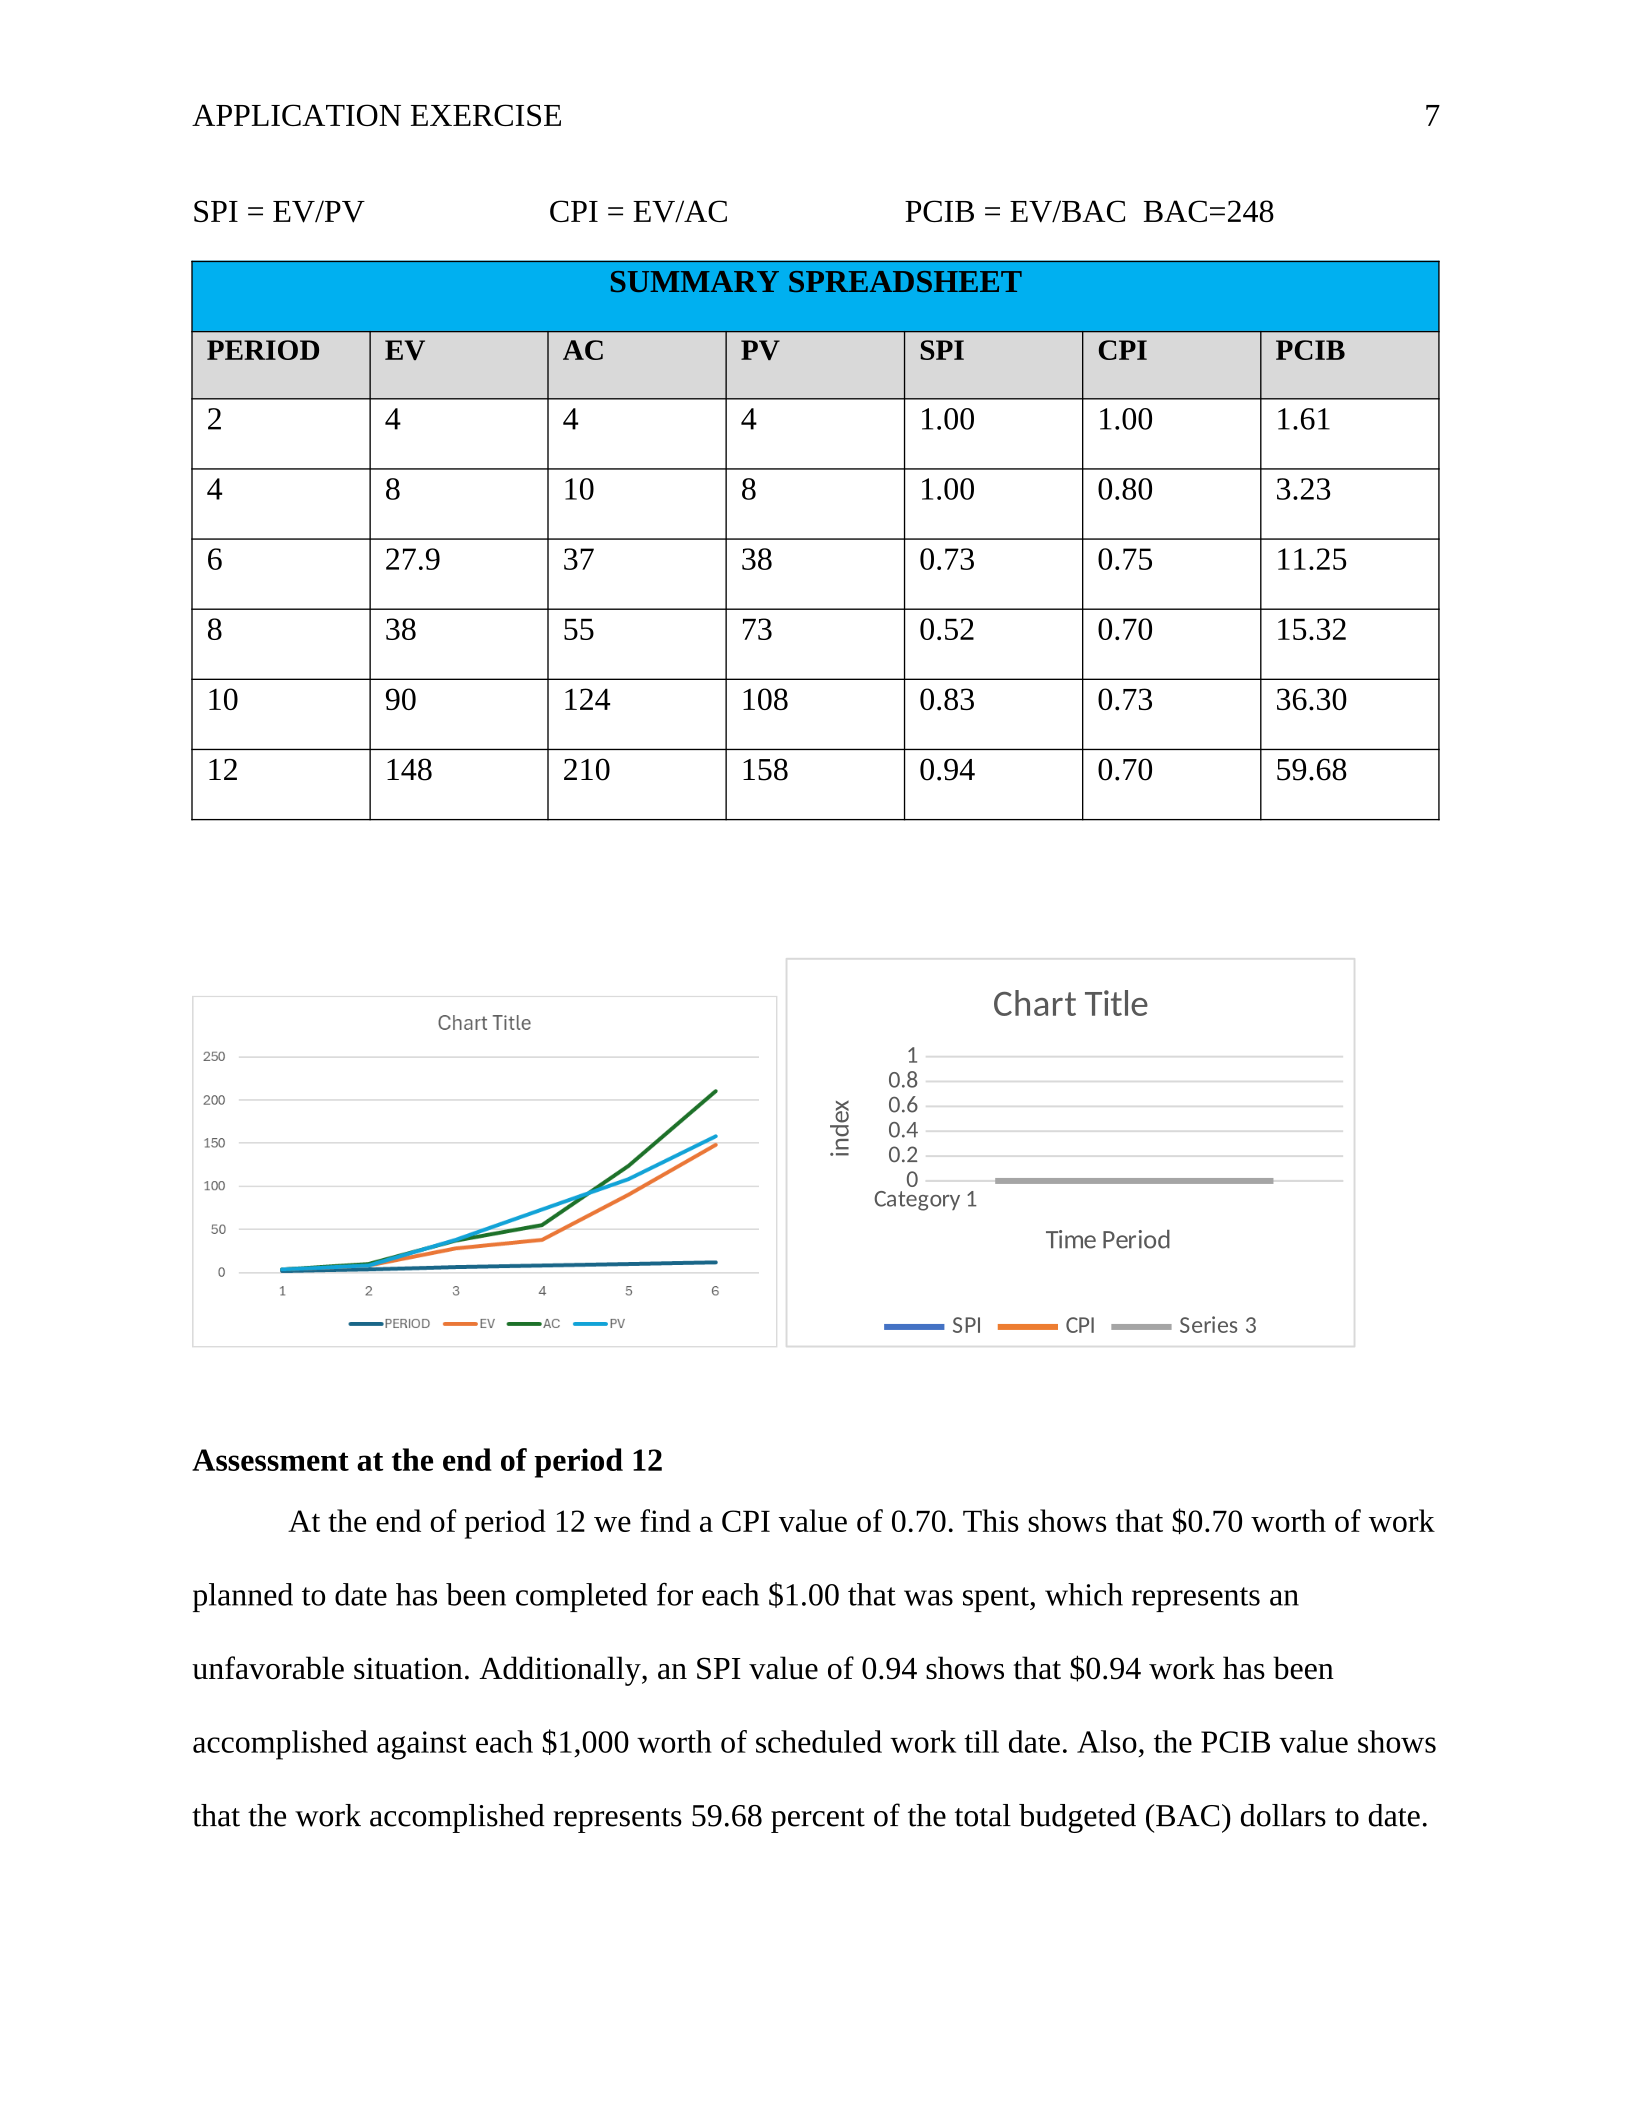
Cumulative Totals 38 55 73 -17 -35
Ending Period 10
TASK % COMPLETE EV AC PV CV SV
1 100% 8 10 8 -2 0
2 60% 24 30 30 -6 -6
3 100% 30 40 30 -10 0
4 50% 10 20 20 -10 -10
5 0% 0 00 0 0
6 30% 18 24 20 -6 -2
Cumulative Totals 90 124 108 -34 -18
Ending Period 12
TASK % COMPLETE EV AC PV CV SV
1 100% 10 10 8 -2 0
2 100% 40 50 40 -10 0
3 100% 30 40 30 -10 0
4 100% 20 40 20 -20 0
5 50% 20 30 20 -10 0
6 50% 30 40 40 -10 -10
Cumulative Totals 148 210 158 -62 -10
APPLICATION EXERCISE 7
SPI = EV/PV CPI = EV/AC PCIB = EV/BAC BAC=248
SUMMARY SPREADSHEET
PERIOD EV AC PV SPI CPI PCIB
2 4 4 4 1.00 1.00 1.61
4 8 10 8 1.00 0.80 3.23
6 27.9 37 38 0.73 0.75 11.25
8 38 55 73 0.52 0.70 15.32
10 90 124 108 0.83 0.73 36.30
12 148 210 158 0.94 0.70 59.68
Category 1
0
0.2
0.4
0.6
0.8
1
Chart Title
SPI CPI Series 3
Time Period
index
Assessment at the end of period 12
At the end of period 12 we find a CPI value of 0.70. This shows that $0.70 worth of work
planned to date has been completed for each $1.00 that was spent, which represents an
unfavorable situation. Additionally, an SPI value of 0.94 shows that $0.94 work has been
accomplished against each $1,000 worth of scheduled work till date. Also, the PCIB value shows
that the work accomplished represents 59.68 percent of the total budgeted (BAC) dollars to date.
Powered by TCPDF (www.tcpdf.org)

