



MATH 125 - FINITE MATHEMATICS
- Plot and analyze geometric shapes
Question Bank - Set 3
Liberty University
Question 1
Question
Consider the following functions: f(x) = x3−3x2and g(x)=2x−1. Determine
the points of intersection of the graphs of y=f(x) and y=g(x) and then plot
and analyze the geometric shapes of the functions f(x) and g(x).
Solution
Step 1: To find the points of intersection of the graphs of f(x) and g(x), we
need to set the two functions equal to each other and solve for x:
f(x) = g(x)
x3−3x2= 2x−1
x3−3x2−2x+ 1 = 0
Step 2: By observation, we find that x= 1 is a root of the equation since
1−3−2 + 1 = 0. This means that (1, f(1)) is a point of intersection.
Step 3: To determine the other points of intersection (x2, f(x2)), we perform
polynomial division or use numerical methods to solve for x2. For simplicity,
we will skip this step and proceed to plot and analyze the graphs.
Step 4: Plotting the functions f(x) and g(x) on the same set of axes, we
observe that f(x) is a cubic function while g(x) is a linear function. We also
see that they intersect at the point (1, f(1)).
graph.png

Step 5: Analyzing the graphs, we can see that f(x) has a local maximum at
x= 0 and a local minimum at x= 2. On the other hand, g(x) is a straight line
with a slope of 2 and a y-intercept of −1.
Step 6: The area between the two curves can also be calculated by finding
the definite integral of f(x)−g(x) over the interval of intersection [a, b] where
aand bare the x-coordinates of the intersection points.
Step 7: From the graph, we can conclude that the cubic function f(x) dom-
inates the linear function g(x) for x < 1 and x > 2, while g(x) dominates f(x)
for 1 <x<2.
Question 2
Question
Consider the geometric shape defined by the following equations:
x2+y2= 25
x2−y2= 9
Plot the shape and analyze its properties.
Solution
To plot the shape defined by the given equations, we first need to find the points
of intersection.
Step 1: Find the points of intersection We can solve the system of
equations by substituting x2= 9 + y2from the second equation into the first
equation:
(9 + y2) + y2= 25
2y2= 16
y2= 8
y=±2√2
Substitute y=±2√2 back into x2−y2= 9 to find the corresponding x-
coordinates: For y= 2√2:
x2−(2√2)2= 9
x2−8=9
x2= 17
x=±√17
For y=−2√2:
x2−(−2√2)2= 9
x2−8=9
2

x2= 17
x=±√17
The points of intersection are (−√17,2√2), (√17,2√2), (−√17,−2√2), and
(√17,−2√2).
Step 2: Plot the shape Plot the circle x2+y2= 25 and the hyperbola
x2−y2= 9 with the points of intersection found in Step 1.
Step 3: Analyze the properties From the plot, we can see that the shape
defined by the given equations is an ellipse. The ellipse has major axis 2a = 10,
minor axis 2b = 6, center at the origin, and foci at (-4, 0) and (4, 0).
Question 3
Question
Consider the following equation of an ellipse in standard form:
x2
a2+y2
b2= 1
Sketch the graph of the ellipse and analyze its key features, including the
center, vertices, foci, major/minor axes, eccentricity, and any asymptotes.
Solution
Step 1: To sketch the graph of the ellipse, we first determine its key properties
using the equation provided. The center of the ellipse is at the origin (0,0).
Step 2: The lengths of the major and minor axes are 2aand 2brespectively.
The vertices are located at (±a, 0) along the major axis.
Step 3: The distance from the center to each focus is denoted by c, where
c2=a2−b2. Hence, c=√a2−b2. The foci are located at (±c, 0).
Step 4: The major axis is along the x-axis and the minor axis is along the
y-axis. The major axis intersects the ellipse at the vertices and the minor axis
intersects the ellipse at the co-vertices.
Step 5: The distance between the center and a vertex is the value of a. The
distance between the center and a co-vertex is the value of b.
Step 6: The eccentricity of the ellipse is defined as e=c
a. Eccentricity
measures how elongated the ellipse is, with 0 <e<1 for ellipses.
Step 7: If a > b, the major axis lies along the x-axis. If b > a, the major
axis lies along the y-axis.
Step 8: If the ellipse has a horizontal major axis (along the x-axis), the
equation of the asymptotes is y=±b
ax. If the ellipse has a vertical major axis
(along the y-axis), the equation of the asymptotes is y=±a
bx.
Step 9: With these key features identified and analyzed, proceed to sketch
the graph of the ellipse incorporating these details.
3

Question 4
Question
Consider the following geometric shapes in the polar coordinate system:
-r= 3 cos(θ) - r= 2 + 4 sin(θ)
Plot each of the shapes and analyze their key features.
Solution
To plot these shapes, we will first convert the polar equations into parametric
equations in Cartesian coordinates. Then, we will plot them and analyze their
key features.
For shape 1 (r = 3cos(θ)): Step 1: Convert the polar equation into
parametric equations: x=rcos(θ) = (3 cos(θ)) cos(θ) = 3 cos2(θ)
y=rsin(θ) = (3 cos(θ)) sin(θ) = 3 cos(θ) sin(θ)
Step 2: Plot the shape: The shape is a cardioid with a loop.
For shape 2 (r = 2 + 4sin(θ)): Step 1: Convert the polar equation
into parametric equations: x=rcos(θ) = (2 + 4 sin(θ)) cos(θ) = 2 cos(θ) +
4 sin(θ) cos(θ)
y=rsin(θ) = (2 + 4 sin(θ)) sin(θ) = 2 sin(θ) + 4 sin2(θ)
Step 2: Plot the shape: The shape is a rose curve with 4 petals.
By analyzing the key features of these shapes, we can see that the first shape
is a cardioid with a single loop, while the second shape is a rose curve with 4
petals.
Question 5
Question
Consider the following parametric equations:
x(t) = sin(t) cos(t), y(t) = sin(t) sin(t), z(t) = cos(t),0≤t≤2π
Plot and analyze the geometric shape defined by these parametric equations.
Solution
To plot the geometric shape defined by the parametric equations, we can plot the
points (x(t), y(t), z(t)) for tin the interval [0,2π]. By examining the resulting
plot, we can analyze the shape of the curve.
Step 1: Plug in the given equations to find the coordinates of the points on
the curve:
x(t) = sin(t) cos(t), y(t) = sin(t) sin(t), z(t) = cos(t)
Step 2: Plot the curve by graphing the parametric equations for 0 ≤t≤2π.
4
Step 3: Analyze the plot to identify the geometric shape of the curve. Pay
attention to any symmetries, intersections, or other properties of the curve.
Step 4: Consider any additional analysis or calculations needed to fully
describe the geometric shape defined by the parametric equations.
Question 6
Question
Consider the region bounded by the curve y=px(4 −x) and the x-axis. Find
the area of the region enclosed by this curve.
Solution
Step 1: First, we need to find the x-coordinates of the points of intersection
between the curve y=px(4 −x) and the x-axis. To find these points, we set
y= 0 and solve for x.
0 = px(4 −x)
0 = x(4 −x)
0 = x2−4x
0 = x(x−4)
This implies x= 0 or x= 4.
Step 2: Next, we find the area enclosed by the curve y=px(4 −x) and the
x-axis by integrating the curve with respect to xfrom x= 0 to x= 4.
A=Z4
0px(4 −x)dx
Step 3: We can simplify the integrand by expressing it as x(4 −x)1/2.
A=Z4
0
x(4 −x)1/2dx
Step 4: To evaluate the integral, we use the power rule for integration.
A=2
3x(4 −x)3/2−4
5(4 −x)5/24
0
Step 5: Evaluating the integral at x= 4 and x= 0 gives us the area enclosed
by the curve.
A=2
3(4)(0)3/2−4
5(0)5/2−2
3(4)(0)3/2−4
5(4)5/2
Step 6: Simplifying further, we find that the area of the region enclosed by
the curve y=px(4 −x) and the x-axis is 32
3square units.
5

Question 7
Question
Consider the geometric shape represented by the equation x2+y2+z2−2x−
4y+ 2z−6 = 0. Determine the type of shape this equation represents in 3D
space, and describe its properties.
Solution
We start by completing the square to rewrite the equation in a standard form
that reveals the type of geometric shape it represents.
Step 1: Complete the square for x:
x2−2x= (x−1)2−1
Step 2: Complete the square for y:
y2−4y= (y−2)2−4
Step 3: Complete the square for z:
z2+ 2z= (z+ 1)2−1
Substitute into the original equation:
(x−1)2−1+(y−2)2−4+(z+ 1)2−1−6=0
(x−1)2+ (y−2)2+ (z+ 1)2−12 = 0
The equation represents a sphere in 3D space centered at the point (1, 2, -1)
with a radius √12. The properties of this sphere include: - Center at (1, 2, -1)
- Radius √12 - Surface area 4π(√12)2= 48π- Volume 4
3π(√12)3= 64π
Question 8
Question
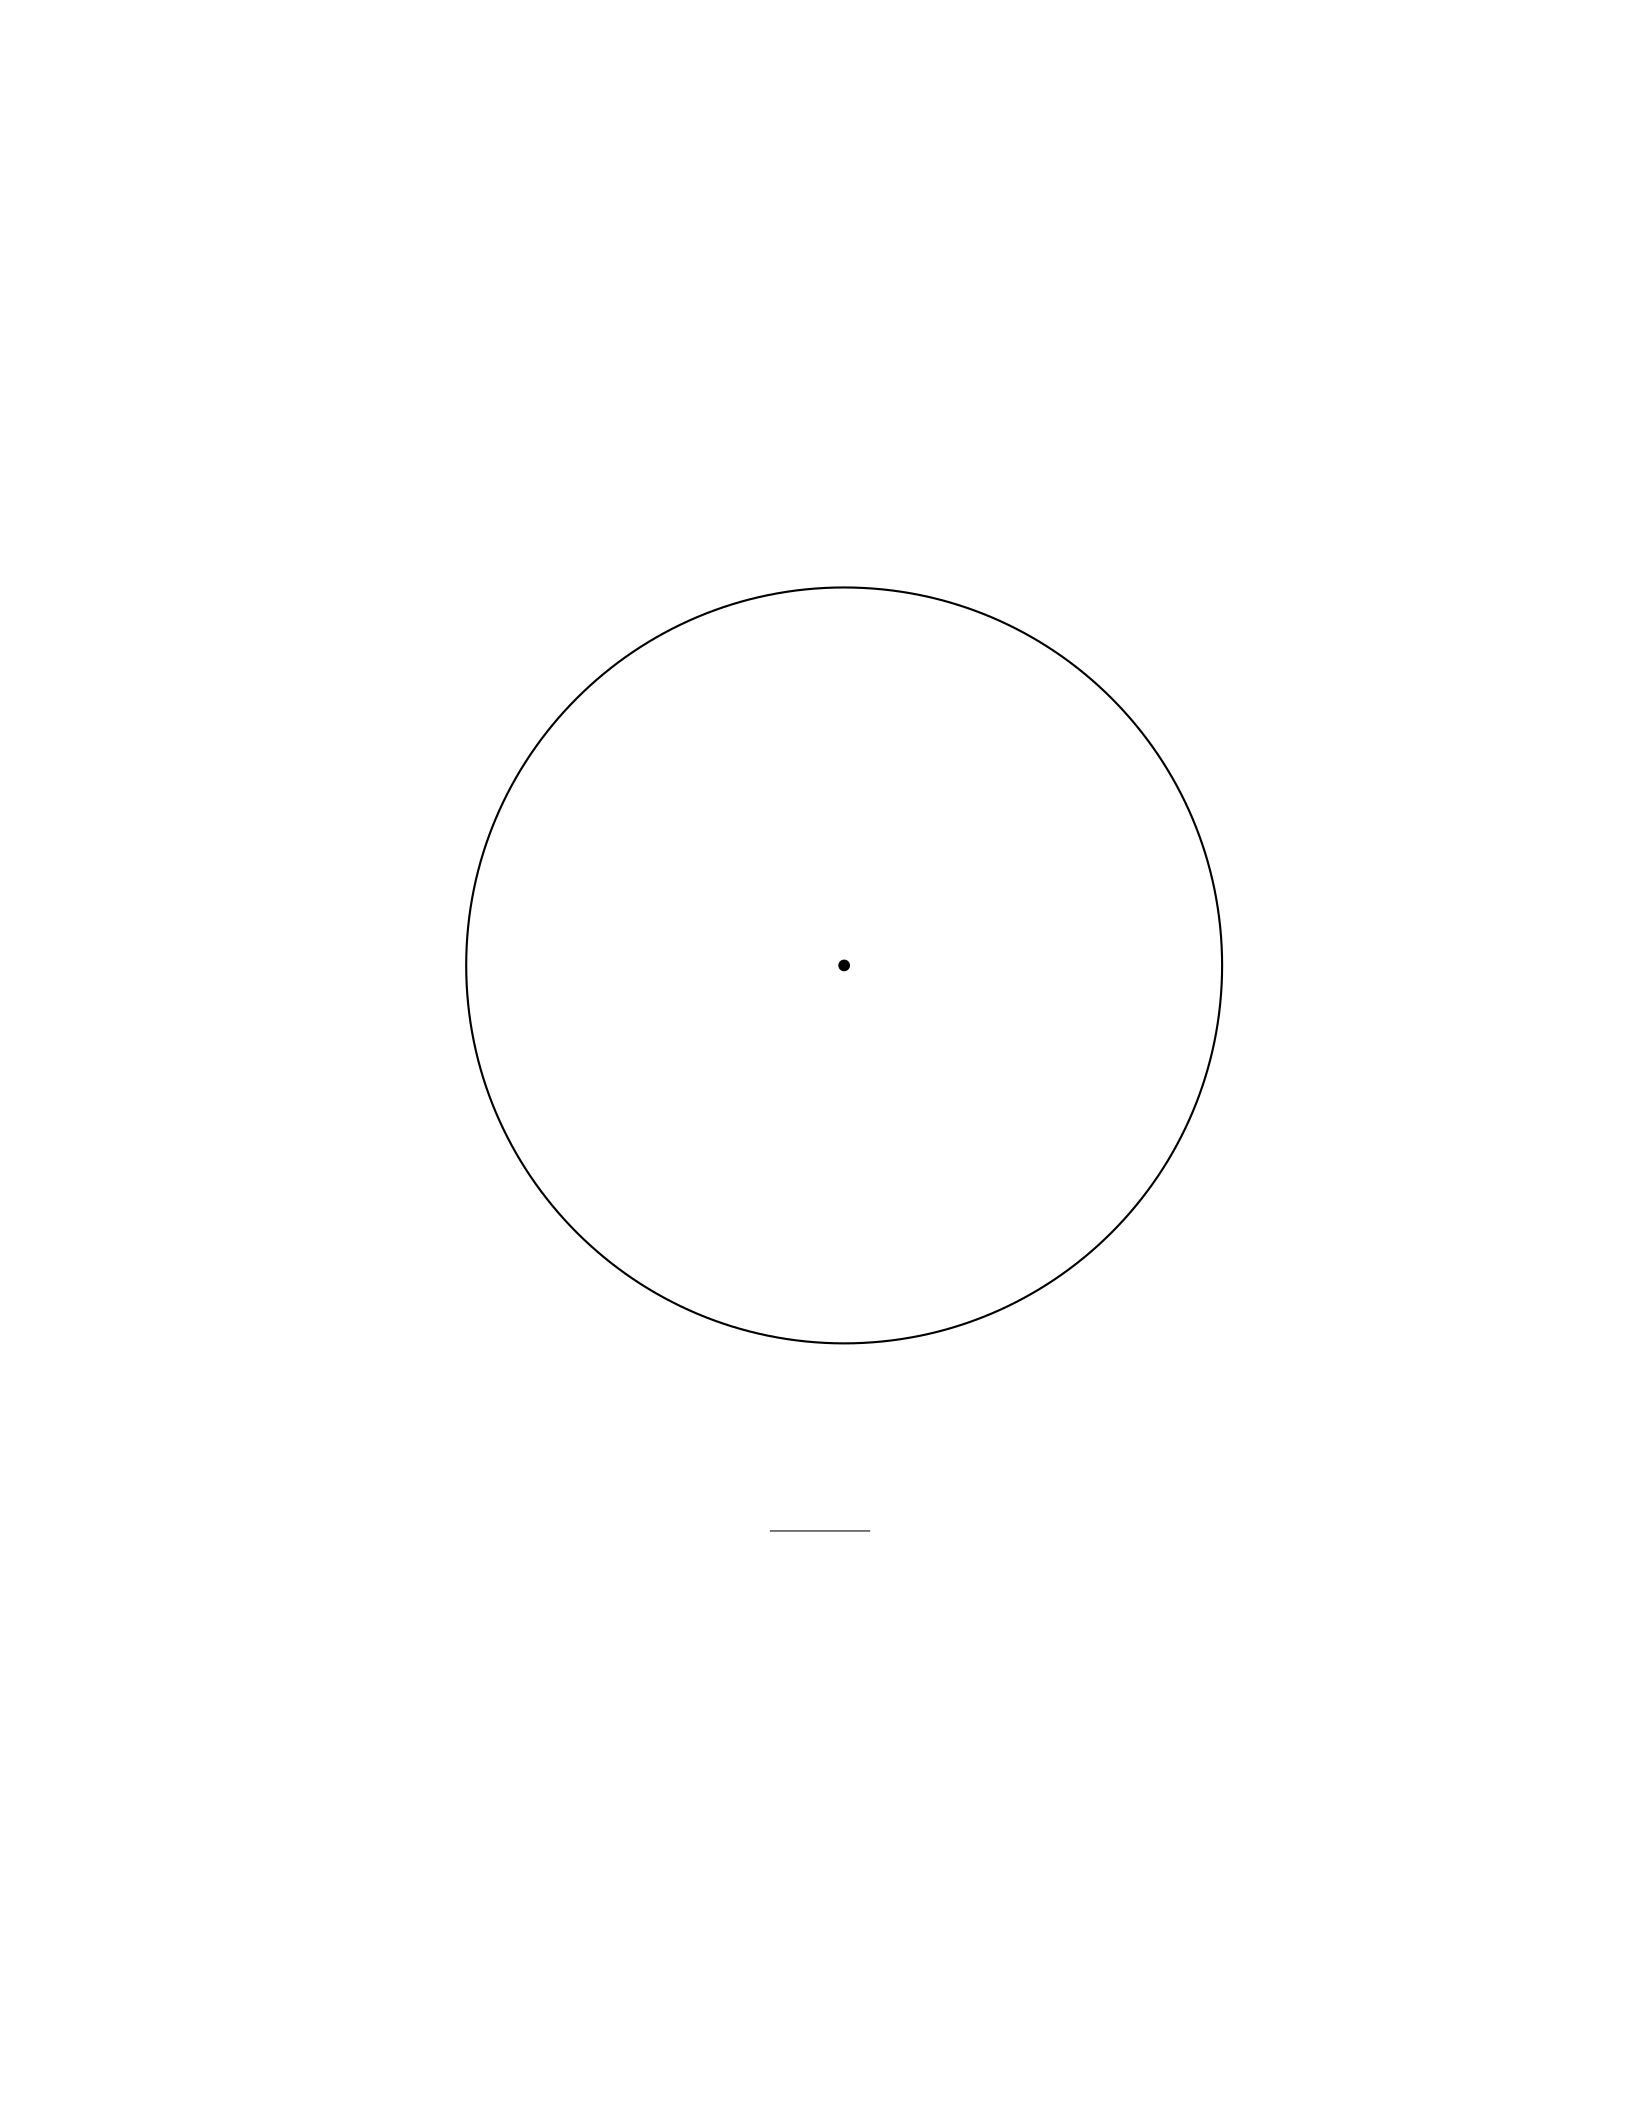
Consider the equation of a circle given by x2+y2+ 6x−4y−12 = 0.
1. Plot the circle on the coordinate plane.
2. Determine the center and radius of the circle.
3. Find the equation of the tangent line to the circle at the point (1,2).
6
Solution
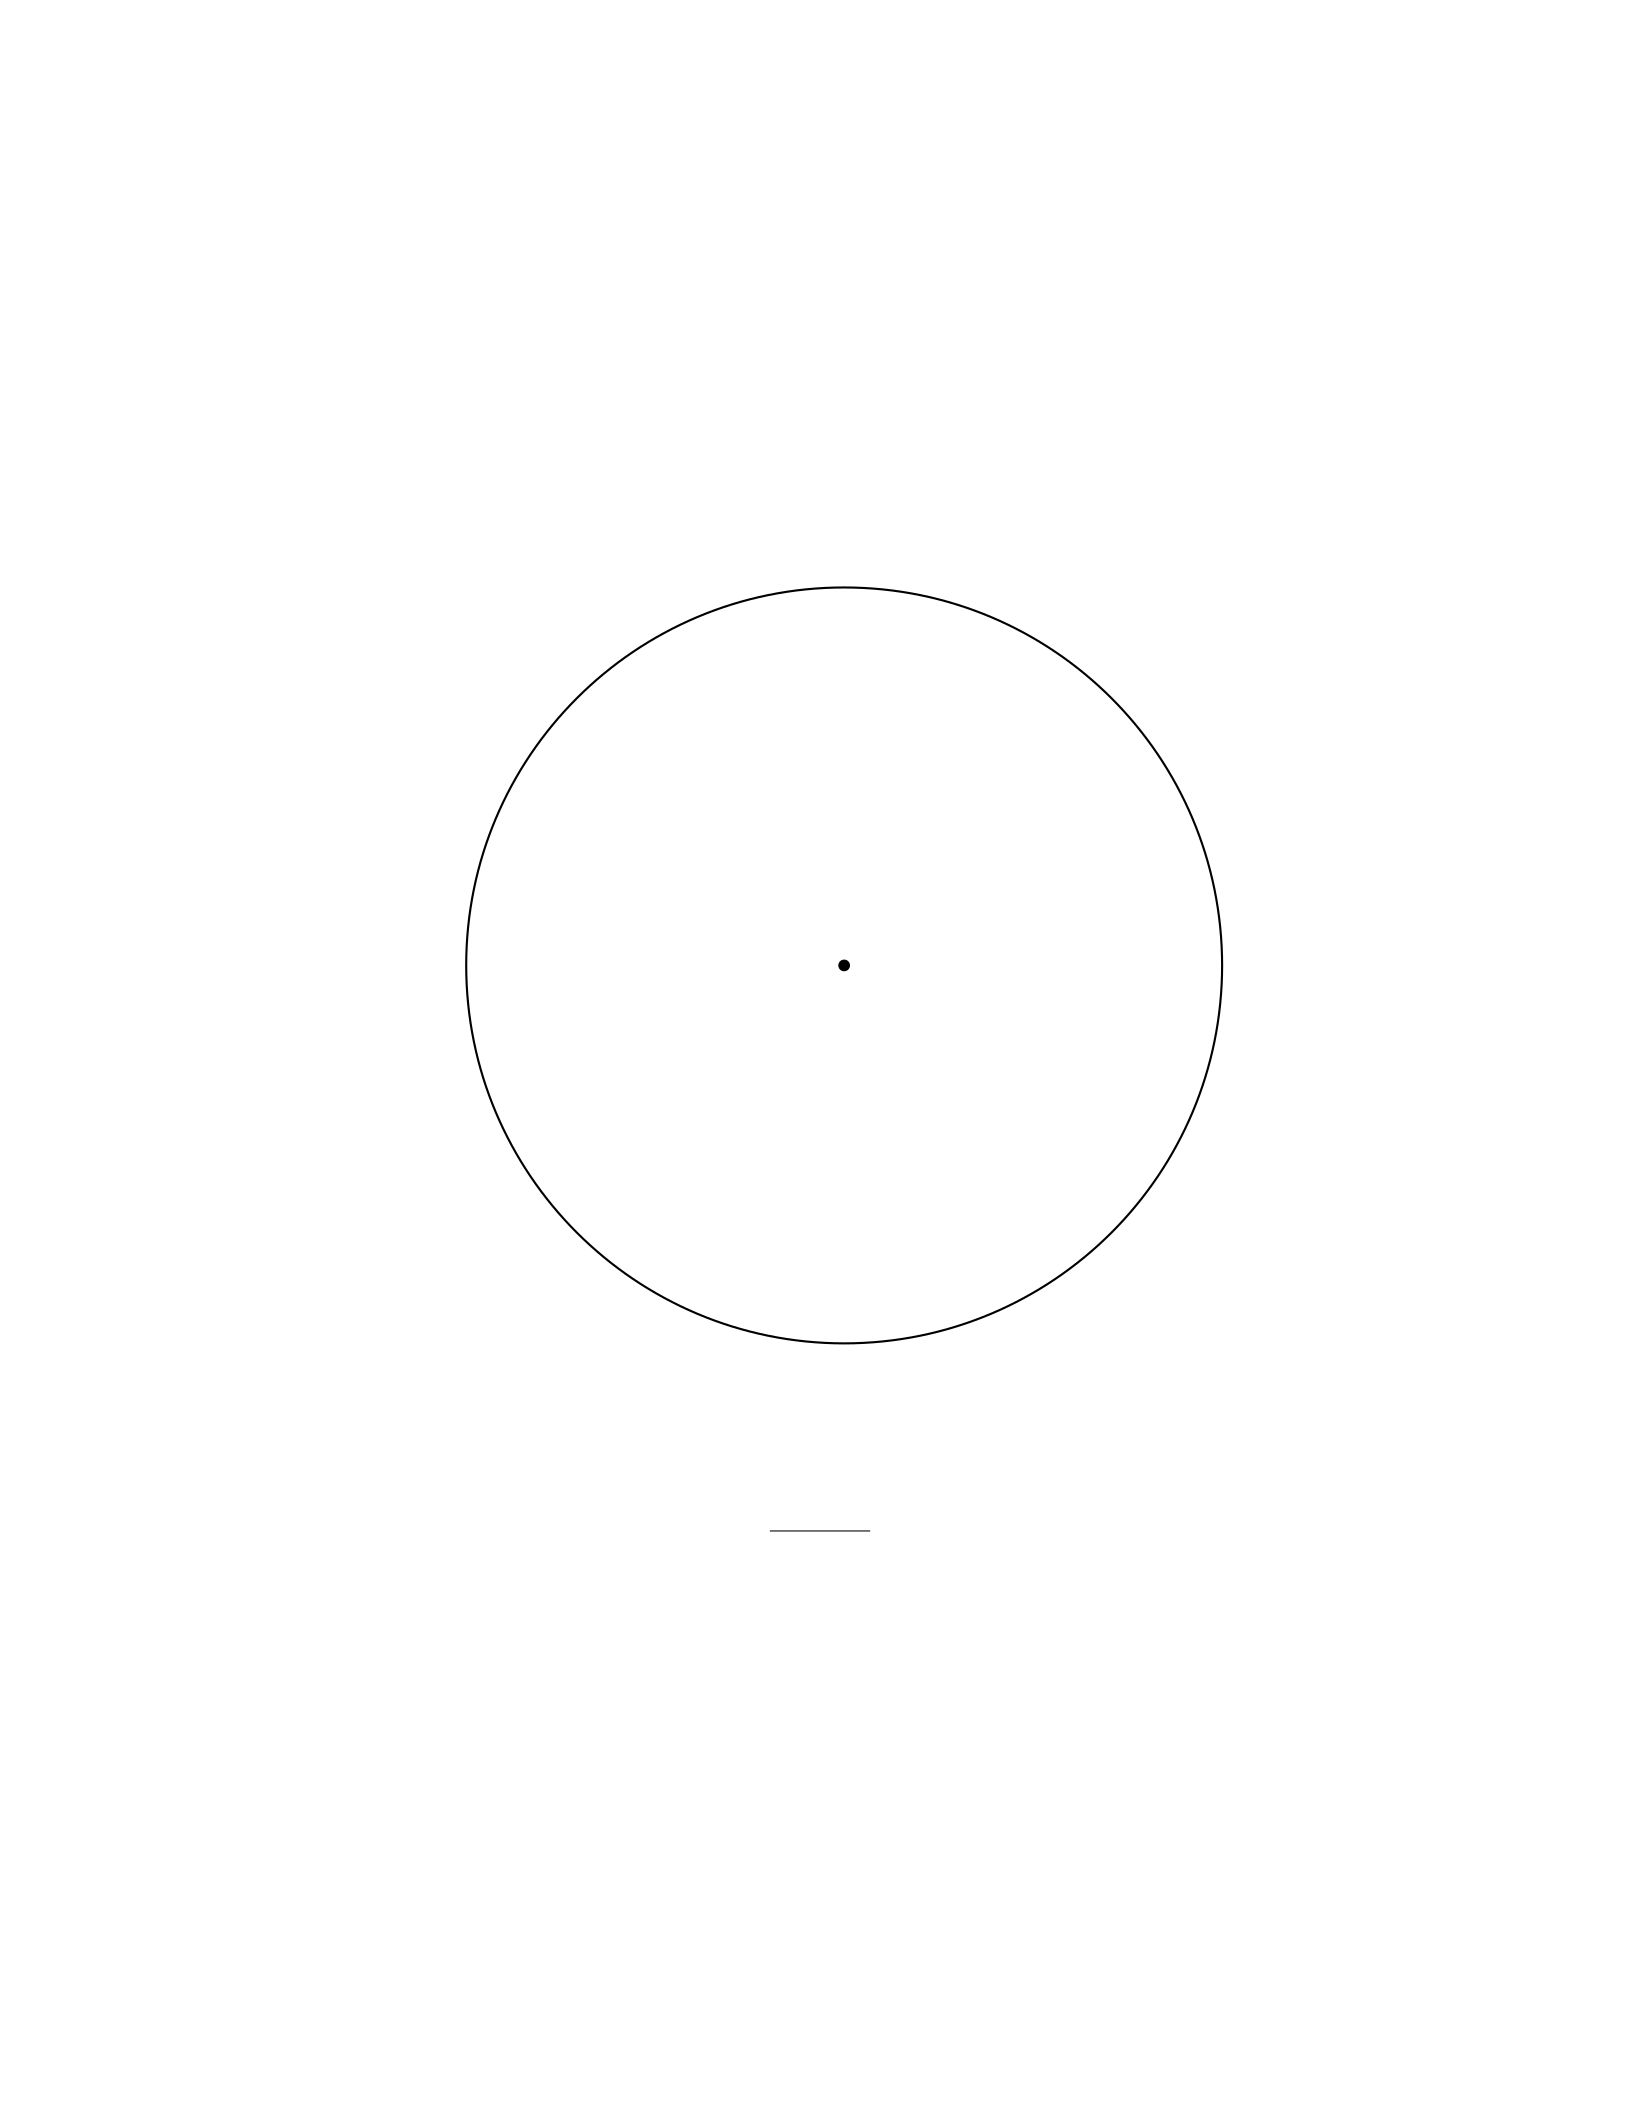
1. To plot the circle, we first rewrite the equation in standard form:
(x+ 3)2+ (y−2)2= 25
This is the equation of a circle with center (−3,2) and radius 5. The circle is
shown below:
xy (1,2)
2. The center of the circle is located at (−3,2) and the radius is 5.
3. To find the equation of the tangent line at (1,2), we first find the slope
of the radius connecting the center (−3,2) to (1,2):
m=2−2
1−(−3) = 0
Since the radius is horizontal, the slope of the tangent line will be vertical.
Hence, the equation of the tangent line passing through (1,2) is x= 1.
7

Question 9
Question
Consider the following parametric equations:
x(t) = 2 cos(t)
y(t) = 3 sin(t)
Plot the curve represented by these parametric equations and analyze its
geometric shape.
Solution
1. To plot the curve represented by the parametric equations x(t) = 2 cos(t)
and y(t) = 3 sin(t), we need to parameterize the curve by letting tvary over
a desired interval. Let’s choose tto vary from 0 to 2πto complete one full
revolution.
2. Now, we can plot the curve by plugging different values of tinto the
parametric equations and plotting the corresponding points. Let’s plot some
key points for t= 0,π
4,π
2,3π
4, π, ..., 2π.
3. The curve traced by these parametric equations is an ellipse. To see
this, note that x2
a2+y2
b2= 1 is the equation of an ellipse, where aand bare the
semi-major and semi-minor axes, respectively. In this case, a= 2 and b= 3, so
the equation becomes x2
4+y2
9= 1.
4. The semi-major axis of the ellipse is 3 units in the y-direction and the
semi-minor axis is 2 units in the x-direction. The center of the ellipse is at the
origin (0,0).
5. The ellipse is symmetric about both the x-axis and the y-axis. It reaches
the maximum and minimum points at (2,0) and (−2,0) along the x-axis, and
at (0,3) and (0,−3) along the y-axis.
Therefore, the geometric shape represented by the parametric equations
x(t) = 2 cos(t) and y(t) = 3 sin(t) is an ellipse centered at the origin with
semi-major axis 3 and semi-minor axis 2.
Question 10
Question
Consider the following geometric shape in the Cartesian plane: a circle with
center at (-2, 3) and radius 5, and a line passing through the points (1, 4) and
(-5, 1). Find the points of intersection, if any, between the circle and the line.
8
Solution
Step 1: Find the equation of the line passing through the points (1, 4) and (-5,
1). The slope of the line can be found using the formula:
m=y2−y1
x2−x1
=1−4
−5−1=−3
−6=1
2
So, the equation of the line is:
y−y1=m(x−x1)
y−4 = 1
2(x−1)
y=1
2x+7
2
Step 2: Find the coordinates of the points of intersection between the line
and the circle. Substitute y=1
2x+7
2into the equation of the circle (x+ 2)2+
(y−3)2= 25:
(x+ 2)2+1
2x+7
2−32
= 25
(x+ 2)2+1
2x+1
22
= 25
x2+ 4x+4+1
4x2+x+1
4= 25
17
4x2+ 5x−21 = 0
Step 3: Solve the quadratic equation to find the x-coordinates of the points
of intersection. The solutions to the quadratic equation 17
4x2+ 5x−21 = 0 are:
x=−5±q52−4·17
4· −21
2·17
4
Step 4: Calculate the y-coordinates corresponding to the x-coordinates found
in step 3. Substitute the x-coordinates found in step 3 back into the equation
of the line to find the corresponding y-coordinates.
Therefore, the points of intersection between the circle and the line are the
pairs of coordinates obtained from step 3 and step 4.
Question 11
Question
Consider the quadratic equation y=x2+4x+3. Plot and analyze the geometric
shape represented by this equation.
9

Solution
Step 1: Find the vertex of the parabola. To find the vertex of the parabola
represented by the quadratic equation, we first need to rewrite the equation in
vertex form. Completing the square gives us:
y= (x+ 2)2−1
Step 2: Determine the vertex and axis of symmetry. Comparing the
equation y= (x+ 2)2−1 with the standard form of a parabola y= (x−h)2+k,
we see that the vertex is at (−2,−1). The axis of symmetry is the vertical line
passing through the vertex, in this case, x=−2.
Step 3: Find the x-intercepts. To find the x-intercepts, we set y= 0 in
the equation (x+ 2)2−1 = 0 and solve for x. This gives us x=−1 and x=−3
as the x-intercepts.
Step 4: Determine the direction of opening. Since the coefficient of
x2is positive, the parabola opens upwards.
Step 5: Plot the graph. Now that we have the vertex, axis of symmetry,
x-intercepts, and direction of opening, we can plot the graph of the parabola.
Step 6: Analyze the geometric shape. The graph of the quadratic
equation y=x2+ 4x+ 3 is a parabola that opens upwards with vertex at (-2,
-1) and x-intercepts at (-3, 0) and (-1, 0). The axis of symmetry is the line
x=−2.
Question 12
Question
Plot the curve given by the parametric equations
x= sin(t), y = sin(2t)
for −2π≤t≤2π. Analyze the geometric shape of the curve.
Solution
Step 1: To plot the curve, we will first create a table of values by choosing
various values of tand computing the corresponding values of xand y.
t x = sin(t)y= sin(2t)
−3π
2−1 0
−π0 0
−π
2−1 0
0 0 0
π
21 0
π0 0
3π
2−1 0
2π0 0
10

Step 2: Next, we plot the points obtained from the table of values and
connect them to observe the curve.
Step 3: The geometric shape of the curve is a straight line passing through
the origin. This can be determined from the fact that y= 0 for all values of t,
indicating that the curve lies along the x-axis. The values of xoscillate between
-1 and 1, which shows that the curve oscillates between -1 and 1 on the x-axis.
Therefore, the curve represented by the parametric equations x= sin(t) and
y= sin(2t) for −2π≤t≤2πis a line passing through the origin.
Question 13
Question
Consider the following geometric shapes defined by the equations:
1. x2+y2= 4
2. y =x2
3. y =|x|
Plot each of these shapes on the same set of axes and analyze their intersec-
tions and relationships geometrically.
Solution
1. The equation x2+y2= 4 represents a circle with radius 2 centered at the
origin.
2. The equation y=x2represents a parabola opening upwards, symmetric
about the y-axis, and passing through the origin.
3. The equation y=|x|represents the absolute value function, which is
V-shaped and symmetric about the y-axis.
Now, we will plot these shapes on the same set of axes to analyze their
intersections and relationships.
Question 14
Question
Consider the following three points in R3:A(1,2,−3), B(4,1,−2), and C(−2,3,0).
Determine whether these points lie on a straight line, lie on a plane, or are not
collinear.
Solution
To determine whether the three points lie on a straight line, lie on a plane, or
are not collinear, we can check if the vectors −−→
AB and −→
AC are linearly dependent.
11

If they are linearly dependent, the points lie on a plane. If they are not linearly
dependent, we can further check if −−→
AB and −→
AC are parallel. If they are parallel,
the points lie on a straight line; otherwise, they are not collinear.
Step 1: Calculate −−→
AB and −→
AC The vector −−→
AB is given by:
−−→
AB =
4−1
1−2
−2−(−3)
=
3
−1
1
The vector −→
AC is given by:
−→
AC =
−2−1
3−2
0−(−3)
=
−3
1
3
Step 2: Check if −−→
AB and −→
AC are linearly dependent To check if −−→
AB
and −→
AC are linearly dependent, we can construct a matrix with these vectors
as its columns and find its determinant. The vectors are linearly dependent if
and only if the determinant is zero.
det
3−3
−1 1
1 3
= 3(1) −(−3)(−1) = 3 + 3 = 6 = 0
Since the determinant is non-zero, −−→
AB and −→
AC are not linearly dependent.
Step 3: Check if −−→
AB and −→
AC are parallel Two vectors are parallel if
one is a scalar multiple of the other. We can check if −−→
AB is a scalar multiple of
−→
AC.
Comparing the components of the vectors, we can see that they are not
scalar multiples of each other since there is no scalar ksuch that:
3
−3=−1
1=1
3=k
Therefore, the points A,B, and Care not collinear.
Question 15
Question
Consider the two-dimensional region bounded by the curve x2−4x+y2−4y= 0.
Plot and analyze this geometric shape in terms of its symmetry, intercepts, and
orientation.
12

Solution
To analyze the geometric shape defined by the equation x2−4x+y2−4y= 0,
we will complete the square for both xand yterms to express the equation in
standard form.
Step 1: Completing the square for xterm:
x2−4x=−(x2−4x+ 4) + 4 = −((x−2)2−4) + 4 = 4 −(x−2)2
Step 2: Completing the square for yterm:
y2−4y=−(y2−4y+ 4) + 4 = −((y−2)2−4) + 4 = 4 −(y−2)2
Therefore, the equation can be rewritten as:
4−(x−2)2+ 4 −(y−2)2= 0
8−(x−2)2−(y−2)2= 0
This equation represents a circle centered at (2,2) with radius √8.
To further analyze this geometric shape: - The circle is symmetric with
respect to the line x= 2 and the line y= 2. - Intercepts: Since the circle is
centered at (2,2) and its radius is √8, it intersects the x-axis at (2 −√8,0) and
(2 + √8,0), and the y-axis at (0,2−√8) and (0,2 + √8). - Orientation: The
circle lies in the first and third quadrants since both the xand ycoordinates
are positive or both are negative.
Therefore, the geometric shape defined by the equation x2−4x+y2−4y= 0
is a circle centered at (2,2) with radius √8.
Question 16
Question
Consider the following parametric equations for a curve in the xy-plane:
(x(t) = 3 sin(t)
y(t) = 2 cos(t)
Determine the shape of the curve and find the points where the curve intersects
the x-axis.
Solution
Step 1: To determine the shape of the curve, we can eliminate the parameter t
by expressing xin terms of y:
x= 3 sin(t) =⇒t= arcsin x
3
13

Substitute this into the equation y= 2 cos(t) to get yin terms of x:
y= 2 cos arcsin x
3
Step 2: Using the trigonometric identity cos(arcsin(u)) = √1−u2, the equa-
tion simplifies to:
y= 2r1−x
32= 2r1−x2
9= 2r9−x2
9=2√9−x2
3
Step 3: The simplified equation of the curve is y=2√9−x2
3, which represents
the upper half of an ellipse centered at the origin with major axis of length 6
along the x-axis and minor axis of length 4 along the y-axis.
Step 4: To find the points where the curve intersects the x-axis, we set y= 0:
0 = 2√9−x2
3=⇒p9−x2= 0 =⇒x=±3
Thus, the curve intersects the x-axis at the points (−3,0) and (3,0).
Question 17
Question
Consider the following 3D geometric shape represented by the equation:
x2+y2−z2= 1
Plot and analyze this shape, including determining its type and properties.
Solution
Step 1: To analyze the given 3D geometric shape, we first note that it resembles
a hyperboloid of one sheet. In order to verify this, we rewrite the equation in
the standard form for a hyperboloid of one sheet:
x2
1+y2
1−z2
1= 1
Step 2: By comparing the given equation with the standard form, we see
that the given shape is indeed a hyperboloid of one sheet with semi-major axis
of length 1 in the x and y directions, and semi-minor axis of length 1 in the z
direction.
Step 3: The shape opens along the z-axis, and the hyperboloid of one sheet is
symmetric about the z-axis. This shape has no intersections with the xy-plane
but extends infinitely in the z-direction.
Step 4: By plotting this hyperboloid of one sheet, we can visually confirm
its shape and properties.
14

Question 18
Question
Consider the region bounded by the curves y=x3and y= 8 −x2in the first
quadrant. Determine the area of the region enclosed by these curves.
Solution
To find the area enclosed by the curves y=x3and y= 8 −x2in the first
quadrant, we first need to find the points where the two curves intersect.
Step 1: Find the intersection points.
Setting the two equations equal to each other:
x3= 8 −x2
Solving for x:
x3+x2−8 = 0
This equation can be factored as:
(x−1)(x2+x+ 8) = 0
The quadratic factor does not have real roots, so the only real intersection
point is x= 1.
Step 2: Determine the area enclosed by the curves.
The area enclosed by the curves can be found by integrating the difference
of the curves from 0 to 1.
Area = Z1
0
((8 −x2)−x3)dx
=Z1
0
(8 −x2−x3)dx
=8x−x3
3−x4
41
0
=8−1
3−1
4−(0 −0−0)
=83
12
Therefore, the area of the region enclosed by the curves y=x3and y= 8−x2
in the first quadrant is 83
12 .
15

Question 19
Question
Consider the following geometric shape: a circle with center at point A(2,3)
and passing through the point B(−1,2). Determine the equation of the circle
and analyze its properties such as radius, area, and circumference.
Solution
Step 1: Find the radius of the circle using the distance formula. Step 2: Write
the equation of the circle in standard form. Step 3: Determine the area and
circumference of the circle.
Step 1: The radius rof the circle can be found using the distance formula:
r=p(x2−x1)2+ (y2−y1)2. We have A(2,3) and B(−1,2), so the radius is:
r=p(−1−2)2+ (2 −3)2=√32+ 12=√10.
Step 2: The equation of a circle with center (h, k) and radius ris given
by (x−h)2+ (y−k)2=r2. Substitute h= 2, k= 3, and r=√10 into the
equation: (x−2)2+ (y−3)2= 10.
Step 3: From the equation (x−2)2+ (y−3)2= 10, we can determine
the properties of the circle: Radius: √10 Area: A=πr2=π(√10)2= 10π
Circumference: C= 2πr = 2π√10
Question 20
Question
Consider the circle Cwith equation x2+y2= 25. Let Pbe a point on Cwhose
x-coordinate is 3.
(a) Find the y-coordinates of the points Pand Qon Cwhere the tangent
lines to Cat Pand Qare perpendicular to each other.
(b) Find the area of the region enclosed by Cand the two tangent lines.
Solution
(a) Step 1: Let P(3, y) be a point on C. Substituting x= 3 into the equation of
the circle gives 32+y2= 25. Solving for y, we get y2= 16 and y=±4. Thus,
the y-coordinates of Pare y= 4 and y=−4.
Step 2: To find the point Qon C, we need to find the equation of the tangent
line at P(3,4). The equation of the tangent line at a point (a, b) on a circle with
equation x2+y2=r2is given by y−b=−a
b(x−a). Substituting a= 3 and
b= 4, we get y−4 = −3
4(x−3).
Step 3: To find the slope of the tangent line at P(3,4), we differentiate the
equation of the circle x2+y2= 25 implicitly with respect to x. We get dy
dx =−x
y.
Substituting x= 3 and y= 4, we get the slope of the tangent at Pas −3
4. Since
16

the slopes of perpendicular lines are negative reciprocals of each other, the slope
of the tangent at Qis 4
3.
Step 4: Using the slope and the point P(3,−4), we can find the equation of
the tangent line at Q. So the equation of the tangent at Qis y+ 4 = 4
3(x−3).
Therefore, the points Pand Qon Care (3,4) and (3,−4), respectively.
(b) Step 1: To find the area enclosed by Cand the two tangent lines, we
first note that the two tangent lines and the radius from the center of the circle
form an isosceles triangle.
Step 2: The base of the isosceles triangle is 2×3 = 6 units (since the distance
between the points Pand Qis the base). The height of the triangle can be found
by dropping a perpendicular from the center of the circle to the base which is
r−rcos(θ) = 25 −25 cos(arctan(4/3)).
Step 3: The area of the triangle is 1
2×6×(r−rcos(θ)).
Step 4: Substituting the values, the area of the region enclosed by the circle
and the two tangent lines is 1
2×6×(25 −25 cos(arctan(4/3))). Calculating this
expression will give the final answer.
Question 21
Question
Consider the following collection of geometric shapes:
- A circle with center (2,2) and radius 4. - A parabola y=x2−4x+ 3. - A
square with vertices at (0,0), (4,0), (4,4), and (0,4).
Plot these shapes on the same set of axes and find the points of intersection,
if any. Then, analyze the geometric relationships among the shapes.
Solution
Step 1: Plot the circle, parabola, and square on the same set of axes.
Step 2: Circle with center (2,2) and radius 4: The equation of a circle with
center (h, k) and radius ris given by (x−h)2+ (y−k)2=r2. For this circle,
the equation is (x−2)2+ (y−2)2= 16.
Step 3: Parabola y=x2−4x+ 3: Plot the parabola y=x2−4x+ 3.
Step 4: Square with vertices at (0,0), (4,0), (4,4), and (0,4): Draw the
square with these vertices.
Step 5: Find the points of intersection, if any: To find the points of inter-
section, solve the equations of the circle and parabola or square simultaneously.
Step 6: Analyze the geometric relationships among the shapes: - The circle
and parabola intersect at most 2 points. - The square may intersect the circle
or the parabola at multiple points, depending on their relative positions.
Thus, by plotting the shapes on the same set of axes and analyzing their
intersection points, we can understand the geometric relationships among the
circle, parabola, and square.
17

Question 22
Question
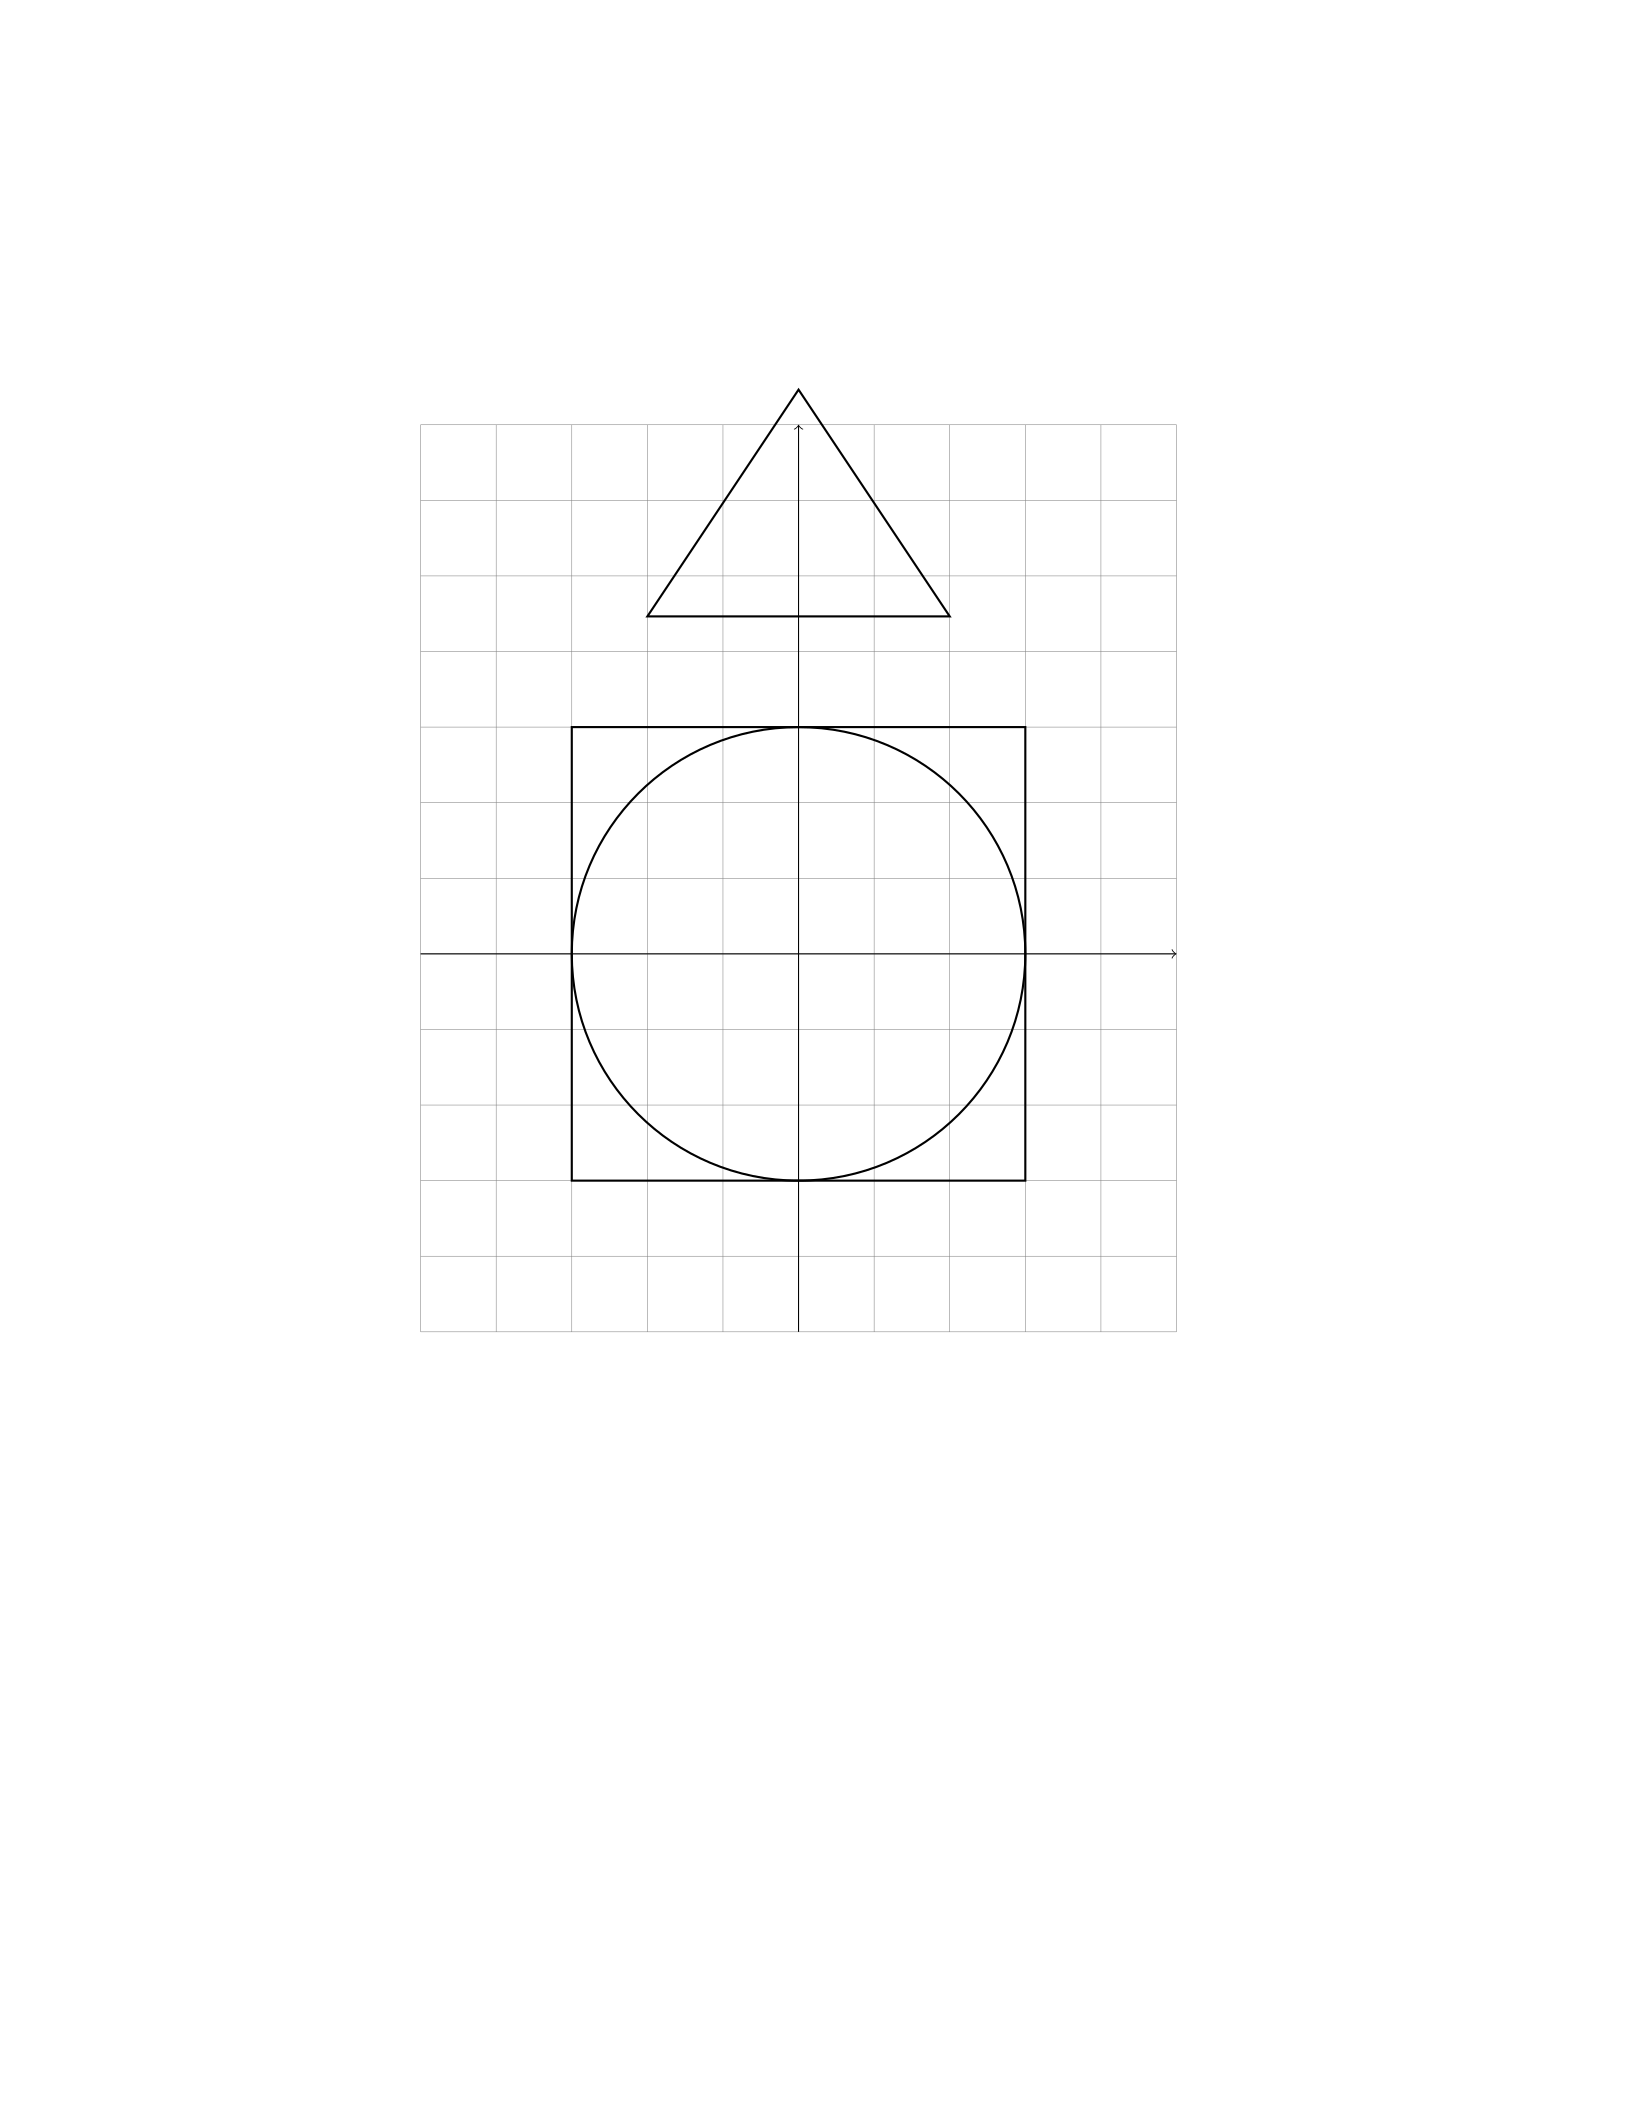
Consider the following geometric shapes: a circle with radius 3 centered at the
origin, a square with side length 6 whose bottom-left corner is located at (-3,
-3), and an equilateral triangle with side length 4 centered at the point (0, 43).
Plot these shapes on the same set of axes and analyze their intersections and
relationships.
Solution
To plot the given geometric shapes, we first need to determine the equations
defining each shape.
1. The equation of a circle centered at the origin with radius 3 is given by
x2+y2= 32or x2+y2= 9.
2. The equation of a square with side length 6, with its bottom-left corner
located at (-3, -3), can be written as follows: The square has vertices at (-3, -3),
(3, -3), (3, 3), and (-3, 3). So, we can represent the square using the following
set of inequalities: −3≤x≤3 and −3≤y≤3.
3. An equilateral triangle with side length 4 centered at the point (0, 4√3)
has vertices that are √3 units up and down from the center along the y-axis,
and 2 units to the left and right along the x-axis. Thus, the vertices of the
equilateral triangle are located at (-2, 4√3), (0, 4√3), and (2, 4√3).
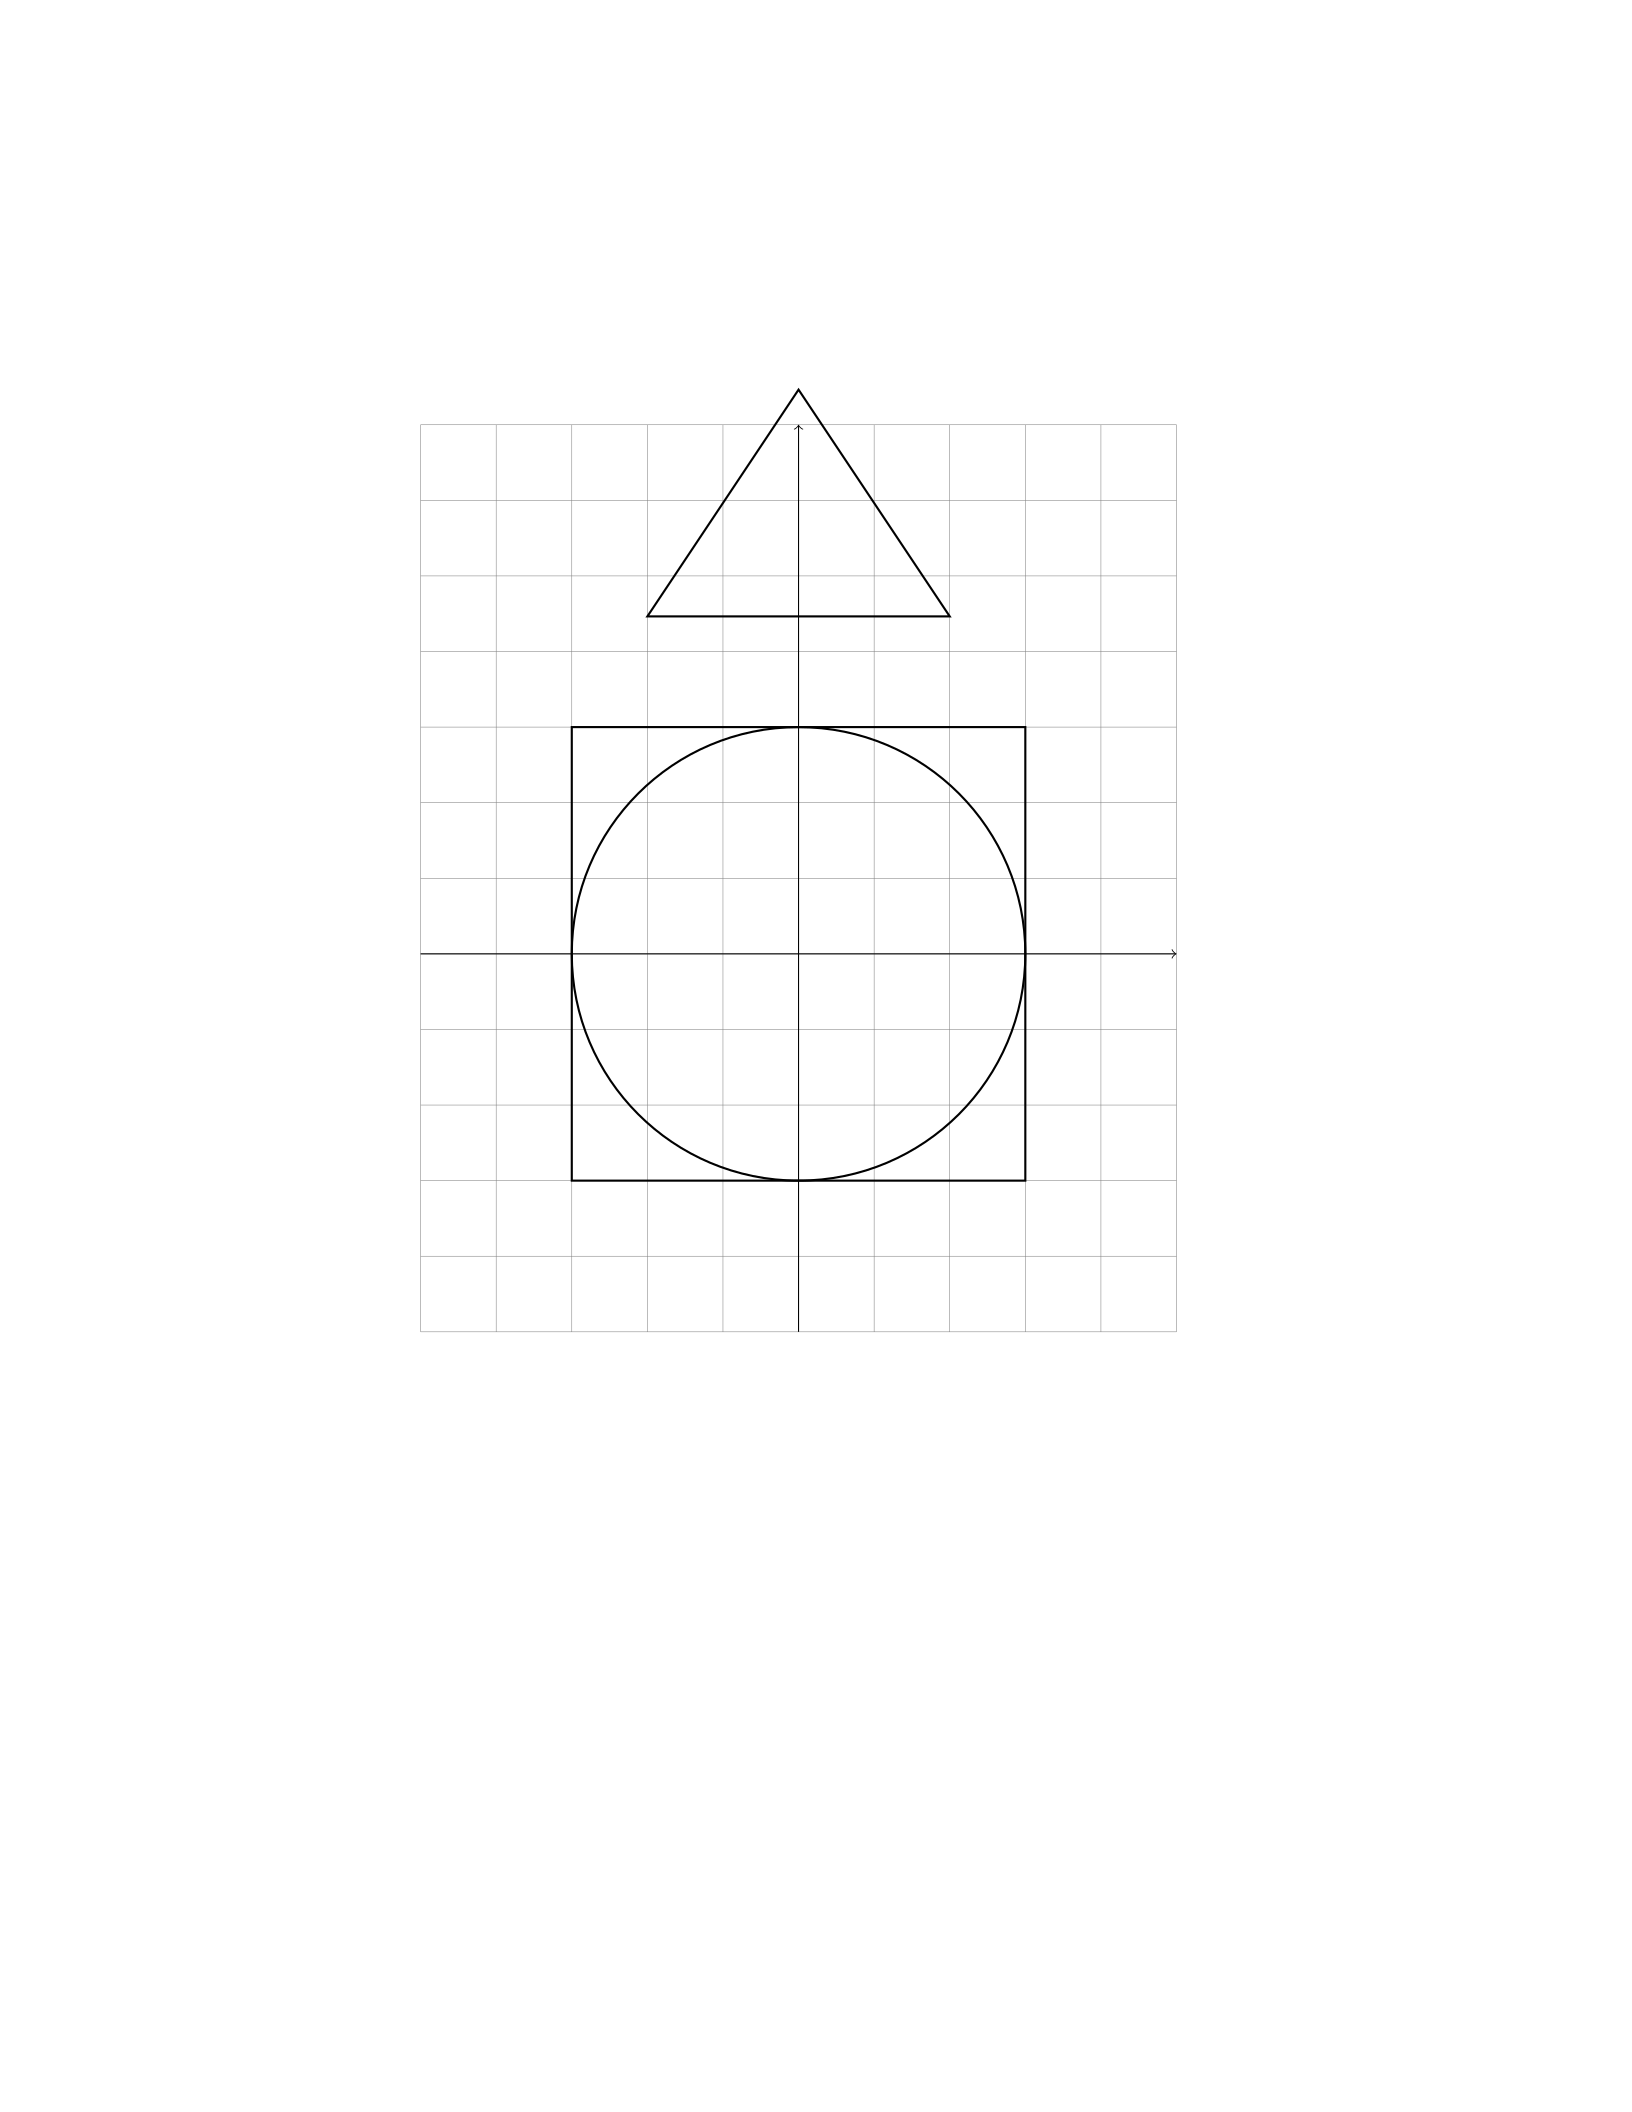
Now, let’s plot these geometric shapes on the same set of axes:
18
x
y
From the plot, we can see that: - The circle intersects the square at four
points. - The equilateral triangle intersects the circle at three points. - The
equilateral triangle does not intersect the square. - The circle and square have
points of tangency.
Therefore, the circle, square, and equilateral triangle have various intersec-
tions and relationships on the same set of axes.
Question 23
Question
Consider the region in the first quadrant bounded by the curves y=x2and
y=x4. Determine the area of the region enclosed by these curves.
19
Solution
Step 1: First, we need to find the points of intersection of the curves y=x2
and y=x4. Setting x2=x4, we have:
x4−x2= 0
x2(x2−1) = 0
This gives us x= 0 and x= 1 as the points of intersection.
Step 2: Next, we find the area enclosed by the curves by integrating the
difference of the curves with respect to xfrom x= 0 to x= 1. The area Ais
given by:
A=Z1
0
(x4−x2)dx
Step 3: Now, we integrate the expression:
A=Z1
0
(x4−x2)dx =1
5x5−1
3x31
0
A=1
5·15−1
3·13−1
5·05−1
3·03
A=1
5−1
3
A=3−5
15
A=−2
15
Thus, the area of the region enclosed by the curves y=x2and y=x4in
the first quadrant is −2
15 .
Question 24
Question
Let A(−2,1), B(3,4), C(5,−1) be three points in the plane. Find the equation
of the circle passing through A,B, and C.
20

Solution
To find the equation of the circle passing through points A(−2,1), B(3,4), and
C(5,−1), we can use the fact that the perpendicular bisectors of the chords of
the circle pass through the center of the circle.
Step 1: Find the equations of the perpendicular bisectors of the
chords containing points Aand B
The midpoint of the line segment joining points Aand Bis the center of
the circle. Let MAB be the midpoint of AB, then MAB =Ax+Bx
2,Ay+By
2
MAB =−2+3
2,1+4
2MAB = (0.5,2.5)
The slope of the line passing through Aand Bis given by mAB =4−1
3−(−2)
mAB =3
5
Therefore, the slope of the perpendicular bisector of AB is −5
3. Using the
point-slope form, we have y−2.5 = −5
3(x−0.5) 3y−7.5 = −5x+2.5 5x+3y= 10
5x+ 3y−10 = 0
Step 2: Find the equations of the perpendicular bisectors of the
chords containing points Band C
Proceeding in a similar manner as in Step 1, the equation of the perpendic-
ular bisector of BC is 7x−10y=−19
Step 3: Solve the system of equations
Solving the system of equations 5x+3y−10 = 0 and 7x−10y=−19 will give
us the center of the circle, which is the point of intersection of the perpendicular
bisectors.
Solving the system, we get x=−155
59 and y=−20
59 . Hence, the center of the
circle is O−155
59 ,−20
59 .
Step 4: Find the radius of the circle
The radius of the circle is the distance between the center Oand any of the
points A,B, or C. Let’s use Ato calculate the radius. r=q−2 + 155
59 2+1 + 20
59 2
r=q302
59
Step 5: Write the equation of the circle
The equation of a circle with center (h, k) and radius ris (x−h)2+(y−k)2=
r2. Substitute h=−155
59 ,k=−20
59 , and r=q302
59 to get the equation of the
circle passing through points A,B, and C:x+155
59 2+y+20
59 2=302
59
Question 25
Question
Consider the following parametric equations for a curve in R2:
x(t) = cos(t)−2 cos(2t), y(t) = sin(t)−2 sin(2t)
Plot the curve represented by the parametric equations and analyze its shape.
21
Solution
To plot the curve represented by the parametric equations x(t) = cos(t)−
2 cos(2t) and y(t) = sin(t)−2 sin(2t), we will first generate points by evaluating
x(t) and y(t) for various values of t. Then, we will plot these points in the
xy-plane.
Step 1: Generate points for plotting Let’s consider the values of tfrom
0 to 2πwith small increments.
t x(t) = cos(t)−2 cos(2t)y(t) = sin(t)−2 sin(2t)
0 1 0
π/4−1−1
π/2−1 0
3π/4−1 1
π1 0
5π/4 3 −1
3π/2 3 0
7π/4 3 1
2π1 0
Step 2: Plot the points and analyze the curve Plotting the generated
points, we observe that the curve traced out by the parametric equations is
an ellipse with major axis along the x-axis. The curve is symmetric about the
x-axis and y-axis.
Therefore, the curve represented by the parametric equations is an ellipse.
Question 26
Question
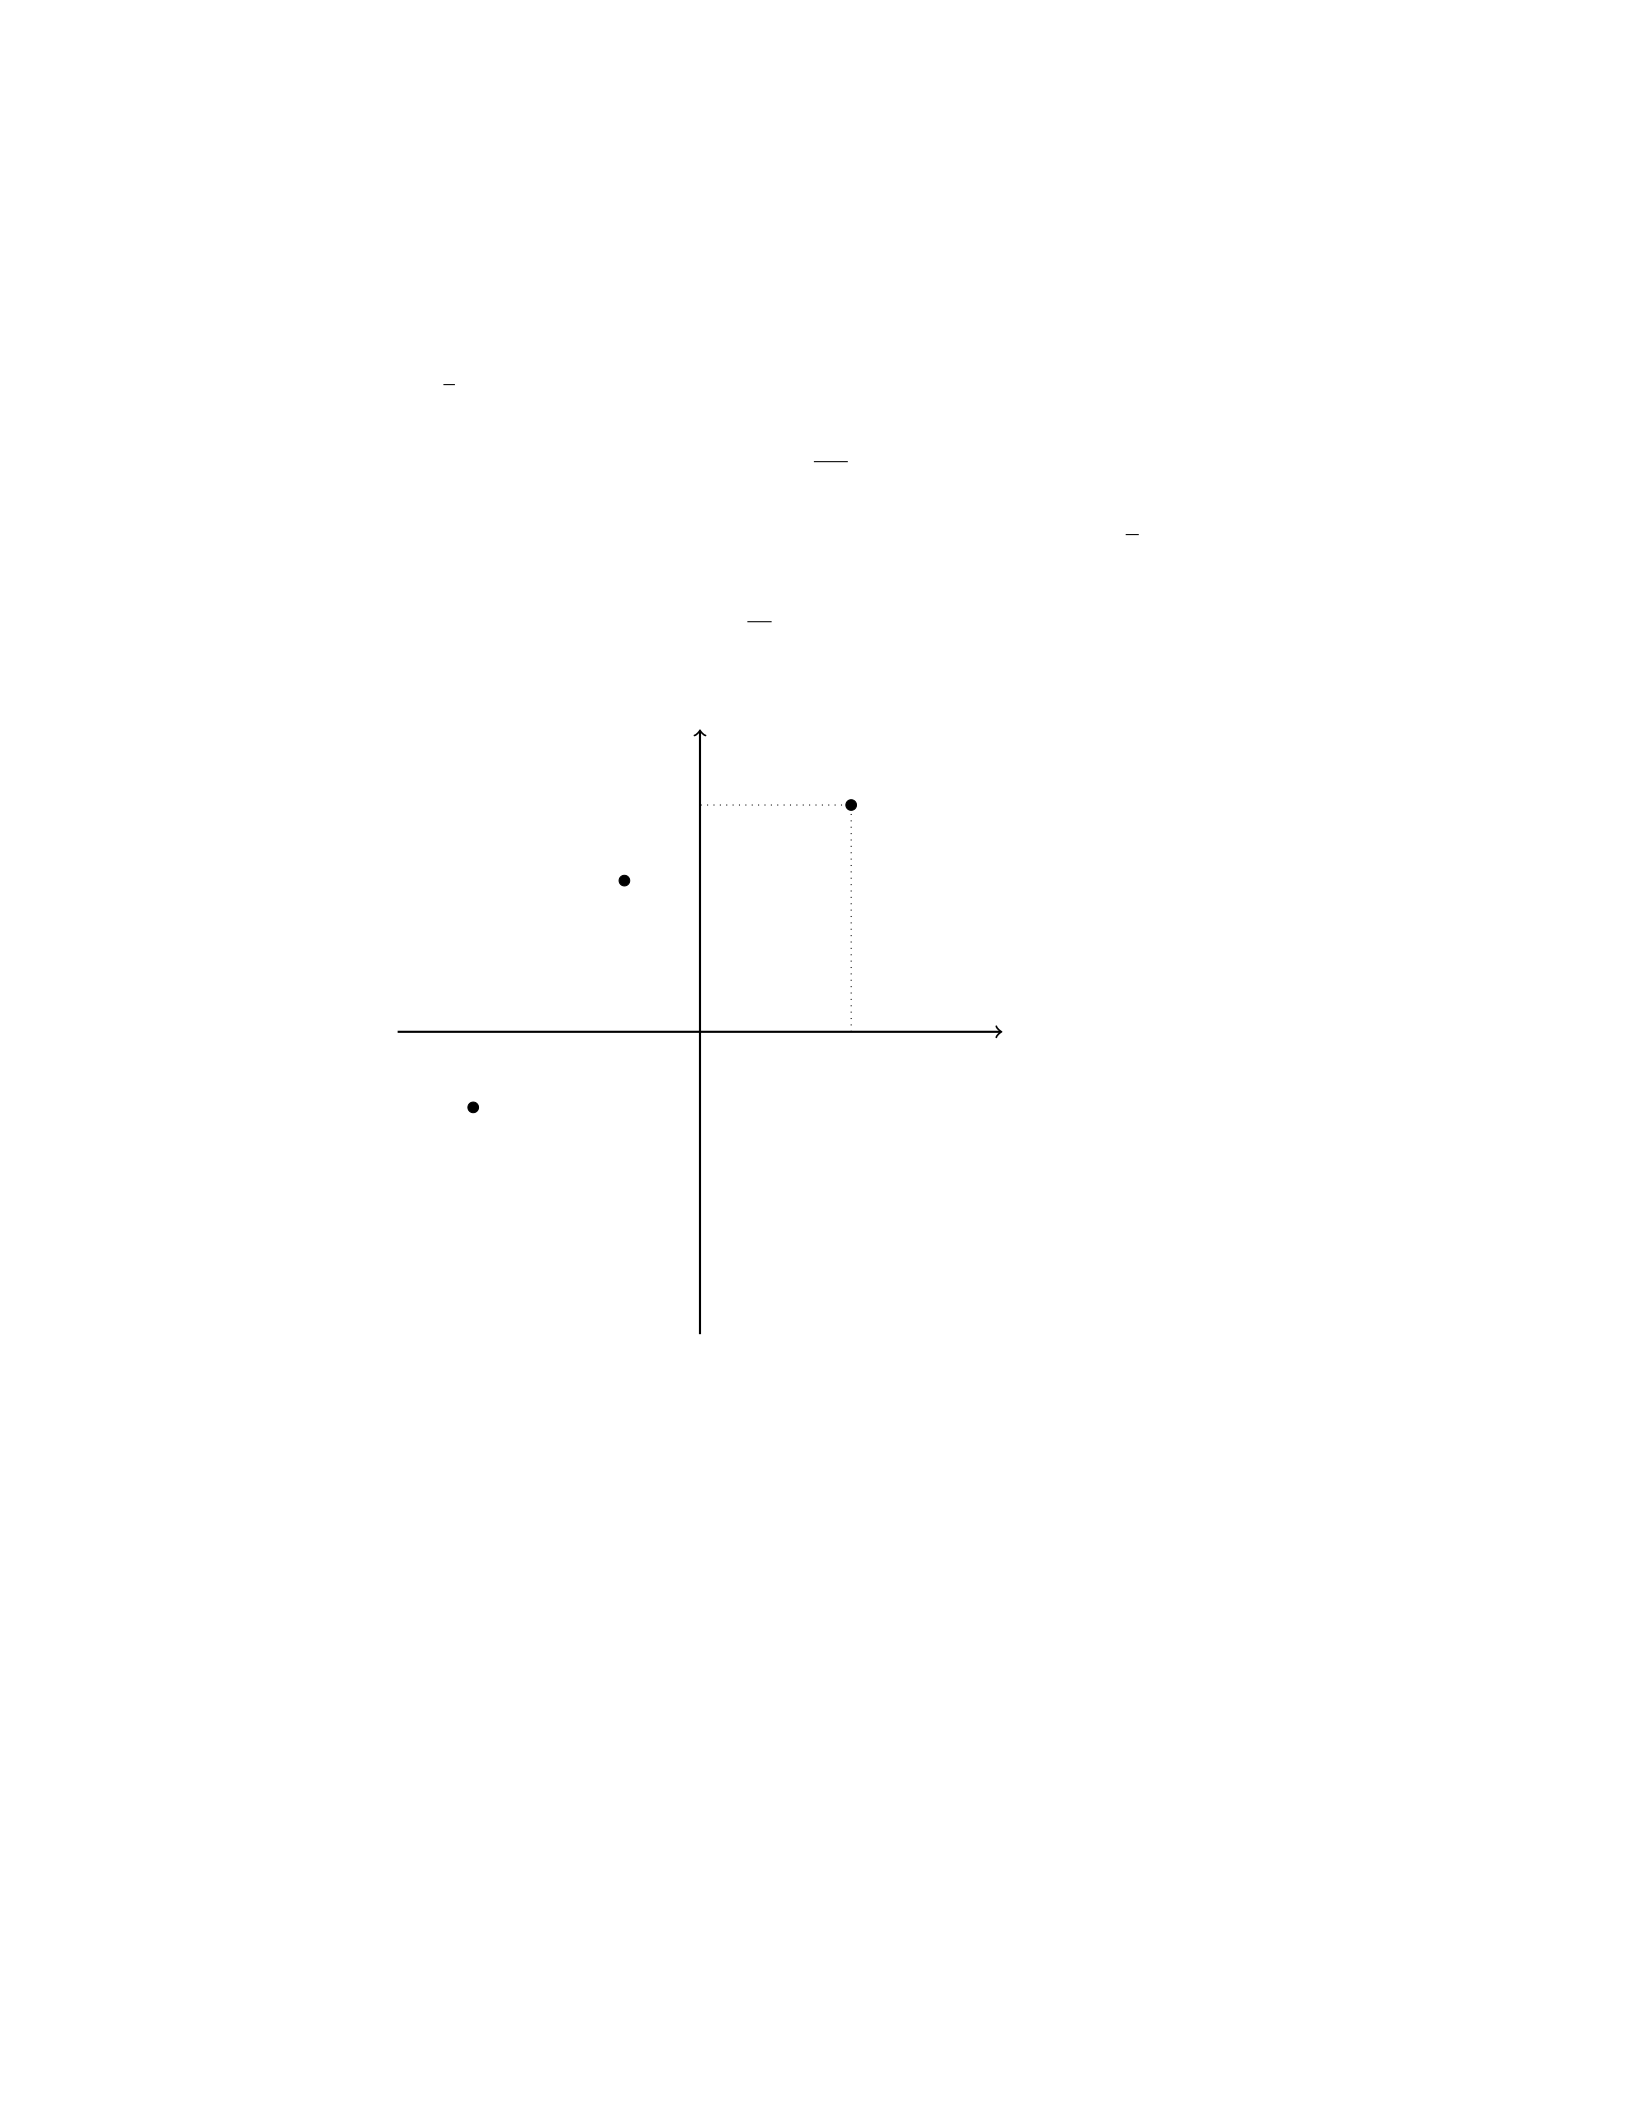
Consider the following complex numbers in the complex plane: z1= 2 + 3i,
z2=−1 + 2i,z3=−3−i. Plot these complex numbers in the complex plane
and find the following:
1. The modulus of z1.
2. The argument of z2.
3. The conjugate of z3.
Solution
1. To find the modulus of z1= 2 + 3i, we use the formula |z|=√a2+b2where
z=a+bi:
|z1|=p22+ 32=√13
22
2. To find the argument of z2=−1 + 2i, we use the formula arg(z) =
tan−1b
awhere z=a+bi:
arg(z2) = tan−12
−1= tan−1(−2)
Since −1 and 2 are in the second quadrant, the argument is −π
2.
3. The conjugate of z3=−3−iis found by changing the sign of the
imaginary part:
z3=−3 + i
Now, let’s plot these complex numbers in the complex plane.
Re
Im
z1
z2
z3
Question 27
Question
Consider the following parametric equations representing a curve in the xy-
plane:
x= 3 cos(t), y = 2 sin(t),0≤t≤2π
Plot and analyze the geometric shape produced by these equations.
23

Solution
Step 1: To plot the curve, we need to eliminate the parameter tfrom the
equations. We can do this by eliminating tfrom the equations for xand y:
x2= (3 cos(t))2= 9 cos2(t)
y2= (2 sin(t))2= 4 sin2(t)
Adding these two equations gives:
x2+y2= 9 cos2(t) + 4 sin2(t) = 9(cos2(t) + 4
9sin2(t)) = 9
This is the equation of an ellipse centered at the origin with semi-major axis of
length 3 along the x-axis and semi-minor axis of length 2 along the y-axis.
Step 2: Next, let’s find the eccentricity of this ellipse. The eccentricity eof
an ellipse is given by the formula:
e=r1−b2
a2
where aand bare the semi-major and semi-minor axes of the ellipse, respectively.
In this case, a= 3 and b= 2, so:
e=r1−22
32=r1−4
9=r5
9=√5
3
Therefore, the eccentricity of the ellipse is √5
3.
Step 3: Finally, let’s plot the ellipse with the given parametric equations.
Using a graphing tool, plot the curve by varying tfrom 0 to 2π. The resulting
plot should show an ellipse with center at the origin, semi-major axis length 3
along the x-axis and semi-minor axis length 2 along the y-axis.
Thus, the geometric shape produced by the parametric equations x= 3 cos(t)
and y= 2 sin(t) is an ellipse centered at the origin.
Question 28
Question
Consider the geometric shape defined by the equation x4+y4= 1.
(a) Plot the shape represented by the equation.
(b) Analyze the shape of the graph in terms of its symmetry, intersections
with the coordinate axes, and any other relevant features.
24

Solution
(a) To plot the shape represented by the equation x4+y4= 1, we can rewrite
the equation in terms of yas follows:
y=±4
p1−x4
Now, we can plot the shape by considering both positive and negative values
of ycorresponding to the same value of x.
(b) Now let’s analyze the graph: - Symmetry: The graph of x4+y4= 1 is
symmetric about the x-axis, y-axis, and the origin. This is because the equation
is symmetric in xand y. - Intersections with Coordinate Axes: - The shape
intersects the x-axis when y= 0, which implies x4= 1. So, x=±1. - The
shape intersects the y-axis when x= 0, which implies y4= 1. So, y=±1. -
Other Features: - The shape is bounded by the unit circle centered at the
origin due to the constraint x4+y4= 1. - The graph consists of four lobes
meeting at the coordinate axes. - The lobes become less steep as they approach
the axes and the origin.
Overall, the graph of x4+y4= 1 represents a symmetric four-lobed shape
bounded by the unit circle with intersections at (±1,0) and (0,±1).
Question 29
Question
Let Pbe a point in the xy-plane that is equidistant from the points A(−2,5)
and B(4,−3). Find the coordinates of point P.
Solution
Step 1: Calculate the distance between Pand A.
d(P A) = p(xP−xA)2+ (yP−yA)2
=p(x−(−2))2+ (y−5)2
=p(x+ 2)2+ (y−5)2
Step 2: Calculate the distance between Pand B.
d(P B) = p(xP−xB)2+ (yP−yB)2
=p(x−4)2+ (y+ 3)2
Step 3: Since Pis equidistant from Aand B, we have:
p(x+ 2)2+ (y−5)2=p(x−4)2+ (y+ 3)2
Step 4: Square both sides of the equation to eliminate the square roots.
(x+ 2)2+ (y−5)2= (x−4)2+ (y+ 3)2
25

Step 5: Expand both sides of the equation and simplify.
x2+ 4x+4+y2−10y+ 25 = x2−8x+ 16 + y2+ 6y+ 9
4x−8y+ 29 = −8x+ 6y+ 25
Step 6: Rearrange the equation to solve for yin terms of x.
4x+ 8x= 6y+ 8y+ 25 −29
12x= 14y−4
3x= 7y−1
y=3x+ 1
7
Therefore, the coordinates of point Pare of the form (x, 3x+1
7).
Question 30
Question
Consider the following parametric equations:
x(t) = 3 cos(t), y(t) = 2 sin(t).
Plot and analyze the geometric shape described by the parametric equations.
Solution
Step 1: Identify the Shape To determine the shape described by the para-
metric equations, we can eliminate the parameter tby expressing xand ysolely
in terms of each other. We have:
x(t) = 3 cos(t)⇒cos(t) = x
3⇒t= cos−1x
3,
y(t) = 2 sin(t)⇒sin(t) = y
2⇒t= sin−1y
2.
Therefore, the parametric equations can be written as:
x= 3 cos cos−1x
3= 3 x
3=x,
y= 2 sin sin−1y
2= 2 y
2=y.
Hence, the parametric equations describe the line y=x.
Step 2: Plotting the Line Plotting the line y=x, we can see that it is a
diagonal line passing through the origin with a slope of 1.
Therefore, the geometric shape described by the given parametric equations
is a straight line passing through the origin with a slope of 1.
26

Question 4
Question
Consider the following geometric shapes in the polar coordinate system:
-r= 3 cos(θ) - r= 2 + 4 sin(θ)
Plot each of the shapes and analyze their key features.
Solution
To plot these shapes, we will first convert the polar equations into parametric
equations in Cartesian coordinates. Then, we will plot them and analyze their
key features.
For shape 1 (r = 3cos(θ)): Step 1: Convert the polar equation into
parametric equations: x=rcos(θ) = (3 cos(θ)) cos(θ) = 3 cos2(θ)
y=rsin(θ) = (3 cos(θ)) sin(θ) = 3 cos(θ) sin(θ)
Step 2: Plot the shape: The shape is a cardioid with a loop.
For shape 2 (r = 2 + 4sin(θ)): Step 1: Convert the polar equation
into parametric equations: x=rcos(θ) = (2 + 4 sin(θ)) cos(θ) = 2 cos(θ) +
4 sin(θ) cos(θ)
y=rsin(θ) = (2 + 4 sin(θ)) sin(θ) = 2 sin(θ) + 4 sin2(θ)
Step 2: Plot the shape: The shape is a rose curve with 4 petals.
By analyzing the key features of these shapes, we can see that the first shape
is a cardioid with a single loop, while the second shape is a rose curve with 4
petals.
Question 5
Question
Consider the following parametric equations:
x(t) = sin(t) cos(t), y(t) = sin(t) sin(t), z(t) = cos(t),0≤t≤2π
Plot and analyze the geometric shape defined by these parametric equations.
Solution
To plot the geometric shape defined by the parametric equations, we can plot the
points (x(t), y(t), z(t)) for tin the interval [0,2π]. By examining the resulting
plot, we can analyze the shape of the curve.
Step 1: Plug in the given equations to find the coordinates of the points on
the curve:
x(t) = sin(t) cos(t), y(t) = sin(t) sin(t), z(t) = cos(t)
Step 2: Plot the curve by graphing the parametric equations for 0 ≤t≤2π.
4
Step 3: Analyze the plot to identify the geometric shape of the curve. Pay
attention to any symmetries, intersections, or other properties of the curve.
Step 4: Consider any additional analysis or calculations needed to fully
describe the geometric shape defined by the parametric equations.
Question 6
Question
Consider the region bounded by the curve y=px(4 −x) and the x-axis. Find
the area of the region enclosed by this curve.
Solution
Step 1: First, we need to find the x-coordinates of the points of intersection
between the curve y=px(4 −x) and the x-axis. To find these points, we set
y= 0 and solve for x.
0 = px(4 −x)
0 = x(4 −x)
0 = x2−4x
0 = x(x−4)
This implies x= 0 or x= 4.
Step 2: Next, we find the area enclosed by the curve y=px(4 −x) and the
x-axis by integrating the curve with respect to xfrom x= 0 to x= 4.
A=Z4
0px(4 −x)dx
Step 3: We can simplify the integrand by expressing it as x(4 −x)1/2.
A=Z4
0
x(4 −x)1/2dx
Step 4: To evaluate the integral, we use the power rule for integration.
A=2
3x(4 −x)3/2−4
5(4 −x)5/24
0
Step 5: Evaluating the integral at x= 4 and x= 0 gives us the area enclosed
by the curve.
A=2
3(4)(0)3/2−4
5(0)5/2−2
3(4)(0)3/2−4
5(4)5/2
Step 6: Simplifying further, we find that the area of the region enclosed by
the curve y=px(4 −x) and the x-axis is 32
3square units.
5

Question 7
Question
Consider the geometric shape represented by the equation x2+y2+z2−2x−
4y+ 2z−6 = 0. Determine the type of shape this equation represents in 3D
space, and describe its properties.
Solution
We start by completing the square to rewrite the equation in a standard form
that reveals the type of geometric shape it represents.
Step 1: Complete the square for x:
x2−2x= (x−1)2−1
Step 2: Complete the square for y:
y2−4y= (y−2)2−4
Step 3: Complete the square for z:
z2+ 2z= (z+ 1)2−1
Substitute into the original equation:
(x−1)2−1+(y−2)2−4+(z+ 1)2−1−6=0
(x−1)2+ (y−2)2+ (z+ 1)2−12 = 0
The equation represents a sphere in 3D space centered at the point (1, 2, -1)
with a radius √12. The properties of this sphere include: - Center at (1, 2, -1)
- Radius √12 - Surface area 4π(√12)2= 48π- Volume 4
3π(√12)3= 64π
Question 8
Question
Consider the equation of a circle given by x2+y2+ 6x−4y−12 = 0.
1. Plot the circle on the coordinate plane.
2. Determine the center and radius of the circle.
3. Find the equation of the tangent line to the circle at the point (1,2).
6
Solution
1. To plot the circle, we first rewrite the equation in standard form:
(x+ 3)2+ (y−2)2= 25
This is the equation of a circle with center (−3,2) and radius 5. The circle is
shown below:
xy (1,2)
2. The center of the circle is located at (−3,2) and the radius is 5.
3. To find the equation of the tangent line at (1,2), we first find the slope
of the radius connecting the center (−3,2) to (1,2):
m=2−2
1−(−3) = 0
Since the radius is horizontal, the slope of the tangent line will be vertical.
Hence, the equation of the tangent line passing through (1,2) is x= 1.
7

Question 9
Question
Consider the following parametric equations:
x(t) = 2 cos(t)
y(t) = 3 sin(t)
Plot the curve represented by these parametric equations and analyze its
geometric shape.
Solution
1. To plot the curve represented by the parametric equations x(t) = 2 cos(t)
and y(t) = 3 sin(t), we need to parameterize the curve by letting tvary over
a desired interval. Let’s choose tto vary from 0 to 2πto complete one full
revolution.
2. Now, we can plot the curve by plugging different values of tinto the
parametric equations and plotting the corresponding points. Let’s plot some
key points for t= 0,π
4,π
2,3π
4, π, ..., 2π.
3. The curve traced by these parametric equations is an ellipse. To see
this, note that x2
a2+y2
b2= 1 is the equation of an ellipse, where aand bare the
semi-major and semi-minor axes, respectively. In this case, a= 2 and b= 3, so
the equation becomes x2
4+y2
9= 1.
4. The semi-major axis of the ellipse is 3 units in the y-direction and the
semi-minor axis is 2 units in the x-direction. The center of the ellipse is at the
origin (0,0).
5. The ellipse is symmetric about both the x-axis and the y-axis. It reaches
the maximum and minimum points at (2,0) and (−2,0) along the x-axis, and
at (0,3) and (0,−3) along the y-axis.
Therefore, the geometric shape represented by the parametric equations
x(t) = 2 cos(t) and y(t) = 3 sin(t) is an ellipse centered at the origin with
semi-major axis 3 and semi-minor axis 2.
Question 10
Question
Consider the following geometric shape in the Cartesian plane: a circle with
center at (-2, 3) and radius 5, and a line passing through the points (1, 4) and
(-5, 1). Find the points of intersection, if any, between the circle and the line.
8
Solution
Step 1: Find the equation of the line passing through the points (1, 4) and (-5,
1). The slope of the line can be found using the formula:
m=y2−y1
x2−x1
=1−4
−5−1=−3
−6=1
2
So, the equation of the line is:
y−y1=m(x−x1)
y−4 = 1
2(x−1)
y=1
2x+7
2
Step 2: Find the coordinates of the points of intersection between the line
and the circle. Substitute y=1
2x+7
2into the equation of the circle (x+ 2)2+
(y−3)2= 25:
(x+ 2)2+1
2x+7
2−32
= 25
(x+ 2)2+1
2x+1
22
= 25
x2+ 4x+4+1
4x2+x+1
4= 25
17
4x2+ 5x−21 = 0
Step 3: Solve the quadratic equation to find the x-coordinates of the points
of intersection. The solutions to the quadratic equation 17
4x2+ 5x−21 = 0 are:
x=−5±q52−4·17
4· −21
2·17
4
Step 4: Calculate the y-coordinates corresponding to the x-coordinates found
in step 3. Substitute the x-coordinates found in step 3 back into the equation
of the line to find the corresponding y-coordinates.
Therefore, the points of intersection between the circle and the line are the
pairs of coordinates obtained from step 3 and step 4.
Question 11
Question
Consider the quadratic equation y=x2+4x+3. Plot and analyze the geometric
shape represented by this equation.
9
Solution
Step 1: Find the vertex of the parabola. To find the vertex of the parabola
represented by the quadratic equation, we first need to rewrite the equation in
vertex form. Completing the square gives us:
y= (x+ 2)2−1
Step 2: Determine the vertex and axis of symmetry. Comparing the
equation y= (x+ 2)2−1 with the standard form of a parabola y= (x−h)2+k,
we see that the vertex is at (−2,−1). The axis of symmetry is the vertical line
passing through the vertex, in this case, x=−2.
Step 3: Find the x-intercepts. To find the x-intercepts, we set y= 0 in
the equation (x+ 2)2−1 = 0 and solve for x. This gives us x=−1 and x=−3
as the x-intercepts.
Step 4: Determine the direction of opening. Since the coefficient of
x2is positive, the parabola opens upwards.
Step 5: Plot the graph. Now that we have the vertex, axis of symmetry,
x-intercepts, and direction of opening, we can plot the graph of the parabola.
Step 6: Analyze the geometric shape. The graph of the quadratic
equation y=x2+ 4x+ 3 is a parabola that opens upwards with vertex at (-2,
-1) and x-intercepts at (-3, 0) and (-1, 0). The axis of symmetry is the line
x=−2.
Question 12
Question
Plot the curve given by the parametric equations
x= sin(t), y = sin(2t)
for −2π≤t≤2π. Analyze the geometric shape of the curve.
Solution
Step 1: To plot the curve, we will first create a table of values by choosing
various values of tand computing the corresponding values of xand y.
t x = sin(t)y= sin(2t)
−3π
2−1 0
−π0 0
−π
2−1 0
0 0 0
π
21 0
π0 0
3π
2−1 0
2π0 0
10

Step 2: Next, we plot the points obtained from the table of values and
connect them to observe the curve.
Step 3: The geometric shape of the curve is a straight line passing through
the origin. This can be determined from the fact that y= 0 for all values of t,
indicating that the curve lies along the x-axis. The values of xoscillate between
-1 and 1, which shows that the curve oscillates between -1 and 1 on the x-axis.
Therefore, the curve represented by the parametric equations x= sin(t) and
y= sin(2t) for −2π≤t≤2πis a line passing through the origin.
Question 13
Question
Consider the following geometric shapes defined by the equations:
1. x2+y2= 4
2. y =x2
3. y =|x|
Plot each of these shapes on the same set of axes and analyze their intersec-
tions and relationships geometrically.
Solution
1. The equation x2+y2= 4 represents a circle with radius 2 centered at the
origin.
2. The equation y=x2represents a parabola opening upwards, symmetric
about the y-axis, and passing through the origin.
3. The equation y=|x|represents the absolute value function, which is
V-shaped and symmetric about the y-axis.
Now, we will plot these shapes on the same set of axes to analyze their
intersections and relationships.
Question 14
Question
Consider the following three points in R3:A(1,2,−3), B(4,1,−2), and C(−2,3,0).
Determine whether these points lie on a straight line, lie on a plane, or are not
collinear.
Solution
To determine whether the three points lie on a straight line, lie on a plane, or
are not collinear, we can check if the vectors −−→
AB and −→
AC are linearly dependent.
11

If they are linearly dependent, the points lie on a plane. If they are not linearly
dependent, we can further check if −−→
AB and −→
AC are parallel. If they are parallel,
the points lie on a straight line; otherwise, they are not collinear.
Step 1: Calculate −−→
AB and −→
AC The vector −−→
AB is given by:
−−→
AB =
4−1
1−2
−2−(−3)
=
3
−1
1
The vector −→
AC is given by:
−→
AC =
−2−1
3−2
0−(−3)
=
−3
1
3
Step 2: Check if −−→
AB and −→
AC are linearly dependent To check if −−→
AB
and −→
AC are linearly dependent, we can construct a matrix with these vectors
as its columns and find its determinant. The vectors are linearly dependent if
and only if the determinant is zero.
det
3−3
−1 1
1 3
= 3(1) −(−3)(−1) = 3 + 3 = 6 = 0
Since the determinant is non-zero, −−→
AB and −→
AC are not linearly dependent.
Step 3: Check if −−→
AB and −→
AC are parallel Two vectors are parallel if
one is a scalar multiple of the other. We can check if −−→
AB is a scalar multiple of
−→
AC.
Comparing the components of the vectors, we can see that they are not
scalar multiples of each other since there is no scalar ksuch that:
3
−3=−1
1=1
3=k
Therefore, the points A,B, and Care not collinear.
Question 15
Question
Consider the two-dimensional region bounded by the curve x2−4x+y2−4y= 0.
Plot and analyze this geometric shape in terms of its symmetry, intercepts, and
orientation.
12

Solution
To analyze the geometric shape defined by the equation x2−4x+y2−4y= 0,
we will complete the square for both xand yterms to express the equation in
standard form.
Step 1: Completing the square for xterm:
x2−4x=−(x2−4x+ 4) + 4 = −((x−2)2−4) + 4 = 4 −(x−2)2
Step 2: Completing the square for yterm:
y2−4y=−(y2−4y+ 4) + 4 = −((y−2)2−4) + 4 = 4 −(y−2)2
Therefore, the equation can be rewritten as:
4−(x−2)2+ 4 −(y−2)2= 0
8−(x−2)2−(y−2)2= 0
This equation represents a circle centered at (2,2) with radius √8.
To further analyze this geometric shape: - The circle is symmetric with
respect to the line x= 2 and the line y= 2. - Intercepts: Since the circle is
centered at (2,2) and its radius is √8, it intersects the x-axis at (2 −√8,0) and
(2 + √8,0), and the y-axis at (0,2−√8) and (0,2 + √8). - Orientation: The
circle lies in the first and third quadrants since both the xand ycoordinates
are positive or both are negative.
Therefore, the geometric shape defined by the equation x2−4x+y2−4y= 0
is a circle centered at (2,2) with radius √8.
Question 16
Question
Consider the following parametric equations for a curve in the xy-plane:
(x(t) = 3 sin(t)
y(t) = 2 cos(t)
Determine the shape of the curve and find the points where the curve intersects
the x-axis.
Solution
Step 1: To determine the shape of the curve, we can eliminate the parameter t
by expressing xin terms of y:
x= 3 sin(t) =⇒t= arcsin x
3
13

Substitute this into the equation y= 2 cos(t) to get yin terms of x:
y= 2 cos arcsin x
3
Step 2: Using the trigonometric identity cos(arcsin(u)) = √1−u2, the equa-
tion simplifies to:
y= 2r1−x
32= 2r1−x2
9= 2r9−x2
9=2√9−x2
3
Step 3: The simplified equation of the curve is y=2√9−x2
3, which represents
the upper half of an ellipse centered at the origin with major axis of length 6
along the x-axis and minor axis of length 4 along the y-axis.
Step 4: To find the points where the curve intersects the x-axis, we set y= 0:
0 = 2√9−x2
3=⇒p9−x2= 0 =⇒x=±3
Thus, the curve intersects the x-axis at the points (−3,0) and (3,0).
Question 17
Question
Consider the following 3D geometric shape represented by the equation:
x2+y2−z2= 1
Plot and analyze this shape, including determining its type and properties.
Solution
Step 1: To analyze the given 3D geometric shape, we first note that it resembles
a hyperboloid of one sheet. In order to verify this, we rewrite the equation in
the standard form for a hyperboloid of one sheet:
x2
1+y2
1−z2
1= 1
Step 2: By comparing the given equation with the standard form, we see
that the given shape is indeed a hyperboloid of one sheet with semi-major axis
of length 1 in the x and y directions, and semi-minor axis of length 1 in the z
direction.
Step 3: The shape opens along the z-axis, and the hyperboloid of one sheet is
symmetric about the z-axis. This shape has no intersections with the xy-plane
but extends infinitely in the z-direction.
Step 4: By plotting this hyperboloid of one sheet, we can visually confirm
its shape and properties.
14

Question 18
Question
Consider the region bounded by the curves y=x3and y= 8 −x2in the first
quadrant. Determine the area of the region enclosed by these curves.
Solution
To find the area enclosed by the curves y=x3and y= 8 −x2in the first
quadrant, we first need to find the points where the two curves intersect.
Step 1: Find the intersection points.
Setting the two equations equal to each other:
x3= 8 −x2
Solving for x:
x3+x2−8 = 0
This equation can be factored as:
(x−1)(x2+x+ 8) = 0
The quadratic factor does not have real roots, so the only real intersection
point is x= 1.
Step 2: Determine the area enclosed by the curves.
The area enclosed by the curves can be found by integrating the difference
of the curves from 0 to 1.
Area = Z1
0
((8 −x2)−x3)dx
=Z1
0
(8 −x2−x3)dx
=8x−x3
3−x4
41
0
=8−1
3−1
4−(0 −0−0)
=83
12
Therefore, the area of the region enclosed by the curves y=x3and y= 8−x2
in the first quadrant is 83
12 .
15

Question 19
Question
Consider the following geometric shape: a circle with center at point A(2,3)
and passing through the point B(−1,2). Determine the equation of the circle
and analyze its properties such as radius, area, and circumference.
Solution
Step 1: Find the radius of the circle using the distance formula. Step 2: Write
the equation of the circle in standard form. Step 3: Determine the area and
circumference of the circle.
Step 1: The radius rof the circle can be found using the distance formula:
r=p(x2−x1)2+ (y2−y1)2. We have A(2,3) and B(−1,2), so the radius is:
r=p(−1−2)2+ (2 −3)2=√32+ 12=√10.
Step 2: The equation of a circle with center (h, k) and radius ris given
by (x−h)2+ (y−k)2=r2. Substitute h= 2, k= 3, and r=√10 into the
equation: (x−2)2+ (y−3)2= 10.
Step 3: From the equation (x−2)2+ (y−3)2= 10, we can determine
the properties of the circle: Radius: √10 Area: A=πr2=π(√10)2= 10π
Circumference: C= 2πr = 2π√10
Question 20
Question
Consider the circle Cwith equation x2+y2= 25. Let Pbe a point on Cwhose
x-coordinate is 3.
(a) Find the y-coordinates of the points Pand Qon Cwhere the tangent
lines to Cat Pand Qare perpendicular to each other.
(b) Find the area of the region enclosed by Cand the two tangent lines.
Solution
(a) Step 1: Let P(3, y) be a point on C. Substituting x= 3 into the equation of
the circle gives 32+y2= 25. Solving for y, we get y2= 16 and y=±4. Thus,
the y-coordinates of Pare y= 4 and y=−4.
Step 2: To find the point Qon C, we need to find the equation of the tangent
line at P(3,4). The equation of the tangent line at a point (a, b) on a circle with
equation x2+y2=r2is given by y−b=−a
b(x−a). Substituting a= 3 and
b= 4, we get y−4 = −3
4(x−3).
Step 3: To find the slope of the tangent line at P(3,4), we differentiate the
equation of the circle x2+y2= 25 implicitly with respect to x. We get dy
dx =−x
y.
Substituting x= 3 and y= 4, we get the slope of the tangent at Pas −3
4. Since
16

the slopes of perpendicular lines are negative reciprocals of each other, the slope
of the tangent at Qis 4
3.
Step 4: Using the slope and the point P(3,−4), we can find the equation of
the tangent line at Q. So the equation of the tangent at Qis y+ 4 = 4
3(x−3).
Therefore, the points Pand Qon Care (3,4) and (3,−4), respectively.
(b) Step 1: To find the area enclosed by Cand the two tangent lines, we
first note that the two tangent lines and the radius from the center of the circle
form an isosceles triangle.
Step 2: The base of the isosceles triangle is 2×3 = 6 units (since the distance
between the points Pand Qis the base). The height of the triangle can be found
by dropping a perpendicular from the center of the circle to the base which is
r−rcos(θ) = 25 −25 cos(arctan(4/3)).
Step 3: The area of the triangle is 1
2×6×(r−rcos(θ)).
Step 4: Substituting the values, the area of the region enclosed by the circle
and the two tangent lines is 1
2×6×(25 −25 cos(arctan(4/3))). Calculating this
expression will give the final answer.
Question 21
Question
Consider the following collection of geometric shapes:
- A circle with center (2,2) and radius 4. - A parabola y=x2−4x+ 3. - A
square with vertices at (0,0), (4,0), (4,4), and (0,4).
Plot these shapes on the same set of axes and find the points of intersection,
if any. Then, analyze the geometric relationships among the shapes.
Solution
Step 1: Plot the circle, parabola, and square on the same set of axes.
Step 2: Circle with center (2,2) and radius 4: The equation of a circle with
center (h, k) and radius ris given by (x−h)2+ (y−k)2=r2. For this circle,
the equation is (x−2)2+ (y−2)2= 16.
Step 3: Parabola y=x2−4x+ 3: Plot the parabola y=x2−4x+ 3.
Step 4: Square with vertices at (0,0), (4,0), (4,4), and (0,4): Draw the
square with these vertices.
Step 5: Find the points of intersection, if any: To find the points of inter-
section, solve the equations of the circle and parabola or square simultaneously.
Step 6: Analyze the geometric relationships among the shapes: - The circle
and parabola intersect at most 2 points. - The square may intersect the circle
or the parabola at multiple points, depending on their relative positions.
Thus, by plotting the shapes on the same set of axes and analyzing their
intersection points, we can understand the geometric relationships among the
circle, parabola, and square.
17

Question 22
Question
Consider the following geometric shapes: a circle with radius 3 centered at the
origin, a square with side length 6 whose bottom-left corner is located at (-3,
-3), and an equilateral triangle with side length 4 centered at the point (0, 43).
Plot these shapes on the same set of axes and analyze their intersections and
relationships.
Solution
To plot the given geometric shapes, we first need to determine the equations
defining each shape.
1. The equation of a circle centered at the origin with radius 3 is given by
x2+y2= 32or x2+y2= 9.
2. The equation of a square with side length 6, with its bottom-left corner
located at (-3, -3), can be written as follows: The square has vertices at (-3, -3),
(3, -3), (3, 3), and (-3, 3). So, we can represent the square using the following
set of inequalities: −3≤x≤3 and −3≤y≤3.
3. An equilateral triangle with side length 4 centered at the point (0, 4√3)
has vertices that are √3 units up and down from the center along the y-axis,
and 2 units to the left and right along the x-axis. Thus, the vertices of the
equilateral triangle are located at (-2, 4√3), (0, 4√3), and (2, 4√3).
Now, let’s plot these geometric shapes on the same set of axes:
18
x
y
From the plot, we can see that: - The circle intersects the square at four
points. - The equilateral triangle intersects the circle at three points. - The
equilateral triangle does not intersect the square. - The circle and square have
points of tangency.
Therefore, the circle, square, and equilateral triangle have various intersec-
tions and relationships on the same set of axes.
Question 23
Question
Consider the region in the first quadrant bounded by the curves y=x2and
y=x4. Determine the area of the region enclosed by these curves.
19
Solution
Step 1: First, we need to find the points of intersection of the curves y=x2
and y=x4. Setting x2=x4, we have:
x4−x2= 0
x2(x2−1) = 0
This gives us x= 0 and x= 1 as the points of intersection.
Step 2: Next, we find the area enclosed by the curves by integrating the
difference of the curves with respect to xfrom x= 0 to x= 1. The area Ais
given by:
A=Z1
0
(x4−x2)dx
Step 3: Now, we integrate the expression:
A=Z1
0
(x4−x2)dx =1
5x5−1
3x31
0
A=1
5·15−1
3·13−1
5·05−1
3·03
A=1
5−1
3
A=3−5
15
A=−2
15
Thus, the area of the region enclosed by the curves y=x2and y=x4in
the first quadrant is −2
15 .
Question 24
Question
Let A(−2,1), B(3,4), C(5,−1) be three points in the plane. Find the equation
of the circle passing through A,B, and C.
20

Solution
To find the equation of the circle passing through points A(−2,1), B(3,4), and
C(5,−1), we can use the fact that the perpendicular bisectors of the chords of
the circle pass through the center of the circle.
Step 1: Find the equations of the perpendicular bisectors of the
chords containing points Aand B
The midpoint of the line segment joining points Aand Bis the center of
the circle. Let MAB be the midpoint of AB, then MAB =Ax+Bx
2,Ay+By
2
MAB =−2+3
2,1+4
2MAB = (0.5,2.5)
The slope of the line passing through Aand Bis given by mAB =4−1
3−(−2)
mAB =3
5
Therefore, the slope of the perpendicular bisector of AB is −5
3. Using the
point-slope form, we have y−2.5 = −5
3(x−0.5) 3y−7.5 = −5x+2.5 5x+3y= 10
5x+ 3y−10 = 0
Step 2: Find the equations of the perpendicular bisectors of the
chords containing points Band C
Proceeding in a similar manner as in Step 1, the equation of the perpendic-
ular bisector of BC is 7x−10y=−19
Step 3: Solve the system of equations
Solving the system of equations 5x+3y−10 = 0 and 7x−10y=−19 will give
us the center of the circle, which is the point of intersection of the perpendicular
bisectors.
Solving the system, we get x=−155
59 and y=−20
59 . Hence, the center of the
circle is O−155
59 ,−20
59 .
Step 4: Find the radius of the circle
The radius of the circle is the distance between the center Oand any of the
points A,B, or C. Let’s use Ato calculate the radius. r=q−2 + 155
59 2+1 + 20
59 2
r=q302
59
Step 5: Write the equation of the circle
The equation of a circle with center (h, k) and radius ris (x−h)2+(y−k)2=
r2. Substitute h=−155
59 ,k=−20
59 , and r=q302
59 to get the equation of the
circle passing through points A,B, and C:x+155
59 2+y+20
59 2=302
59
Question 25
Question
Consider the following parametric equations for a curve in R2:
x(t) = cos(t)−2 cos(2t), y(t) = sin(t)−2 sin(2t)
Plot the curve represented by the parametric equations and analyze its shape.
21
Solution
To plot the curve represented by the parametric equations x(t) = cos(t)−
2 cos(2t) and y(t) = sin(t)−2 sin(2t), we will first generate points by evaluating
x(t) and y(t) for various values of t. Then, we will plot these points in the
xy-plane.
Step 1: Generate points for plotting Let’s consider the values of tfrom
0 to 2πwith small increments.
t x(t) = cos(t)−2 cos(2t)y(t) = sin(t)−2 sin(2t)
0 1 0
π/4−1−1
π/2−1 0
3π/4−1 1
π1 0
5π/4 3 −1
3π/2 3 0
7π/4 3 1
2π1 0
Step 2: Plot the points and analyze the curve Plotting the generated
points, we observe that the curve traced out by the parametric equations is
an ellipse with major axis along the x-axis. The curve is symmetric about the
x-axis and y-axis.
Therefore, the curve represented by the parametric equations is an ellipse.
Question 26
Question
Consider the following complex numbers in the complex plane: z1= 2 + 3i,
z2=−1 + 2i,z3=−3−i. Plot these complex numbers in the complex plane
and find the following:
1. The modulus of z1.
2. The argument of z2.
3. The conjugate of z3.
Solution
1. To find the modulus of z1= 2 + 3i, we use the formula |z|=√a2+b2where
z=a+bi:
|z1|=p22+ 32=√13
22

2. To find the argument of z2=−1 + 2i, we use the formula arg(z) =
tan−1b
awhere z=a+bi:
arg(z2) = tan−12
−1= tan−1(−2)
Since −1 and 2 are in the second quadrant, the argument is −π
2.
3. The conjugate of z3=−3−iis found by changing the sign of the
imaginary part:
z3=−3 + i
Now, let’s plot these complex numbers in the complex plane.
Re
Im
z1
z2
z3
Question 27
Question
Consider the following parametric equations representing a curve in the xy-
plane:
x= 3 cos(t), y = 2 sin(t),0≤t≤2π
Plot and analyze the geometric shape produced by these equations.
23

Solution
Step 1: To plot the curve, we need to eliminate the parameter tfrom the
equations. We can do this by eliminating tfrom the equations for xand y:
x2= (3 cos(t))2= 9 cos2(t)
y2= (2 sin(t))2= 4 sin2(t)
Adding these two equations gives:
x2+y2= 9 cos2(t) + 4 sin2(t) = 9(cos2(t) + 4
9sin2(t)) = 9
This is the equation of an ellipse centered at the origin with semi-major axis of
length 3 along the x-axis and semi-minor axis of length 2 along the y-axis.
Step 2: Next, let’s find the eccentricity of this ellipse. The eccentricity eof
an ellipse is given by the formula:
e=r1−b2
a2
where aand bare the semi-major and semi-minor axes of the ellipse, respectively.
In this case, a= 3 and b= 2, so:
e=r1−22
32=r1−4
9=r5
9=√5
3
Therefore, the eccentricity of the ellipse is √5
3.
Step 3: Finally, let’s plot the ellipse with the given parametric equations.
Using a graphing tool, plot the curve by varying tfrom 0 to 2π. The resulting
plot should show an ellipse with center at the origin, semi-major axis length 3
along the x-axis and semi-minor axis length 2 along the y-axis.
Thus, the geometric shape produced by the parametric equations x= 3 cos(t)
and y= 2 sin(t) is an ellipse centered at the origin.
Question 28
Question
Consider the geometric shape defined by the equation x4+y4= 1.
(a) Plot the shape represented by the equation.
(b) Analyze the shape of the graph in terms of its symmetry, intersections
with the coordinate axes, and any other relevant features.
24

Solution
(a) To plot the shape represented by the equation x4+y4= 1, we can rewrite
the equation in terms of yas follows:
y=±4
p1−x4
Now, we can plot the shape by considering both positive and negative values
of ycorresponding to the same value of x.
(b) Now let’s analyze the graph: - Symmetry: The graph of x4+y4= 1 is
symmetric about the x-axis, y-axis, and the origin. This is because the equation
is symmetric in xand y. - Intersections with Coordinate Axes: - The shape
intersects the x-axis when y= 0, which implies x4= 1. So, x=±1. - The
shape intersects the y-axis when x= 0, which implies y4= 1. So, y=±1. -
Other Features: - The shape is bounded by the unit circle centered at the
origin due to the constraint x4+y4= 1. - The graph consists of four lobes
meeting at the coordinate axes. - The lobes become less steep as they approach
the axes and the origin.
Overall, the graph of x4+y4= 1 represents a symmetric four-lobed shape
bounded by the unit circle with intersections at (±1,0) and (0,±1).
Question 29
Question
Let Pbe a point in the xy-plane that is equidistant from the points A(−2,5)
and B(4,−3). Find the coordinates of point P.
Solution
Step 1: Calculate the distance between Pand A.
d(P A) = p(xP−xA)2+ (yP−yA)2
=p(x−(−2))2+ (y−5)2
=p(x+ 2)2+ (y−5)2
Step 2: Calculate the distance between Pand B.
d(P B) = p(xP−xB)2+ (yP−yB)2
=p(x−4)2+ (y+ 3)2
Step 3: Since Pis equidistant from Aand B, we have:
p(x+ 2)2+ (y−5)2=p(x−4)2+ (y+ 3)2
Step 4: Square both sides of the equation to eliminate the square roots.
(x+ 2)2+ (y−5)2= (x−4)2+ (y+ 3)2
25

Step 5: Expand both sides of the equation and simplify.
x2+ 4x+4+y2−10y+ 25 = x2−8x+ 16 + y2+ 6y+ 9
4x−8y+ 29 = −8x+ 6y+ 25
Step 6: Rearrange the equation to solve for yin terms of x.
4x+ 8x= 6y+ 8y+ 25 −29
12x= 14y−4
3x= 7y−1
y=3x+ 1
7
Therefore, the coordinates of point Pare of the form (x, 3x+1
7).
Question 30
Question
Consider the following parametric equations:
x(t) = 3 cos(t), y(t) = 2 sin(t).
Plot and analyze the geometric shape described by the parametric equations.
Solution
Step 1: Identify the Shape To determine the shape described by the para-
metric equations, we can eliminate the parameter tby expressing xand ysolely
in terms of each other. We have:
x(t) = 3 cos(t)⇒cos(t) = x
3⇒t= cos−1x
3,
y(t) = 2 sin(t)⇒sin(t) = y
2⇒t= sin−1y
2.
Therefore, the parametric equations can be written as:
x= 3 cos cos−1x
3= 3 x
3=x,
y= 2 sin sin−1y
2= 2 y
2=y.
Hence, the parametric equations describe the line y=x.
Step 2: Plotting the Line Plotting the line y=x, we can see that it is a
diagonal line passing through the origin with a slope of 1.
Therefore, the geometric shape described by the given parametric equations
is a straight line passing through the origin with a slope of 1.
26

