



EXSC 520
CASE STUDY: SIMPLE ANALYSIS OF VARIANCE
I. Simple Analysis of Variance
Research Question: “is there statistically significant difference among mean core
body temperature of groups who worked in a: cold, neutral, or hot environment?”
Assumptions Testing
1. Data level of measurement- what is the level of measurement for the data used in this
case study?
This case study is an interval, because temperature is consistent and has an equal
distance from one degree to the next, and absolute zero is not an option.
2. Would the amount of skewness and kurtosis in these affect the analysis? How do you
know? Give numerical values to support your conclusion
Table 1 depicts that environment 1 skewness is 1.56, which will not affect the
analysis, and the kurtosis is 0.63, which falls within the range of ±1.96. As for
environment 2, the skewness is 1.62, and the kurtosis is 0.64; therefore, environment 2
would have no affect on the analysis of this study. Environment 3 skewness is 0.05 and
kurtosis is 1.37, and just like the other environments, they fall within the range of +/-
1.96, and the data is not affected by skewness or kurtosis.
Table 1. PASTE TABLE with skewness and kurtosis BELOW
Descriptives
Environment Statistic Std. Error
Core_temp 1.00 Mean 37.110 .1690
95% Confidence Interval
for Mean
Lower
Bound
36.728
Upper
Bound
37.492
5% Trimmed Mean 37.133
Median 37.300
Variance .285
Std. Deviation .5343
Minimum 36.0
Maximum 37.8
Range 1.8
Interquartile Range .7
Page 1 of 10

EXSC 520
Skewness -1.069 .687
Kurtosis .837 1.334
2.00 Mean 37.536 .1337
95% Confidence Interval
for Mean
Lower
Bound
37.239
Upper
Bound
37.834
5% Trimmed Mean 37.513
Median 37.500
Variance .197
Std. Deviation .4433
Minimum 37.0
Maximum 38.5
Range 1.5
Interquartile Range .7
Skewness 1.068 .661
Kurtosis .818 1.279
3.00 Mean 37.330 .1868
95% Confidence Interval
for Mean
Lower
Bound
36.907
Upper
Bound
37.753
5% Trimmed Mean 37.339
Median 37.300
Variance .349
Std. Deviation .5908
Minimum 36.5
Maximum 38.0
Range 1.5
Interquartile Range 1.2
Skewness -.031 .687
Kurtosis -1.833 1.334
3. Was the assumption of normality met and how do you know?
Page 2 of 10
EXSC 520
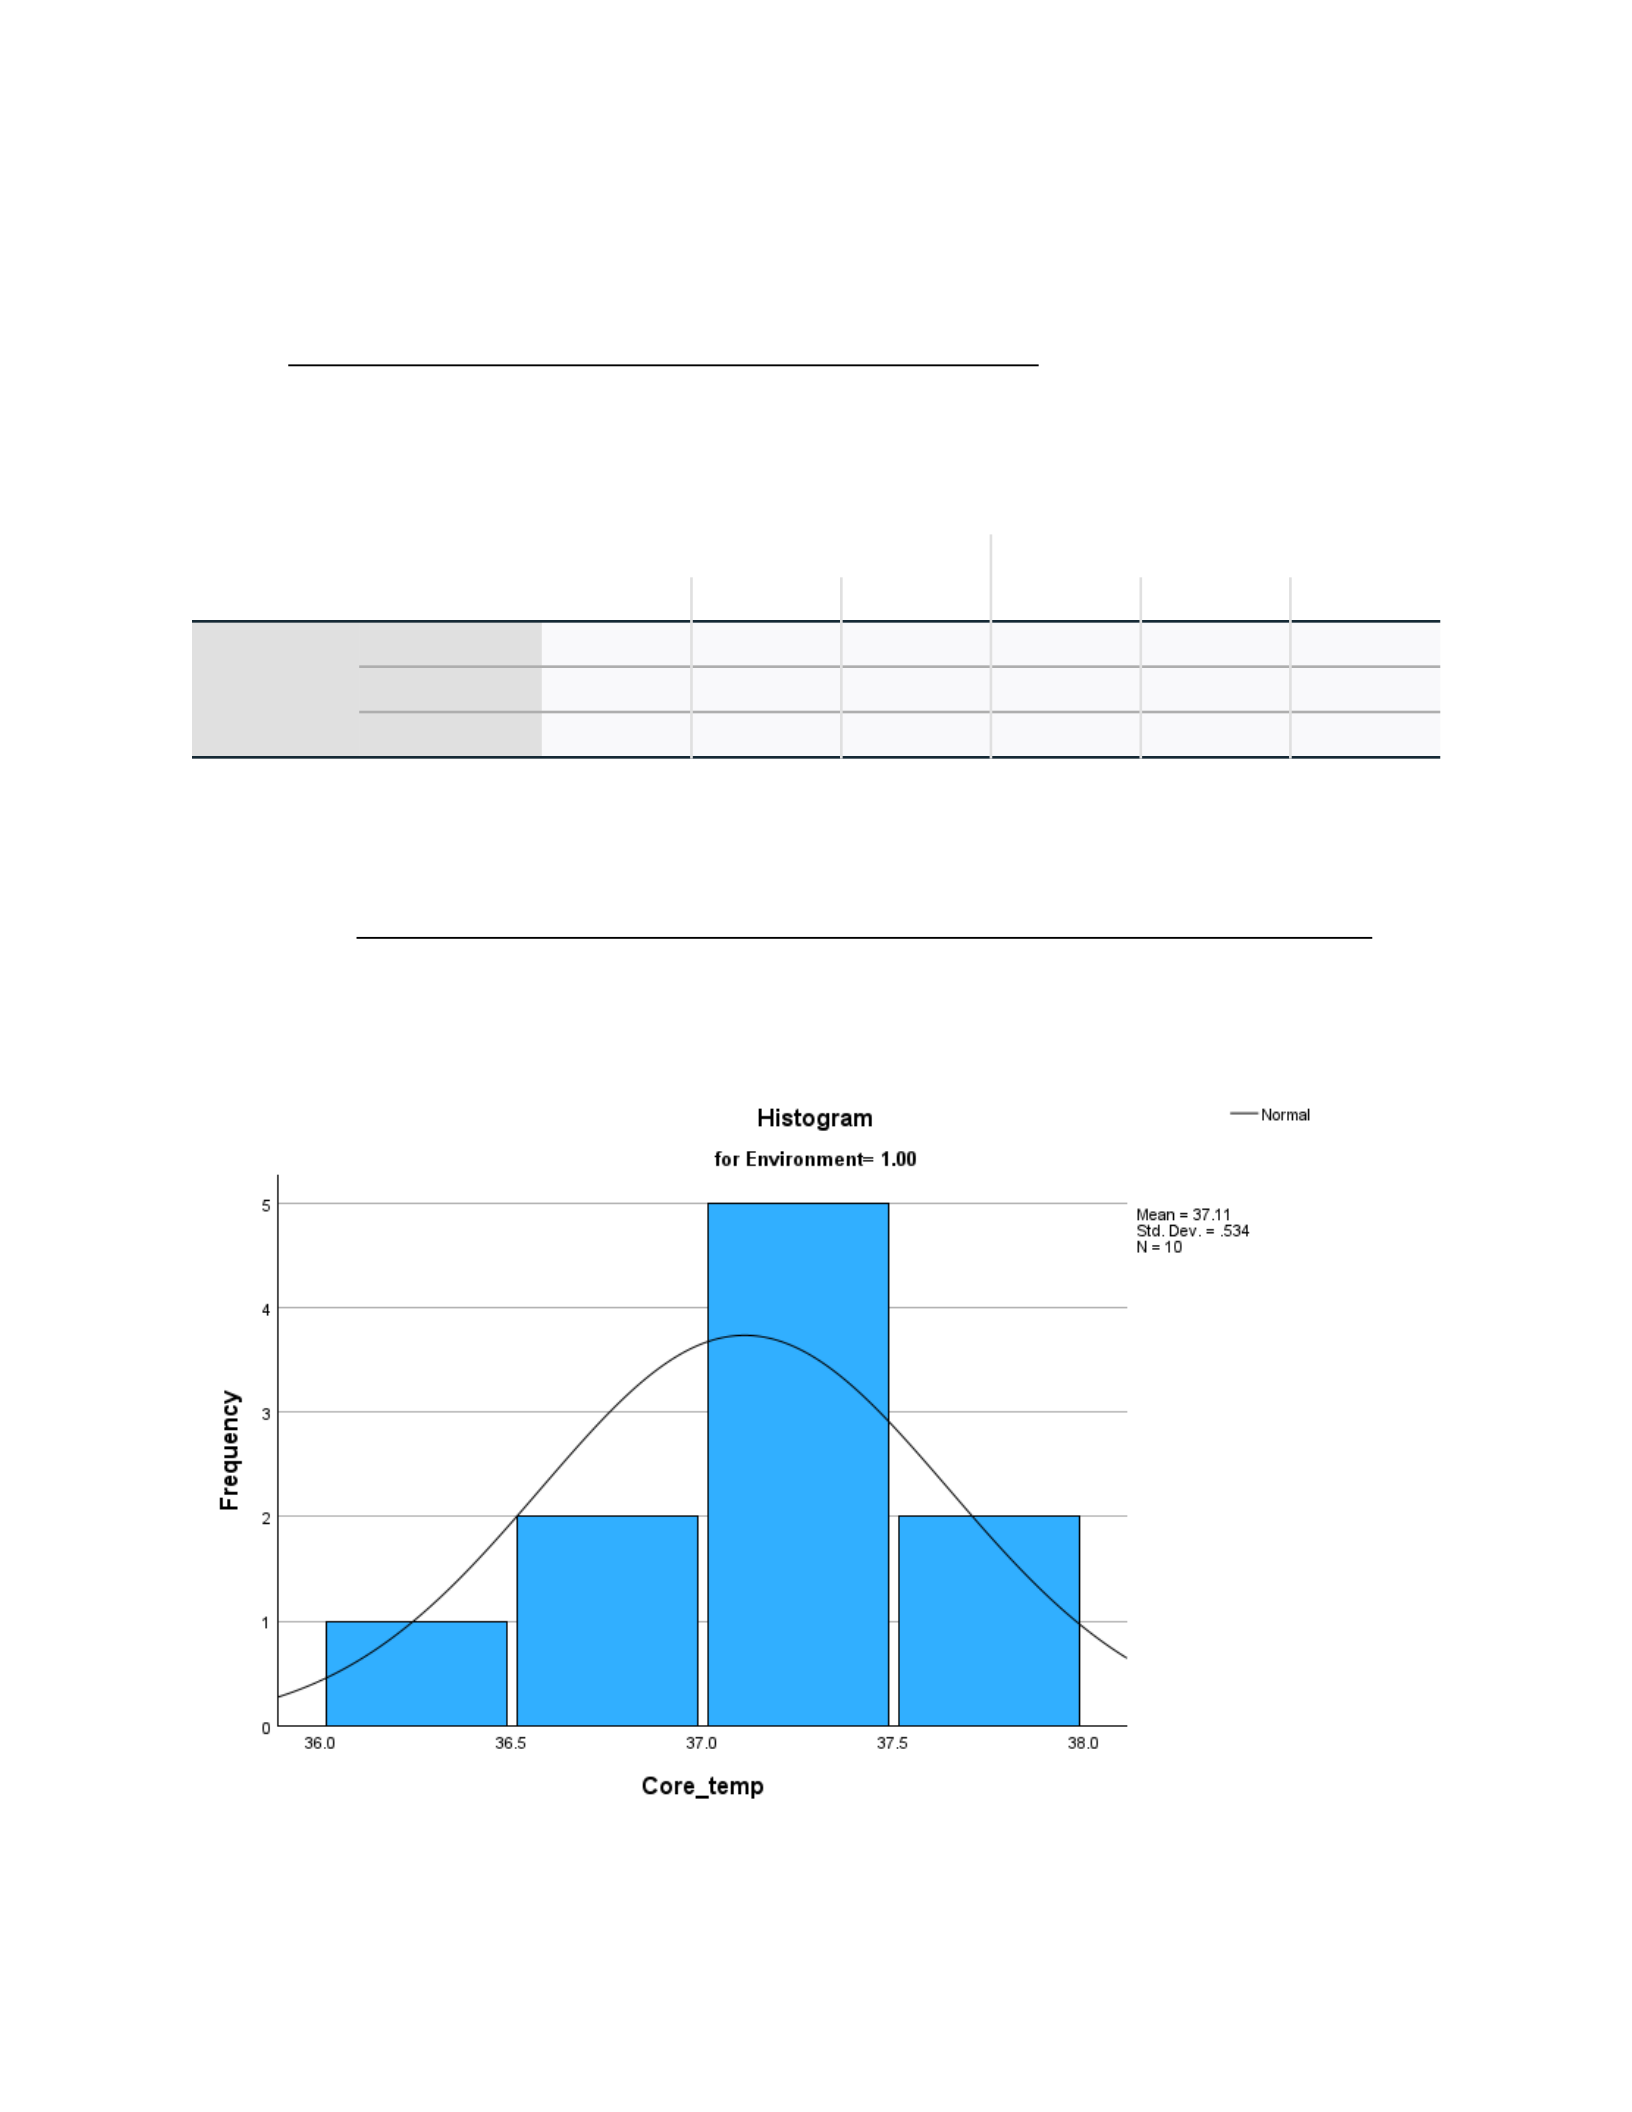
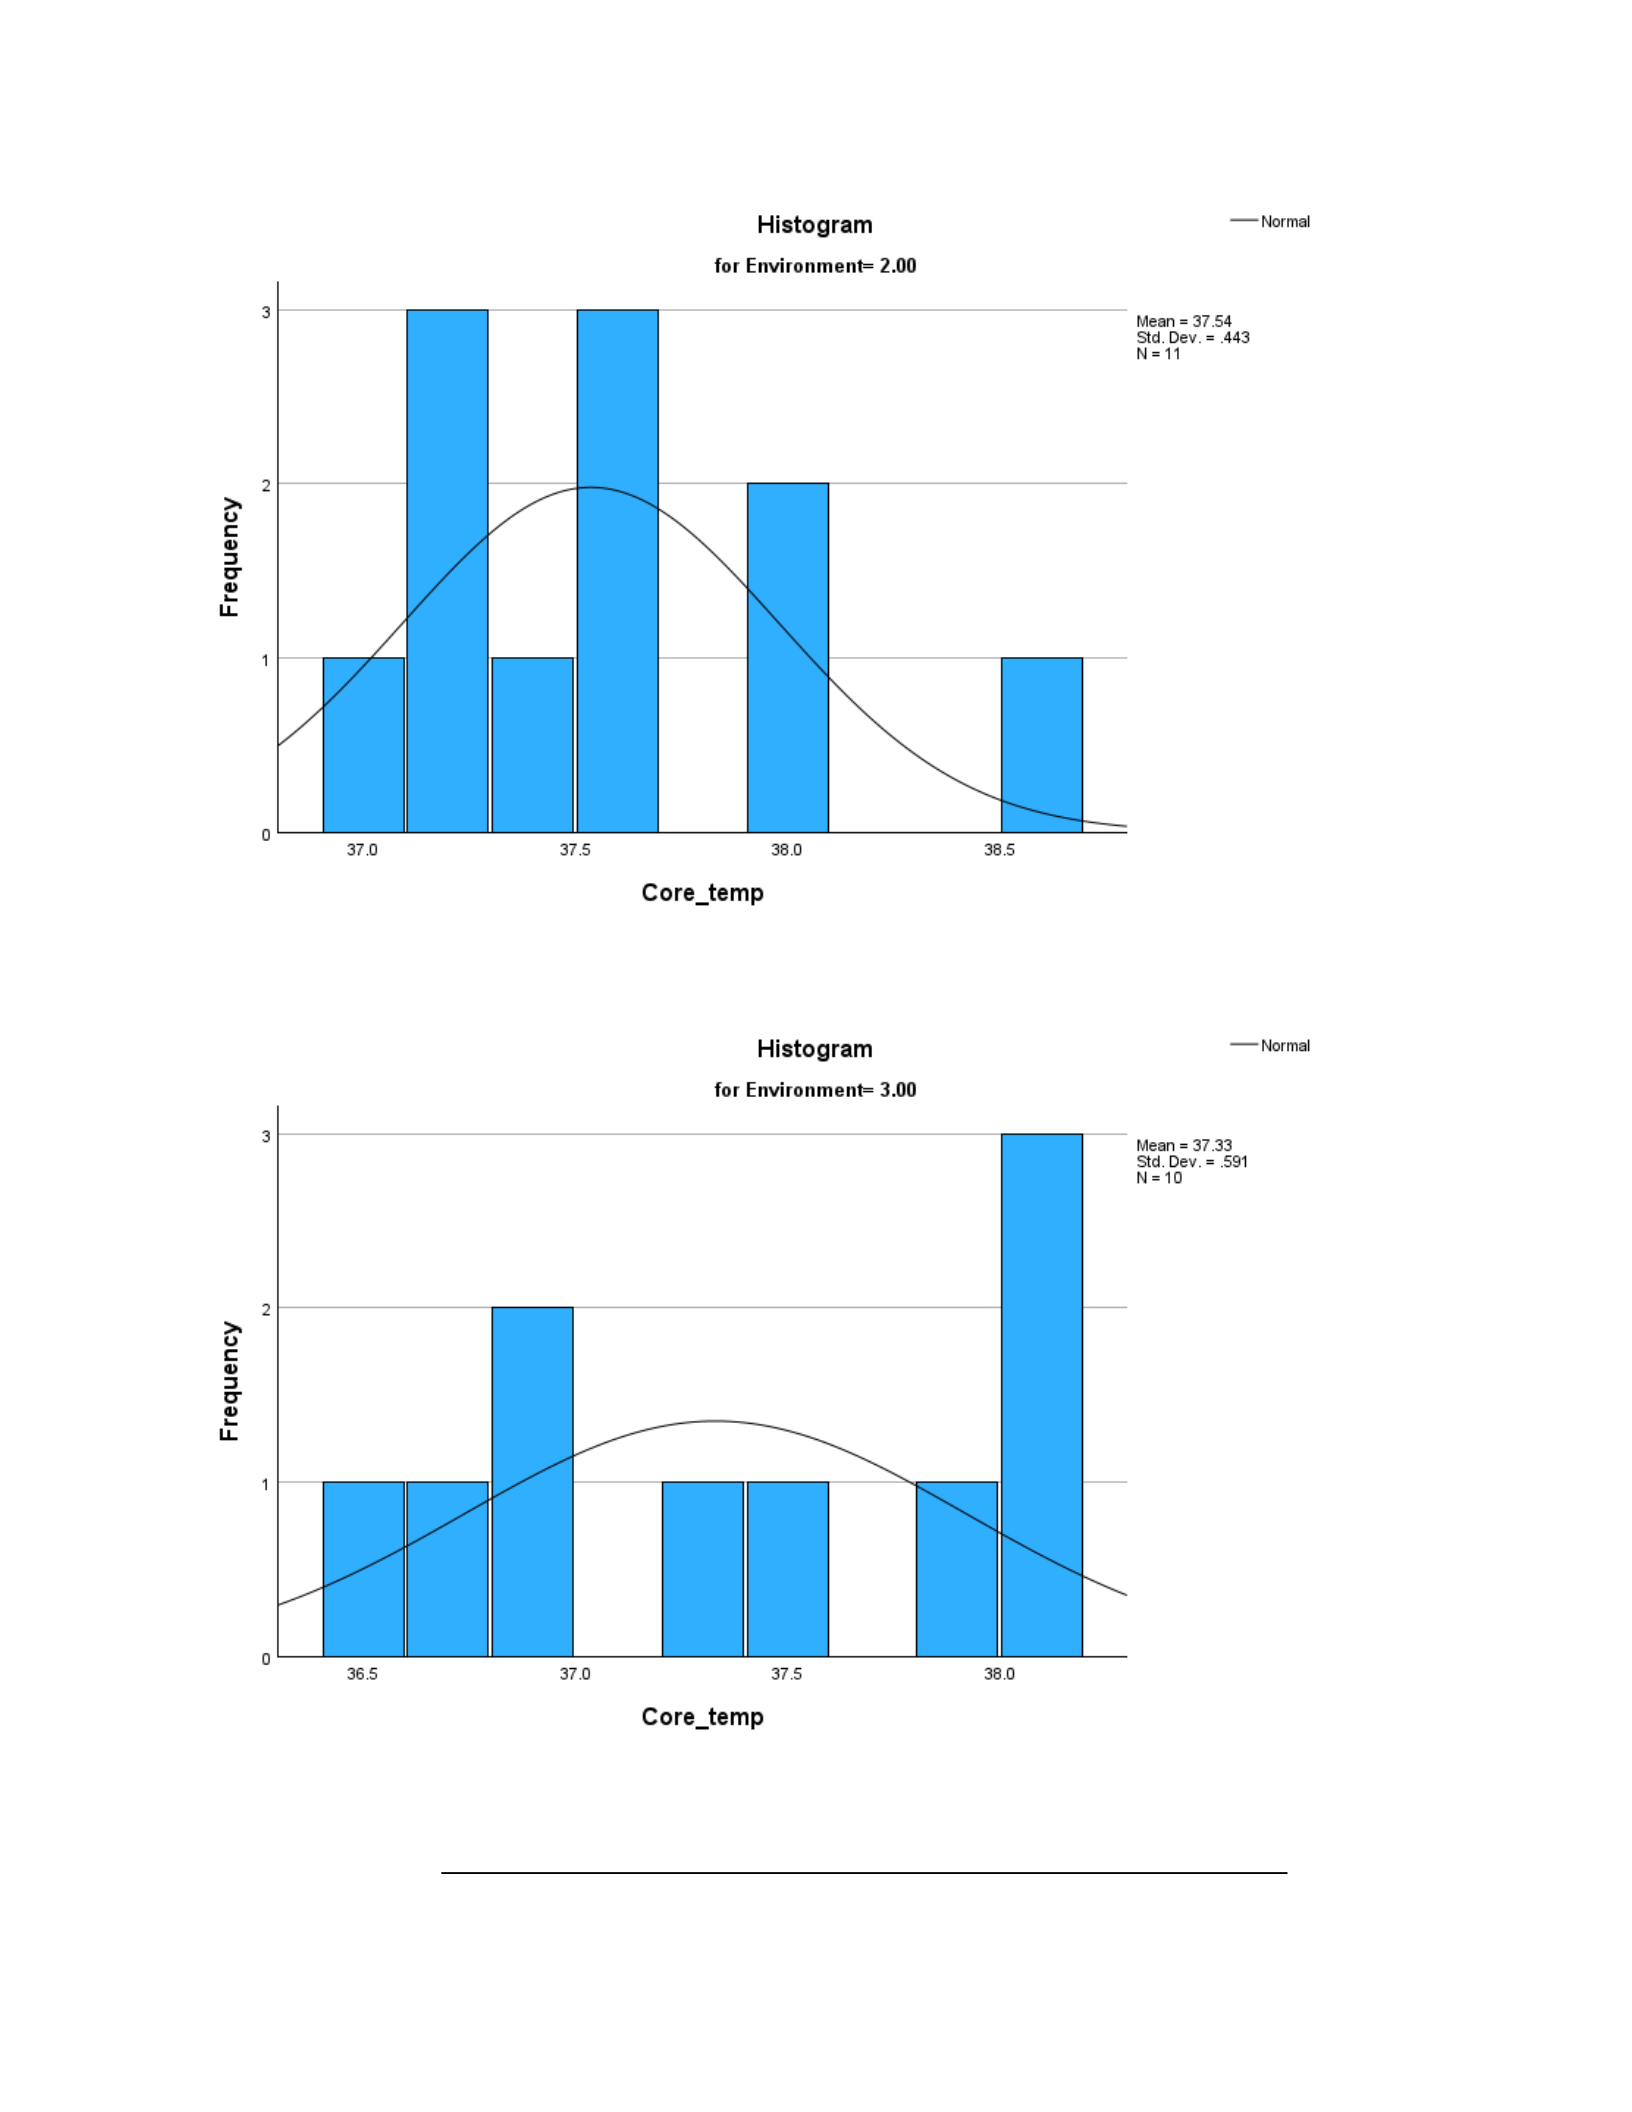
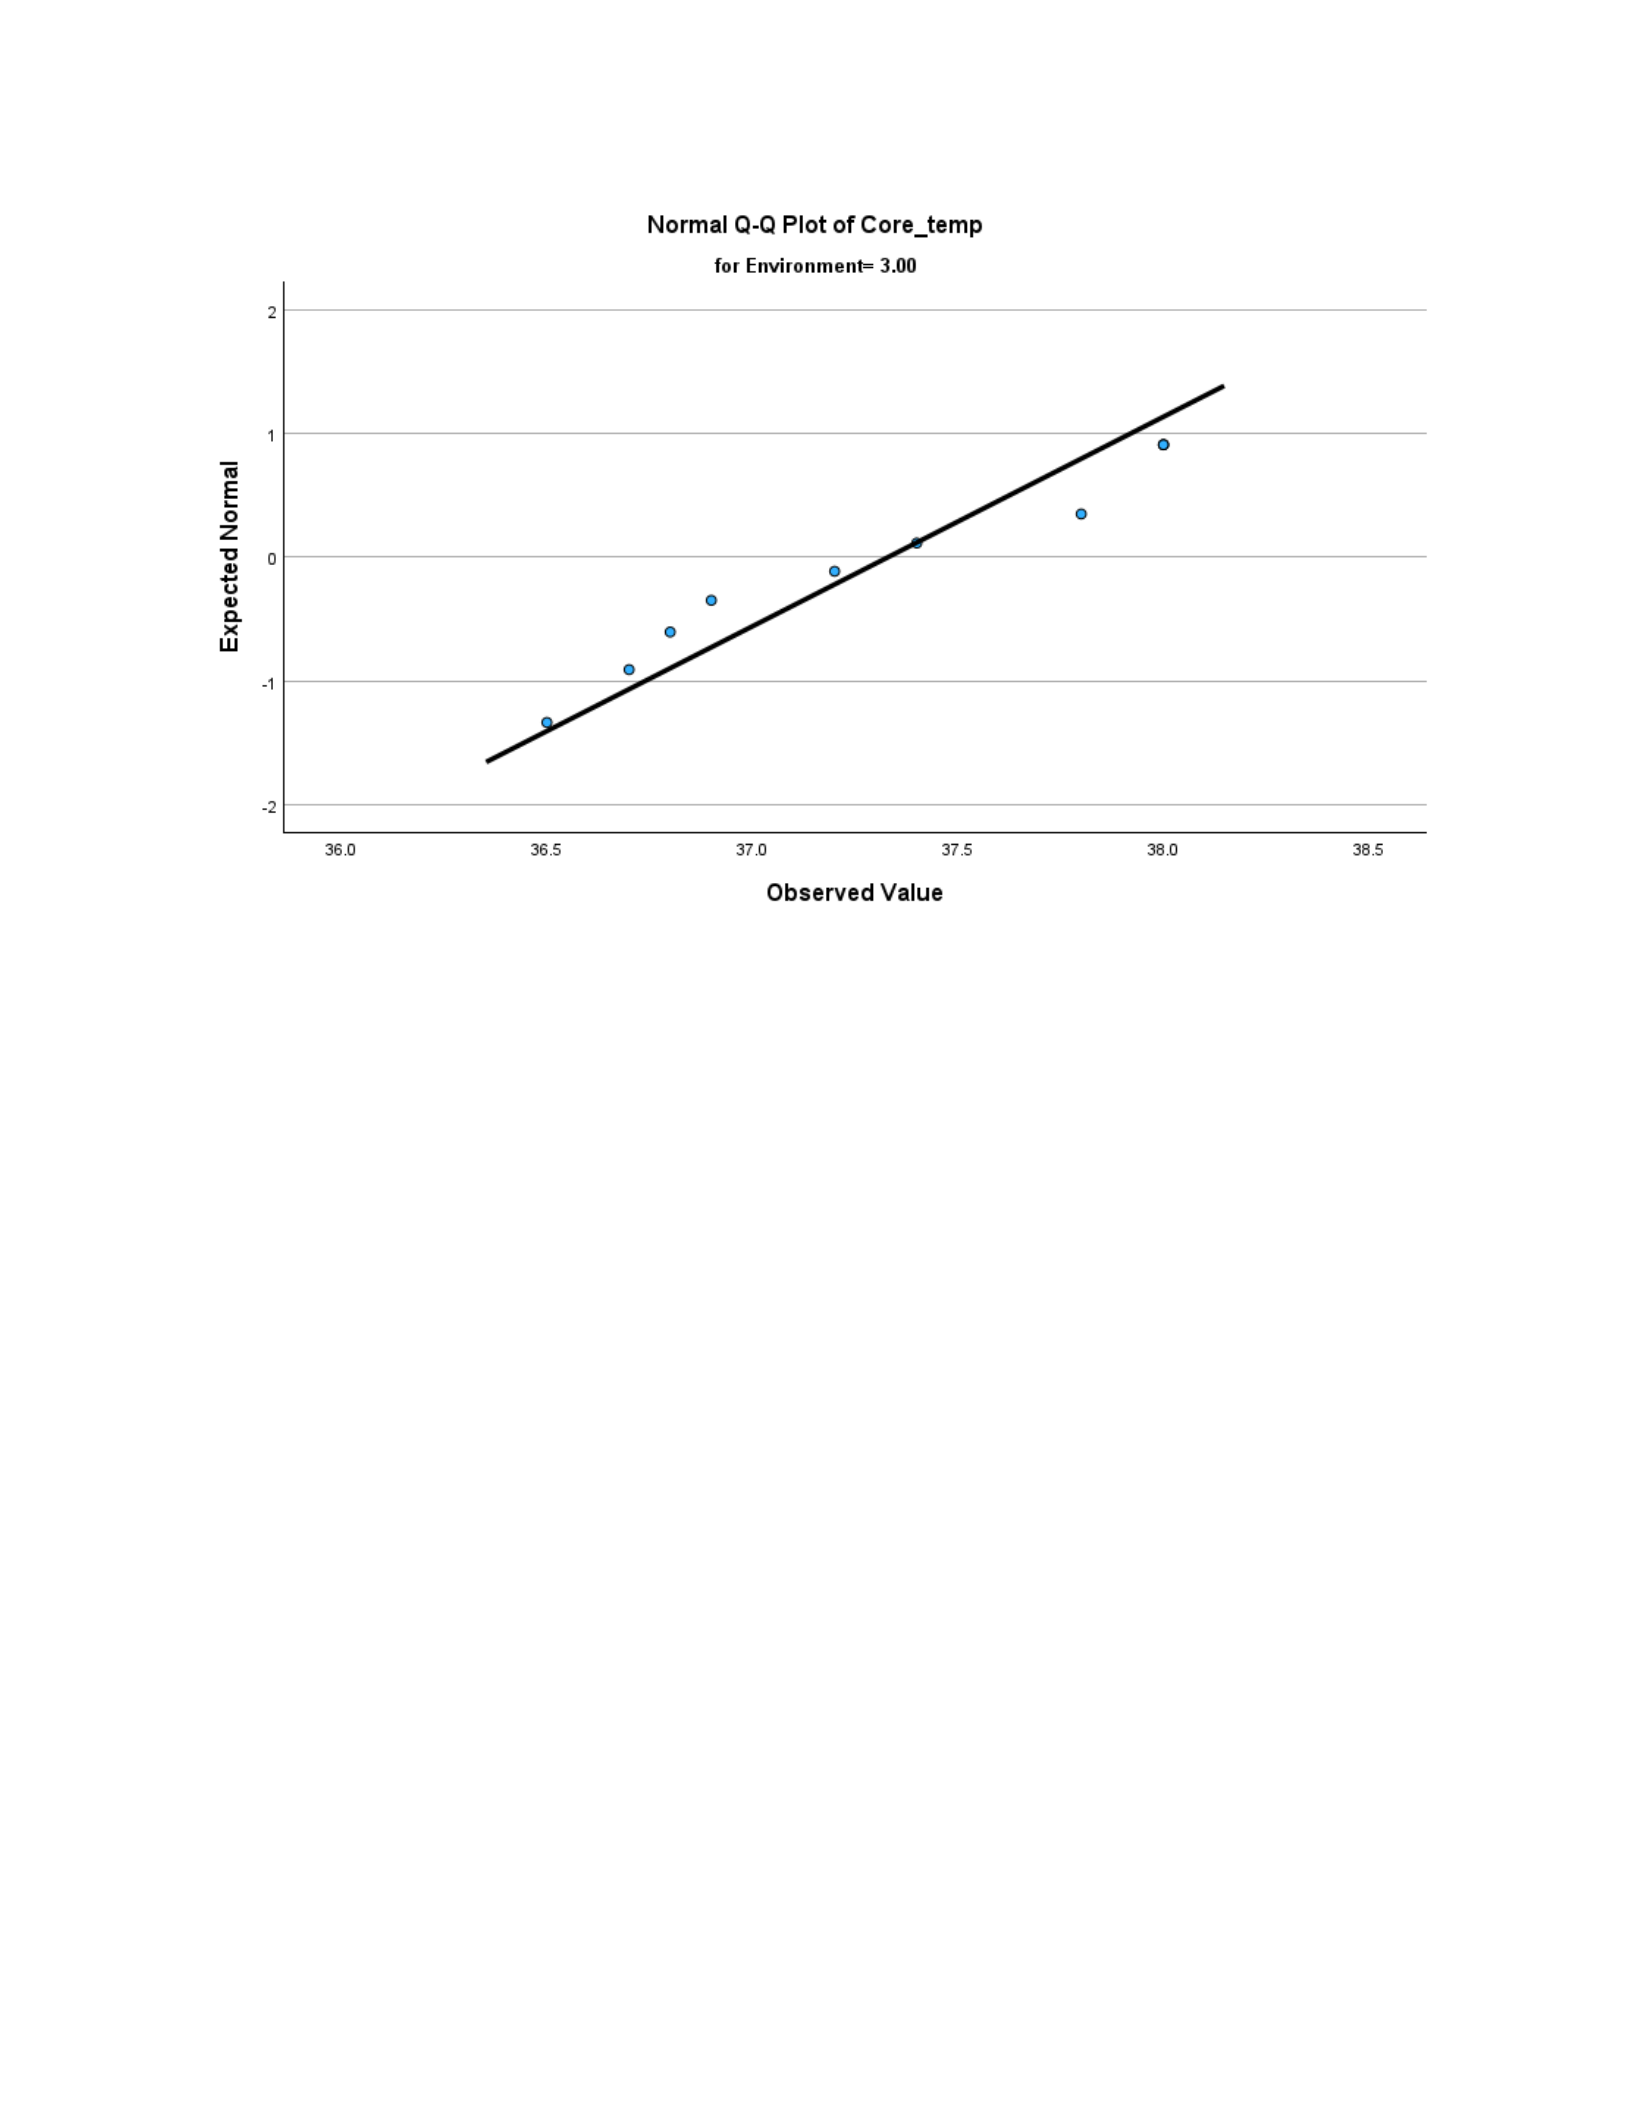
Yes, the assumptions of normality were met in all three environments, because they
were larger than 0.05. According to Table 2, Shapiro-Wilk scores were 0.266, 0.221, and
0.136, respectively.
Table 2. PASTE Tests of NORMALITY table BELOW
Tests of Normality
Environme
nt
Kolmogorov-SmirnovaShapiro-Wilk
Statistic df Sig. Statistic df Sig.
Core_tem
p
1.00 .239 10 .111 .908 10 .266
2.00 .170 11 .200*.906 11 .221
3.00 .187 10 .200*.882 10 .136
*. This is a lower bound of the true significance.
a. Lilliefors Significance Correction
Figure 1. PASTE Histogram with normal curve for each variable BELOW
Page 3 of 10
EXSC 520
Figure 2. PASTE Normal Q-Q Plot for each variable BELOW
Page 4 of 10

EXSC 520
Page 5 of 10
EXSC 520
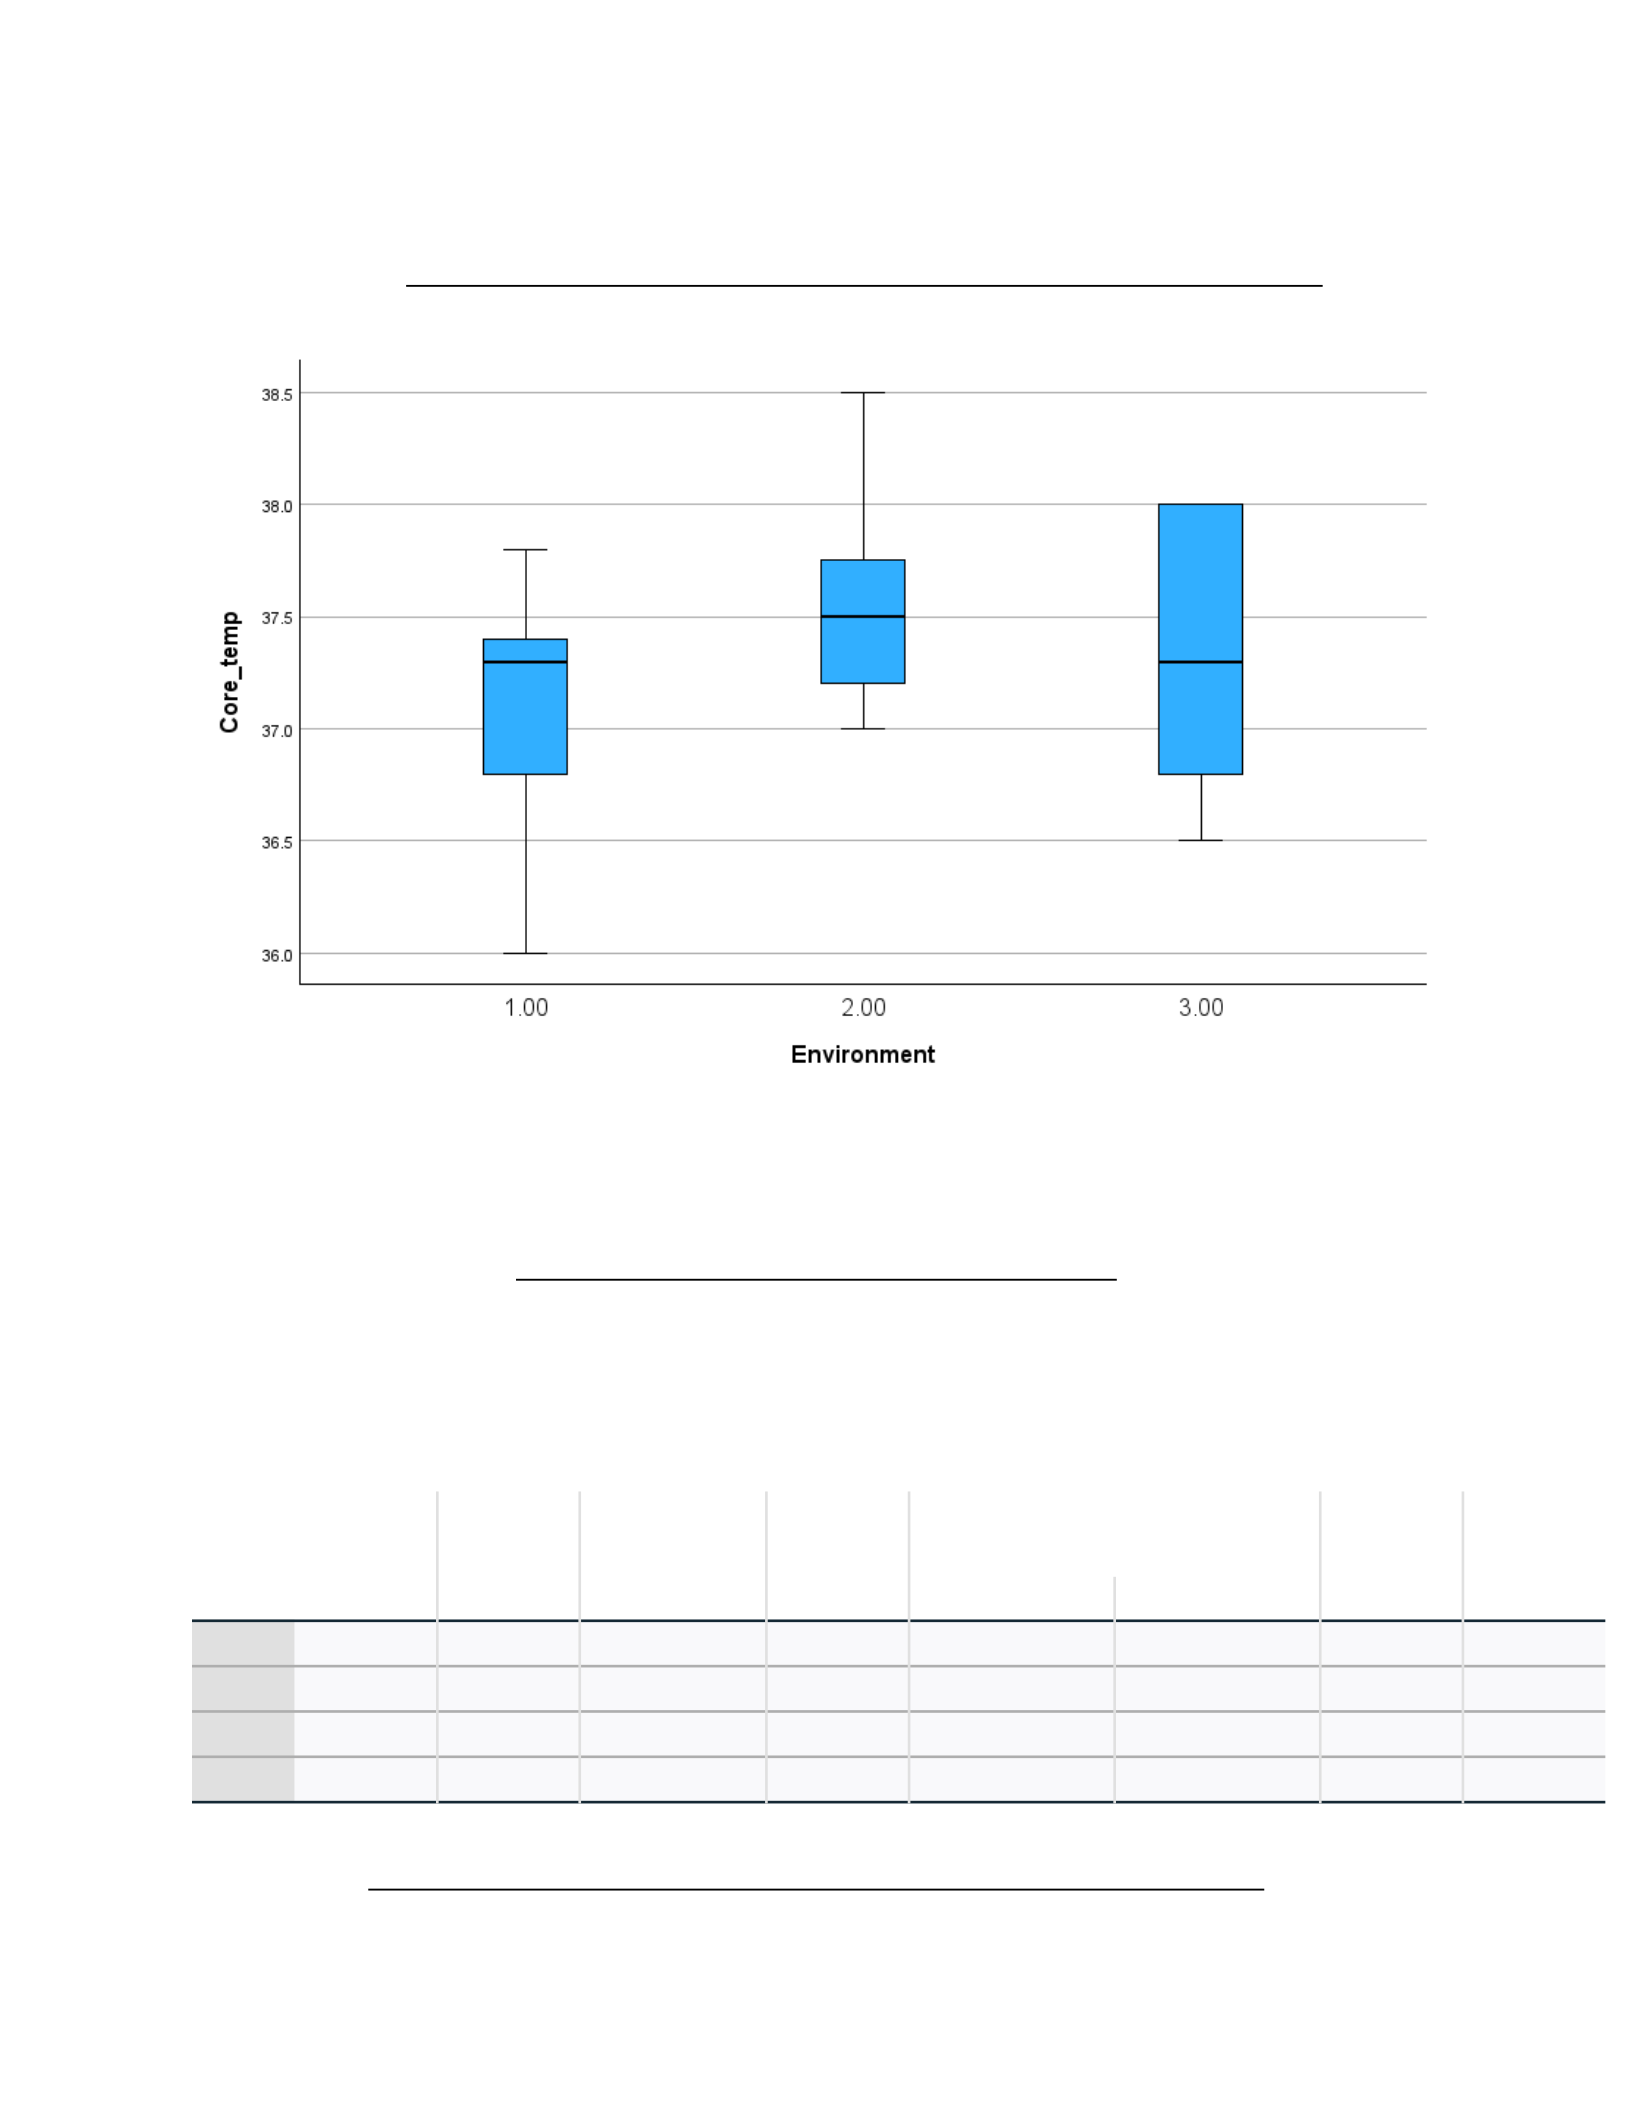
4. Were there any outliers; how do you know?
Page 6 of 10
EXSC 520
No, there were no outliers reflected in Table 3 in the box and whiskers plots.
Table 3. PASTE Box-and-Whiskers Plot for each variable BELOW
Statistical Analysis
Table 4. PASTE Descriptives table BELOW
Descriptives
Core_temp
N Mean
Std.
Deviation
Std.
Error
95% Confidence Interval for
Mean Minimu
m
Maximu
mLower Bound Upper Bound
1.00 10 37.110 .5343 .1690 36.728 37.492 36.0 37.8
2.00 11 37.536 .4433 .1337 37.239 37.834 37.0 38.5
3.00 10 37.330 .5908 .1868 36.907 37.753 36.5 38.0
Total 31 37.332 .5363 .0963 37.136 37.529 36.0 38.5
Table 5. PASTE Test of Homogeneity of Variances table BELOW
Page 7 of 10

EXSC 520
Tests of Homogeneity of Variances
Levene
Statistic df1 df2 Sig.
Core_temp Based on Mean 1.020 2 28 .374
Based on Median .905 2 28 .416
Based on Median and
with adjusted df
.905 2 23.007 .419
Based on trimmed mean 1.051 2 28 .363
Table 6. PASTE ANOVA table BELOW
ANOVA
Core_temp
Sum of
Squares df
Mean
Square F Sig.
Between
Groups
.952 2 .476 1.737 .194
Within Groups 7.675 28 .274
Total 8.628 30
Table7. PASTE Multiple Comparisons Table BELOW
Page 8 of 10

EXSC 520
Multiple Comparisons
Dependent Variable: Core_temp
Bonferroni
(I)
Environment
(J)
Environment
Mean
Difference (I-
J)
Std.
Error Sig.
95% Confidence
Interval
Lower
Bound
Upper
Bound
1.00 2.00 -.4264 .2288 .219 -1.009 .156
3.00 -.2200 .2341 1.000 -.816 .376
2.00 1.00 .4264 .2288 .219 -.156 1.009
3.00 .2064 .2288 1.000 -.376 .789
3.00 1.00 .2200 .2341 1.000 -.376 .816
2.00 -.2064 .2288 1.000 -.789 .376
Write-up- Use these questions as a guide to write an abstract (paragraph). Use past tense.
The write-up must include the following. Use these questions as a guide.
1. What is the research question?
2. What is the mean and standard deviation for core body temperature of each group?
3. Was the test of Homogeneity of Variance met? How do you know?
4. Was the ANOVA statistically significant? (Hint: look at p sig value in ANOVA table)
5. List all (if any) significant multiple comparisons
6. What do the statistical findings of these data suggest about the research question?
7. What are your thoughts on the finding of this analysis, and what are the practical
application(s) of this finding? Elaborate on what the study means, why, how you know,
and relate the findings to exercise physiology knowledge. Use references if needed.
(Hint- does this study “make sense?” What could influence results?)
The research question “Is there a statistically significant difference among the mean
core body temperature of groups who worked in a cold, neutral, or hot environment?” For
environment 1, the mean was 37.11, and the standard deviation was 0.169. Environment 2:
the mean is 37.54, and the standard deviation is 0.44. Environment 3, the mean is 37.33, and
the standard deviation is 0.591. Yes, the test of homogeneity of variance was met, because
the sig values were > 0.05. As for ANOVA, statistically significant, the p-value is 0.194,
therefore it is not statistically significant, because it is > 0.05. There are no significant
multiple comparisons differences because none of these comparisons were below p < 0.01.
Page 9 of 10

EXSC 520
So, what does this mean about the research question? The core body temperature is
not significantly impacted by cold, neutral, and hot environments. The body is amazing and
can withstand extreme environments. When it is really hot, the body sweats; when it is
extremely cold, the body shivers to counteract the heat loss. How much time were these
participants exposed to these elements? Time of exposure, adequate resources based on the
extreme environment, and the ability to downregulate from this exposure will significantly
impact a person's core body temperature. Has the participant been educated and trained to
sustain life in the different environments? Many factors to consider when conducting a study
to determine how one's core temperature is impacted by extreme environments.
Page 10 of 10

