


GROUP #4 WRITE-UP: ASSIGNMENT NAME
by
Shontae Graham
Liberty University
Partial Fulfillment
Of the Requirements for EDUC 812
Liberty University
2023
FINDINGS
Research Question
The research question for this study was:
RQ1: Is there a difference in learning attitude among traditional, adult, and senior
vocational learners at a Northwestern public college?
Null Hypothesis
The null hypothesis for this study was:
H01: There is no significant difference among the depression scores of students who
receive Journal and Counseling therapy, Journal therapy only, or Counseling therapy only, while
controlling for pre-test depression scores.
Descriptive Statistics
Data obtained for the dependent variable, depression scores-post and prior for the
respective individual groupings (independent variable) counseling and journal therapy, journal
therapy only, and counseling therapy can be found in Table 1.
Table 1
Descriptive Statistics
Groups (Pre-Test) Mean S.D.
Journal and Counseling
69.30
11.58
Journal only
65.65
10.02
Counseling only 70.95 10.51
Groups (Post-Test) Mean S.D.
Journal and Counseling 70.30 7.98
Journal only
65.85
8.38
Counseling only
71.10
7.21
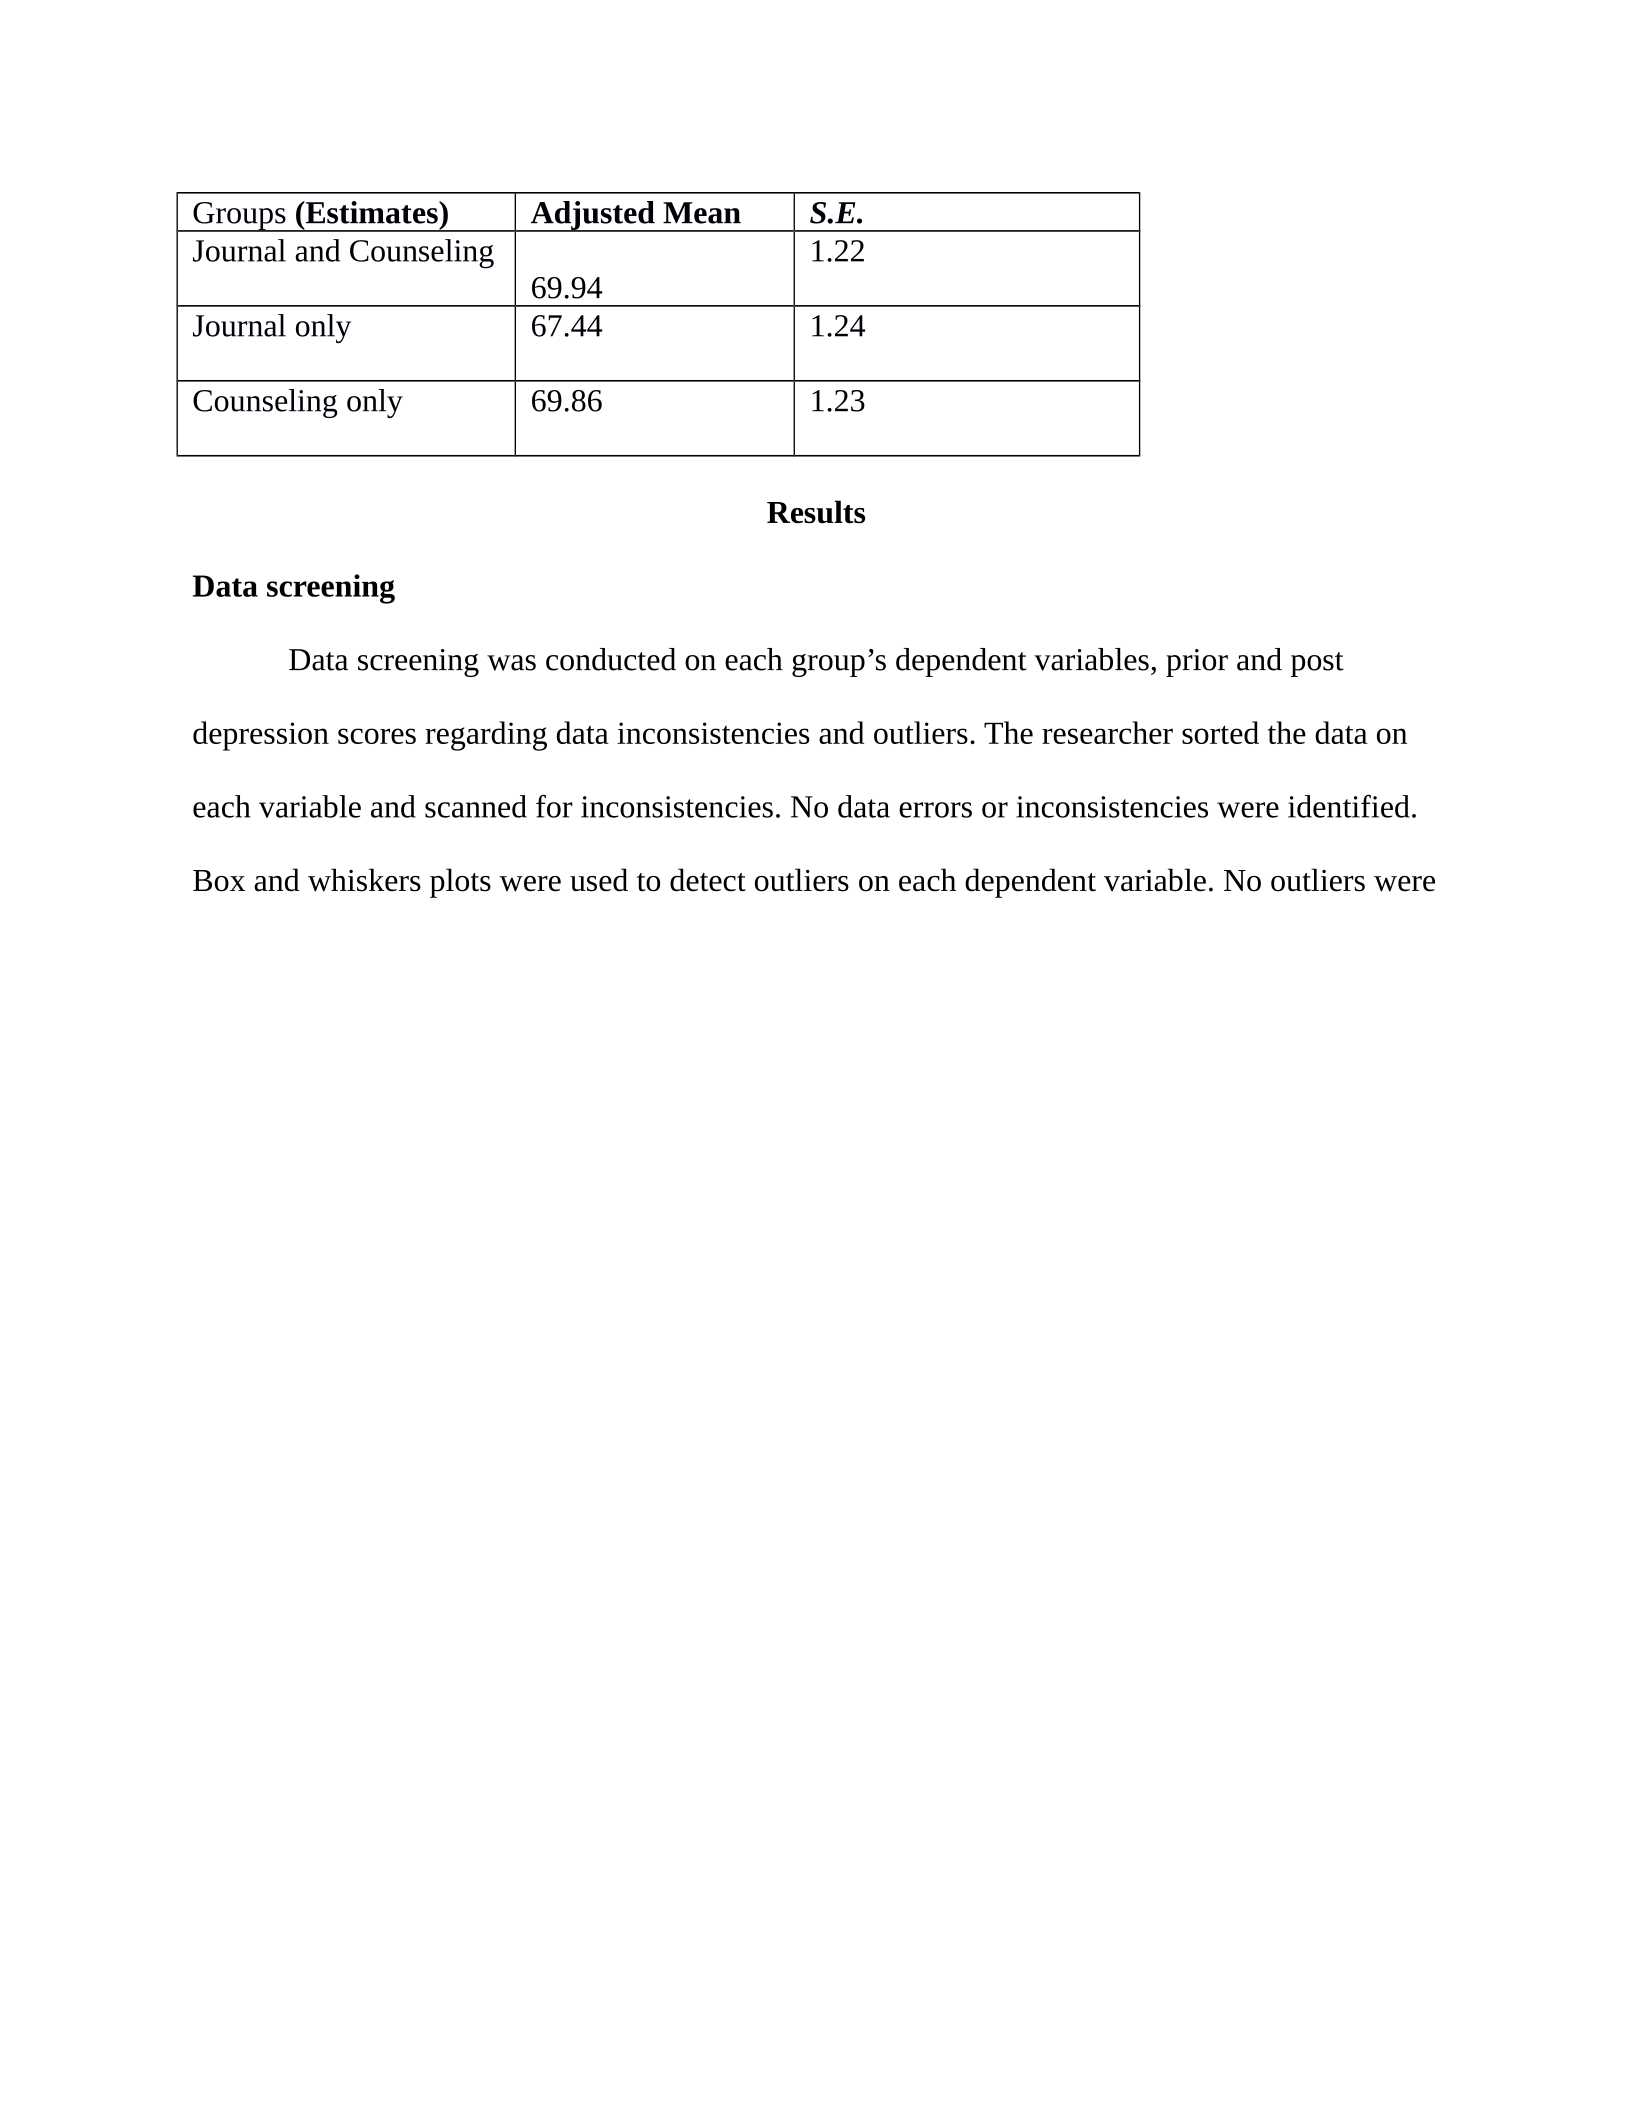
Groups (Estimates) Adjusted Mean S.E.
Journal and Counseling
69.94
1.22
Journal only 67.44 1.24
Counseling only 69.86 1.23
Results
Data screening
Data screening was conducted on each group’s dependent variables, prior and post
depression scores regarding data inconsistencies and outliers. The researcher sorted the data on
each variable and scanned for inconsistencies. No data errors or inconsistencies were identified.
Box and whiskers plots were used to detect outliers on each dependent variable. No outliers were

Therapy
type
Counseling
and
journal
therapy
Journal
therapy
only
Counseling
only
204
204
704
604
cal
404
Depression
Depression
Depression Depression Depression Depression
scores
prisrto
sccrce
after
scoresprorto
acerca
after
scoresprorto
scorce
after
treatment
‘reatnent
treatment
‘reatnent
treatment
‘reatnent
identified. See both graphs for depression scores post and prior to treatment.
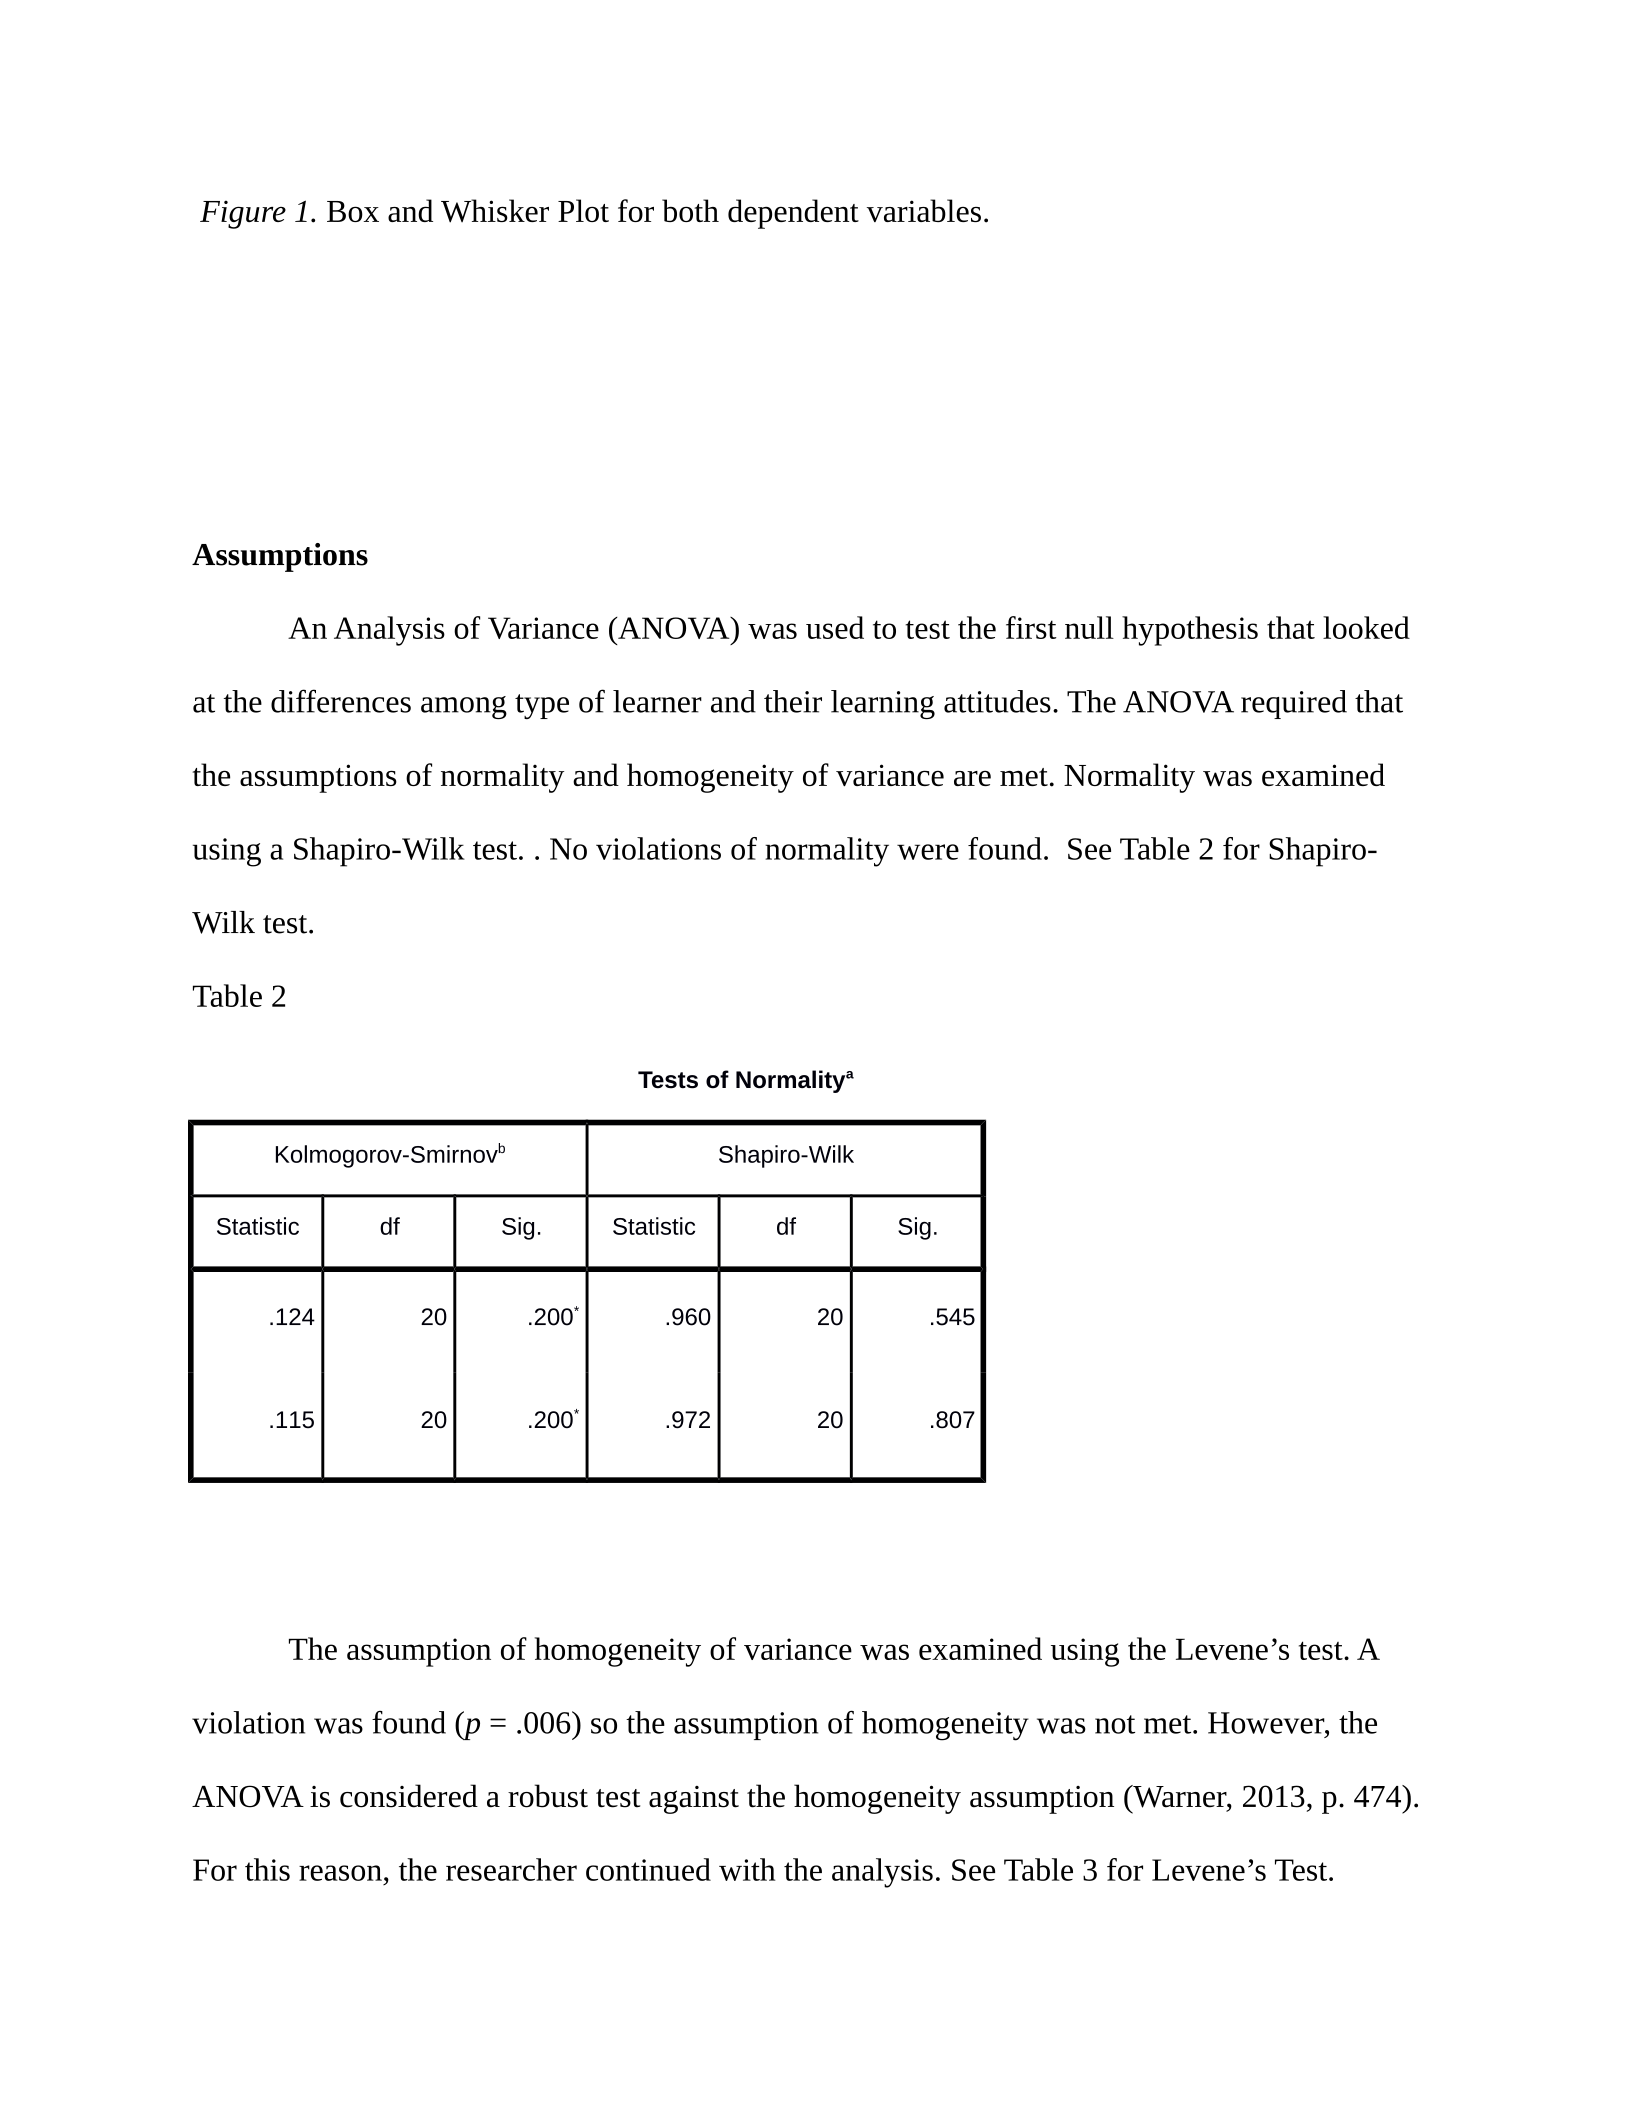
Figure 1. Box and Whisker Plot for both dependent variables.
Assumptions
An Analysis of Variance (ANOVA) was used to test the first null hypothesis that looked
at the differences among type of learner and their learning attitudes. The ANOVA required that
the assumptions of normality and homogeneity of variance are met. Normality was examined
using a Shapiro-Wilk test. . No violations of normality were found. See Table 2 for Shapiro-
Wilk test.
Table 2
Tests of Normalitya
Kolmogorov-SmirnovbShapiro-Wilk
Statistic df Sig. Statistic df Sig.
.124 20 .200*.960 20 .545
.115 20 .200*.972 20 .807
The assumption of homogeneity of variance was examined using the Levene’s test. A
violation was found (p = .006) so the assumption of homogeneity was not met. However, the
ANOVA is considered a robust test against the homogeneity assumption (Warner, 2013, p. 474).
For this reason, the researcher continued with the analysis. See Table 3 for Levene’s Test.
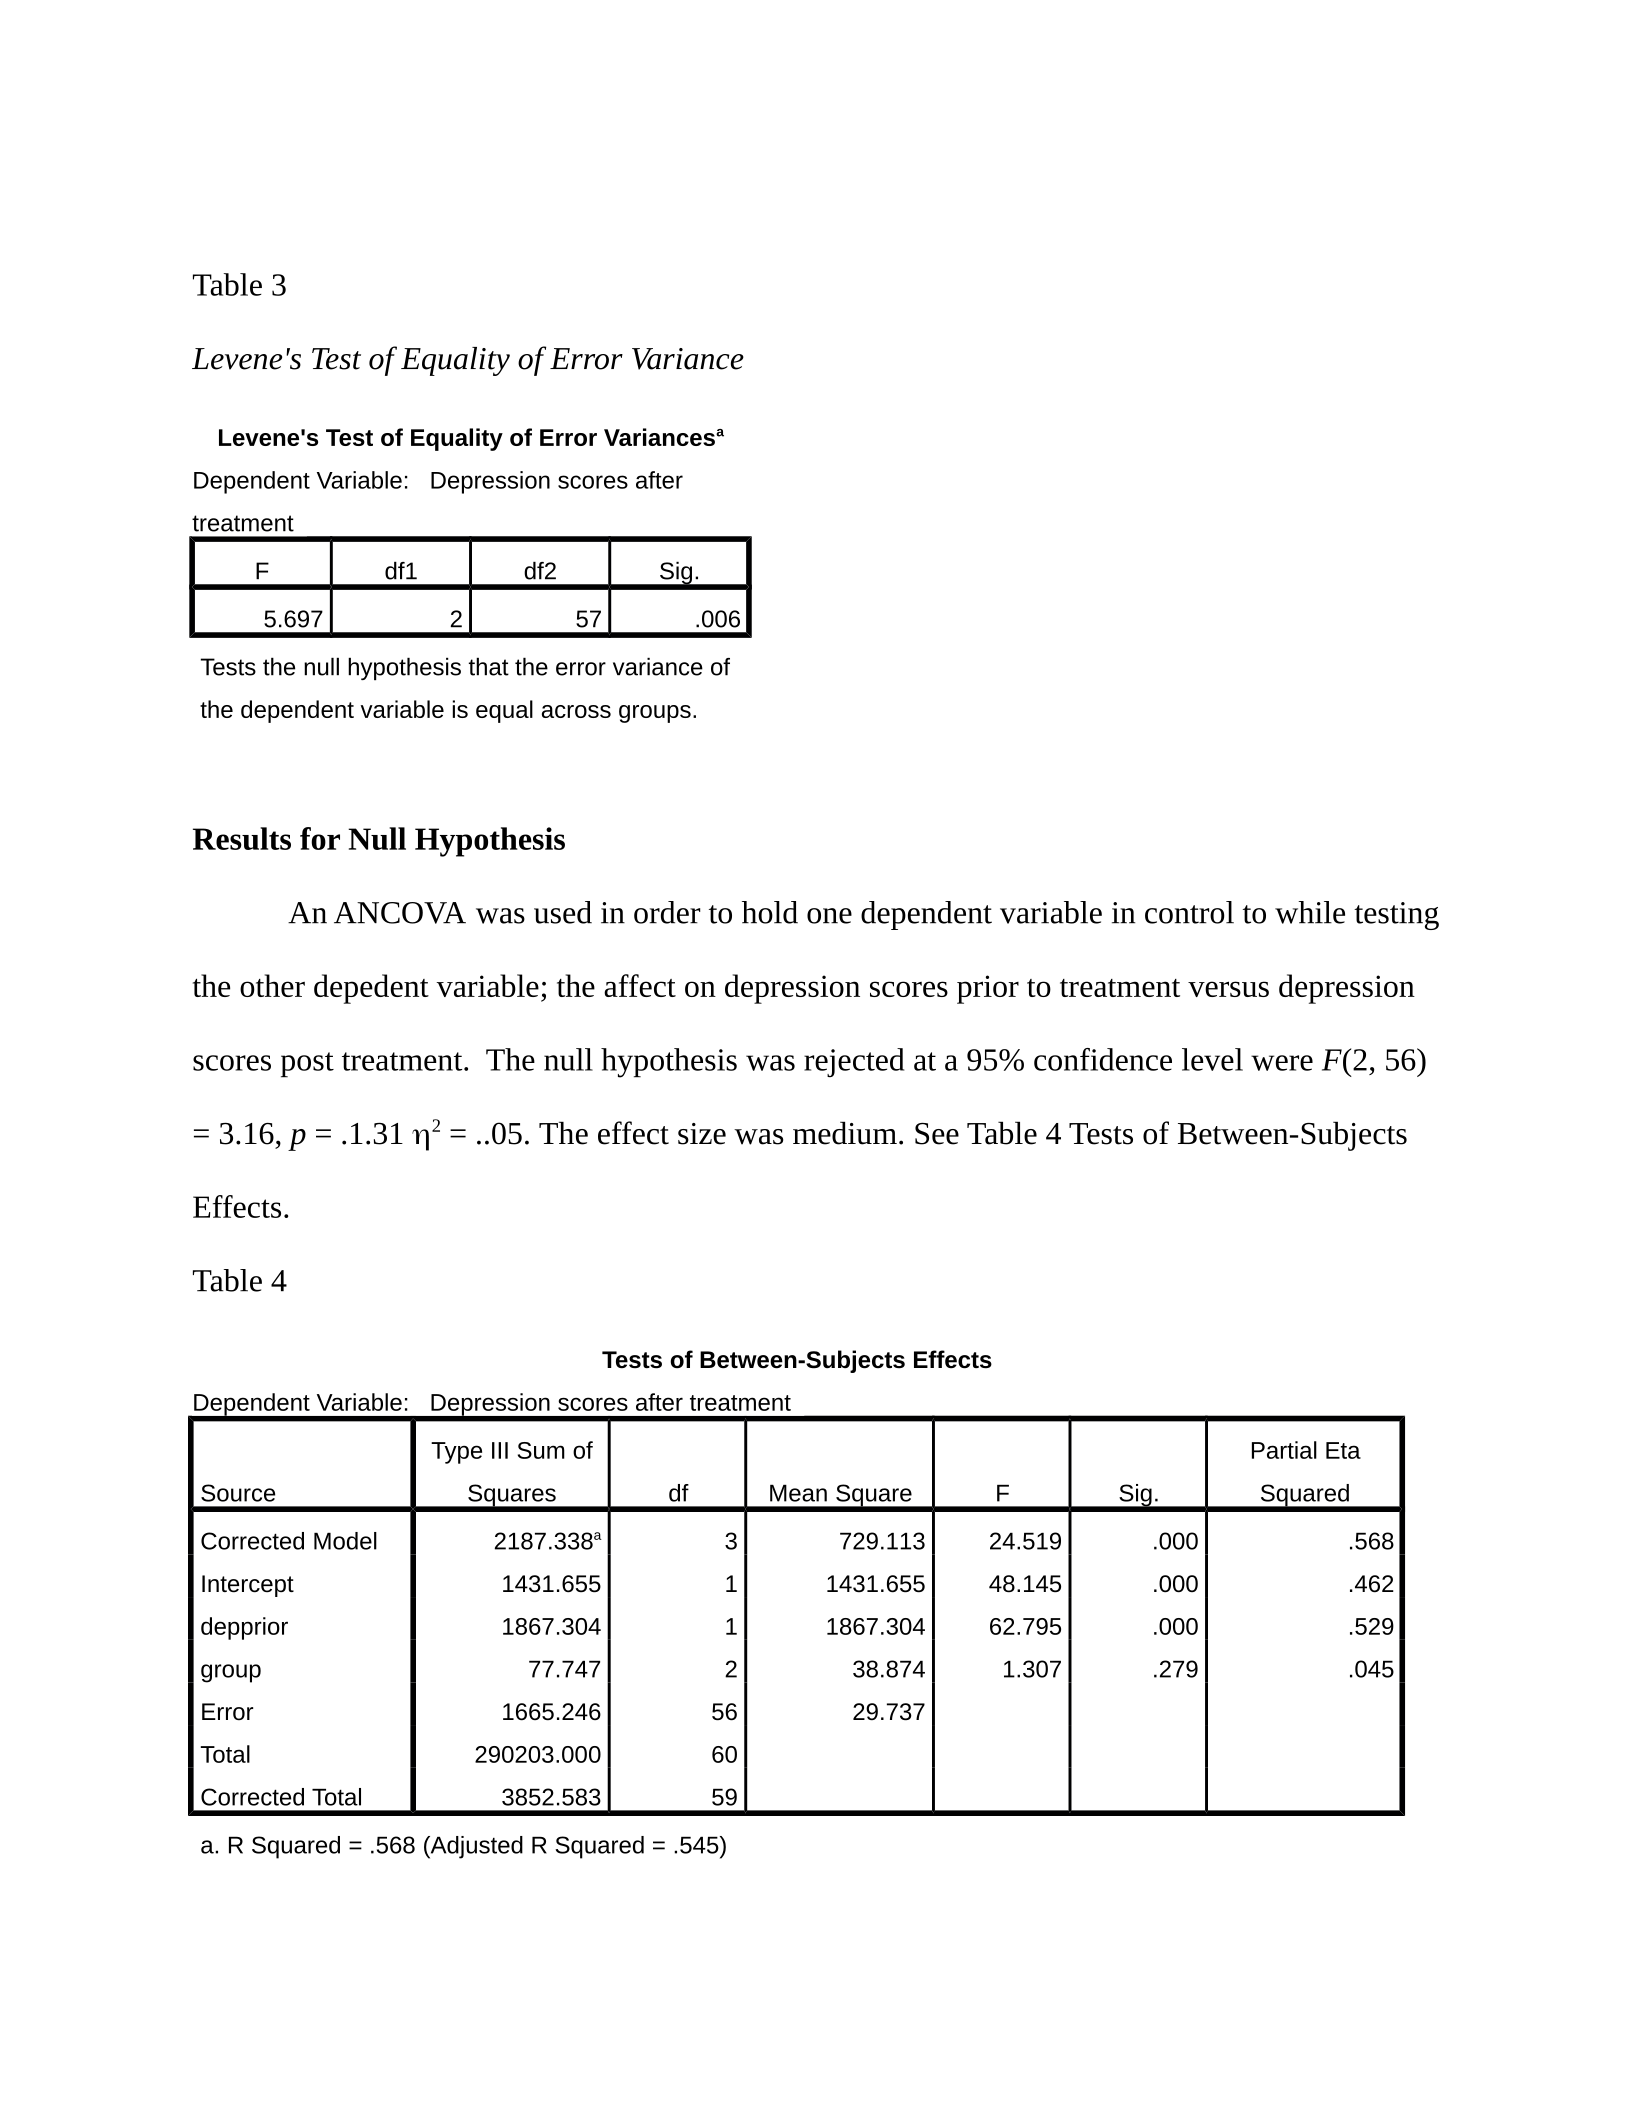
Table 3
Levene's Test of Equality of Error Variance
Levene's Test of Equality of Error Variancesa
Dependent Variable: Depression scores after
treatment
F df1 df2 Sig.
5.697 2 57 .006
Tests the null hypothesis that the error variance of
the dependent variable is equal across groups.
Results for Null Hypothesis
An ANCOVA was used in order to hold one dependent variable in control to while testing
the other depedent variable; the affect on depression scores prior to treatment versus depression
scores post treatment. The null hypothesis was rejected at a 95% confidence level were F(2, 56)
= 3.16, p = .1.31 2 = ..05. The effect size was medium. See Table 4 Tests of Between-Subjects
Effects.
Table 4
Tests of Between-Subjects Effects
Dependent Variable: Depression scores after treatment
Source
Type III Sum of
Squares df Mean Square F Sig.
Partial Eta
Squared
Corrected Model 2187.338a3 729.113 24.519 .000 .568
Intercept 1431.655 1 1431.655 48.145 .000 .462
depprior 1867.304 1 1867.304 62.795 .000 .529
group 77.747 2 38.874 1.307 .279 .045
Error 1665.246 56 29.737
Total 290203.000 60
Corrected Total 3852.583 59
a. R Squared = .568 (Adjusted R Squared = .545)
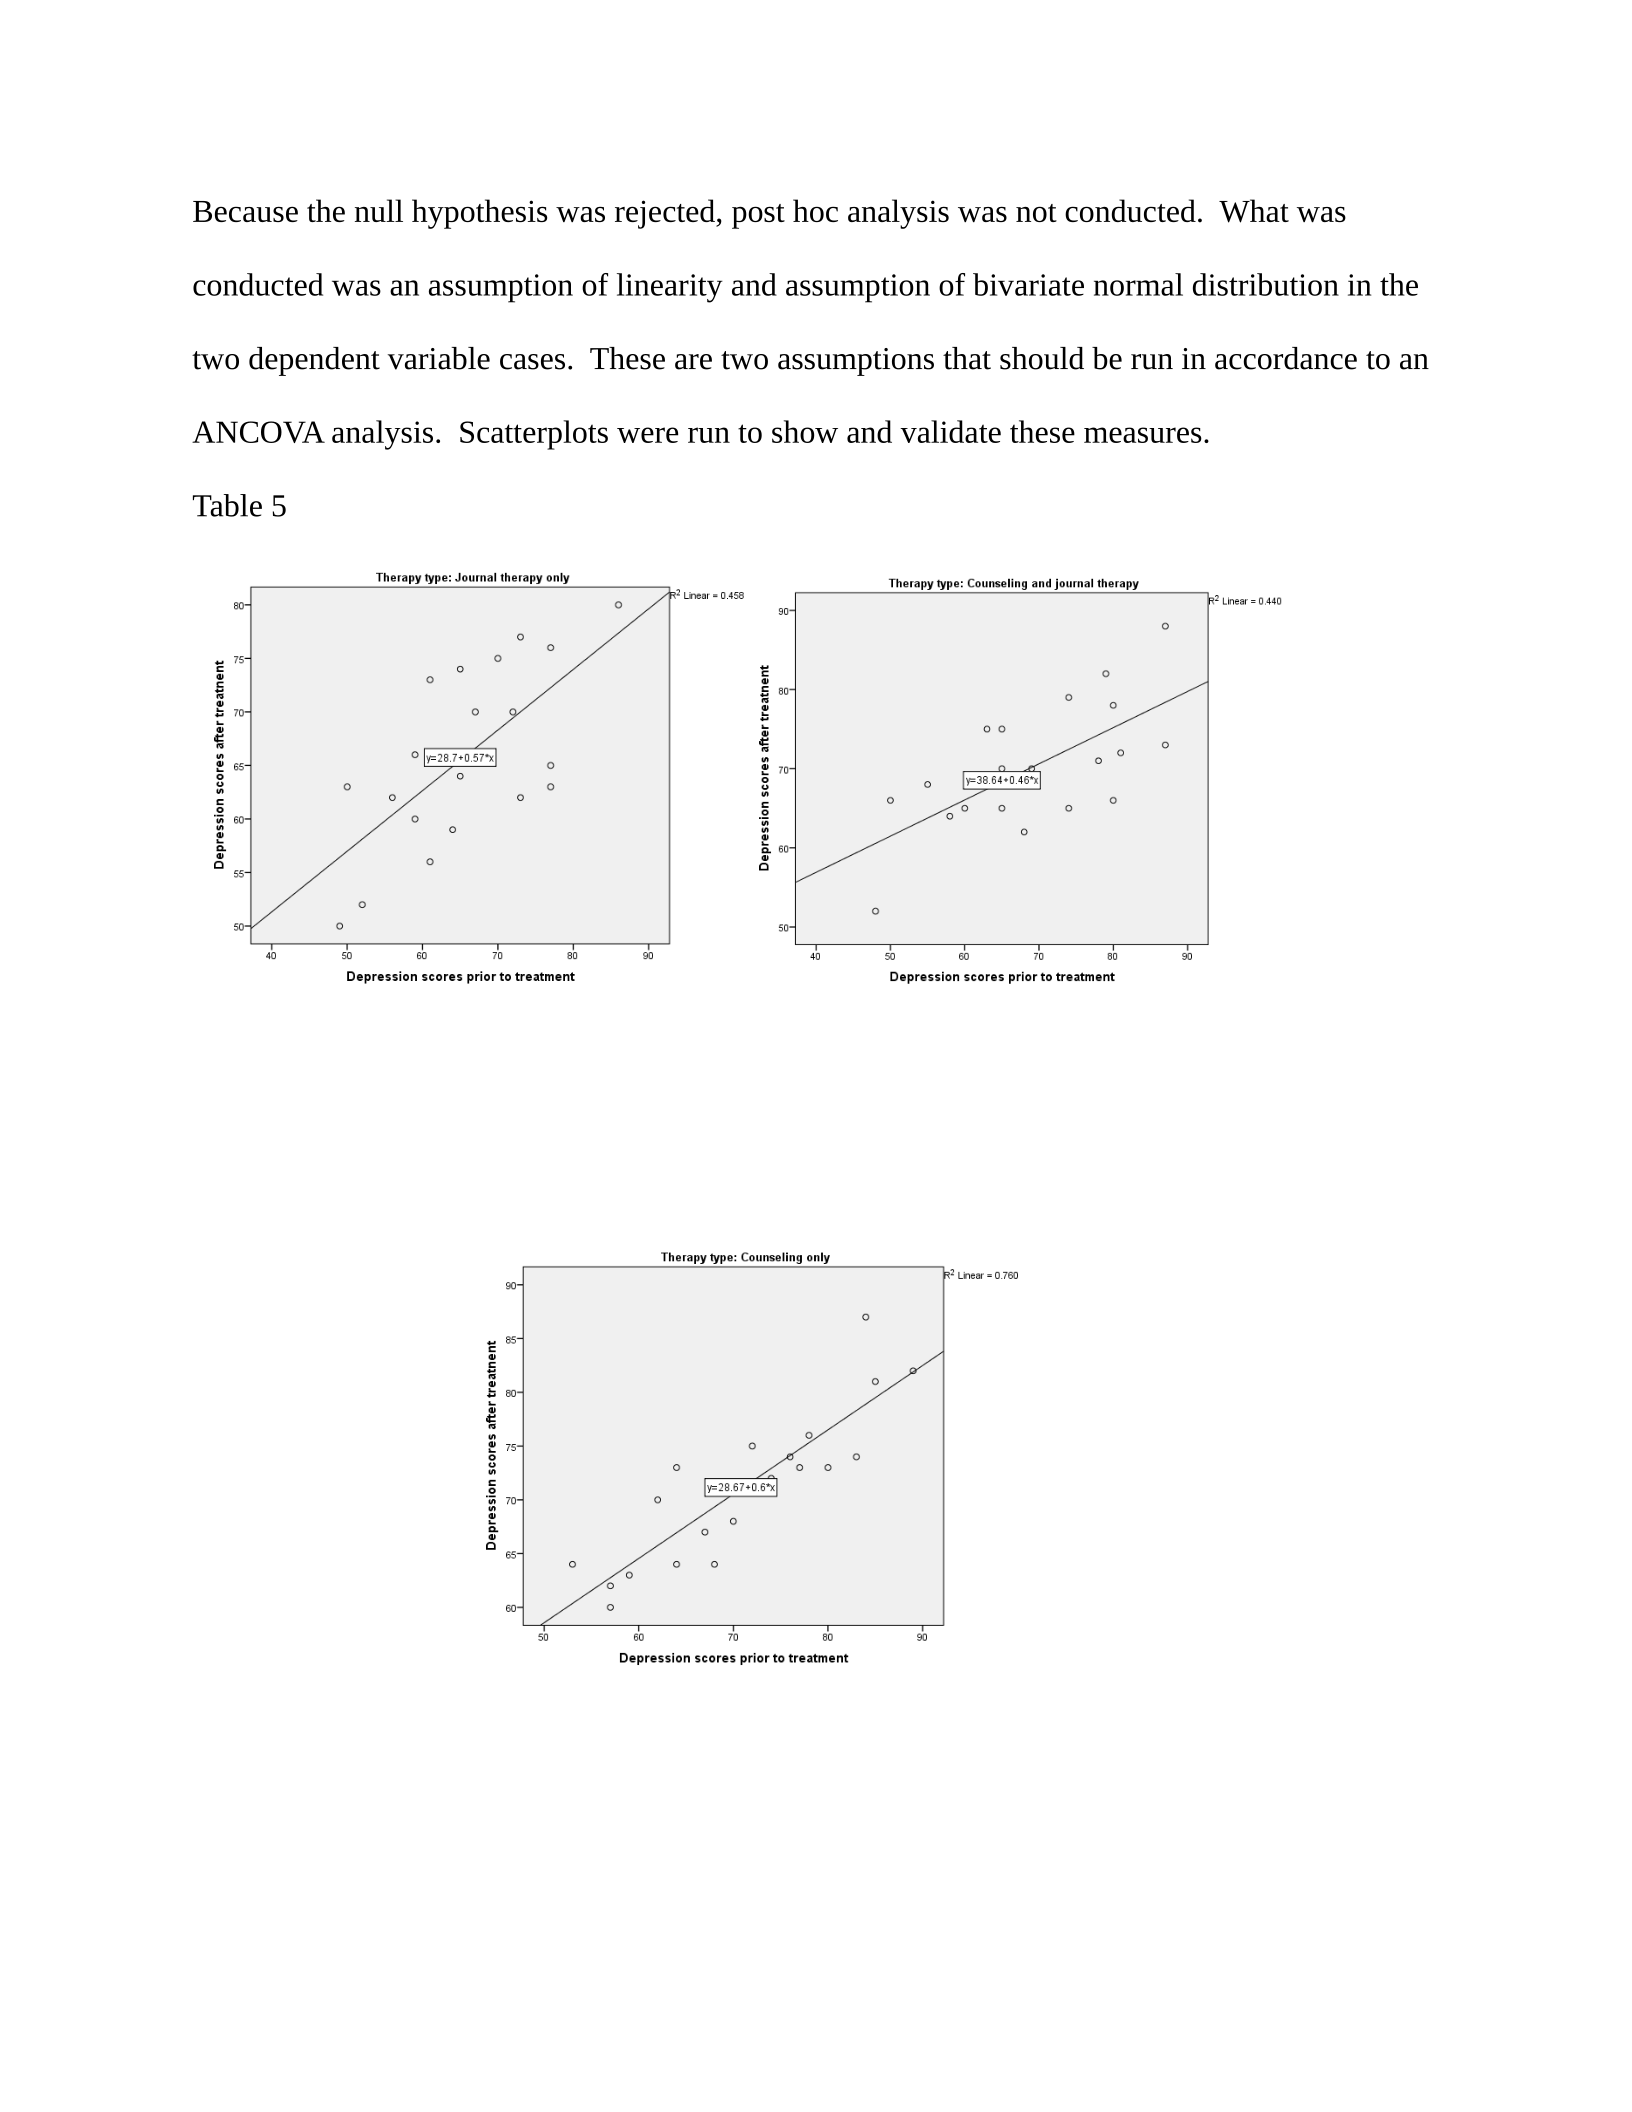
Because the null hypothesis was rejected, post hoc analysis was not conducted. What was
conducted was an assumption of linearity and assumption of bivariate normal distribution in the
two dependent variable cases. These are two assumptions that should be run in accordance to an
ANCOVA analysis. Scatterplots were run to show and validate these measures.
Table 5
Powered by TCPDF (www.tcpdf.org)

