


Nonparametric Statistics-Cast Study
NICHOLAS C. TICALI LIBERTY COLLEGE - EXSC520 14AUG2019
Instructions: To successfully complete this case study, all of the following instructions must be
adhered to. Only paste tables/figures that contain pertinent information. Only paste tables/
figures where you are instructed to do so. HIGHLIGHT (in yellow) only relevant the data from
tables; as well as your response to each question. In the write-up section, all information must be
provided in paragraph format. When statistical values are discussed, the numerical value must be
given and a reference must be made to the table(s)/figure(s) where the value(s) can be found. An
example of this is “heart rate was statistically greater during running versus cycling (189 vs. 143
bpm) as indicated in Table 1.
I. Mann-Whitney- U
Research question: “Did the temperature of the environment cause the group’s core
temperature to be ranked significantly different (smallest number = coldest core
temperature ranking, largest number = hottest core temperature ranking)?”
Table 1. PASTE Descriptive Statistics table BELOW
Descriptive Statistics
N Mean
Std.
Deviation
Minimu
m
Maximu
m
Core_temperature_R
anking
20 10.50 5.916 1 20
Environmental_Condi
tions
20 1.500 .5130 1.0 2.0
Table 2. PASTE Ranks table BELOW
Ranks
Environmental_Condi
tions N
Mean
Rank
Sum of
Ranks
Core_temperature_R
anking
Cold 10 7.90 79.00
Hot 10 13.10 131.00
Total 20
1
Nonparametric Statistics-Cast Study
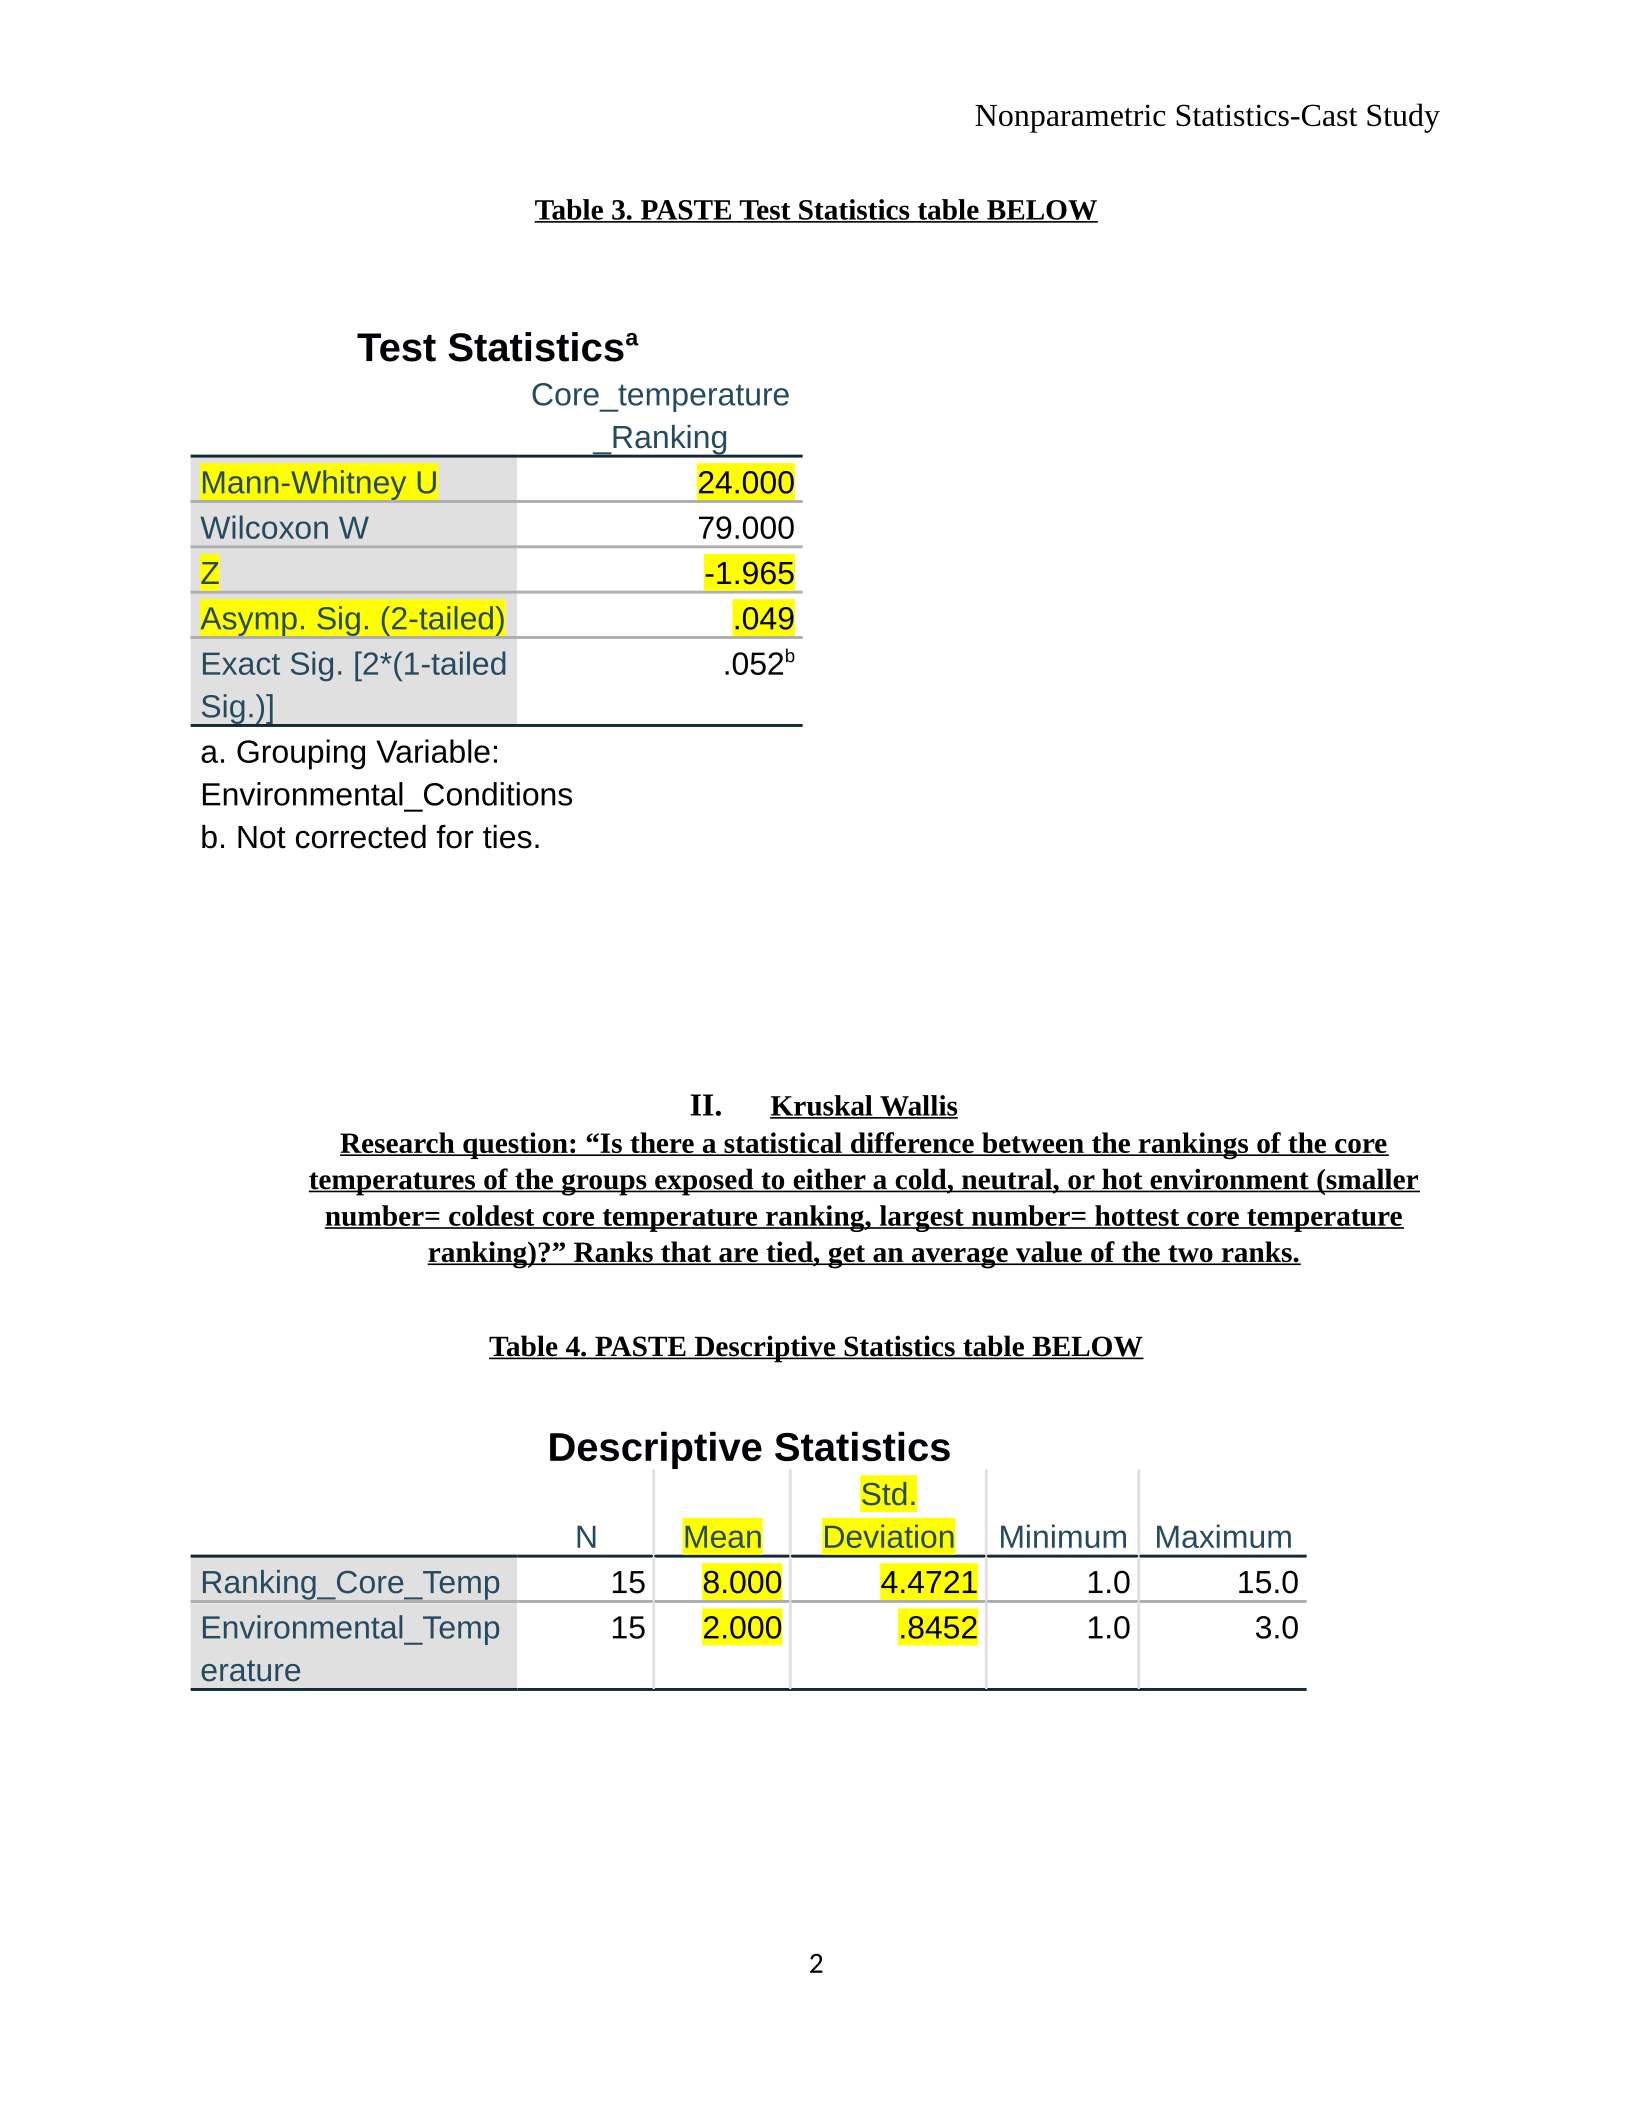
Table 3. PASTE Test Statistics table BELOW
Test Statisticsa
Core_temperature
_Ranking
Mann-Whitney U 24.000
Wilcoxon W 79.000
Z-1.965
Asymp. Sig. (2-tailed) .049
Exact Sig. [2*(1-tailed
Sig.)]
.052b
a. Grouping Variable:
Environmental_Conditions
b. Not corrected for ties.
II. Kruskal Wallis
Research question: “Is there a statistical difference between the rankings of the core
temperatures of the groups exposed to either a cold, neutral, or hot environment (smaller
number= coldest core temperature ranking, largest number= hottest core temperature
ranking)?” Ranks that are tied, get an average value of the two ranks.
Table 4. PASTE Descriptive Statistics table BELOW
Descriptive Statistics
N Mean
Std.
Deviation Minimum Maximum
Ranking_Core_Temp 15 8.000 4.4721 1.0 15.0
Environmental_Temp
erature
15 2.000 .8452 1.0 3.0
2
Nonparametric Statistics-Cast Study
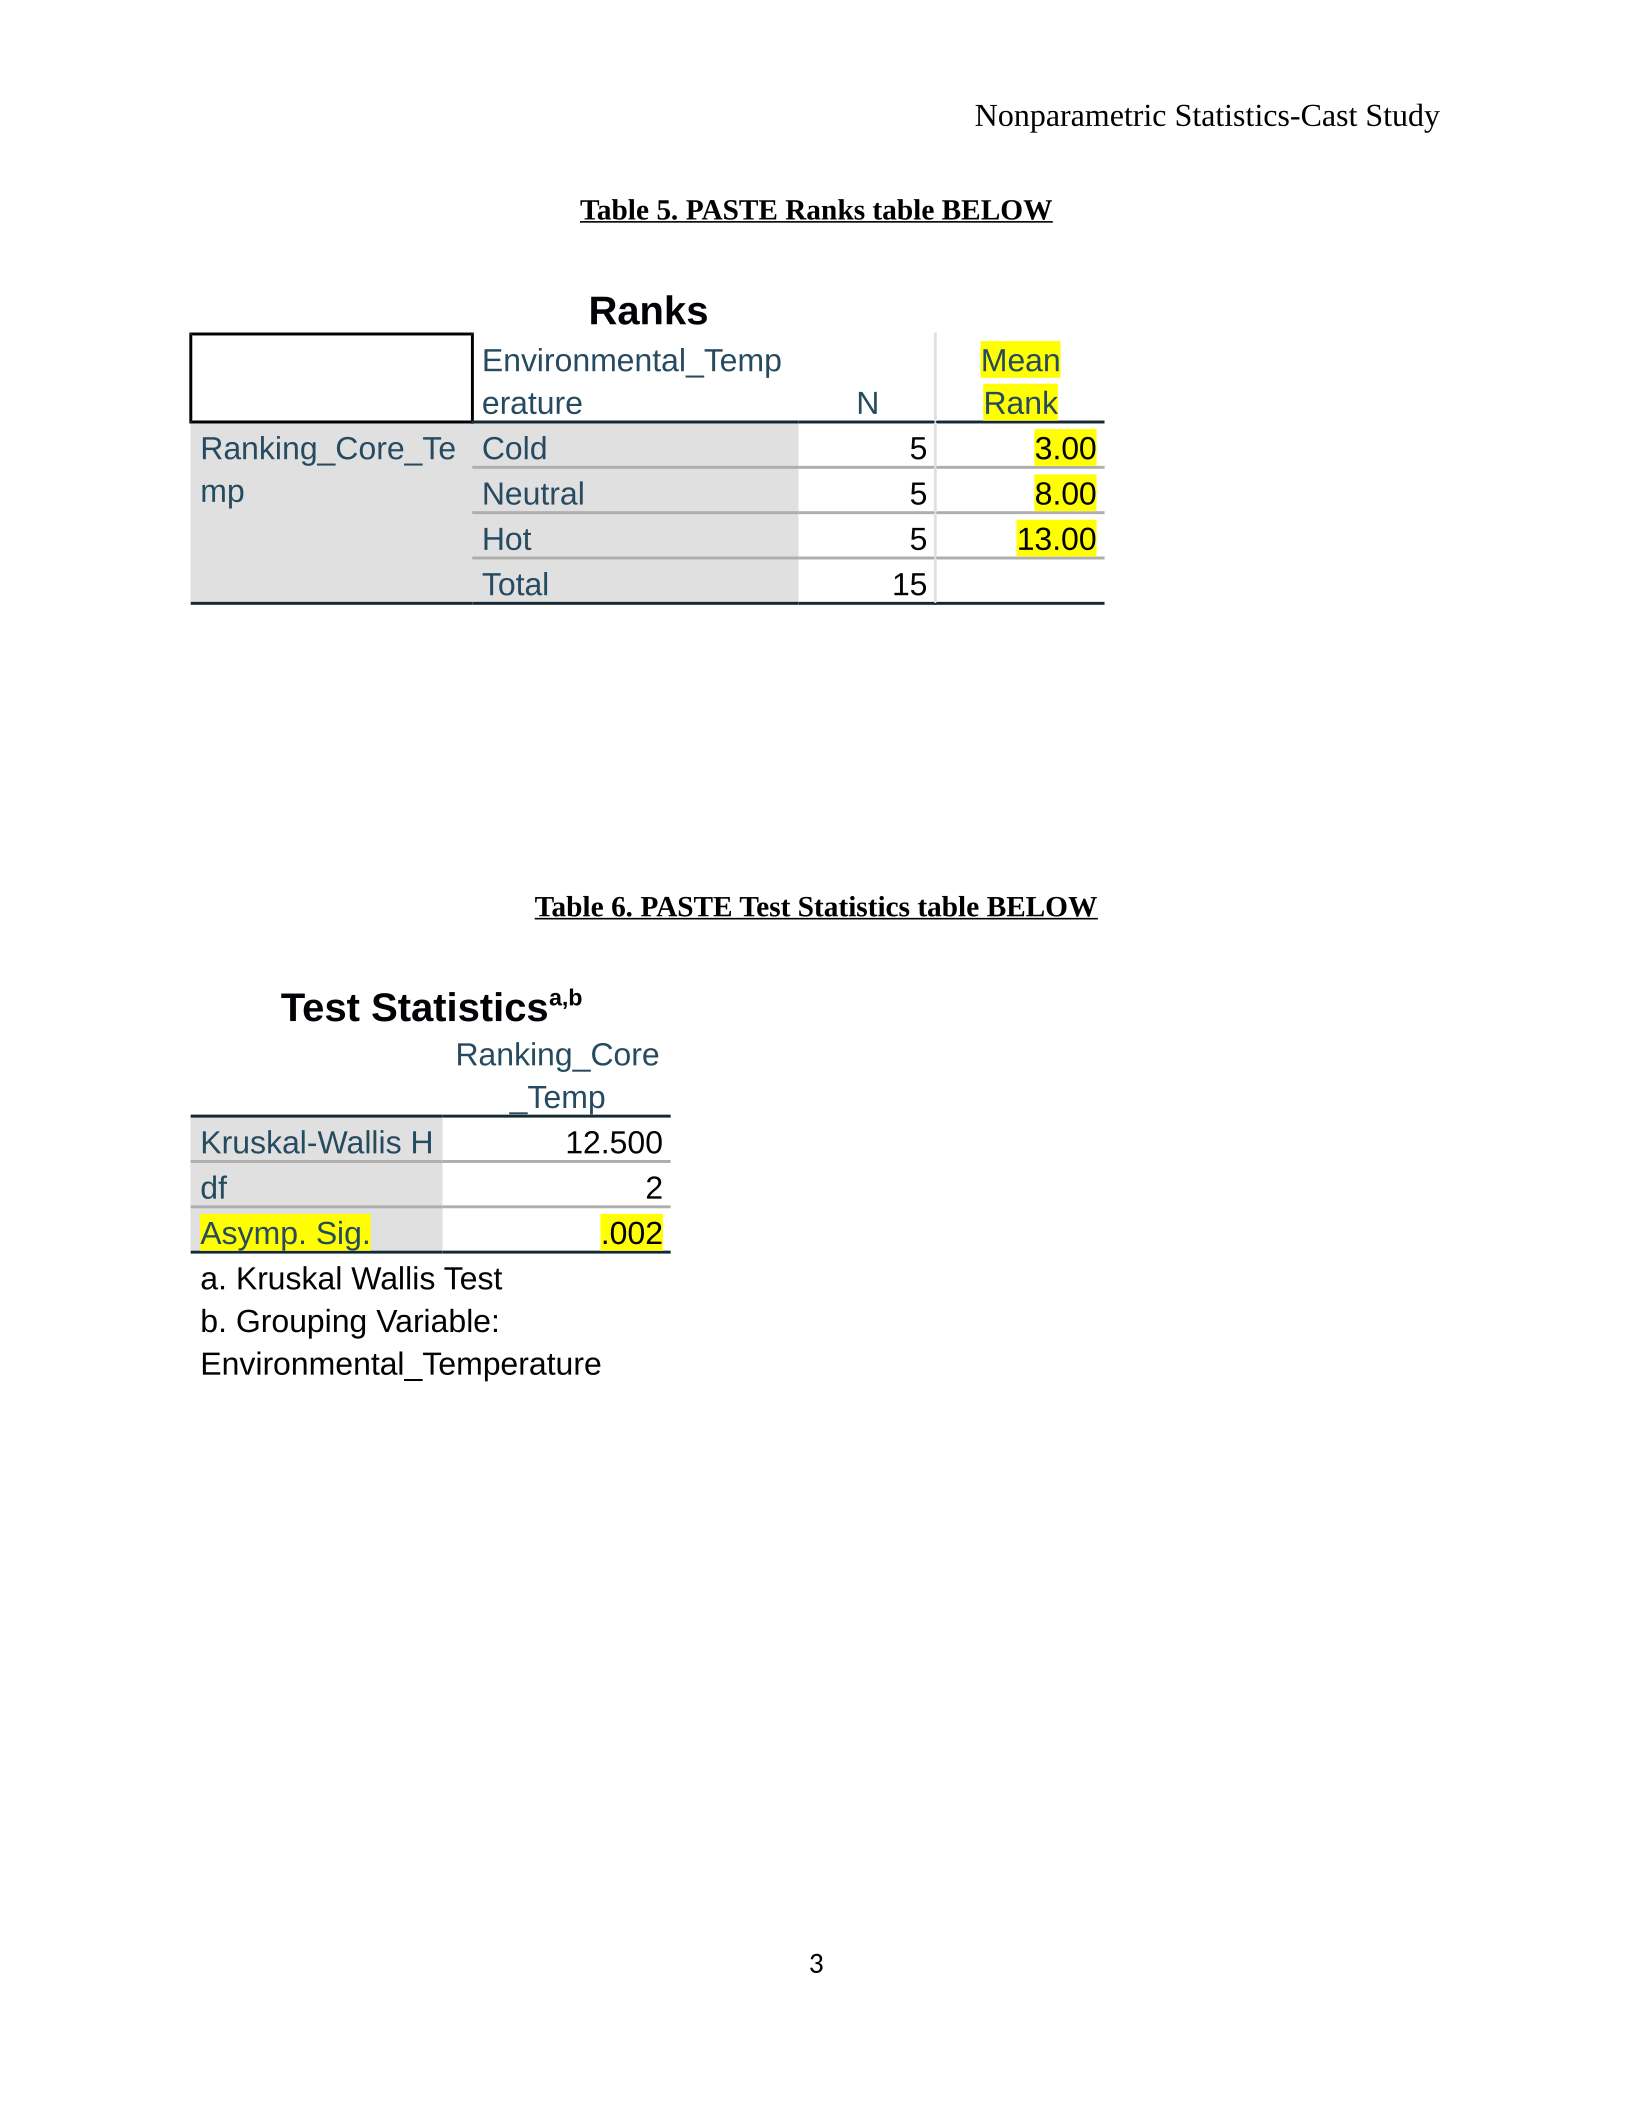
Table 5. PASTE Ranks table BELOW
Ranks
Environmental_Temp
erature N
Mean
Rank
Ranking_Core_Te
mp
Cold 5 3.00
Neutral 5 8.00
Hot 5 13.00
Total 15
Table 6. PASTE Test Statistics table BELOW
Test Statisticsa,b
Ranking_Core
_Temp
Kruskal-Wallis H 12.500
df 2
Asymp. Sig. .002
a. Kruskal Wallis Test
b. Grouping Variable:
Environmental_Temperature
3

Nonparametric Statistics-Cast Study
III. Friedman’s Test
Research question: “Which conditions (no music, slow music or upbeat music) were more favorable
to participants while running on a treadmill? Smallest number= most favorable, largest number=
least favorable.
Table 7. PASTE Descriptive Statistics table BELOW
Descriptive Statistics
N Mean
Std.
Deviation
Minimu
m
Maximu
m
Slow_music 10 2.800 .4216 2.0 3.0
Upbeat_mus
ic
10 1.400 .5164 1.0 2.0
No_Music 10 1.800 .7888 1.0 3.0
Table 8. PASTE Ranks table BELOW
4
Ranks
Mean Rank
Slow_music 2.80
Upbeat_music 1.40
No_Music 1.80
Nonparametric Statistics-Cast Study
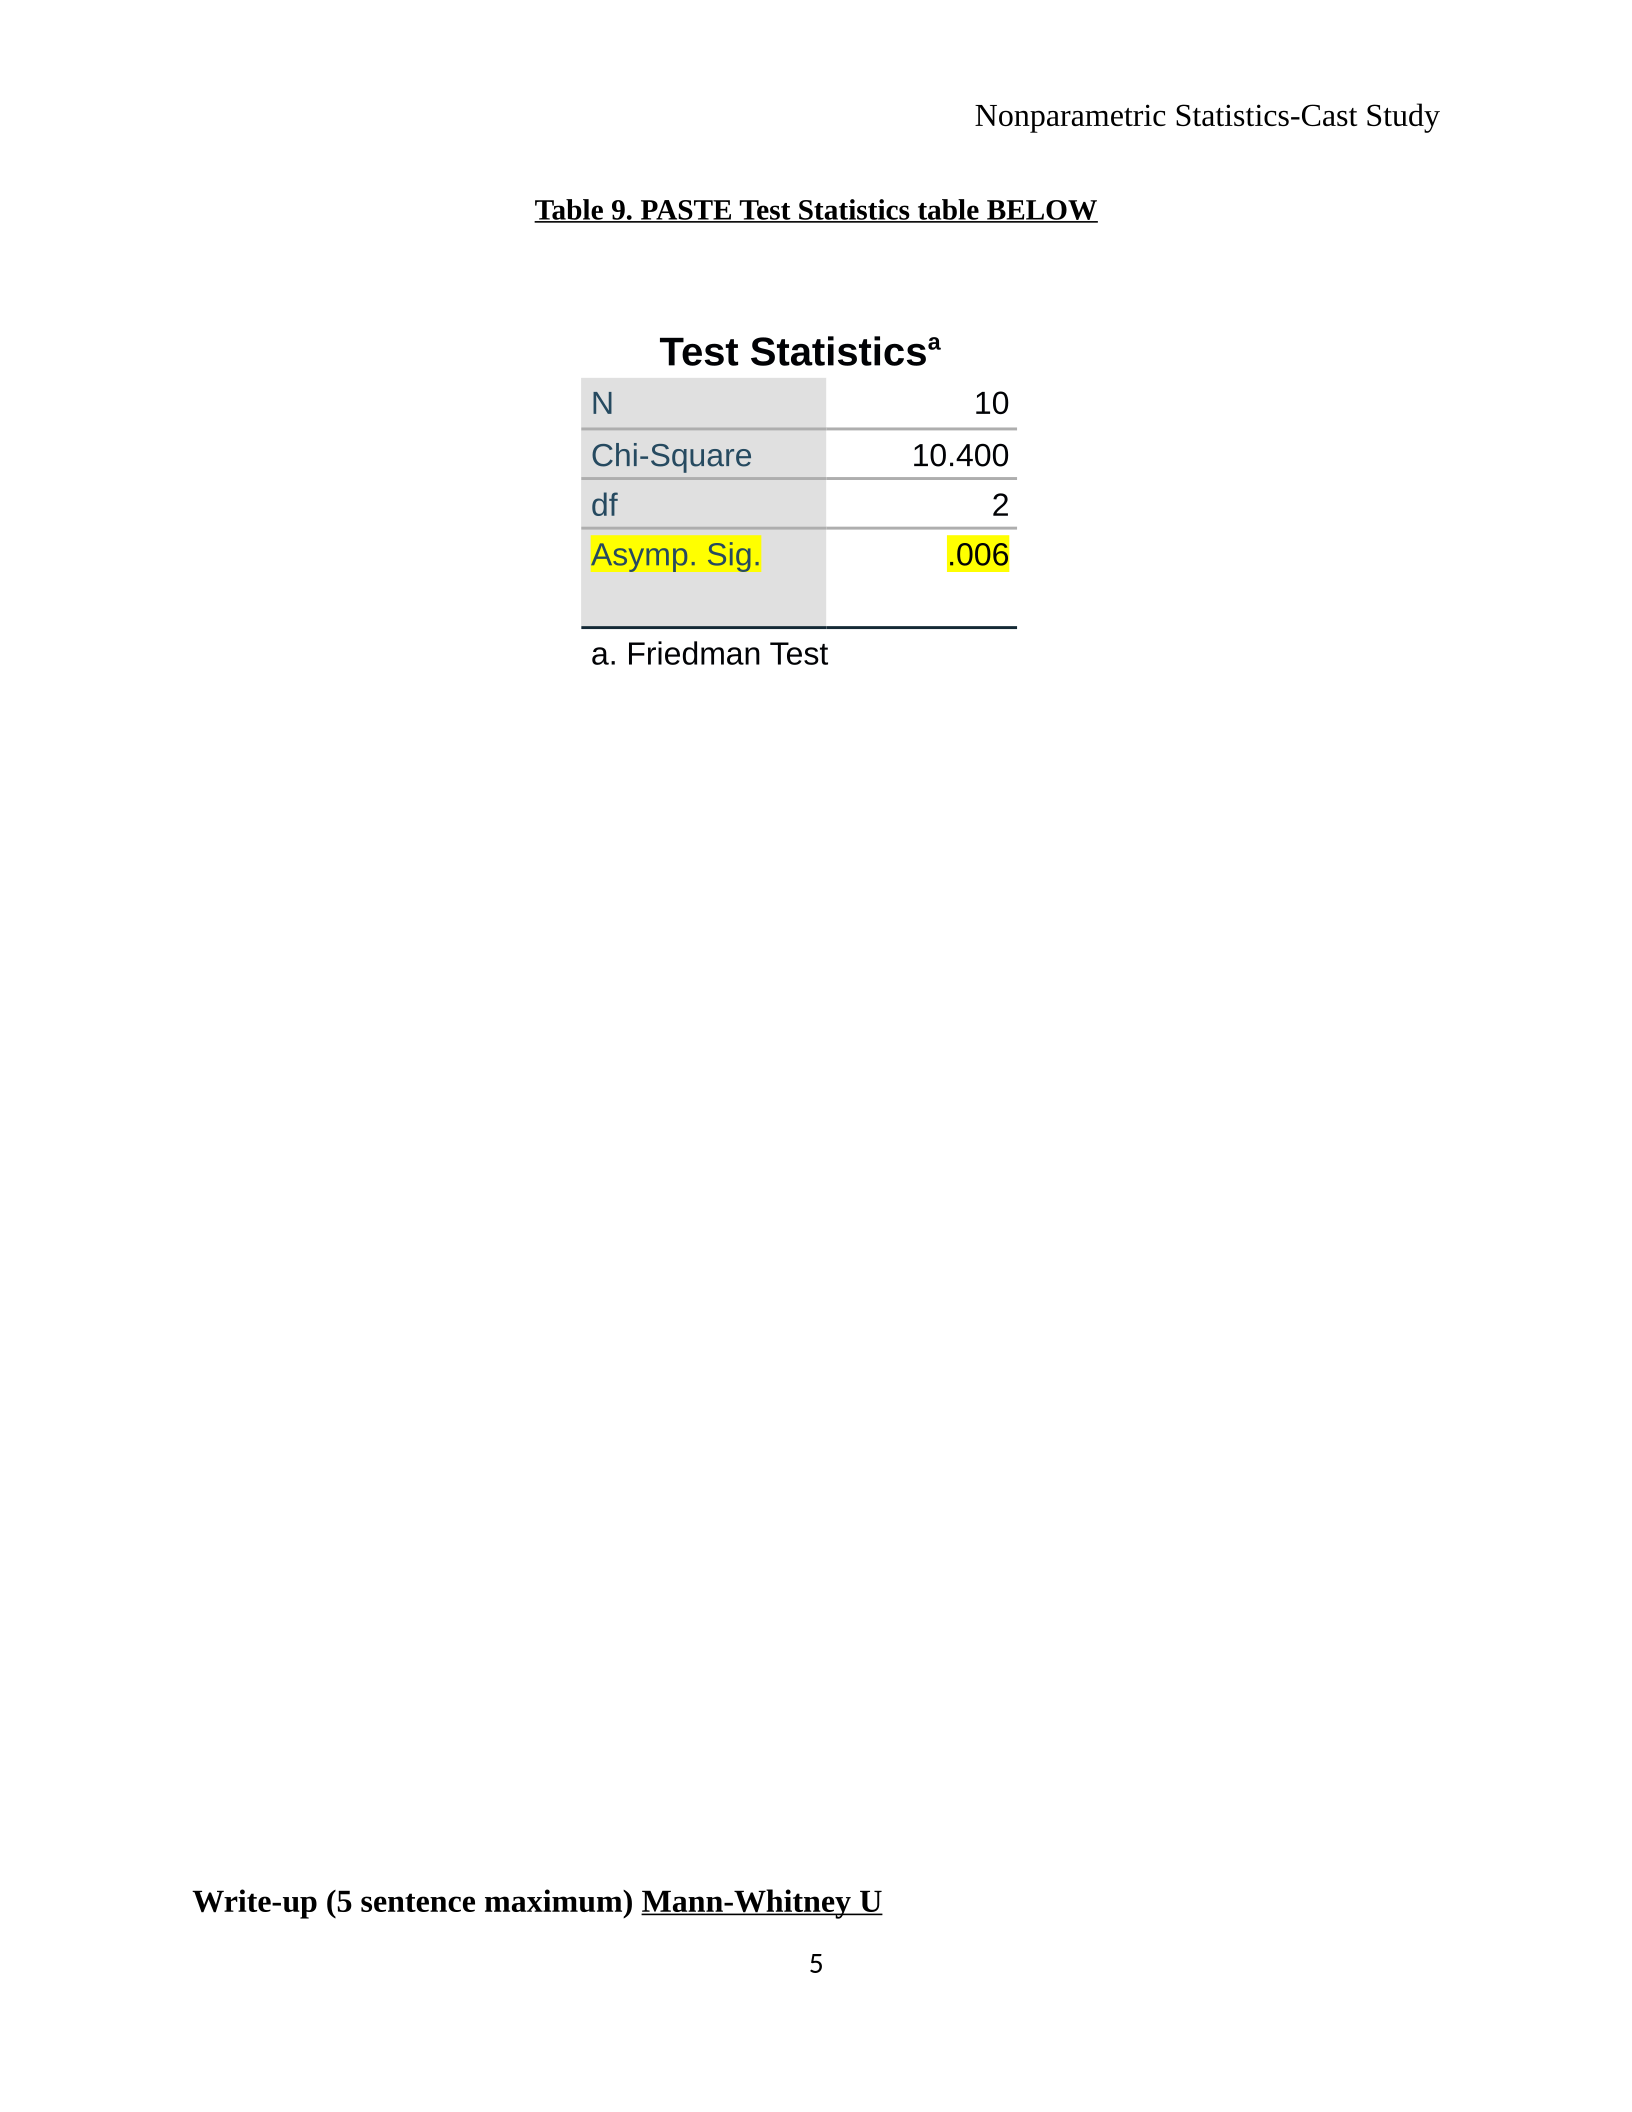
Table 9. PASTE Test Statistics table BELOW
Test Statisticsa
N10
Chi-Square 10.400
df 2
Asymp. Sig. .006
a. Friedman Test
Write-up (5 sentence maximum) Mann-Whitney U
5
Nonparametric Statistics-Cast Study
The write-up must include the following items:
1. What is the research question?
2. What is the mean and standard deviation for each group?
3. What is the MEAN RANK for EACH group?
4. What is the Mann-Whitney U value?
5. Was the analysis significant? How do you know? What was the sig value?
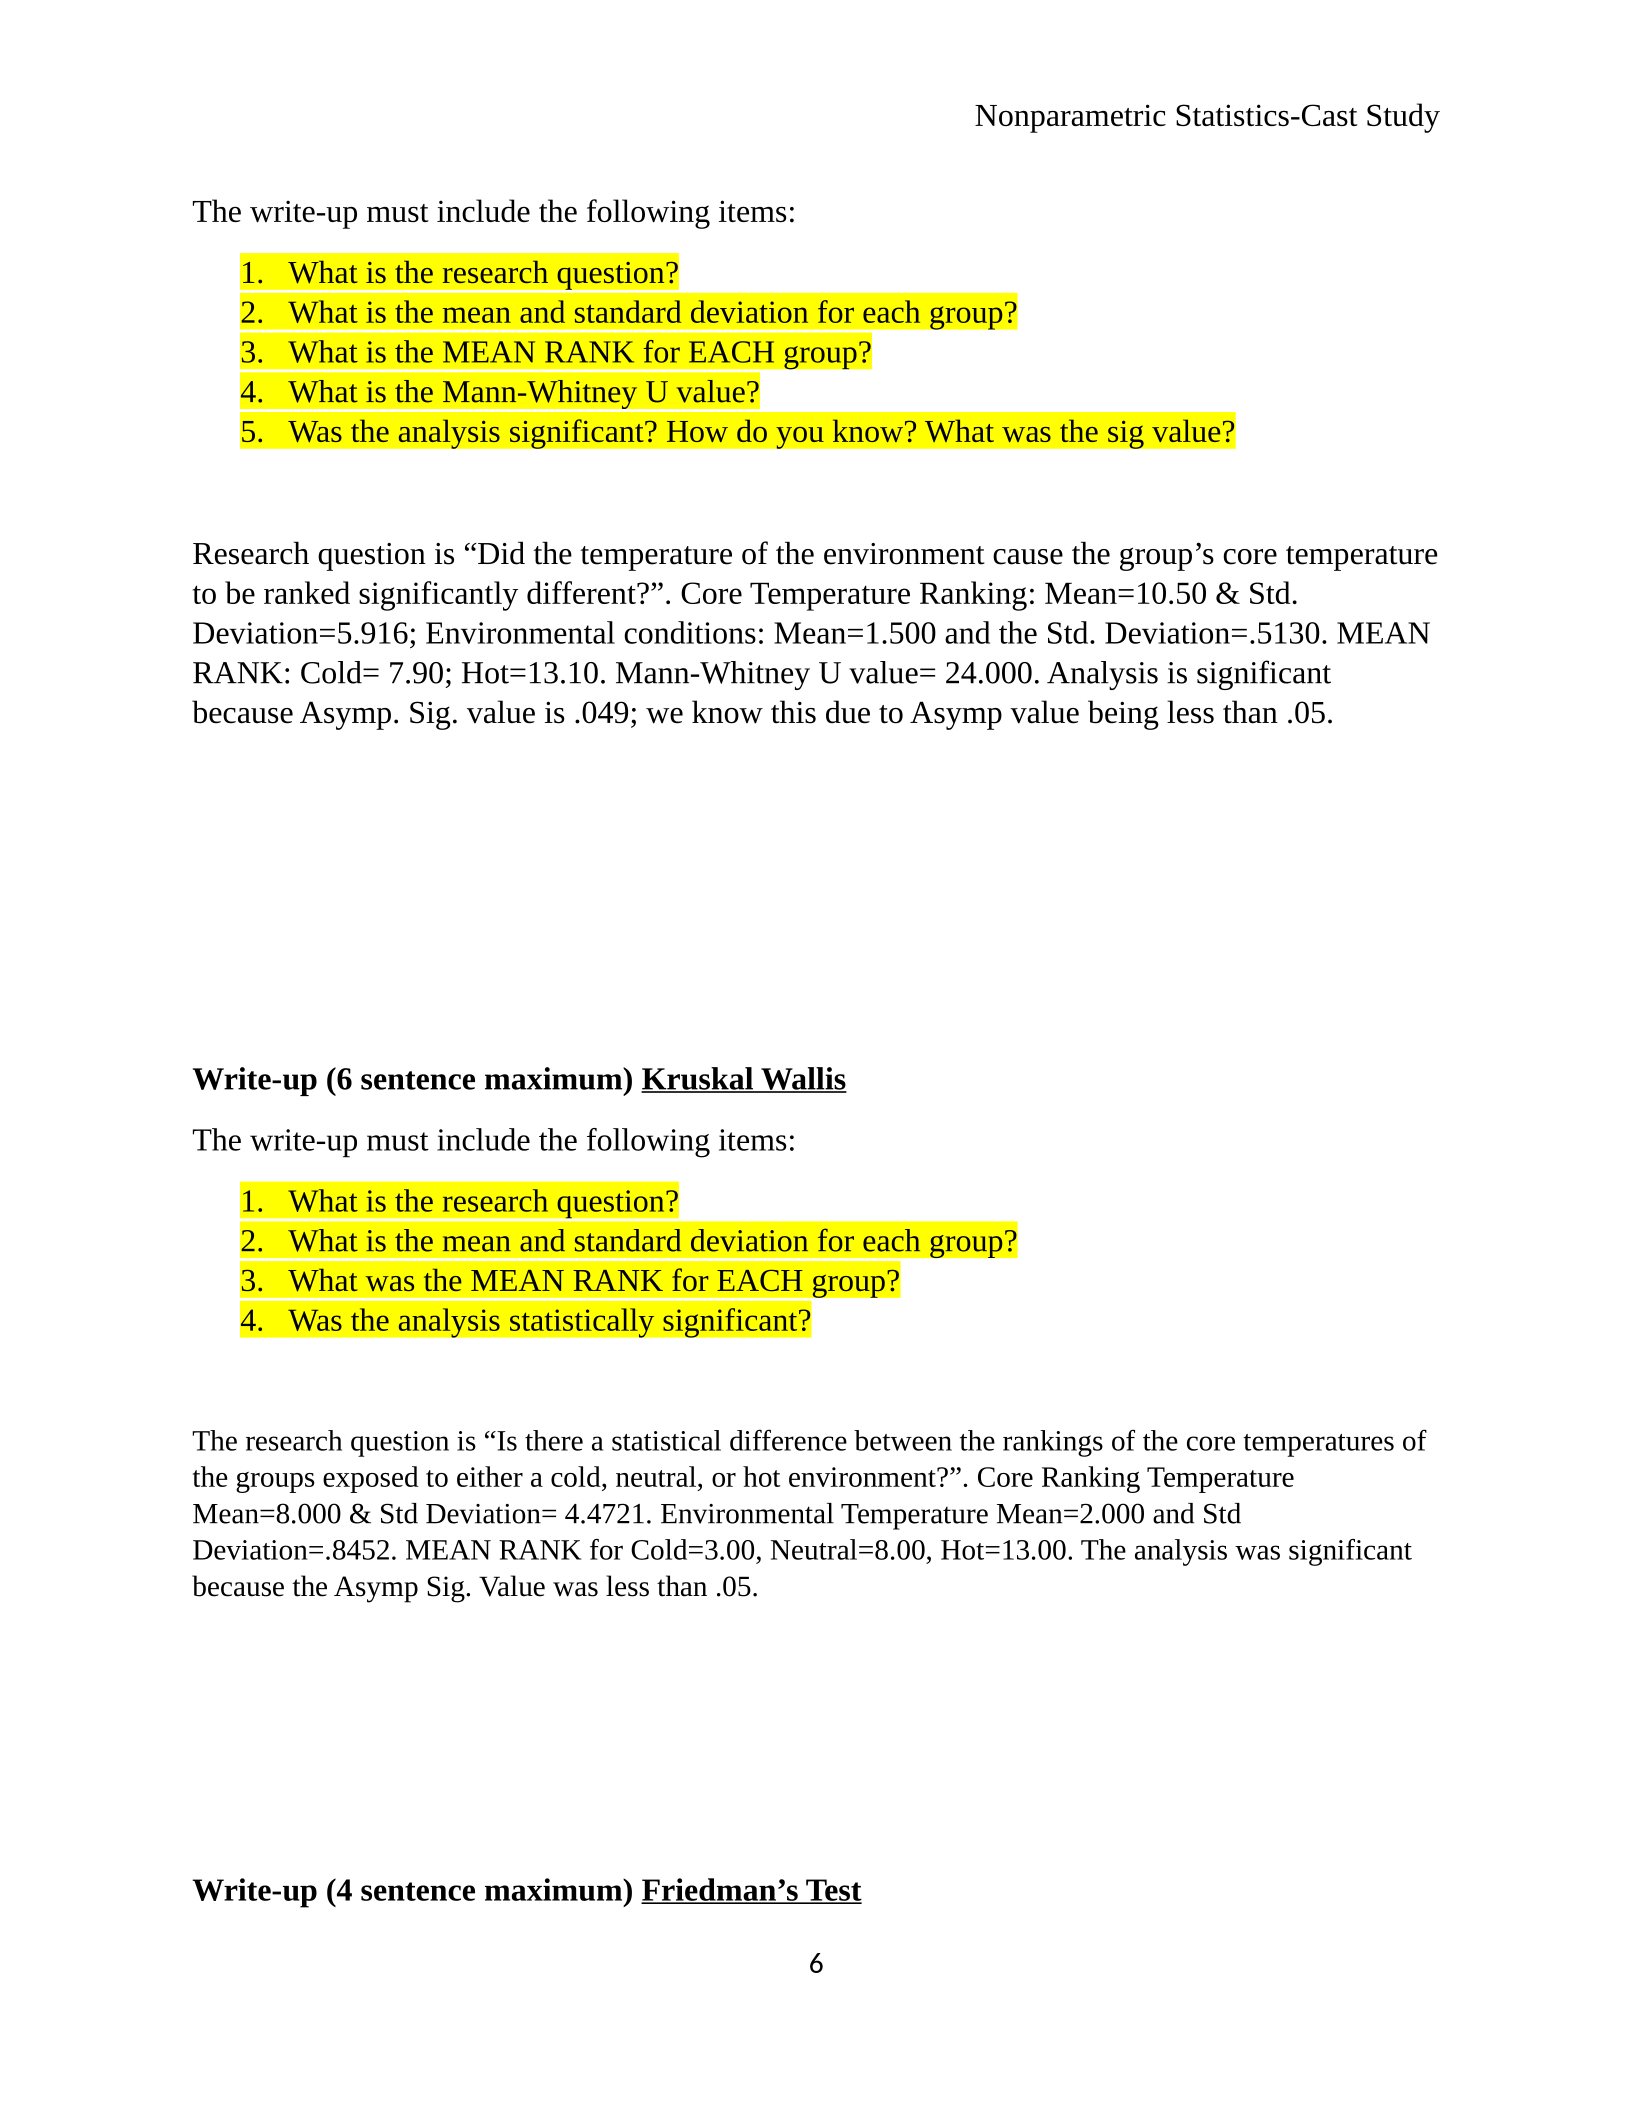
Research question is “Did the temperature of the environment cause the group’s core temperature
to be ranked significantly different?”. Core Temperature Ranking: Mean=10.50 & Std.
Deviation=5.916; Environmental conditions: Mean=1.500 and the Std. Deviation=.5130. MEAN
RANK: Cold= 7.90; Hot=13.10. Mann-Whitney U value= 24.000. Analysis is significant
because Asymp. Sig. value is .049; we know this due to Asymp value being less than .05.
Write-up (6 sentence maximum) Kruskal Wallis
The write-up must include the following items:
1. What is the research question?
2. What is the mean and standard deviation for each group?
3. What was the MEAN RANK for EACH group?
4. Was the analysis statistically significant?
The research question is “Is there a statistical difference between the rankings of the core temperatures of
the groups exposed to either a cold, neutral, or hot environment?”. Core Ranking Temperature
Mean=8.000 & Std Deviation= 4.4721. Environmental Temperature Mean=2.000 and Std
Deviation=.8452. MEAN RANK for Cold=3.00, Neutral=8.00, Hot=13.00. The analysis was significant
because the Asymp Sig. Value was less than .05.
Write-up (4 sentence maximum) Friedman’s Test
6
Nonparametric Statistics-Cast Study
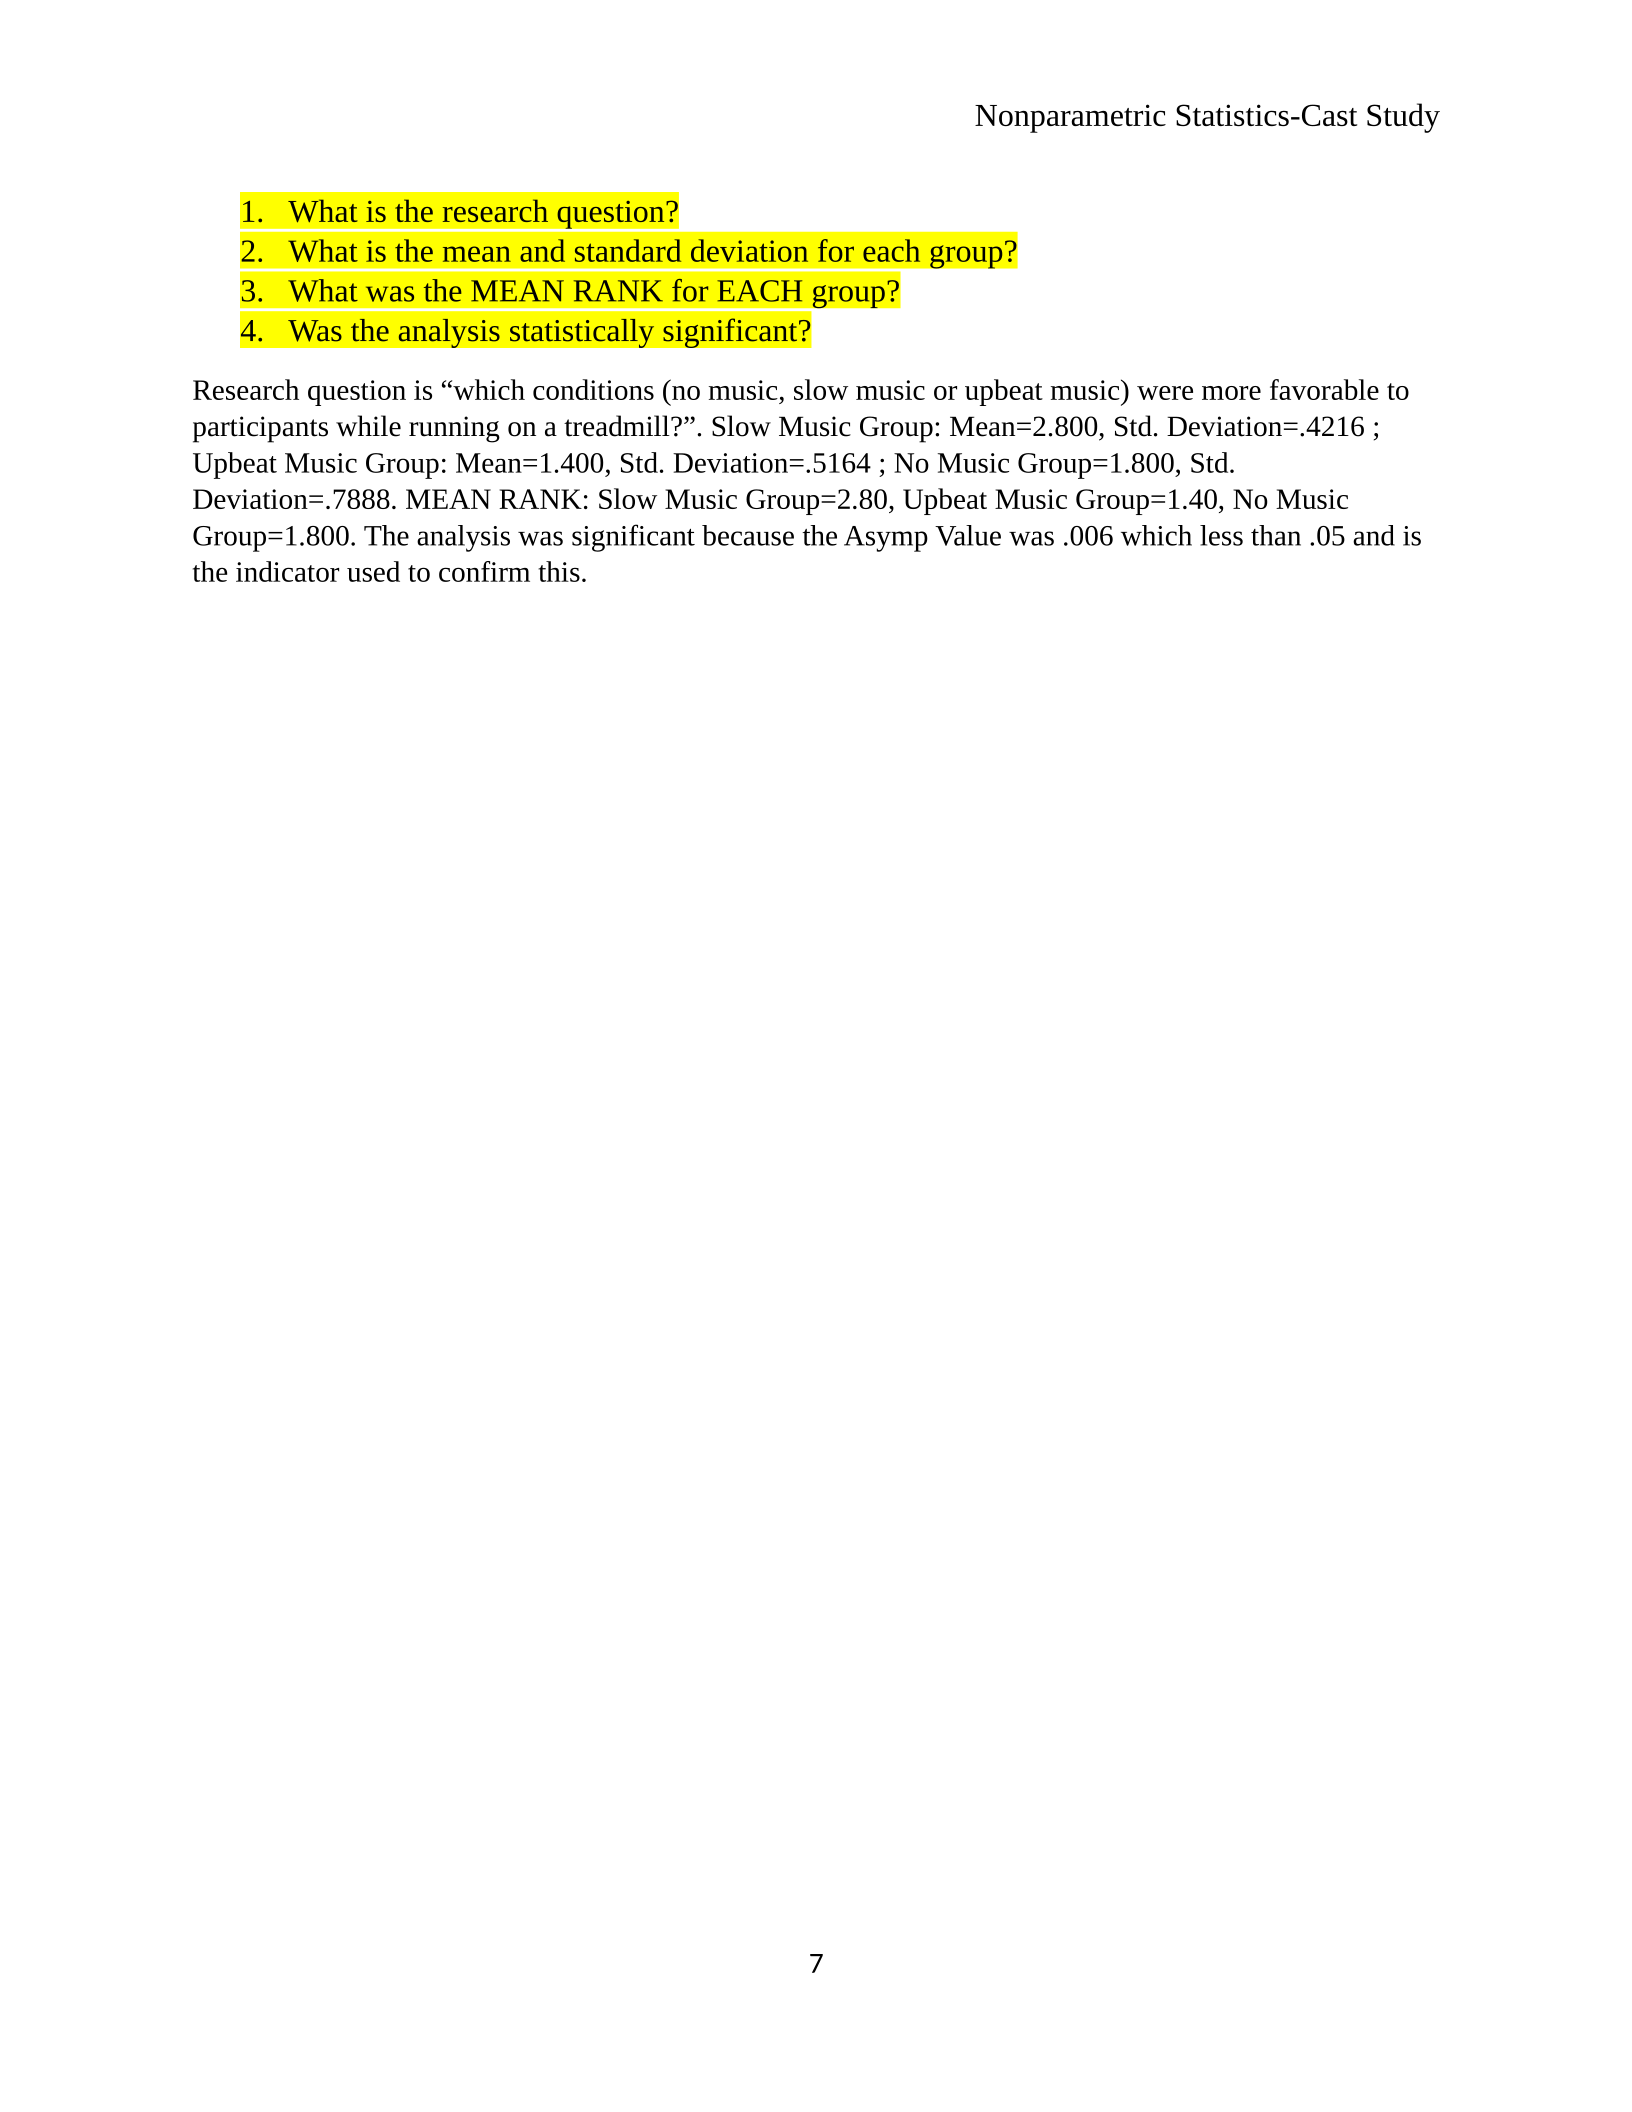
1. What is the research question?
2. What is the mean and standard deviation for each group?
3. What was the MEAN RANK for EACH group?
4. Was the analysis statistically significant?
Research question is “which conditions (no music, slow music or upbeat music) were more favorable to
participants while running on a treadmill?”. Slow Music Group: Mean=2.800, Std. Deviation=.4216 ;
Upbeat Music Group: Mean=1.400, Std. Deviation=.5164 ; No Music Group=1.800, Std.
Deviation=.7888. MEAN RANK: Slow Music Group=2.80, Upbeat Music Group=1.40, No Music
Group=1.800. The analysis was significant because the Asymp Value was .006 which less than .05 and is
the indicator used to confirm this.
7
Powered by TCPDF (www.tcpdf.org)

