ENGR 133, Problem Set 3: Advanced Plotting
Authored by: Joseph Melchior on 2/6/2023
5.4
clear, clc, close all
% Initiate the array
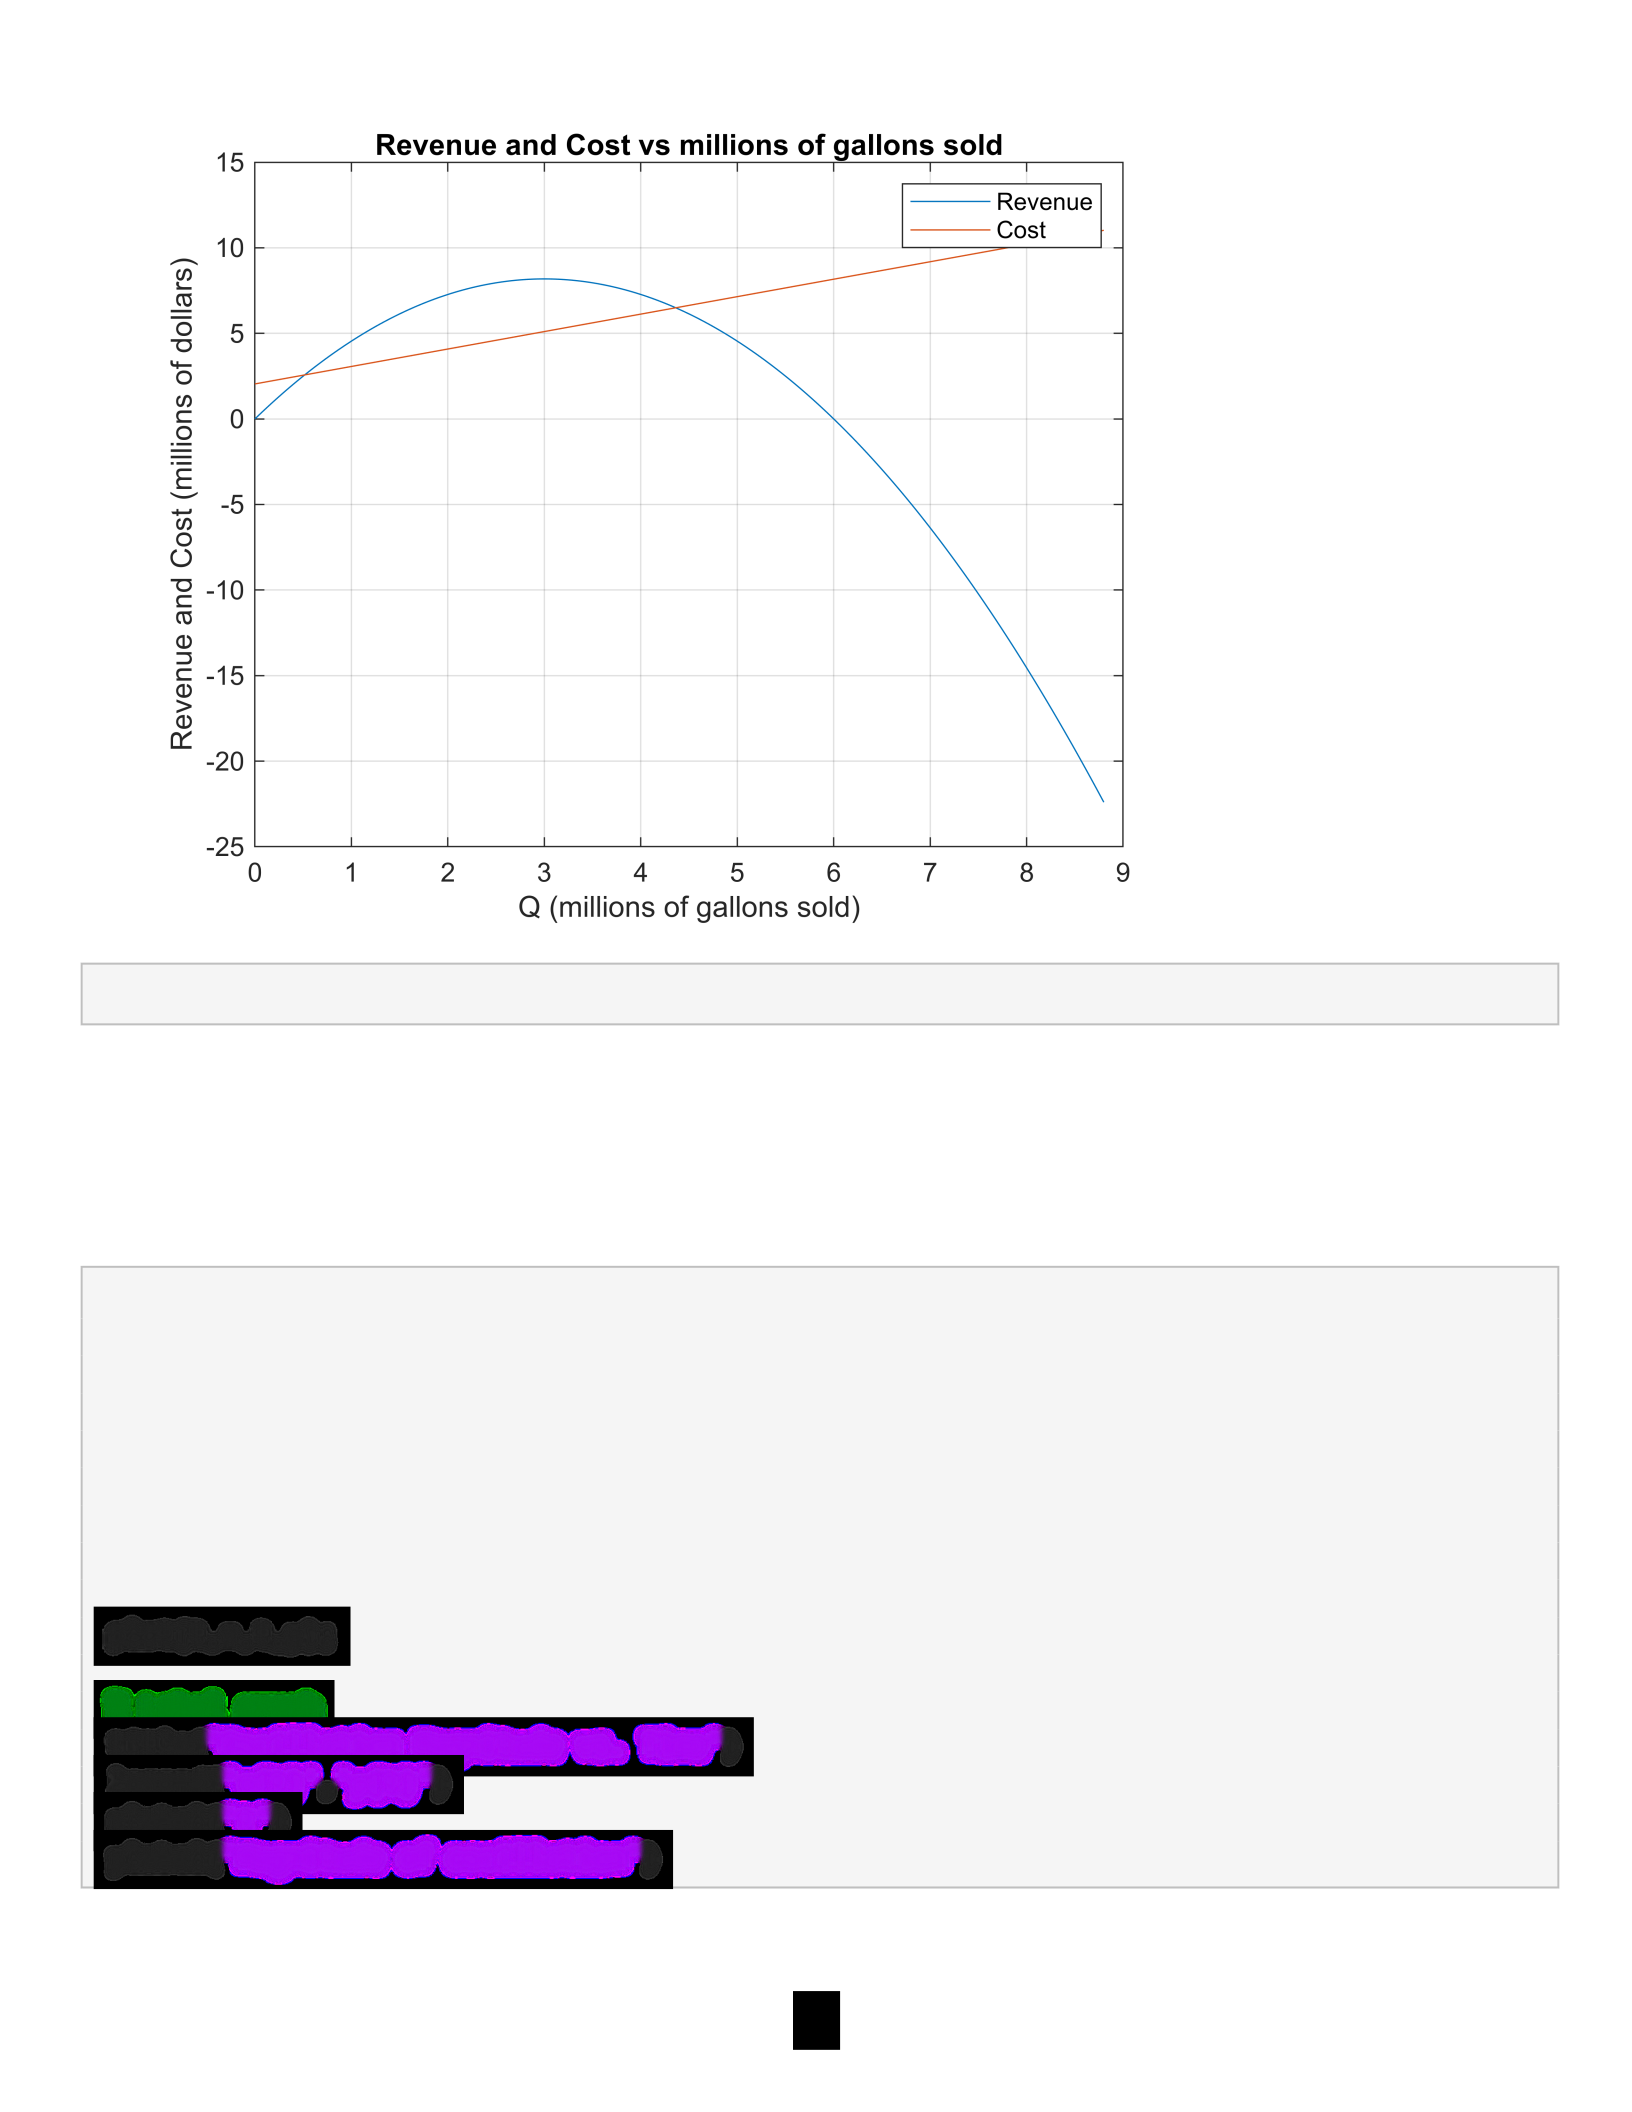
P = (0:.01:8)*1.1e+6;
% Computing values of revenue
revenue = ((6e+6-P)/1.1e+6).*P;
% Computing values of cost
cost = 2.045e+6+(.62+.24+.16)*P;
% Plotting Cost and Revenue vs Gallons of product
figure, plot(P*1.0e-6,revenue*1.0e-6,P*1.0e-6,cost*1.0e-6);
% Label the Graph
title( )'Revenue and Cost vs millions of gallons sold'
legend( , )'Revenue' 'Cost'
xlabel( )'Q (millions of gallons sold)'
ylabel( )'Revenue and Cost (millions of dollars)'
% Breakeven point are at intersections of curves in graph
grid ;on
1
fprintf( )'Breakeven points at intersections of curves on graph. \n\n'
Breakeven points at intersections of curves on graph.
5.17
clear, clc, close all
% Initialize variable for time and denote time interval
% Intialize Equations
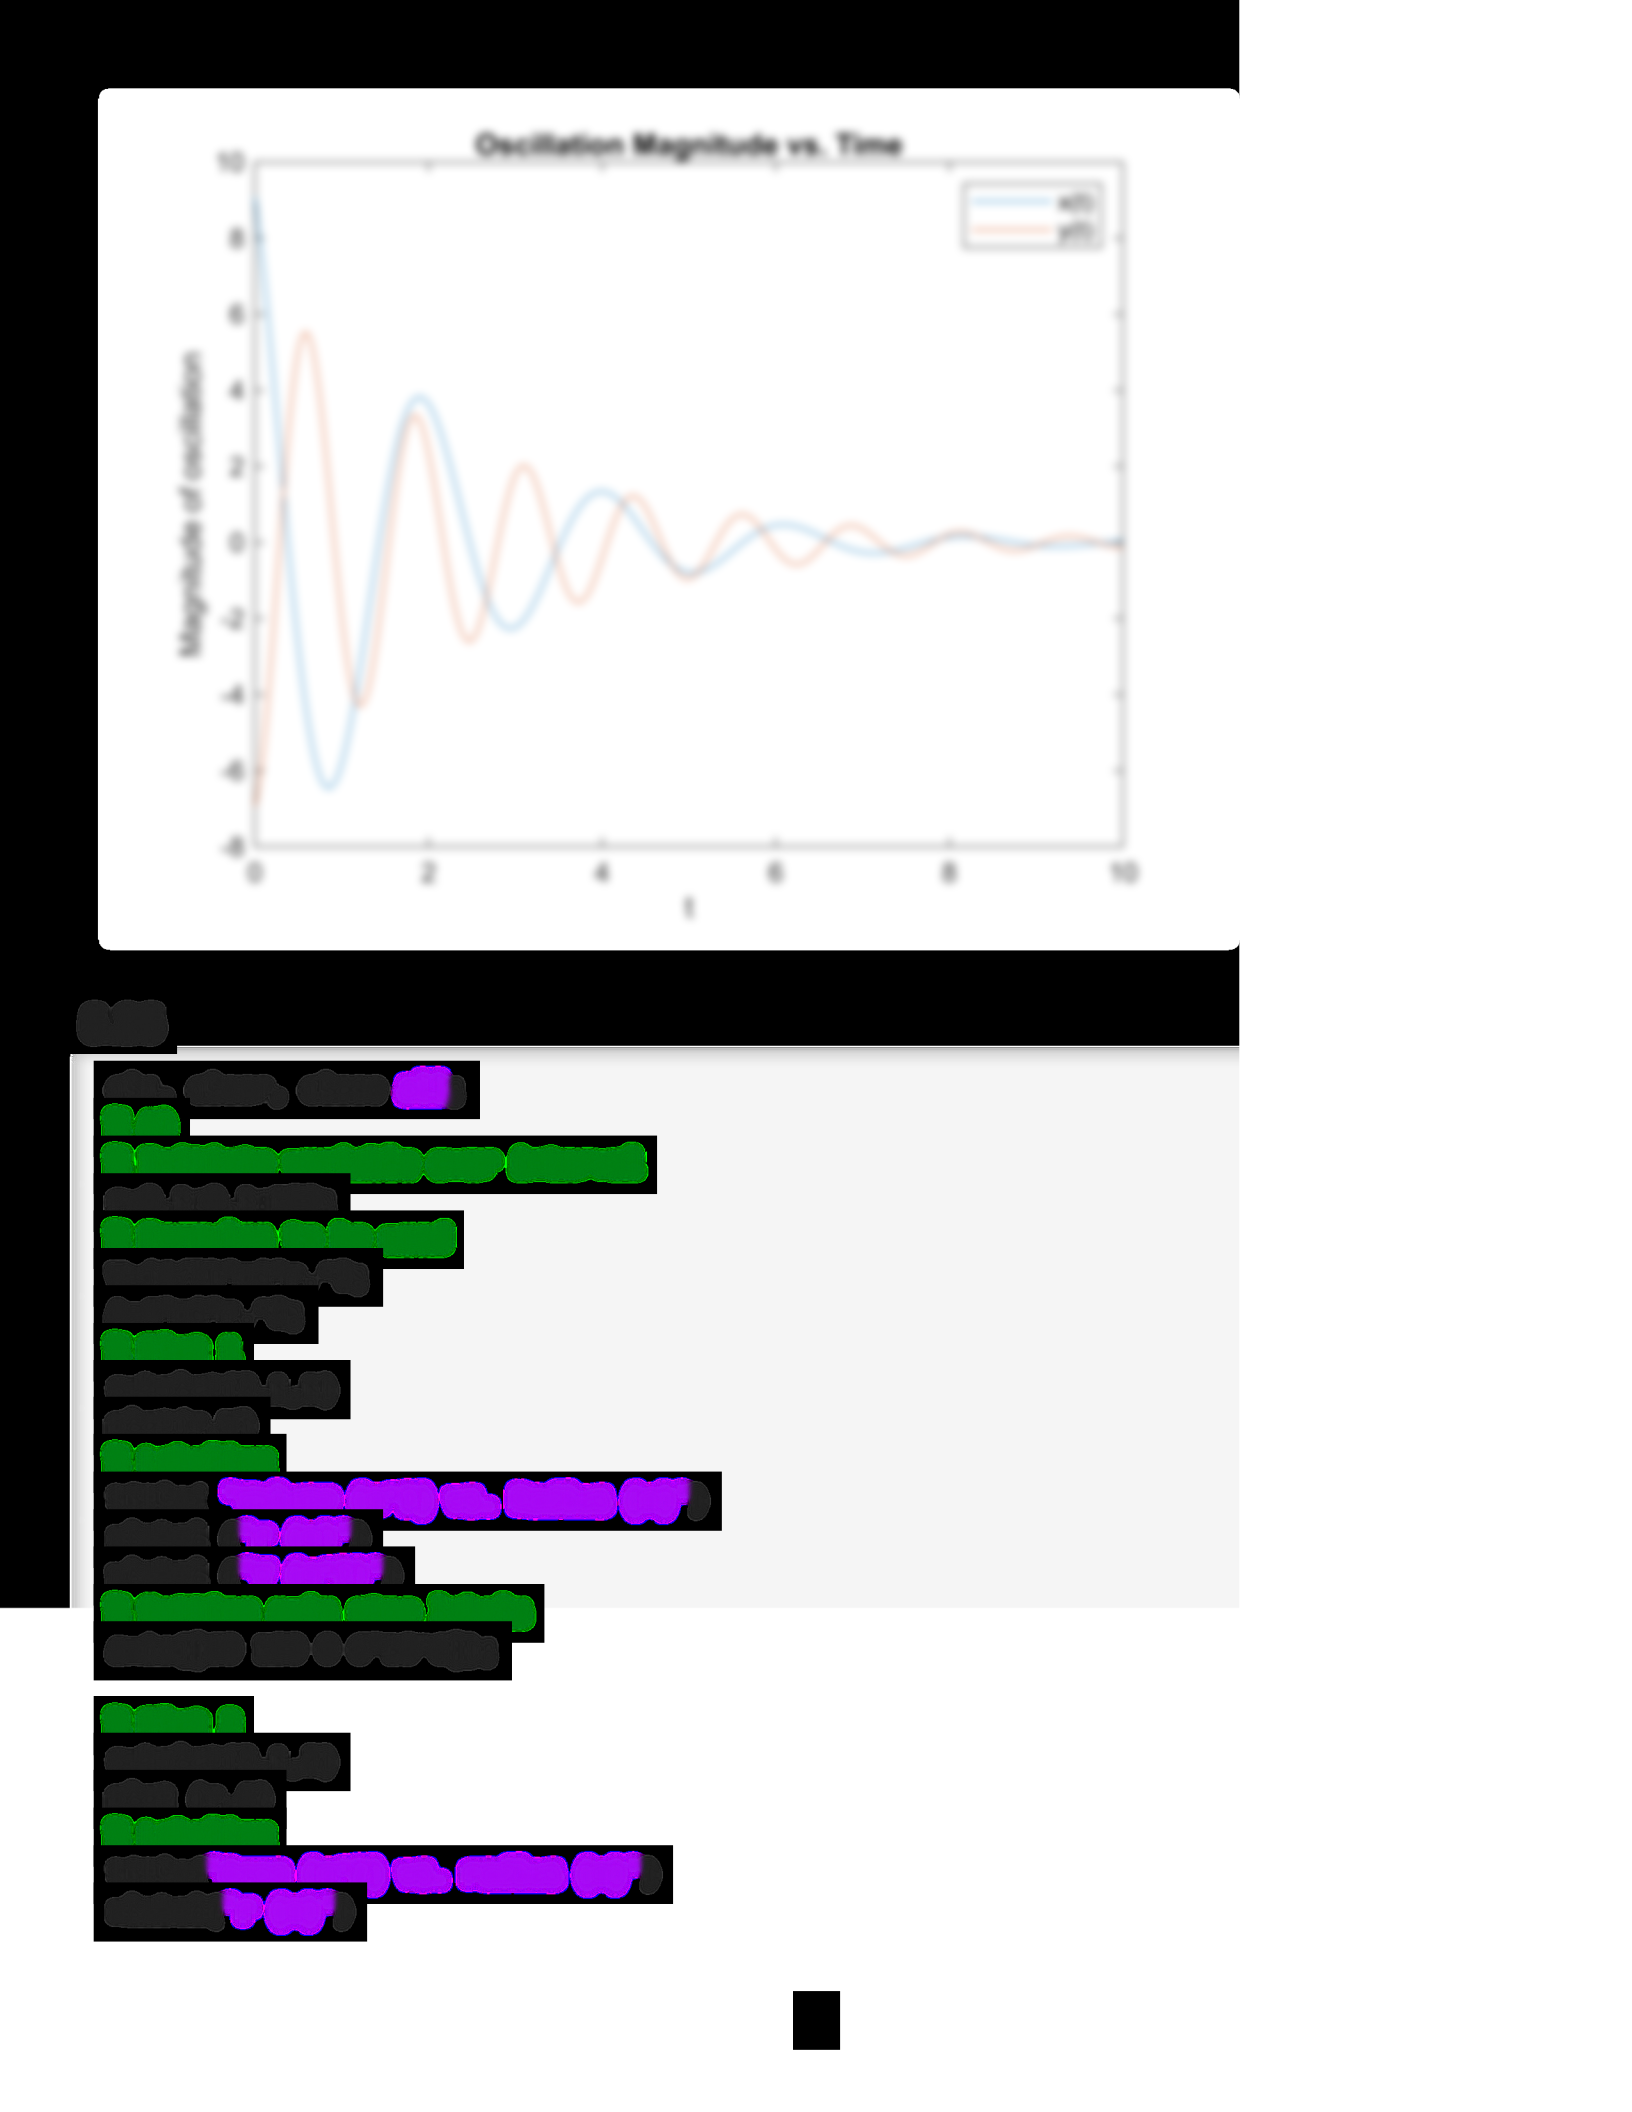
t = 0:0.01:10;
x = 10*exp(-0.5*t).*sin(3*t+2);
y = 7*exp(-0.4*t).*cos(5*t-3);
% Plotting functions over time interval 't'