


Running head: MULTIPLE REGRESSION GROUP WRITE-UP
MULTIPLE REGRESSION – GROUP #3 FINDINGS ANALYSIS
By
Darren Howland, Joy Quarmount and Shontell Stanford
Liberty University
Partial Fulfillment
of the Requirements for EDUC 812
Liberty University
2019
Multiple Regression Group Write-Up 2
FINDINGS
Research Question
The research question for this study was:
RQ1: Is there a significant predictive relationship between the criterion variable (Stats
Exam Scores) and the linear combination of predictor variables (Math test, English test, English
GPA, Math GPA, and Other GPA) for college students?
Null Hypothesis
The null hypothesis for this study was:
H01: There will be no significant predictive relationship between the criterion variable
(Stats Exam Scores) and the linear combination of predictor variables (Math test, English test,
English GPA, Math GPA, and Other GPA) for college students.
Descriptive Statistics
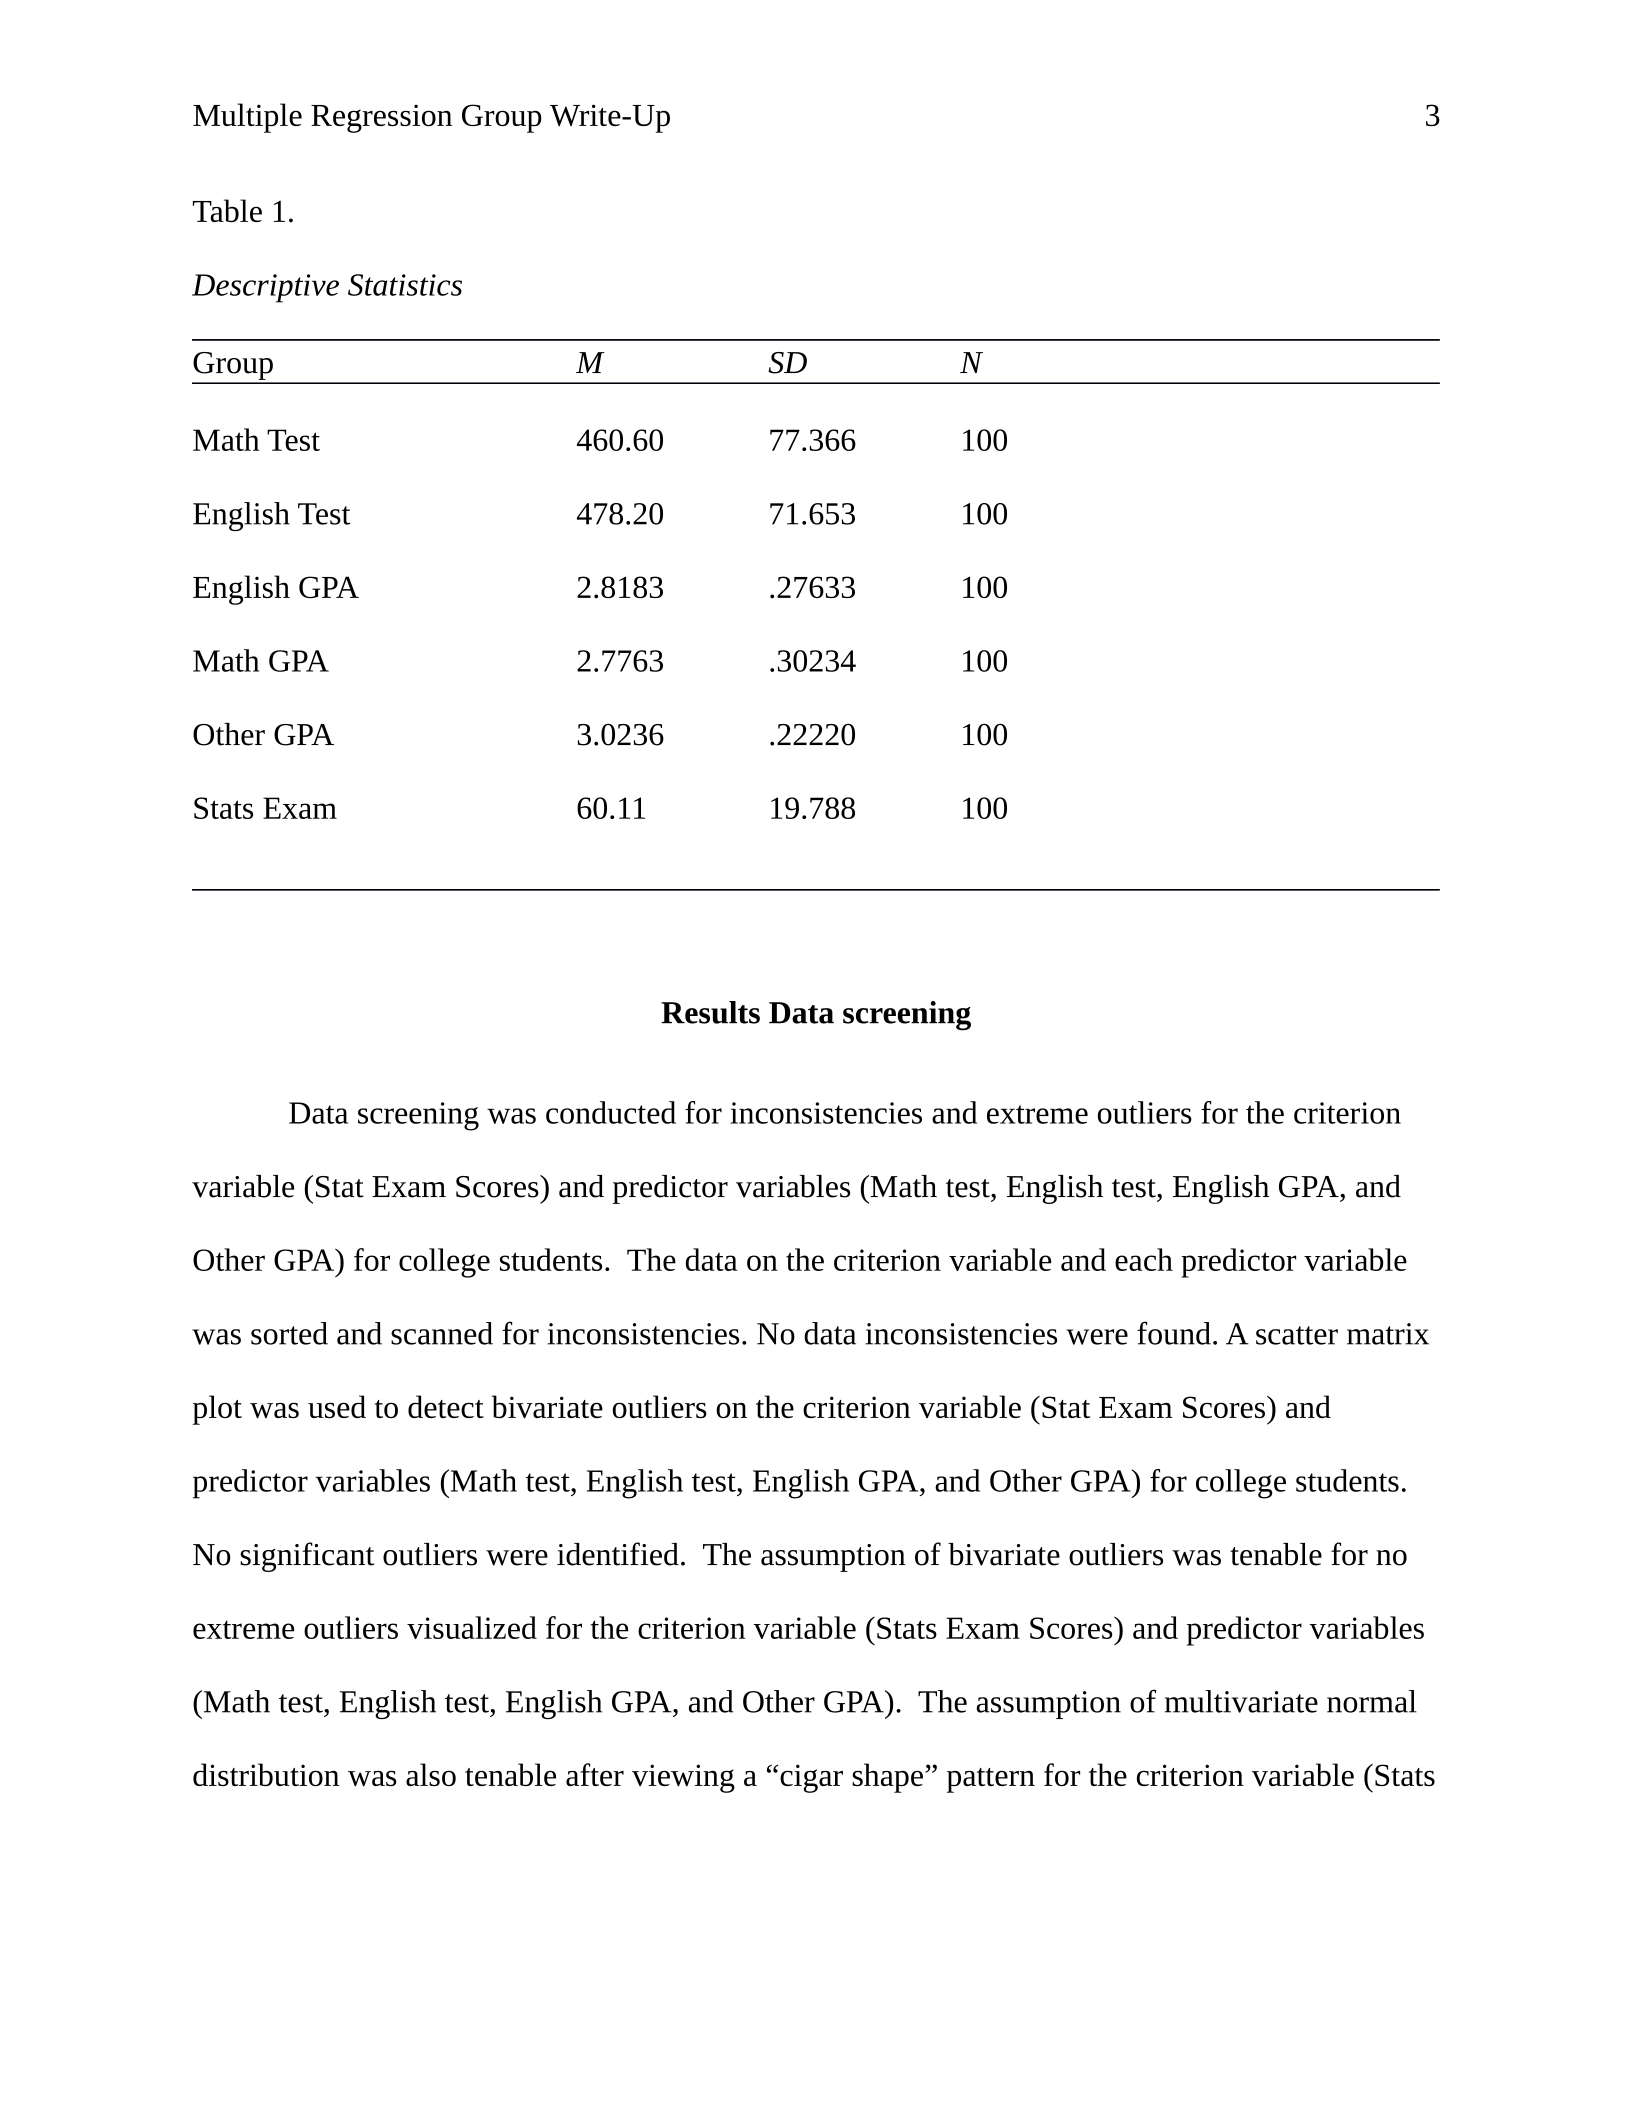
Data was obtained from the criterion variable (Stats Exam Scores) and the predictor
variables (Math test, English test, English GPA, and Other GPA) for college students. The data
can be found in Table 1.
Multiple Regression Group Write-Up 3
Table 1.
Descriptive Statistics
Group M SD N
Math Test 460.60 77.366 100
English Test 478.20 71.653 100
English GPA 2.8183 .27633 100
Math GPA 2.7763 .30234 100
Other GPA 3.0236 .22220 100
Stats Exam 60.11 19.788 100
Results Data screening
Data screening was conducted for inconsistencies and extreme outliers for the criterion
variable (Stat Exam Scores) and predictor variables (Math test, English test, English GPA, and
Other GPA) for college students. The data on the criterion variable and each predictor variable
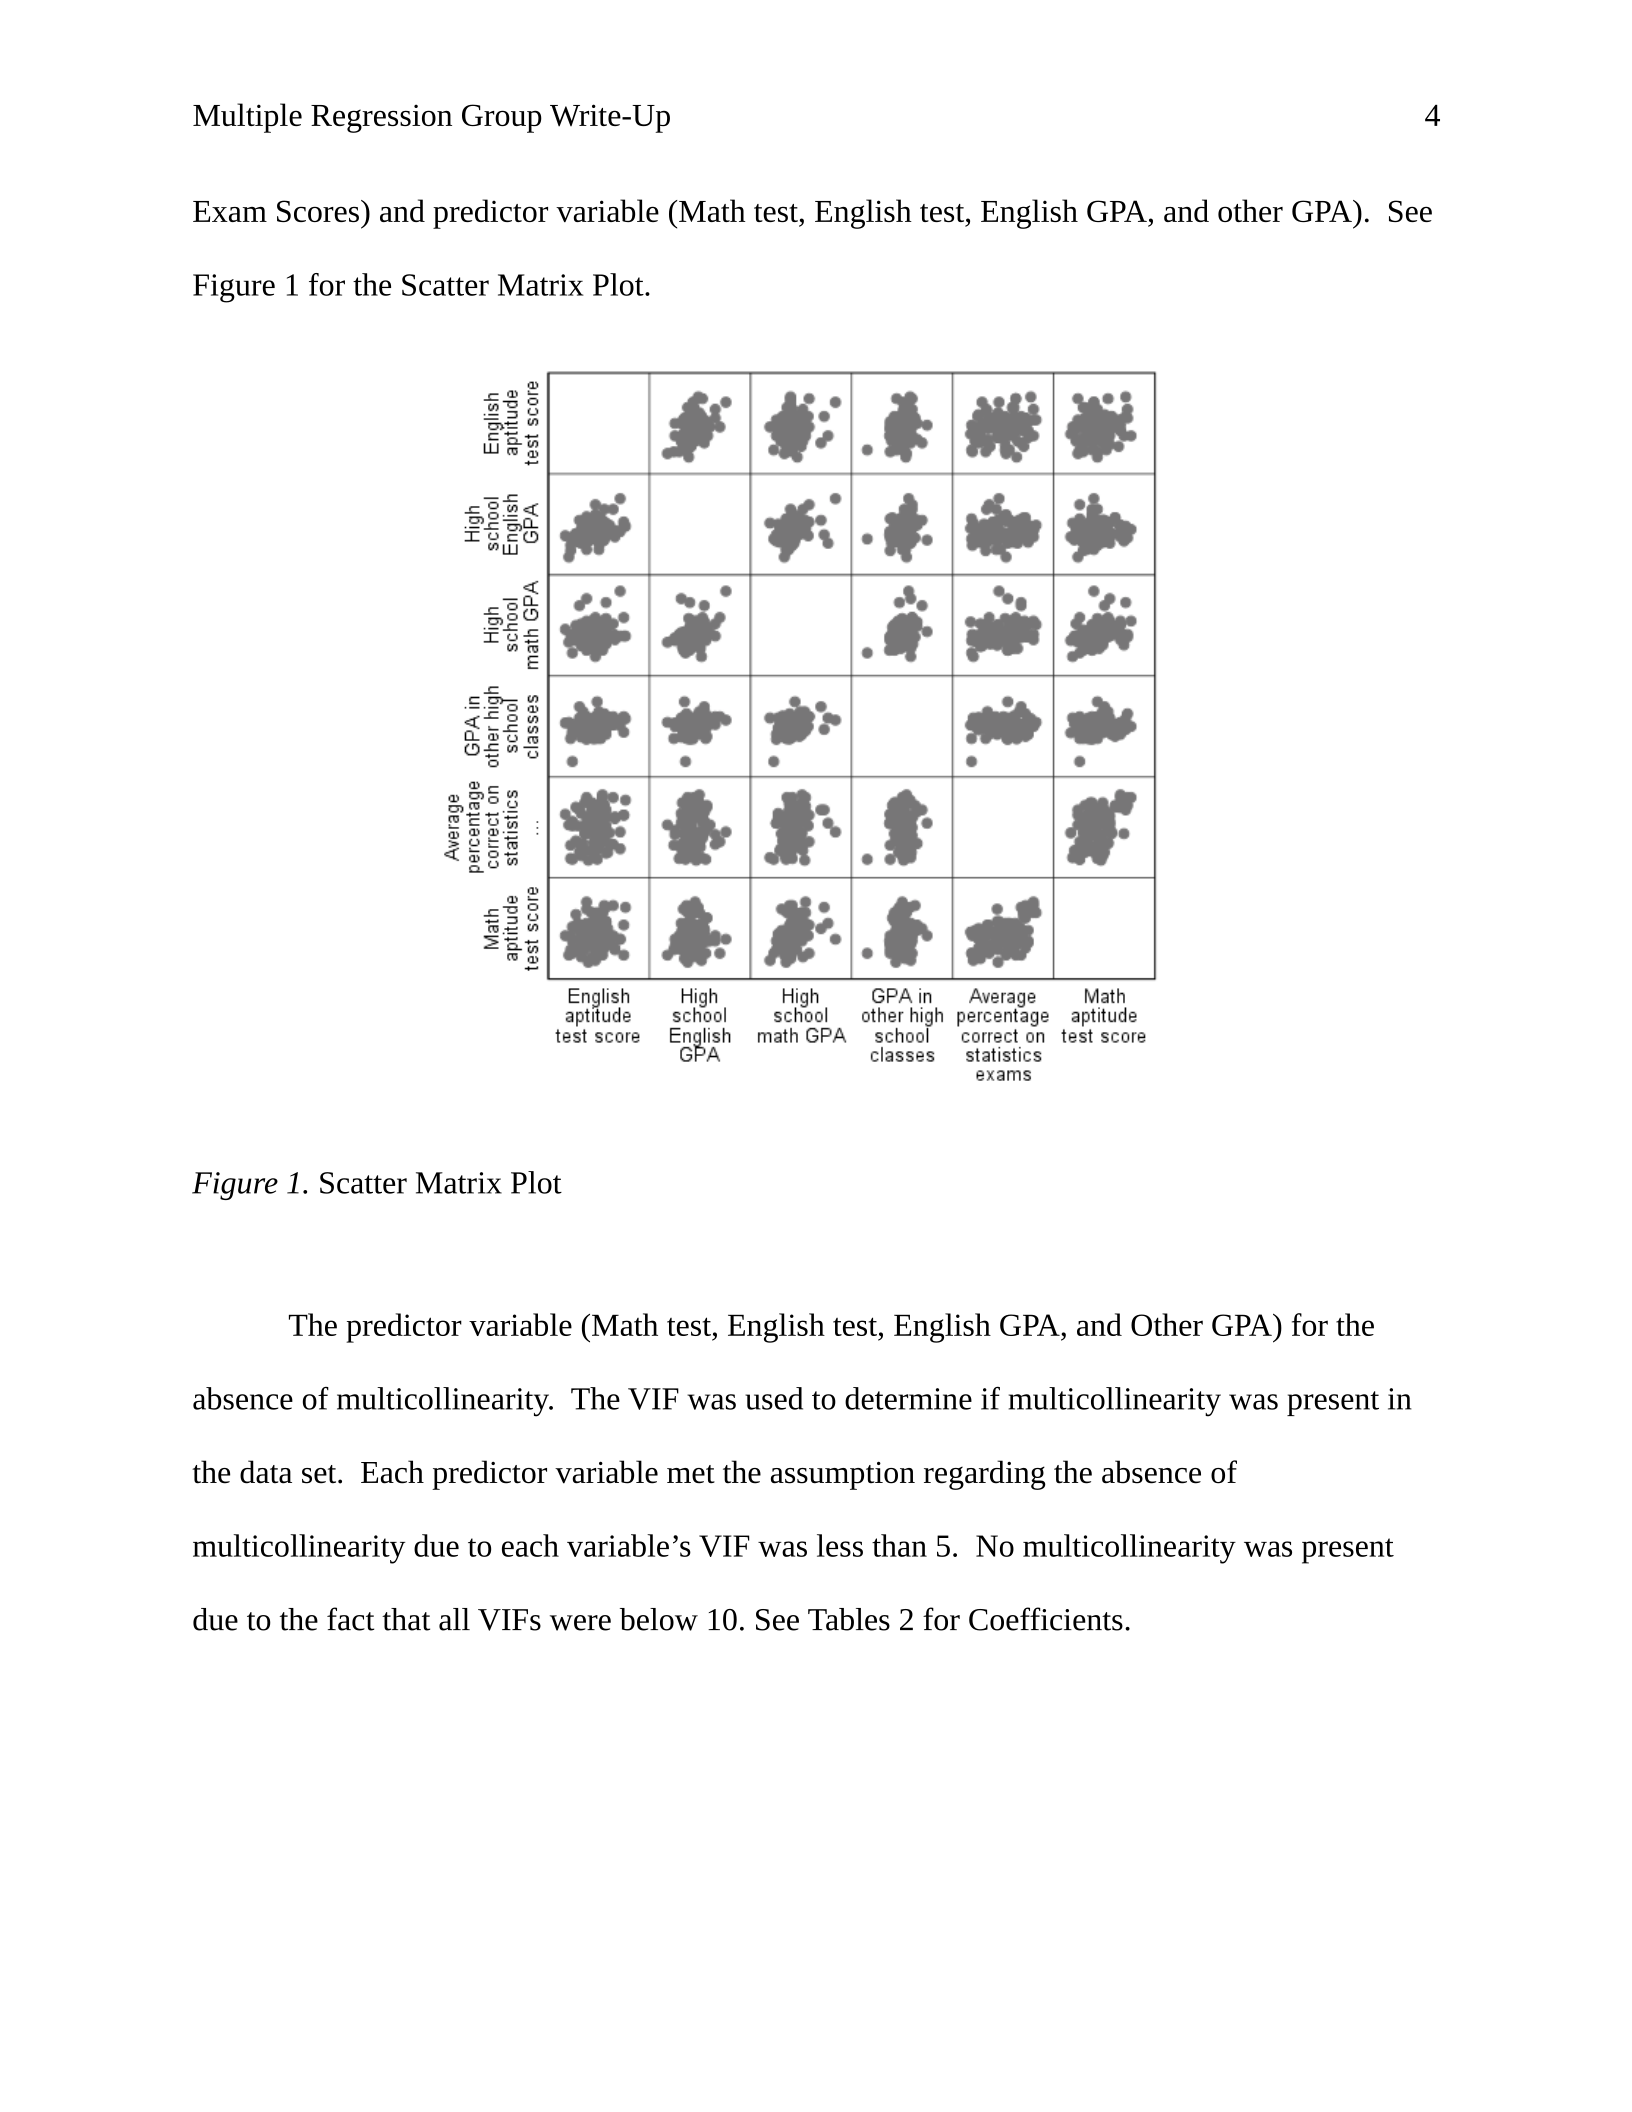
was sorted and scanned for inconsistencies. No data inconsistencies were found. A scatter matrix
plot was used to detect bivariate outliers on the criterion variable (Stat Exam Scores) and
predictor variables (Math test, English test, English GPA, and Other GPA) for college students.
No significant outliers were identified. The assumption of bivariate outliers was tenable for no
extreme outliers visualized for the criterion variable (Stats Exam Scores) and predictor variables
(Math test, English test, English GPA, and Other GPA). The assumption of multivariate normal
distribution was also tenable after viewing a “cigar shape” pattern for the criterion variable (Stats
Multiple Regression Group Write-Up 4
Exam Scores) and predictor variable (Math test, English test, English GPA, and other GPA). See
Figure 1 for the Scatter Matrix Plot.
Figure 1. Scatter Matrix Plot
The predictor variable (Math test, English test, English GPA, and Other GPA) for the
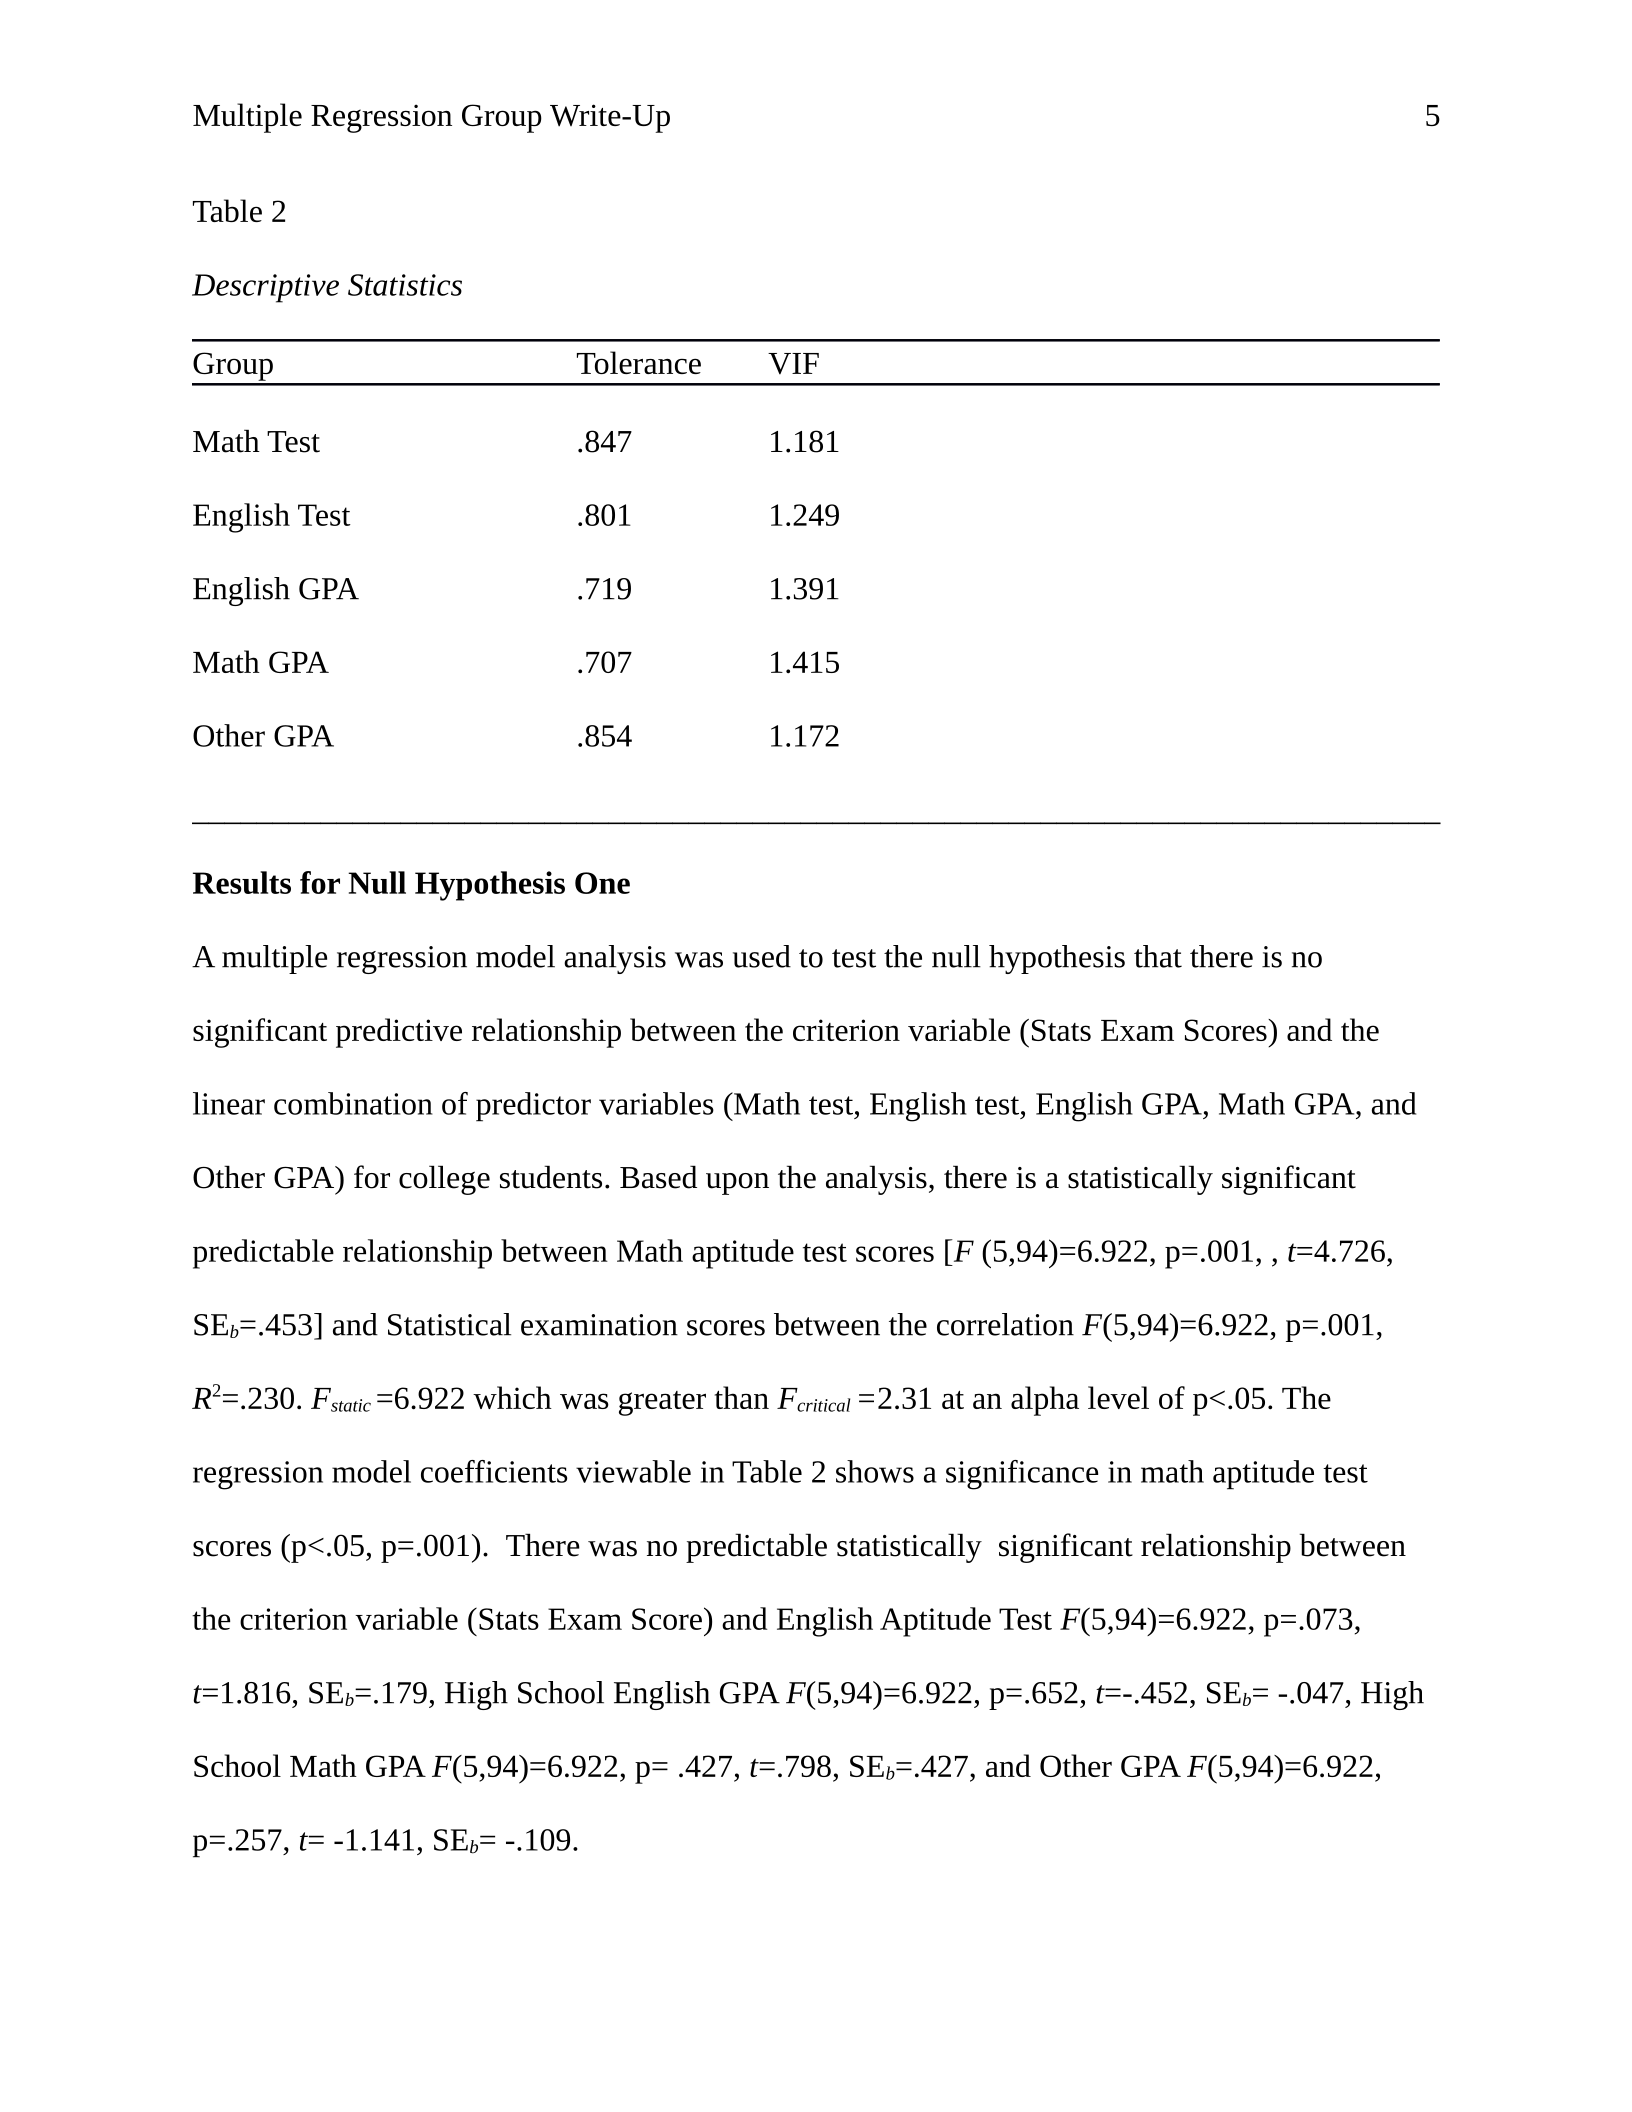
absence of multicollinearity. The VIF was used to determine if multicollinearity was present in
the data set. Each predictor variable met the assumption regarding the absence of
multicollinearity due to each variable’s VIF was less than 5. No multicollinearity was present
due to the fact that all VIFs were below 10. See Tables 2 for Coefficients.
Multiple Regression Group Write-Up 5
Table 2
Descriptive Statistics
Group Tolerance VIF
Math Test .847 1.181
English Test .801 1.249
English GPA .719 1.391
Math GPA .707 1.415
Other GPA .854 1.172
______________________________________________________________________________
Results for Null Hypothesis One
A multiple regression model analysis was used to test the null hypothesis that there is no
significant predictive relationship between the criterion variable (Stats Exam Scores) and the
linear combination of predictor variables (Math test, English test, English GPA, Math GPA, and
Other GPA) for college students. Based upon the analysis, there is a statistically significant
predictable relationship between Math aptitude test scores [F (5,94)=6.922, p=.001, , t=4.726,
SEb=.453] and Statistical examination scores between the correlation F(5,94)=6.922, p=.001,
R2=.230. Fstatic =6.922 which was greater than Fcritical =2.31 at an alpha level of p<.05. The
regression model coefficients viewable in Table 2 shows a significance in math aptitude test
scores (p<.05, p=.001). There was no predictable statistically significant relationship between
the criterion variable (Stats Exam Score) and English Aptitude Test F(5,94)=6.922, p=.073,
t=1.816, SEb=.179, High School English GPA F(5,94)=6.922, p=.652, t=-.452, SEb= -.047, High
School Math GPA F(5,94)=6.922, p= .427, t=.798, SEb=.427, and Other GPA F(5,94)=6.922,
p=.257, t= -1.141, SEb= -.109.
Powered by TCPDF (www.tcpdf.org)

