


Running head: LESSON 31 EXERCISE 1
Group 4 Lesson 31 Exercise 1
Kendrick Alexander
Monica Tucker
Stacy Taylor
Liberty University
Partial Fulfillment
Of the Requirements for EDUC 812
Liberty University
2019
LESSON 31 EXERCISE 1
FINDINGS
Research Question
The research question for this study was:
RQ1: Is there a relationship between overall quality of an instructor and overall course
quality?
Null Hypothesis
The null hypothesis for this study was:
H01: There is no significant relationship between instructor ratings and course ratings.
Descriptive Statistics
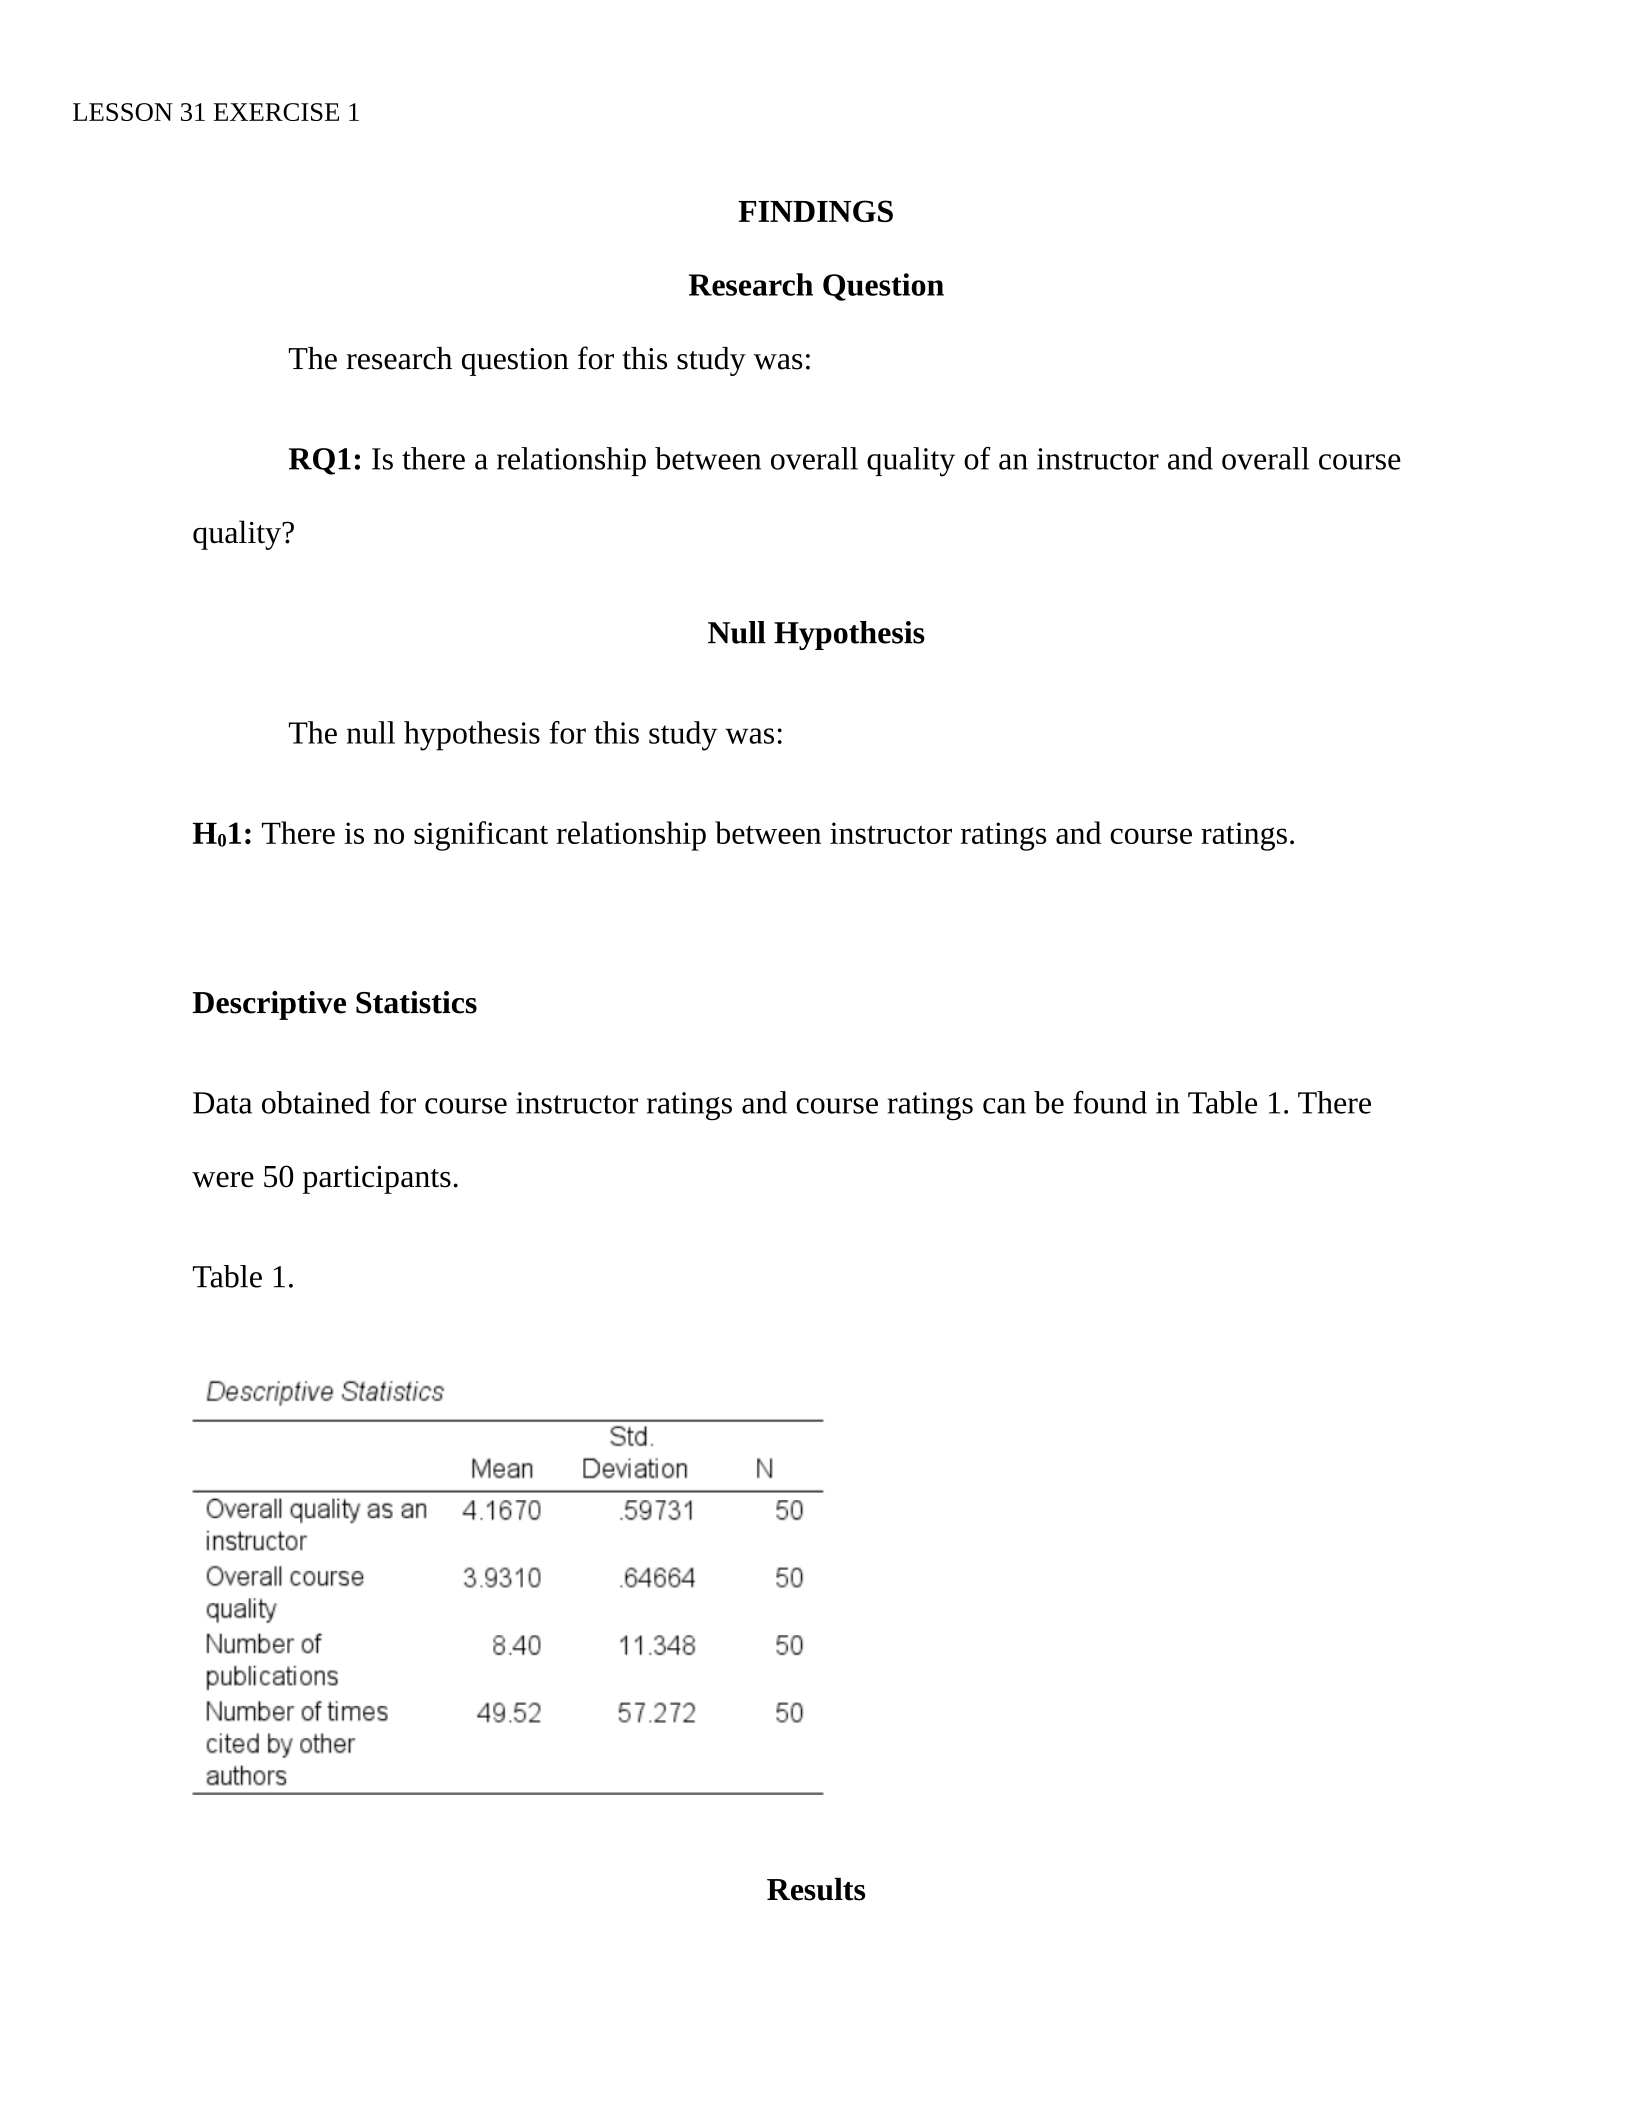
Data obtained for course instructor ratings and course ratings can be found in Table 1. There
were 50 participants.
Table 1.
Results
LESSON 31 EXERCISE 1
Data screening
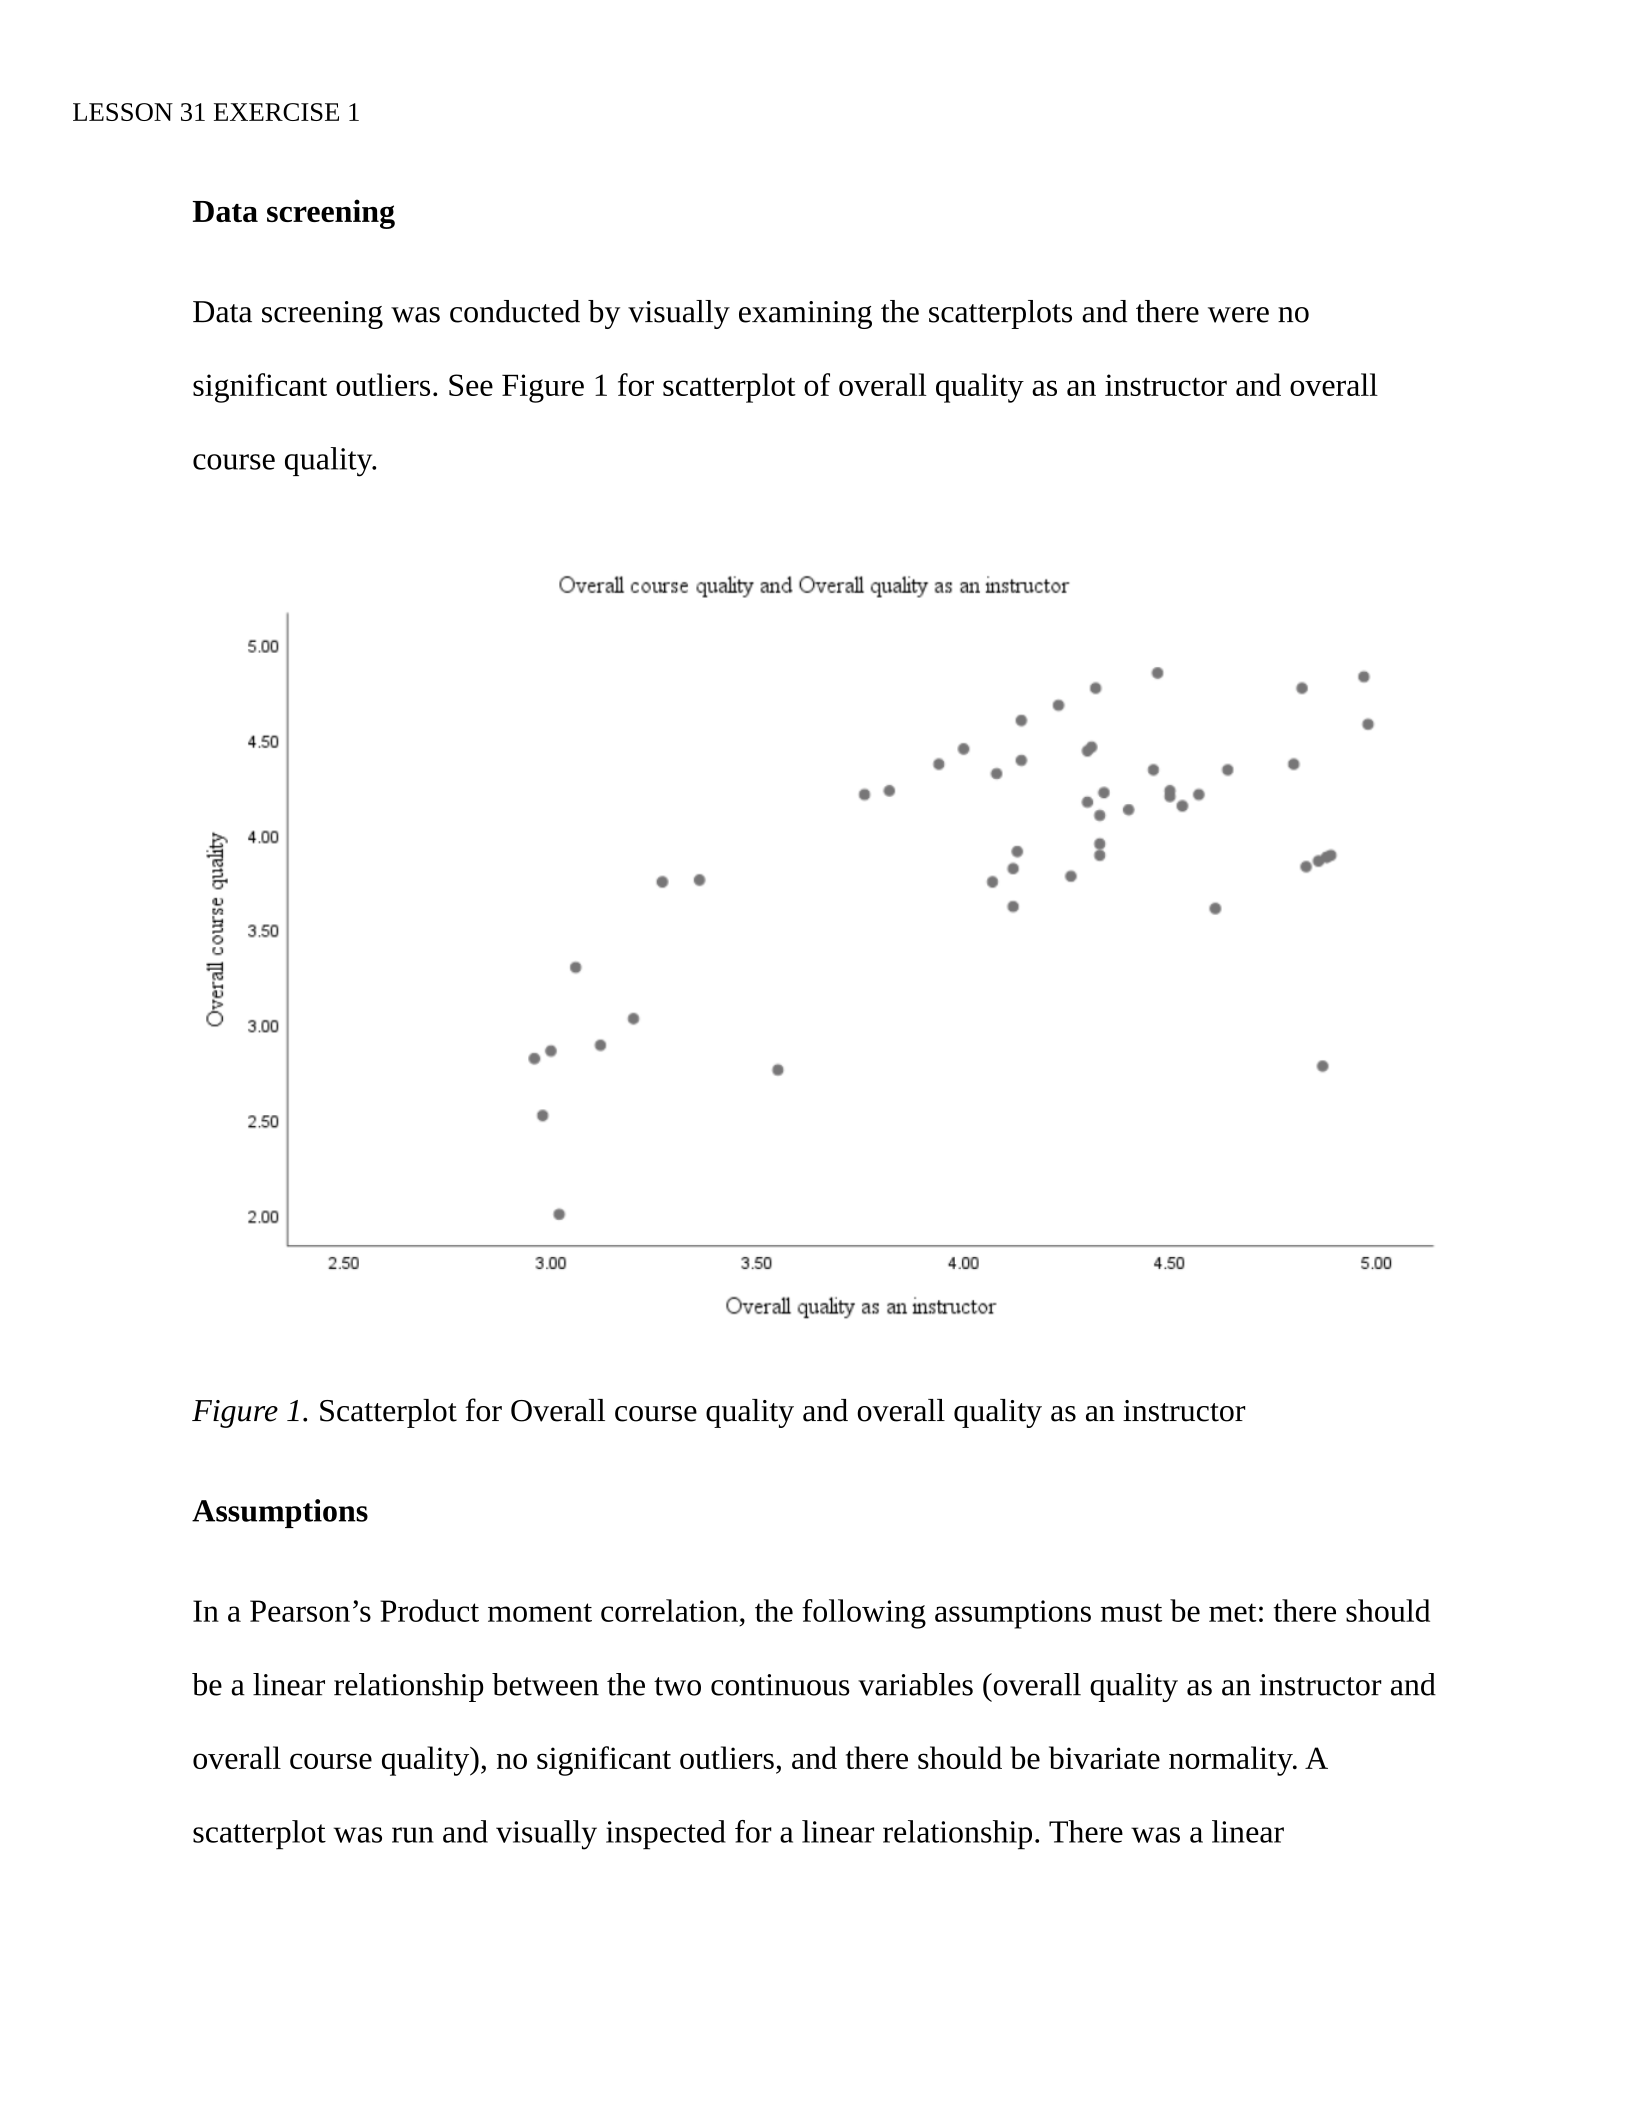
Data screening was conducted by visually examining the scatterplots and there were no
significant outliers. See Figure 1 for scatterplot of overall quality as an instructor and overall
course quality.
Figure 1. Scatterplot for Overall course quality and overall quality as an instructor
Assumptions
In a Pearson’s Product moment correlation, the following assumptions must be met: there should
be a linear relationship between the two continuous variables (overall quality as an instructor and
overall course quality), no significant outliers, and there should be bivariate normality. A
scatterplot was run and visually inspected for a linear relationship. There was a linear
LESSON 31 EXERCISE 1
relationship between overall quality as an instructor and overall course quality. There were no
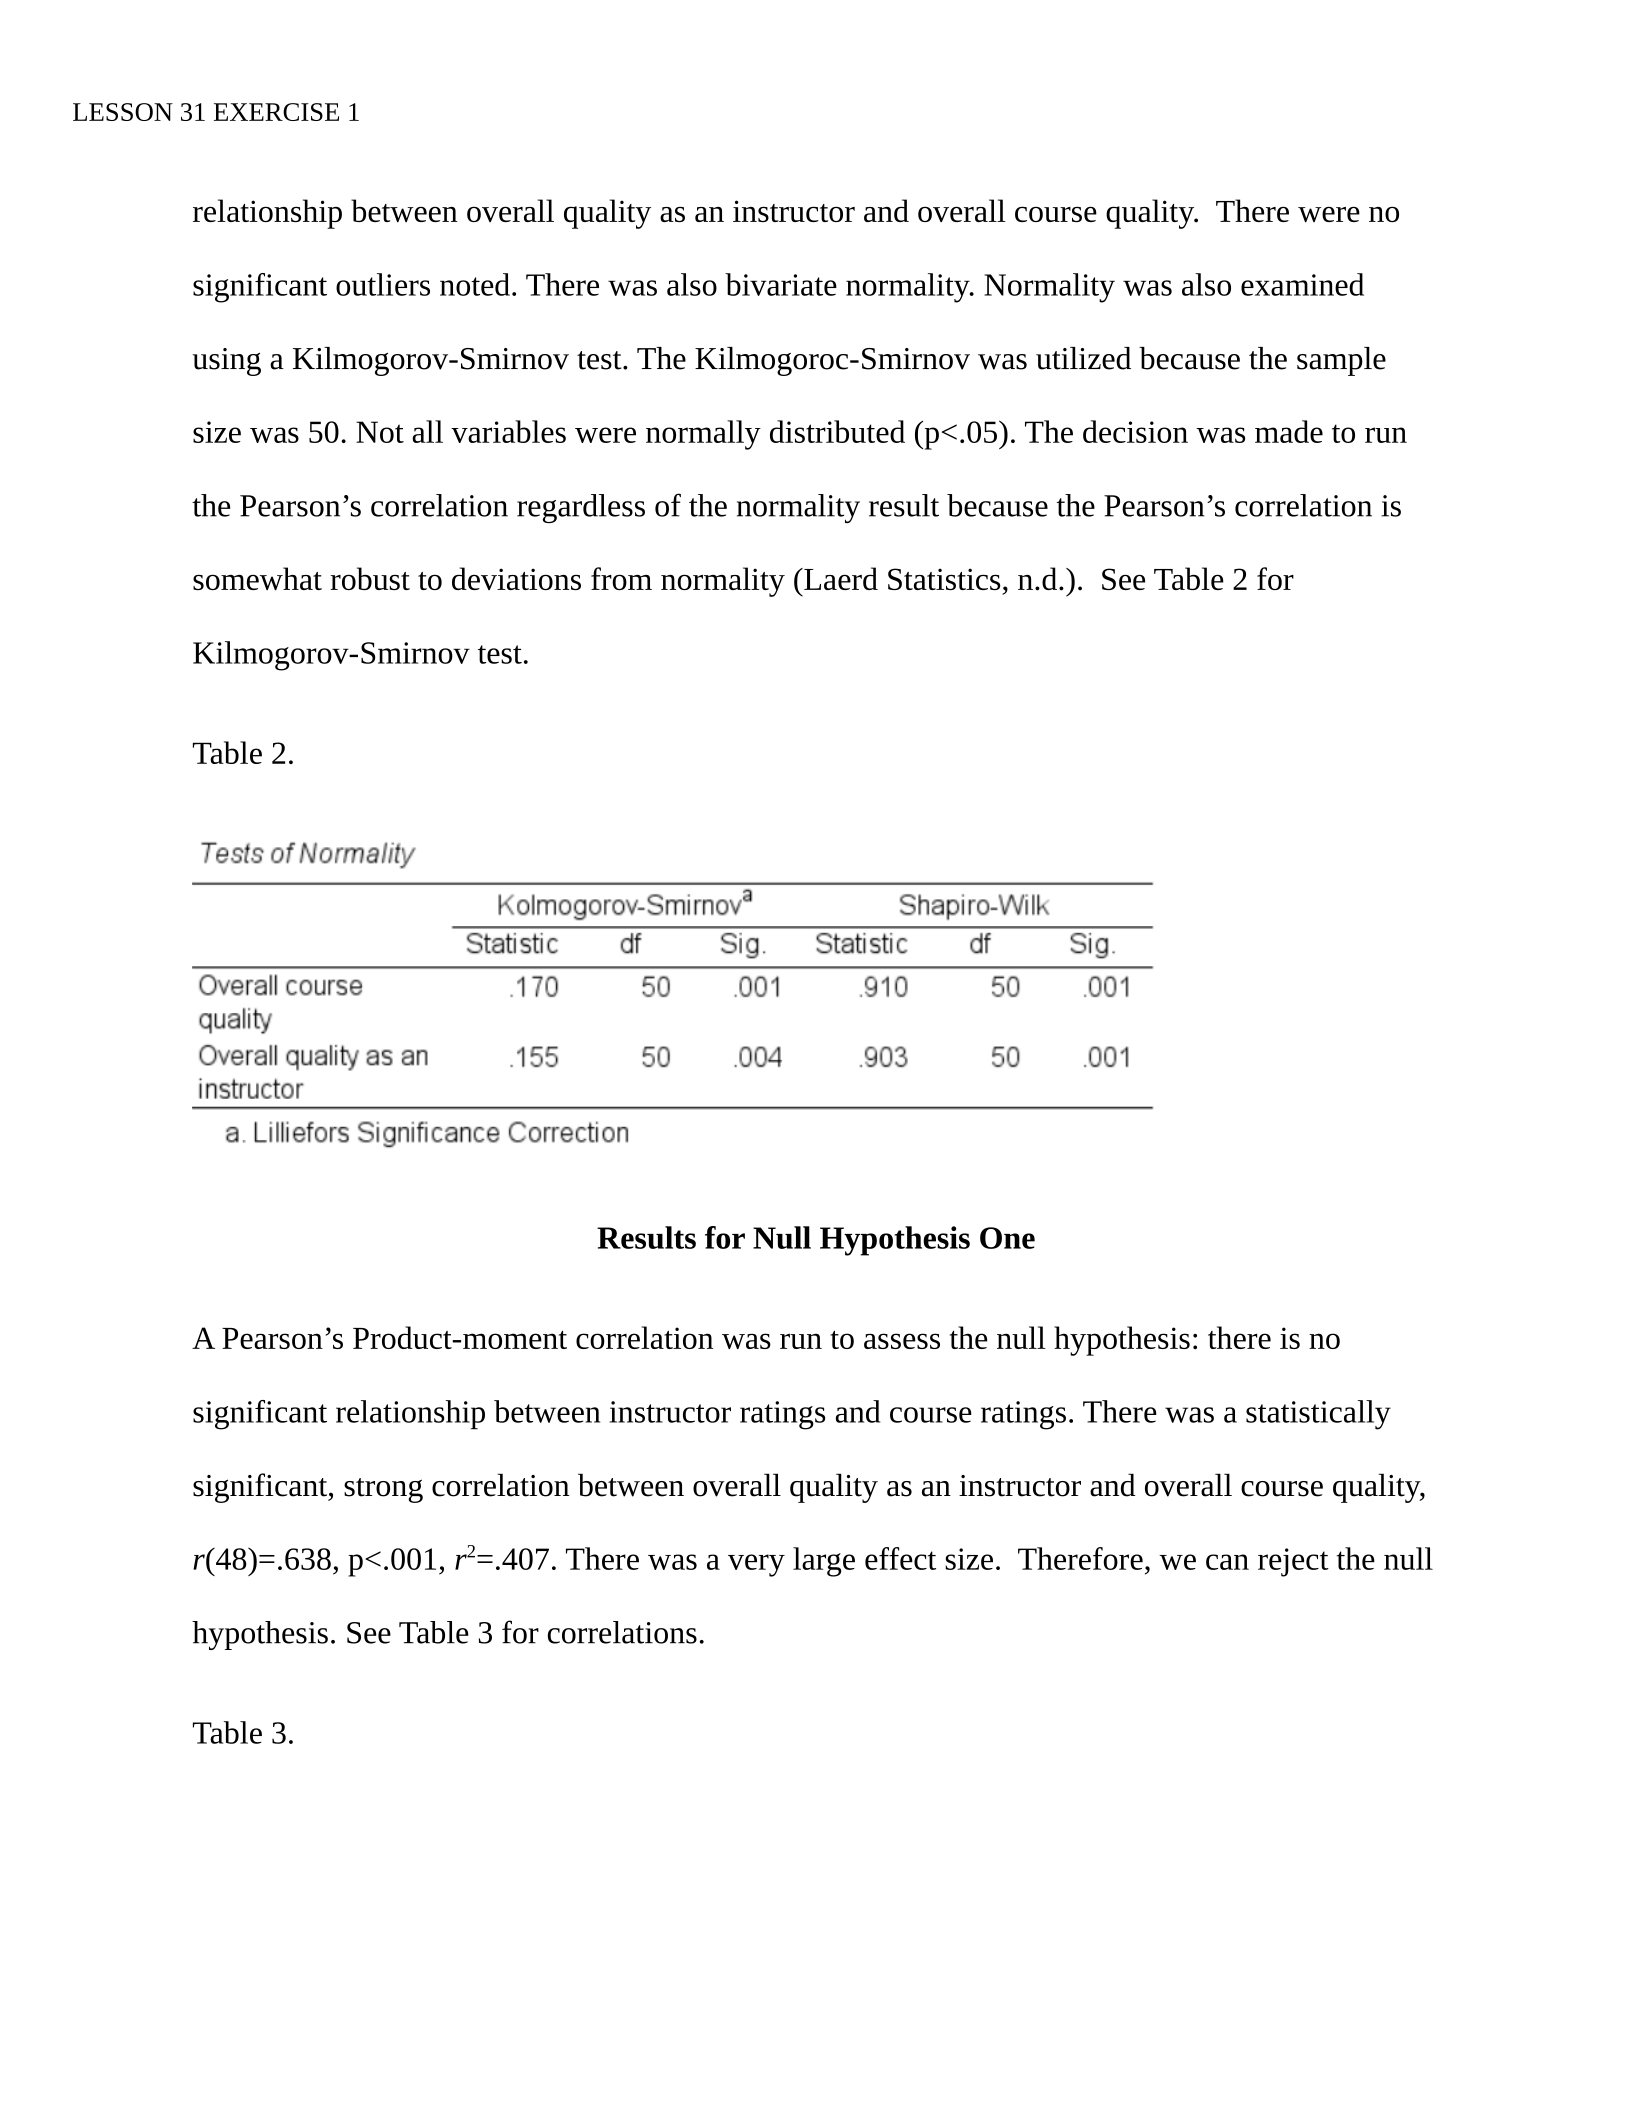
significant outliers noted. There was also bivariate normality. Normality was also examined
using a Kilmogorov-Smirnov test. The Kilmogoroc-Smirnov was utilized because the sample
size was 50. Not all variables were normally distributed (p<.05). The decision was made to run
the Pearson’s correlation regardless of the normality result because the Pearson’s correlation is
somewhat robust to deviations from normality (Laerd Statistics, n.d.). See Table 2 for
Kilmogorov-Smirnov test.
Table 2.
Results for Null Hypothesis One
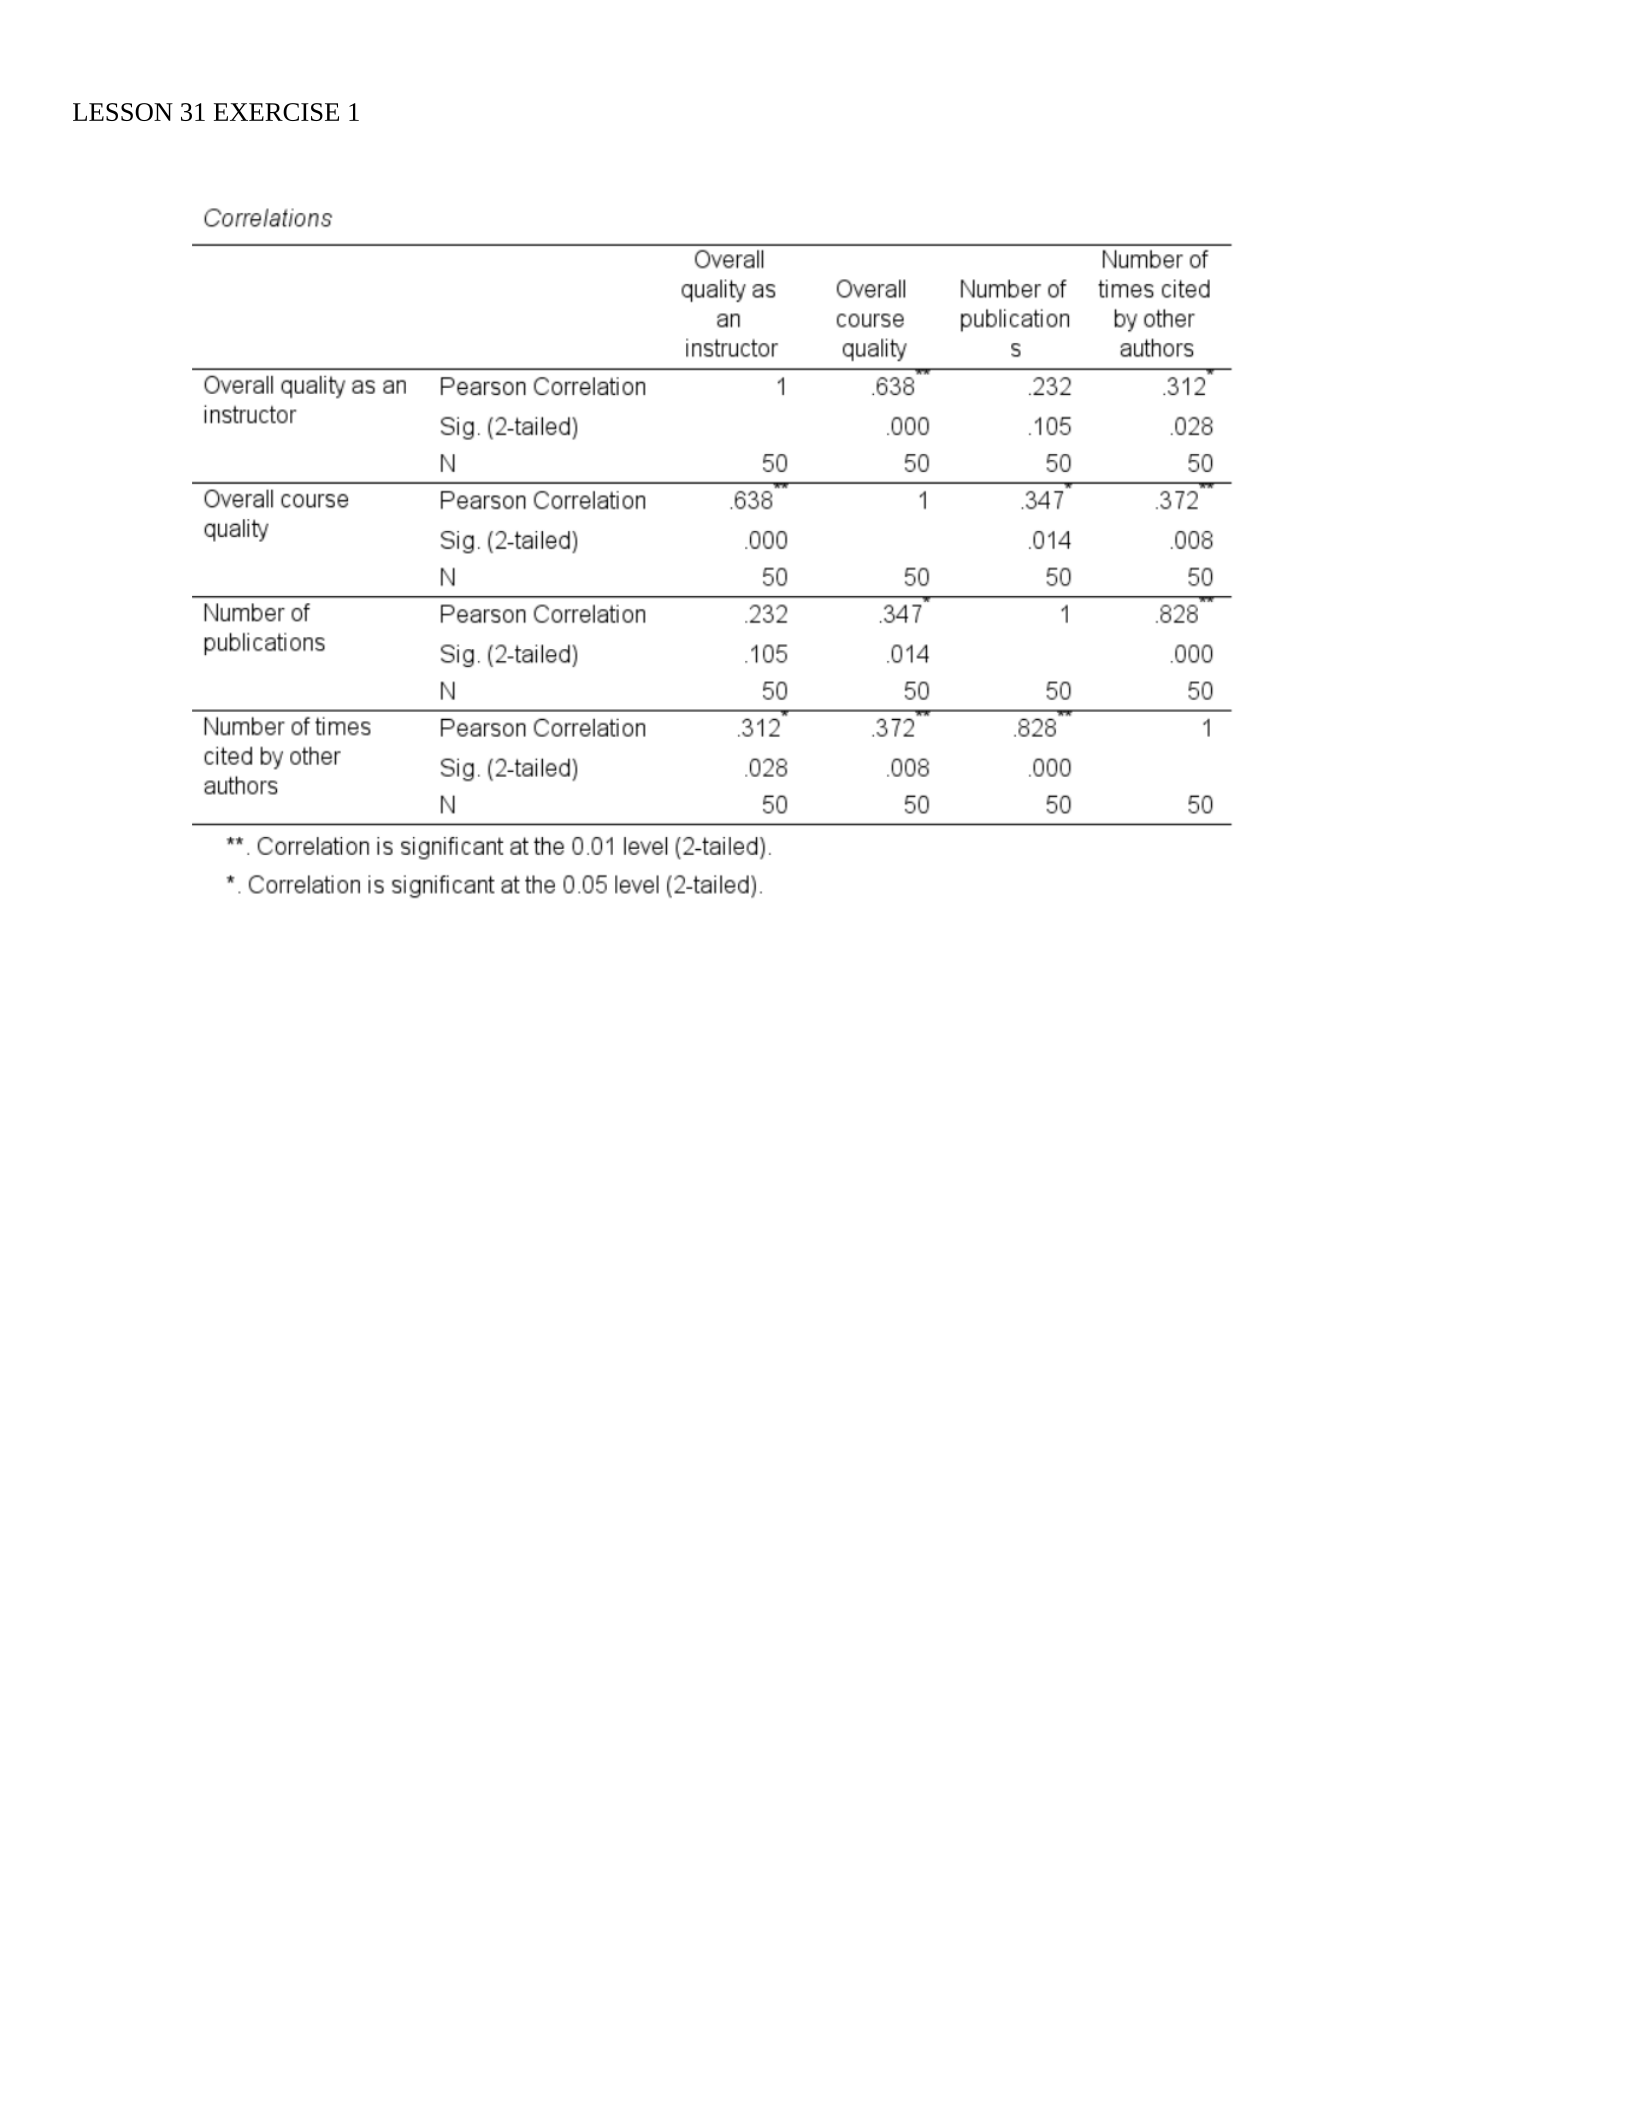
A Pearson’s Product-moment correlation was run to assess the null hypothesis: there is no
significant relationship between instructor ratings and course ratings. There was a statistically
significant, strong correlation between overall quality as an instructor and overall course quality,
r(48)=.638, p<.001, r2=.407. There was a very large effect size. Therefore, we can reject the null
hypothesis. See Table 3 for correlations.
Table 3.
Correlations
Overall
Number
of
quality
as
Overall
Number
of
times
cited
an
course
publication
by
other
instructor
quality
s
authors
Overall
qualityas
an
Pearson
Correlation
1
638
232 312
instructor
Sig.
(2-tailed)
000 105
028
N
50 50 50 50
‘Overall
course
Pearson
Correlation
638
1
347
372
quality
Sig,
(2-tailed)
000
014 008
N
50 50 50 50
‘Number
of
Pearson
Correlation
.232
347
1
828
Publications
Sig.
(2-tailed)
405
014
000
N
50 50 50 50
‘Number
of
times
Pearson
Correlation
312
372
828
1
cited
by
other
Sig.
(2-tailed)
028 008
000
authors
N
50 50 50 50
**
Correlation
is
significant
at
the
0.01
level
(2-tailed)
*
Correlation
is
significant
at
the
0.05
level
(2-tailed)
LESSON 31 EXERCISE 1

LESSON 31 EXERCISE 1
References
Green, S.B. and Salkind, N.J. (2017). Using SPSS for Windows and Macintosh: Analyzing and
Understanding the Data (8th ed.). Hoboken, NJ: Pearson.
Laerd Statistics. (n.d.). Retrieved from https://statistics.laerd.com/premium/spss/pc/pearson-
correlation-in-spss-12.php
Powered by TCPDF (www.tcpdf.org)

