


GROUP 2 WRITE-UP: SPSS Worksheet 5
by
Lawrence M. Johnson
Liberty University
Partial Fulfillment
Of the Requirements for EDUC 812
Liberty University
2019
Findings
Research Question
The research question for this study was:
RQ1: Is there a significant relationship between instructor rating and course rating?
Null Hypothesis
The null hypothesis for this study was:
H01: There is no significant relationship between instructor rating and course rating.
Descriptive Statistics
Data was obtained for the dependent, instructor rating. The data indicated the mean and
standard deviation scores for both the Instructor rating (M = 4.167, SD = 0.597) and for the
Course (M = 3.931, SD = 0.647). The Mean and Standard deviation of each group can be found
in Table 1.
Table1.
Descriptive Statistics
Dependent Variable: Instructor Rating
Variables Mean SD
Instructor rating 4.167 0.597
Course rating 3.931 0.647
Results
Assumptions
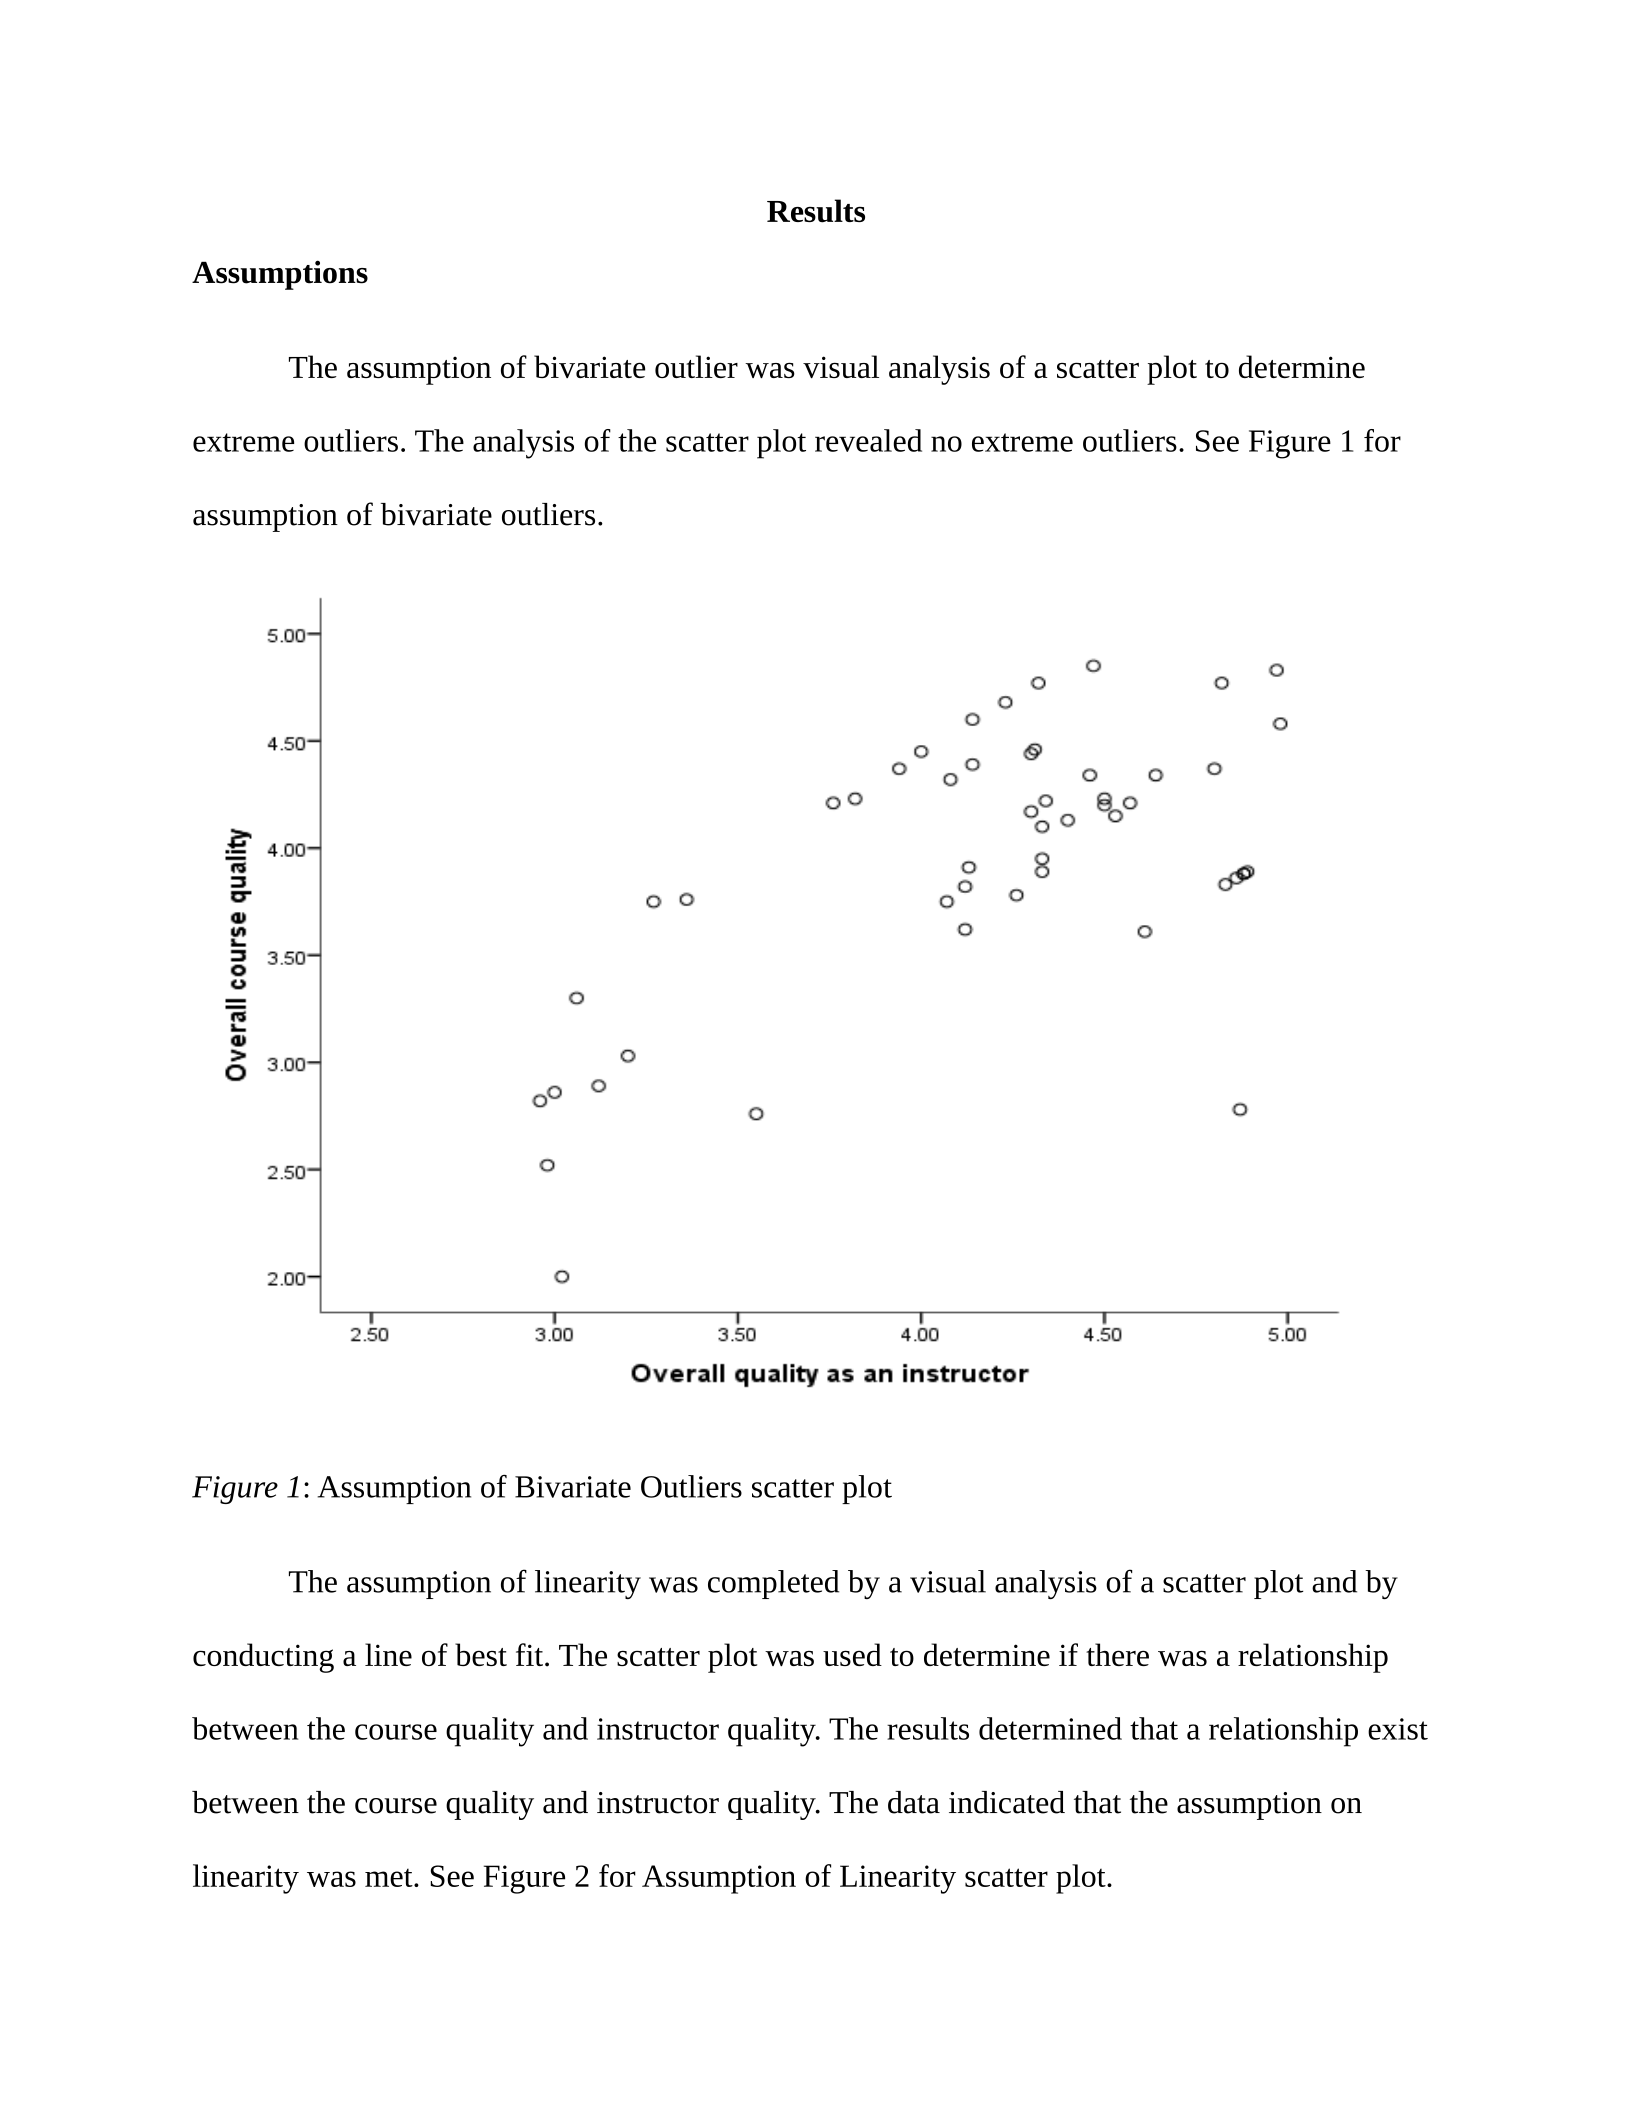
The assumption of bivariate outlier was visual analysis of a scatter plot to determine
extreme outliers. The analysis of the scatter plot revealed no extreme outliers. See Figure 1 for
assumption of bivariate outliers.
Figure 1: Assumption of Bivariate Outliers scatter plot
The assumption of linearity was completed by a visual analysis of a scatter plot and by
conducting a line of best fit. The scatter plot was used to determine if there was a relationship
between the course quality and instructor quality. The results determined that a relationship exist
between the course quality and instructor quality. The data indicated that the assumption on
linearity was met. See Figure 2 for Assumption of Linearity scatter plot.
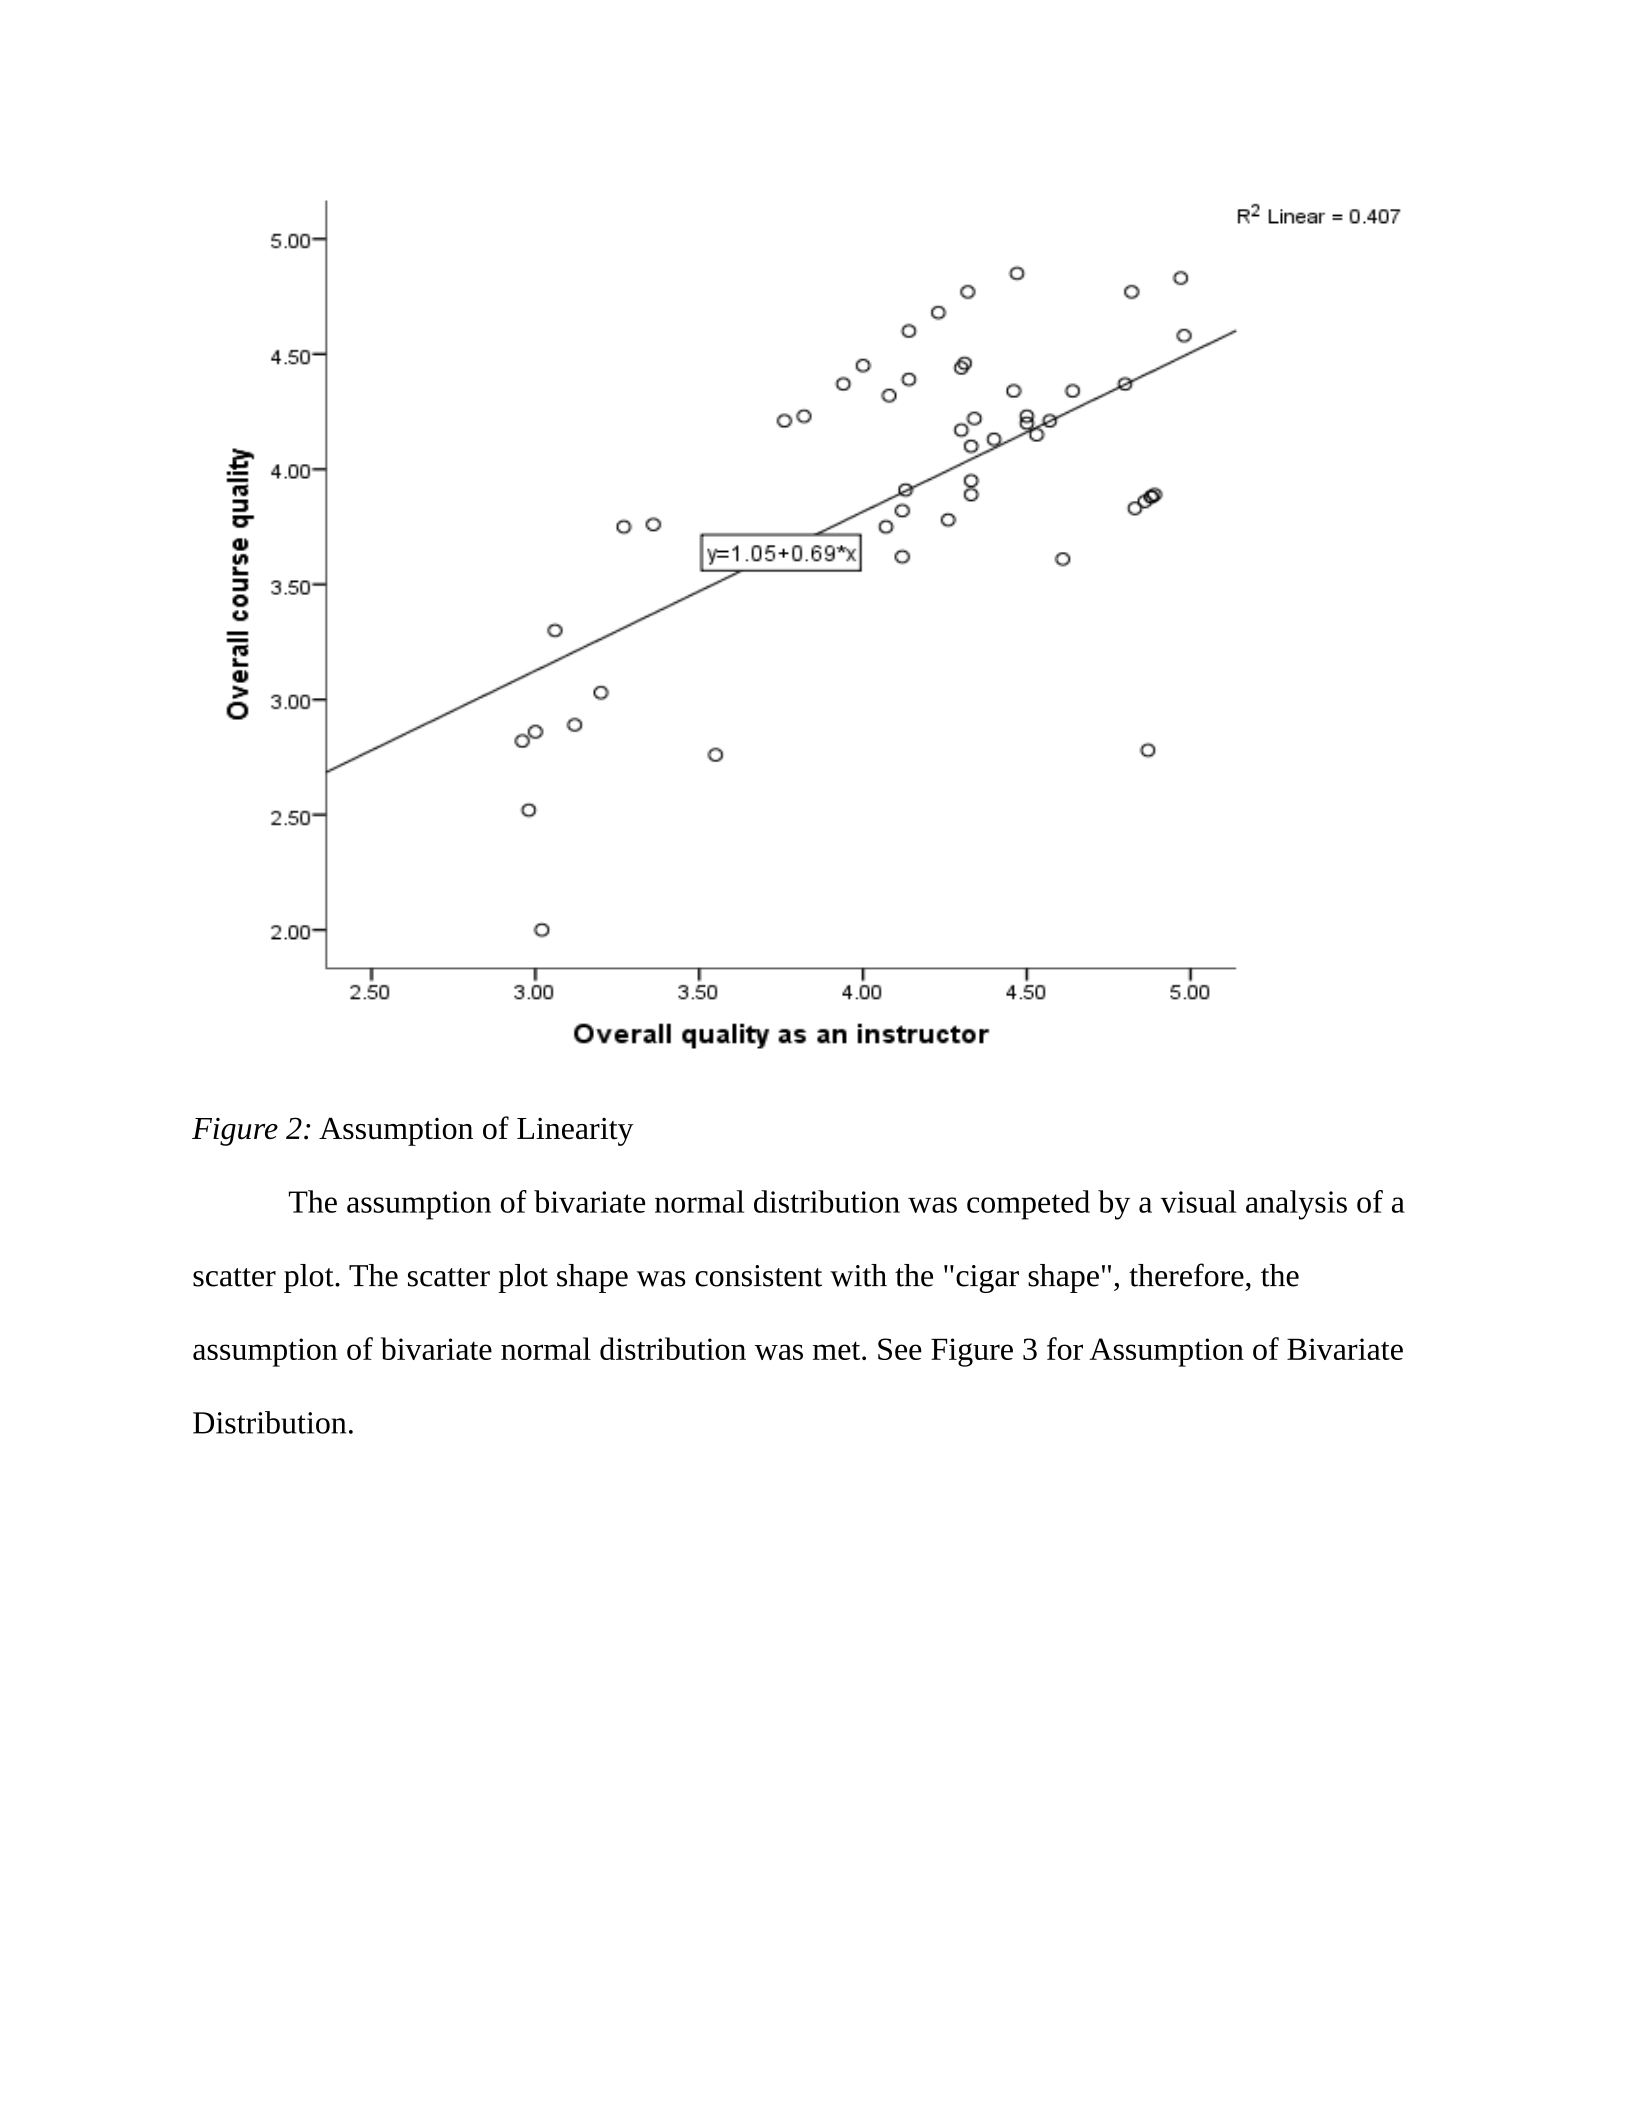
Figure 2: Assumption of Linearity
The assumption of bivariate normal distribution was competed by a visual analysis of a
scatter plot. The scatter plot shape was consistent with the "cigar shape", therefore, the
assumption of bivariate normal distribution was met. See Figure 3 for Assumption of Bivariate
Distribution.
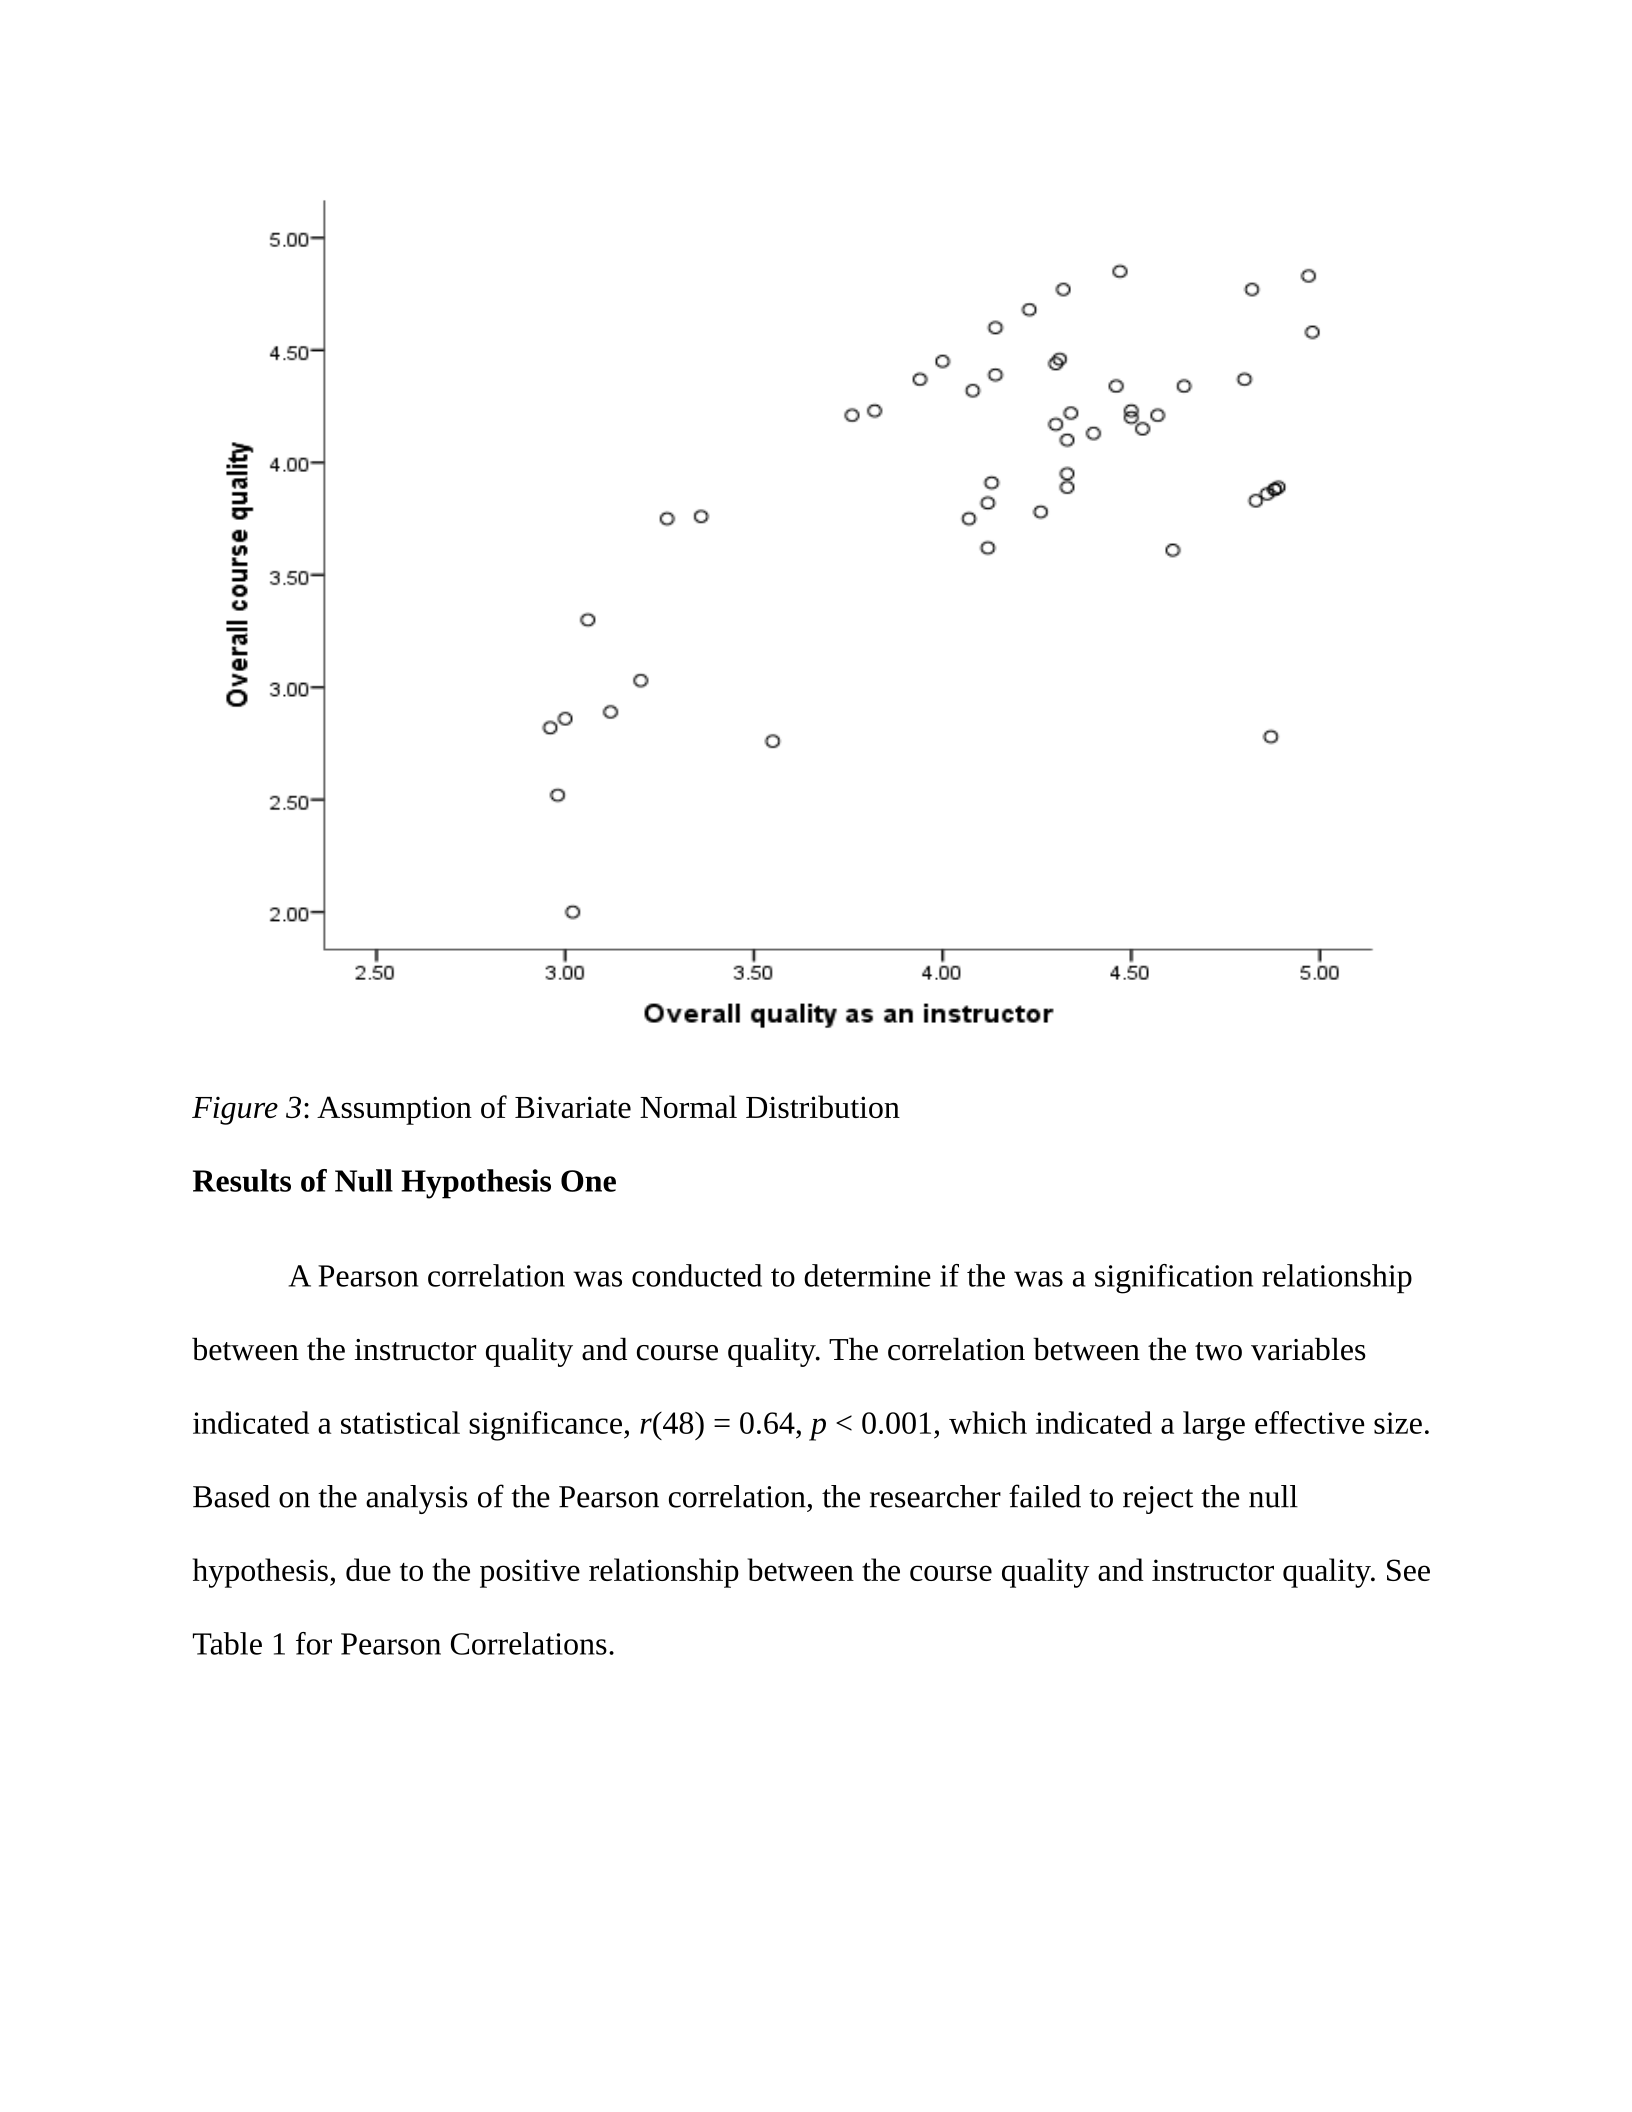
Figure 3: Assumption of Bivariate Normal Distribution
Results of Null Hypothesis One
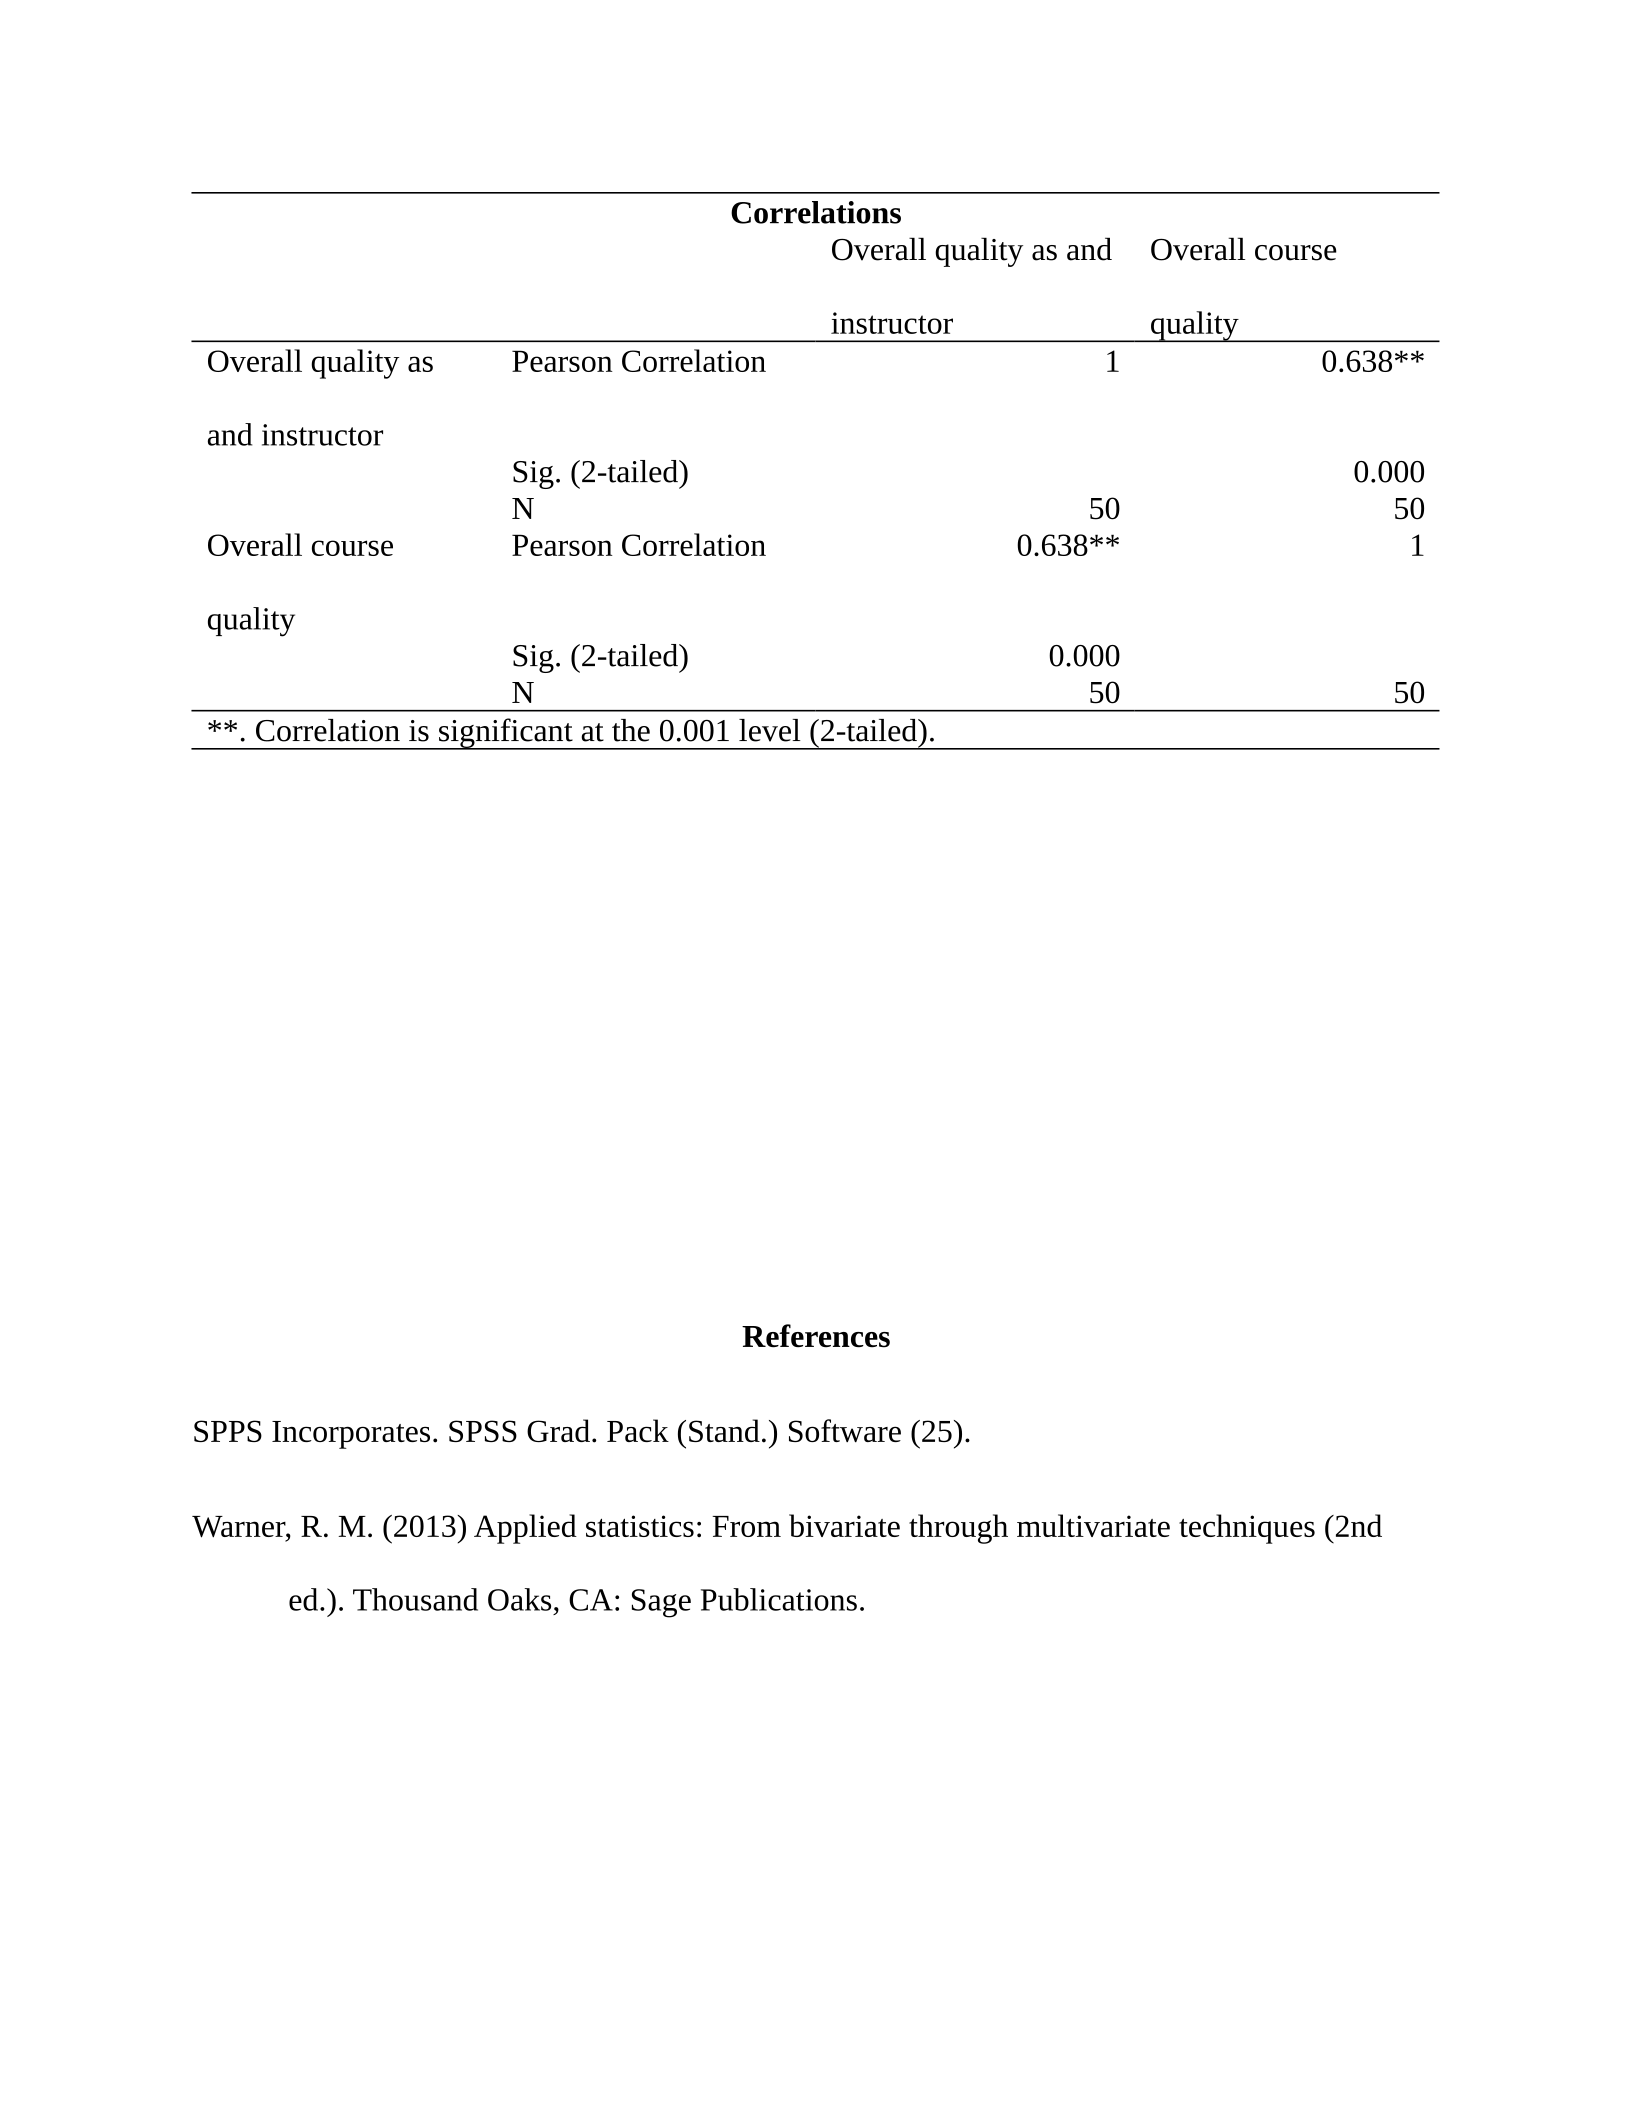
A Pearson correlation was conducted to determine if the was a signification relationship
between the instructor quality and course quality. The correlation between the two variables
indicated a statistical significance, r(48) = 0.64, p < 0.001, which indicated a large effective size.
Based on the analysis of the Pearson correlation, the researcher failed to reject the null
hypothesis, due to the positive relationship between the course quality and instructor quality. See
Table 1 for Pearson Correlations.
Correlations
Overall quality as and
instructor
Overall course
quality
Overall quality as
and instructor
Pearson Correlation 1 0.638**
Sig. (2-tailed) 0.000
N 50 50
Overall course
quality
Pearson Correlation 0.638** 1
Sig. (2-tailed) 0.000
N 50 50
**. Correlation is significant at the 0.001 level (2-tailed).
References
SPPS Incorporates. SPSS Grad. Pack (Stand.) Software (25).
Warner, R. M. (2013) Applied statistics: From bivariate through multivariate techniques (2nd
ed.). Thousand Oaks, CA: Sage Publications.

