


GROUP 1 SPSS WORKSHEET 6 MULTIPLE REGRESSION FINDINGS 1
GROUP #1 WRITE-UP: Multiple Regression
by
Tanea Robinson
Rachel N. Hernandez
Candi Skinner
Shontae Graham
Partial Fulfillment
Of the Requirements for EDUC 812
Liberty University
2018

GROUP 1 SPSS WORKSHEET 6 MULTIPLE REGRESSION FINDINGS 2
FINDINGS
Research Question
The research in this study focused on answering the following question:
RQ1: Is there a significant predictive relationship between the criterion variable (Stats Exam
Scores) and the linear combination of predictor variables (Math test, English test, English GPA,
Math GPA, and Other GPA) for college students?
Null Hypothesis
The null hypothesis for this study was:
H01: There will be no significant predictive relationship between the criterion variable
(Stats Exam Scores) and the linear combination of predictor variables (Math test, English test,
English GPA, Math GPA, and Other GPA) for college students.
Descriptive Statistics
Data obtained for the dependent variable Stats Exam Scores and independent variables
Math test, English test, English GPA, Math GPA, and Other GPA. Additionally, all groups
included 100 subjects, therefore allowing the examiner to make assumptions about the data. The
table of descriptive statistics can be found in Table 1.
Table 1.

GROUP 1 SPSS WORKSHEET 6 MULTIPLE REGRESSION FINDINGS 3
Descriptive Statistics
Group M SD N
Math Test 460.60 77.37 100
English Test 478.20 71.66 100
English GPA 2.82 .28 100
Math GPA 2.78 .30 100
Other GPA 3.02 .22 100
Stats Exam 60.11 19.79 100
Results
Data screening and Assumptions
Before conducting a multiple regression analysis on the data, the researcher must conduct
data screening and assumption testing. Data screening was conducted for the predictor and
criterion variables. Through this process, the researcher sought to identify inconsistencies within
the data, as well as correct any identified data errors, such as outliers. Results indicate that the
variables are multivariately normally distributed in the population. Additionally, the cases
represent a random sample from the population, and the scores on variables are independent of
other scores on the same variables.
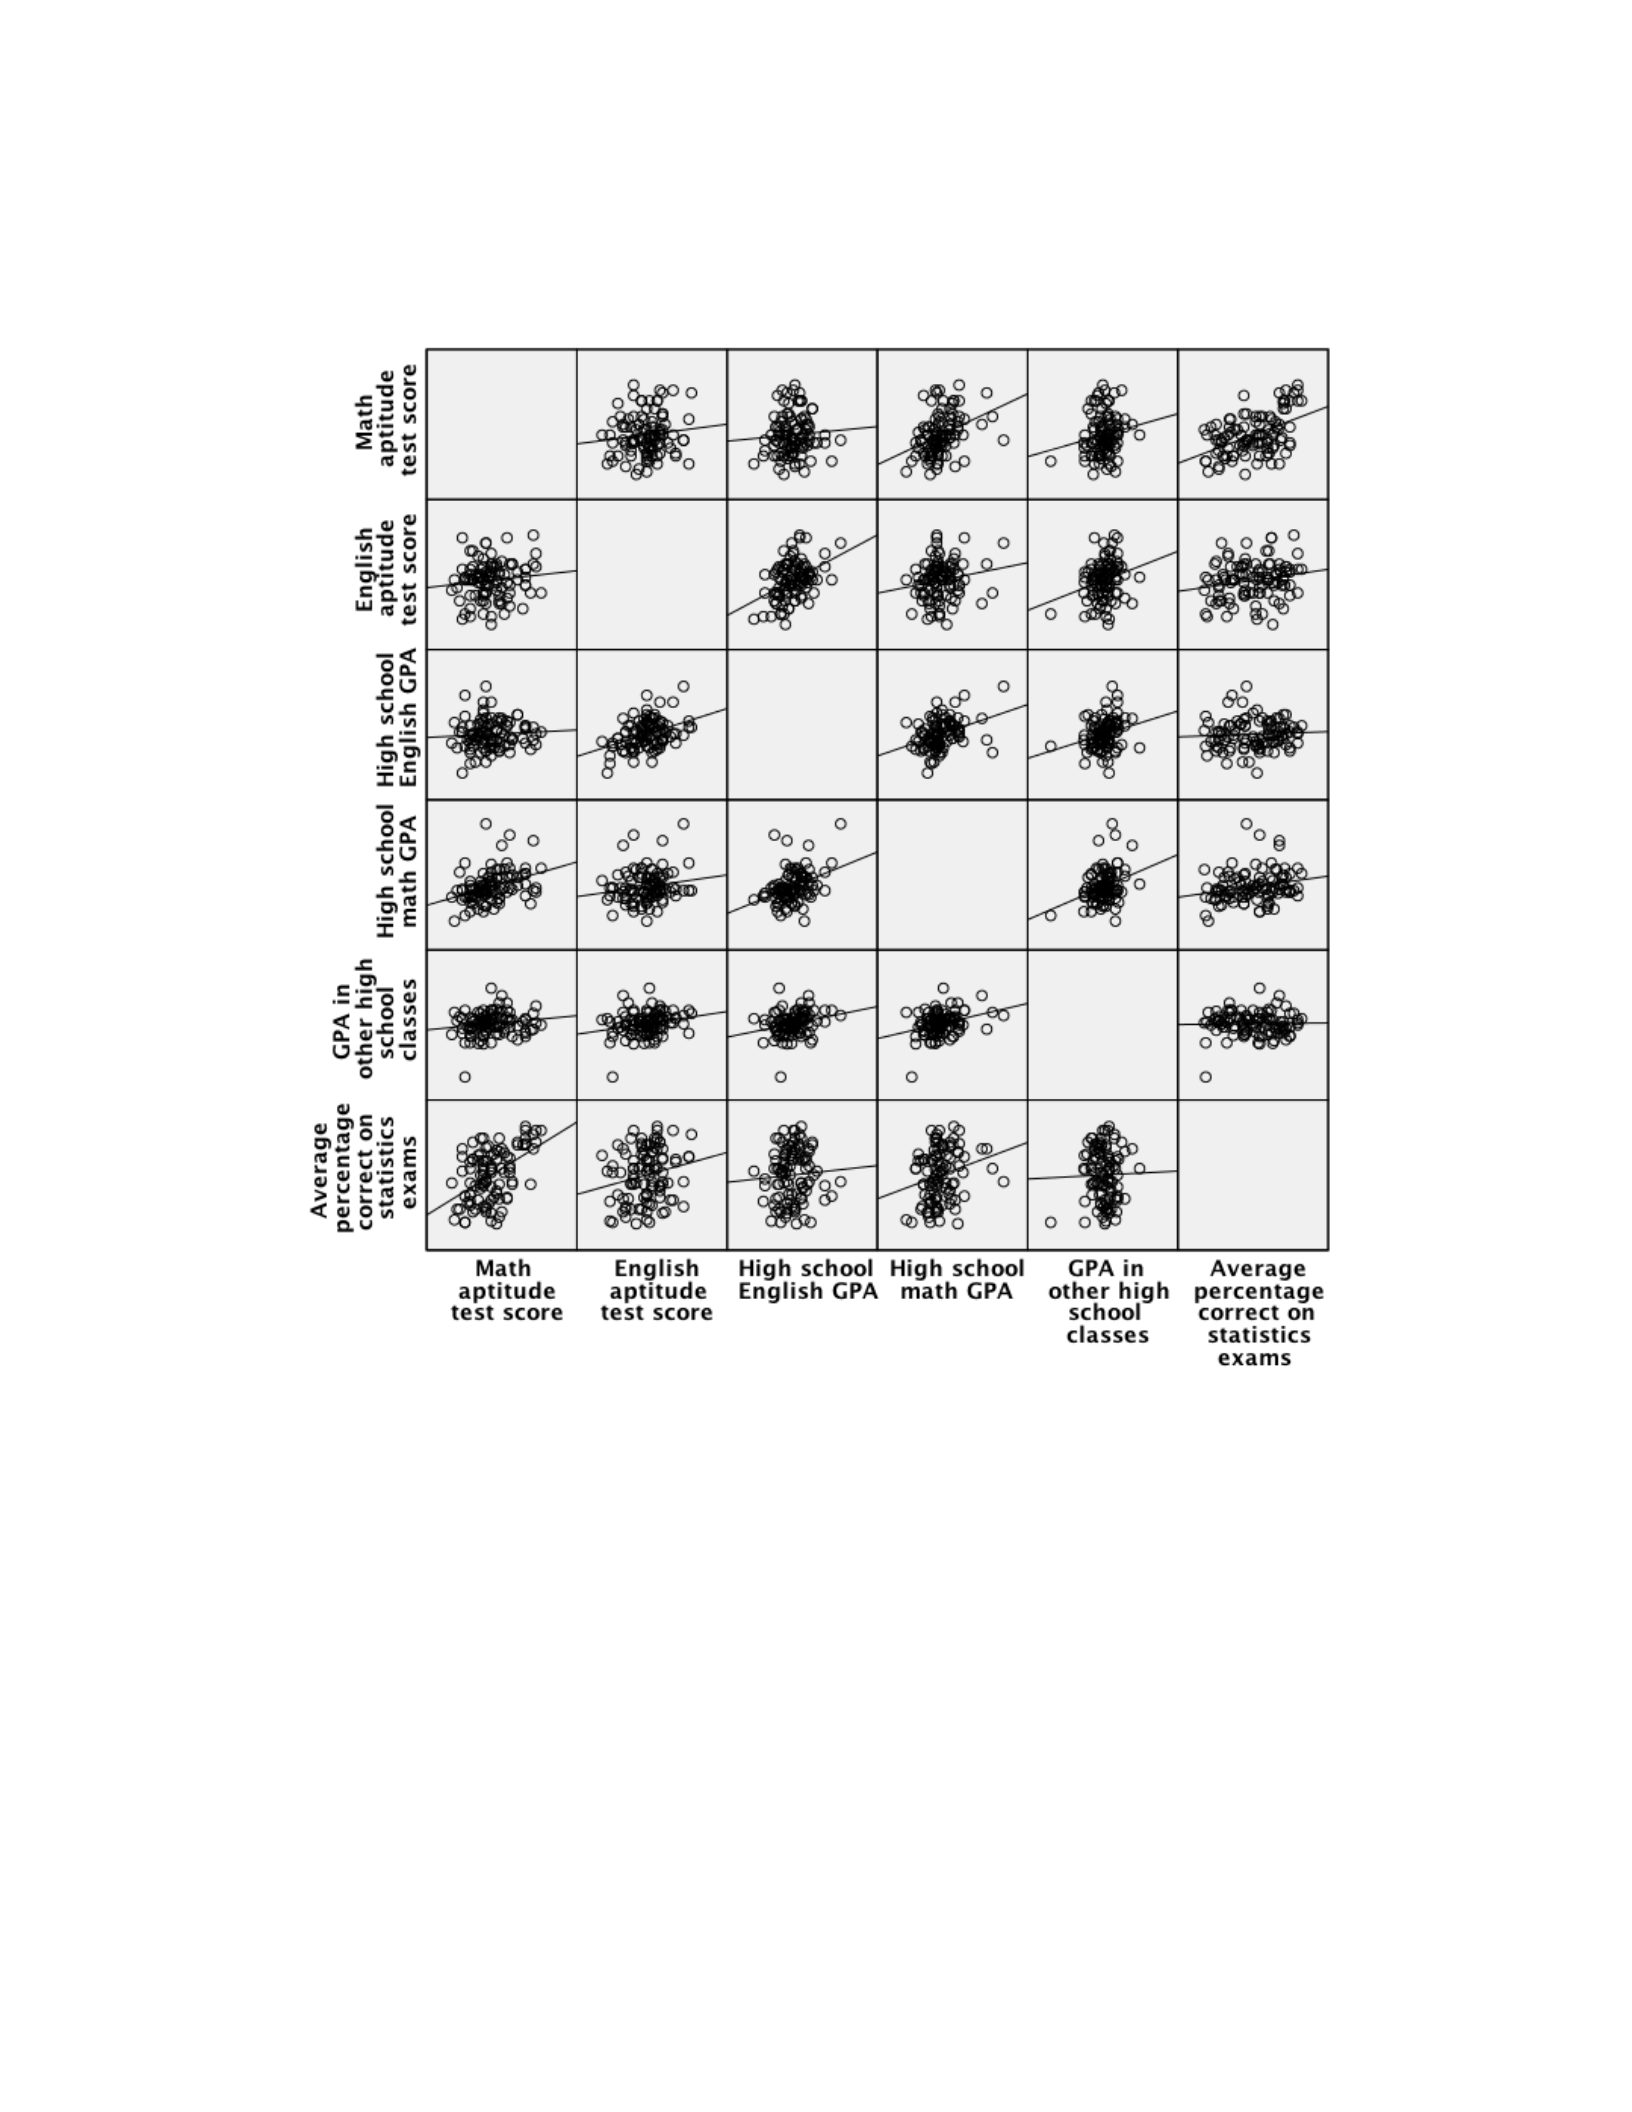
The researcher ran scatterplots between each pair of predictor variables, as well as the
predictor variables and criterion variable. The researcher concluded that the variables are
bivariately normally distributed in the population for this study. As such, each variable is
normally distributed ignoring the other variable and each variable is normally distributed at all
GROUP 1 SPSS WORKSHEET 6 MULTIPLE REGRESSION FINDINGS 4
levels of the other variable. The assumption of bivariate outliers was tenable and no extreme
outliers existed in the data. See Figure 1 for Assumption of Bivariate Outliers Scatterplot.
Figure 1. Assumption of Bivariate Outliers Scatterplot
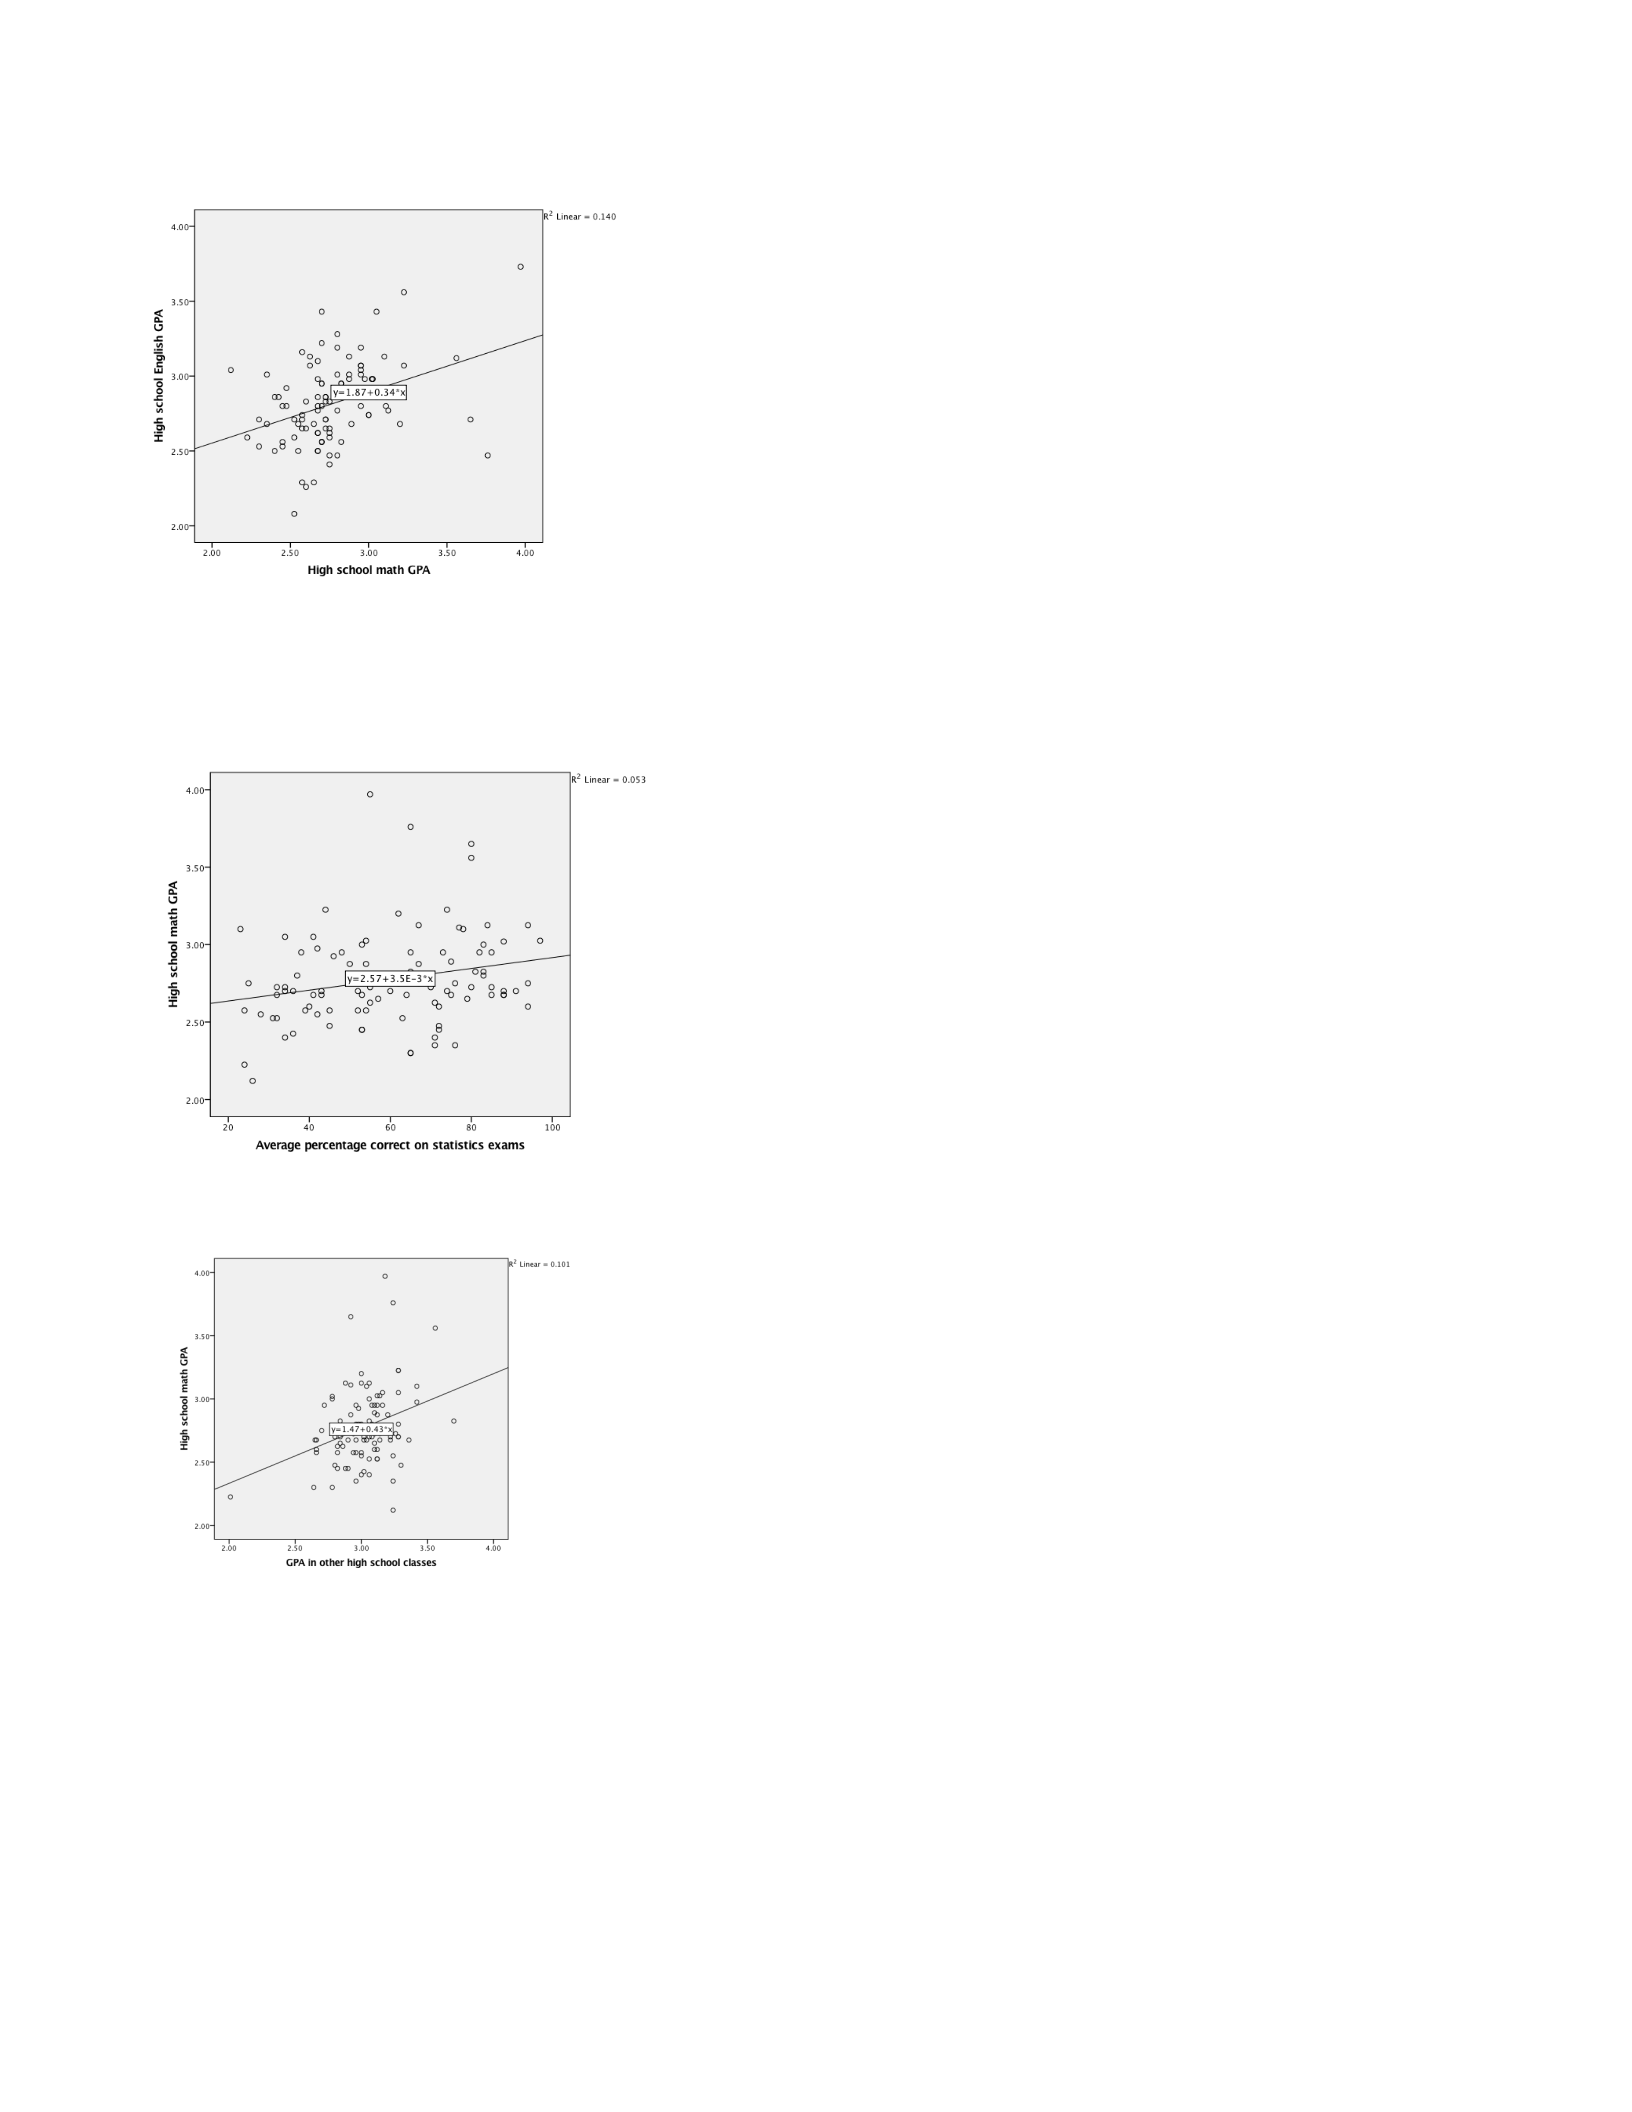
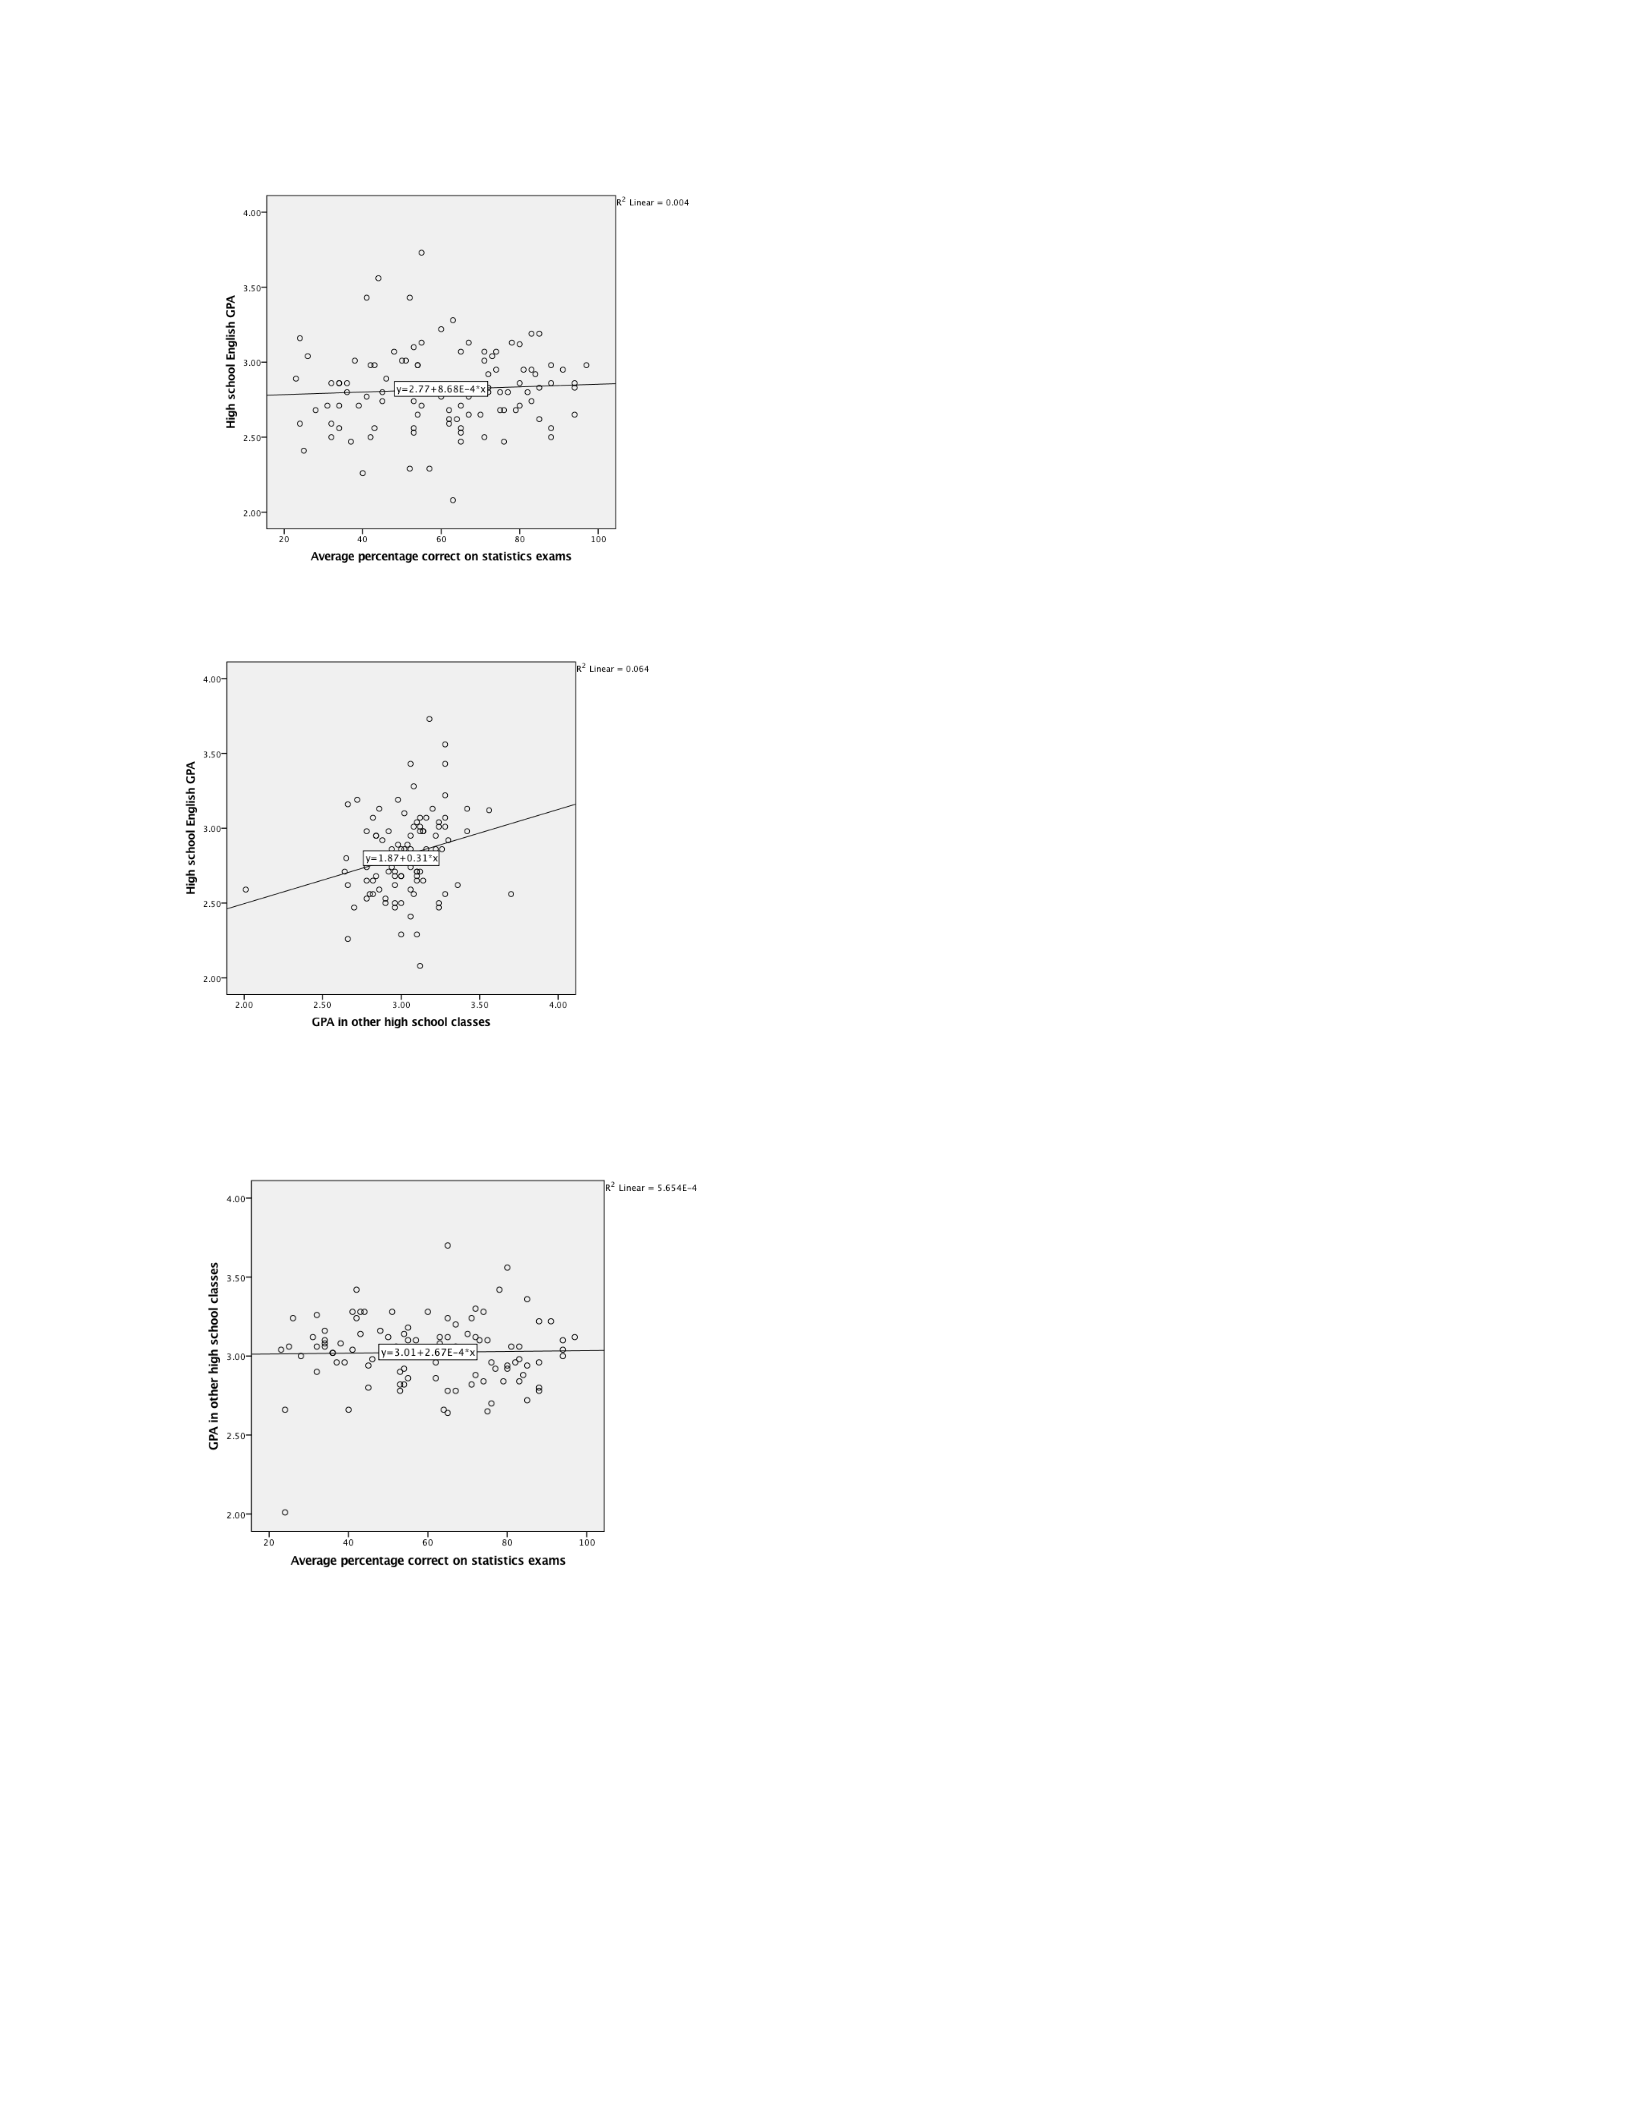
The researcher ran scatterplots between each pair of predictor variables, as well as the
predictor variables and criterion variable to analyze for the assumption of multivariate normal
distribution. The outcome of this analysis focused on the predictor and criterion variables, and
the appearance of a classic “cigar shape”. The assumption of multivariate normal distribution
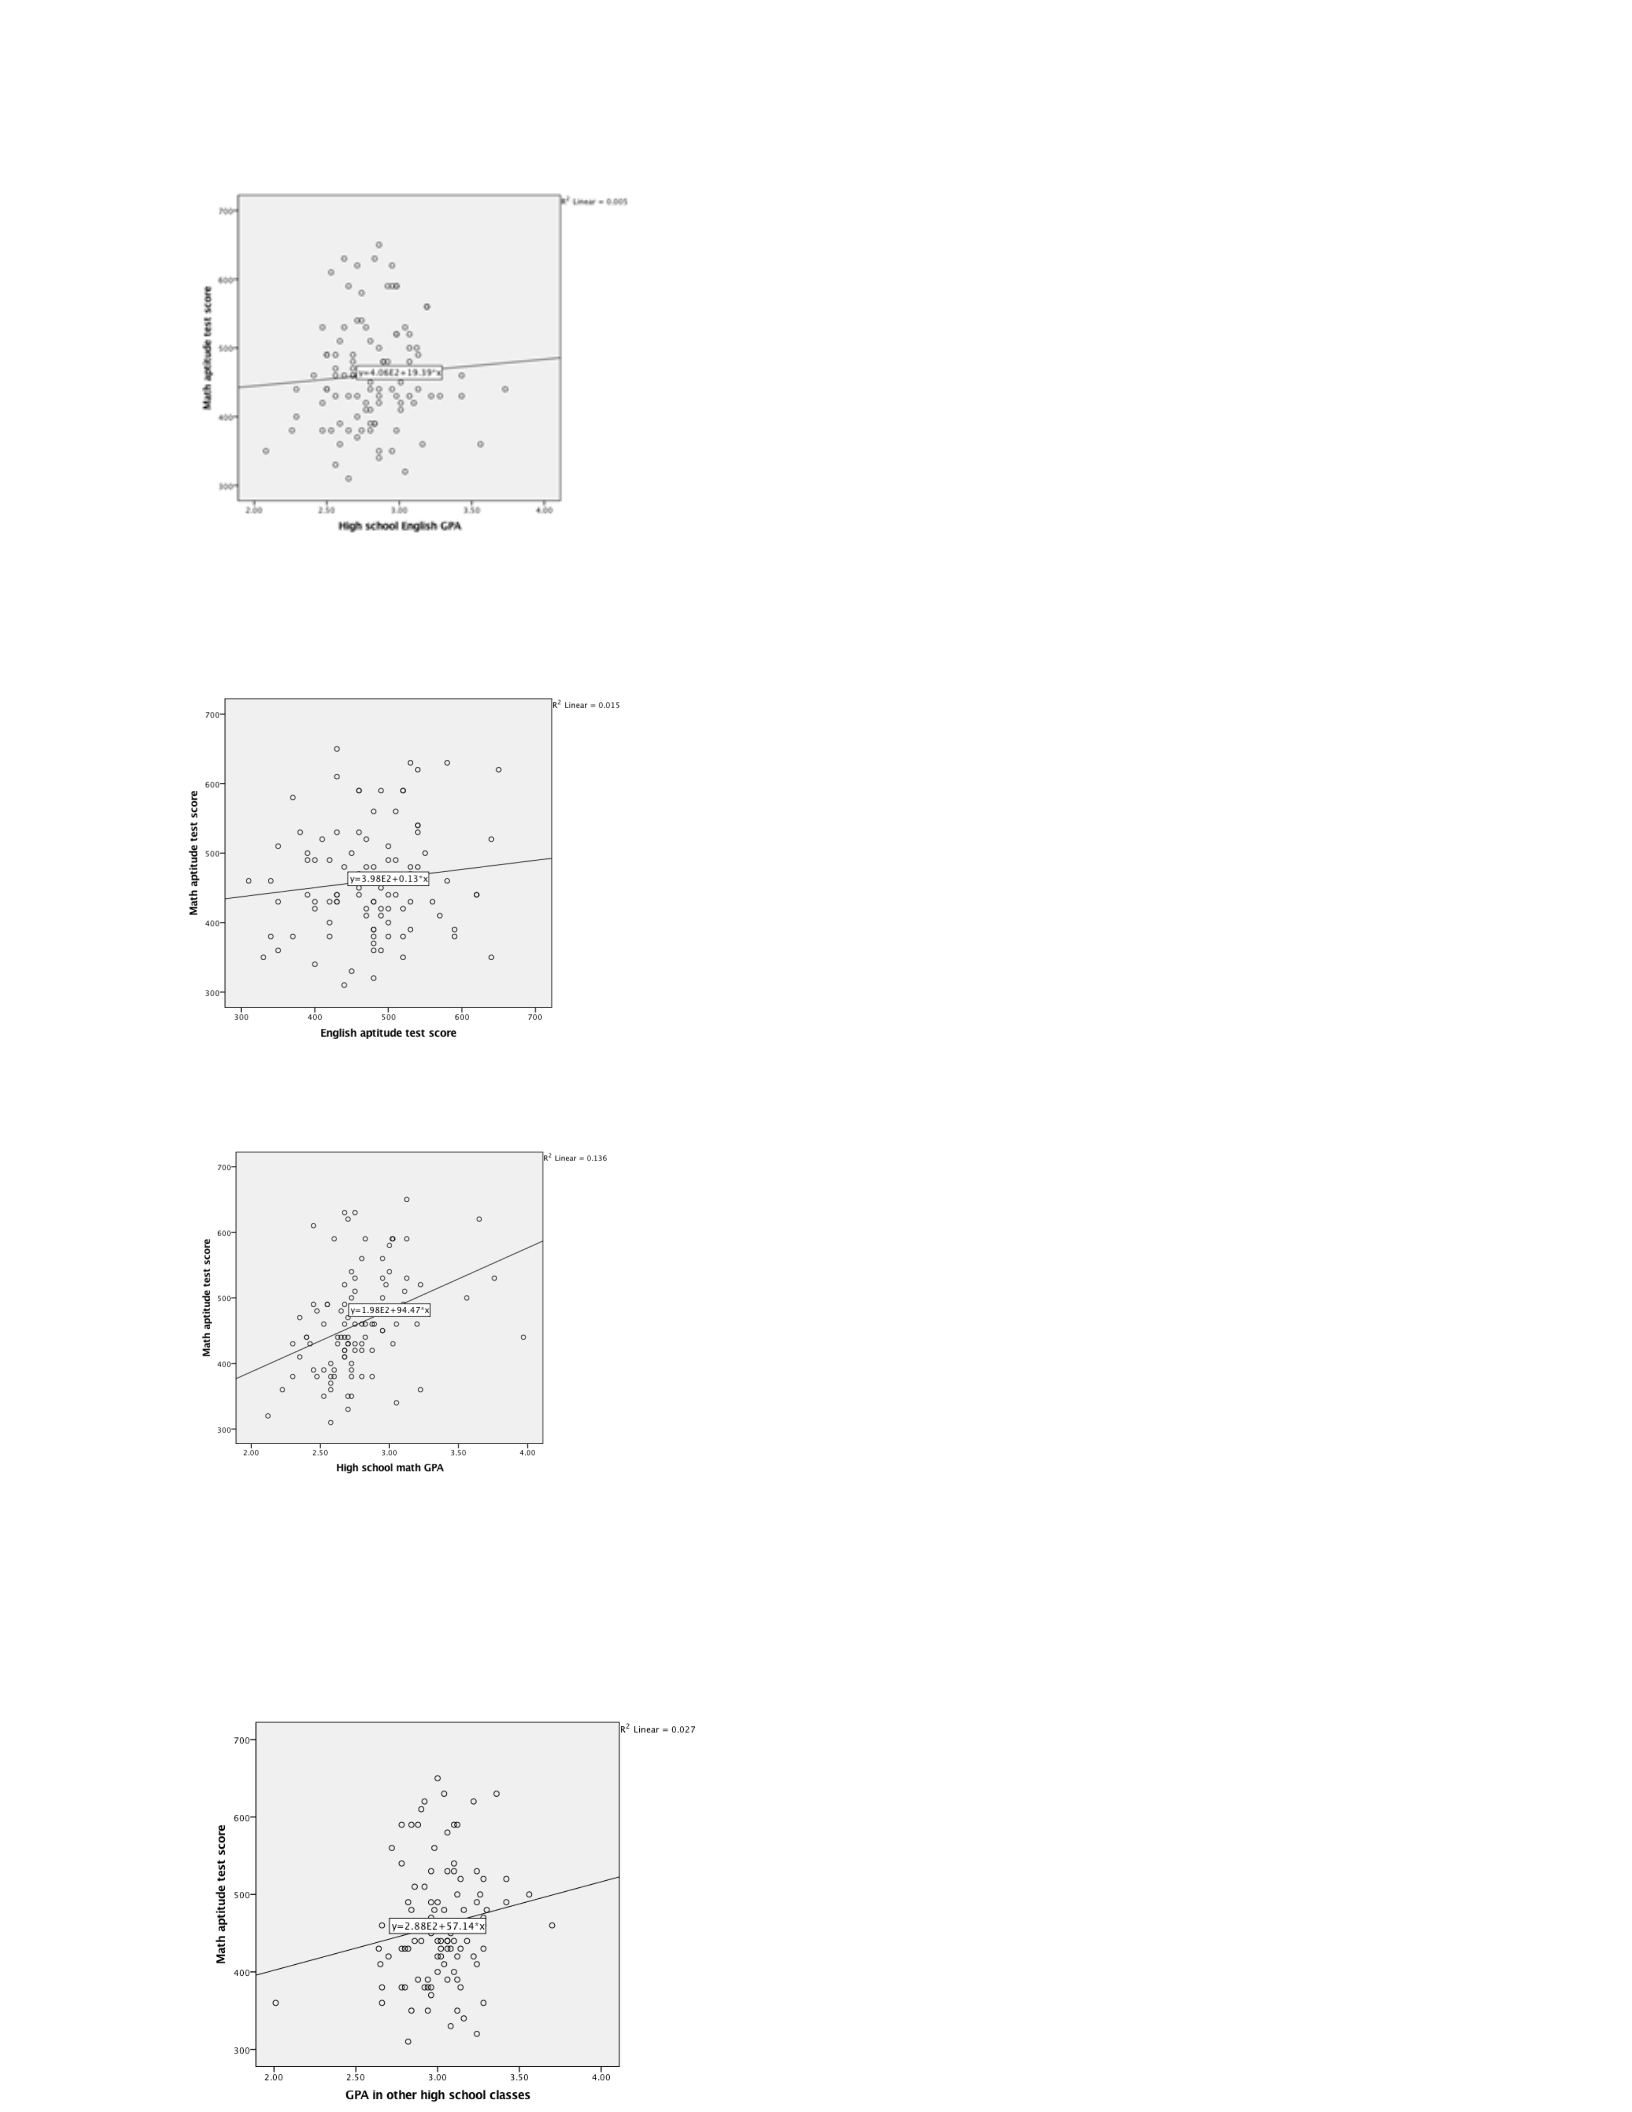
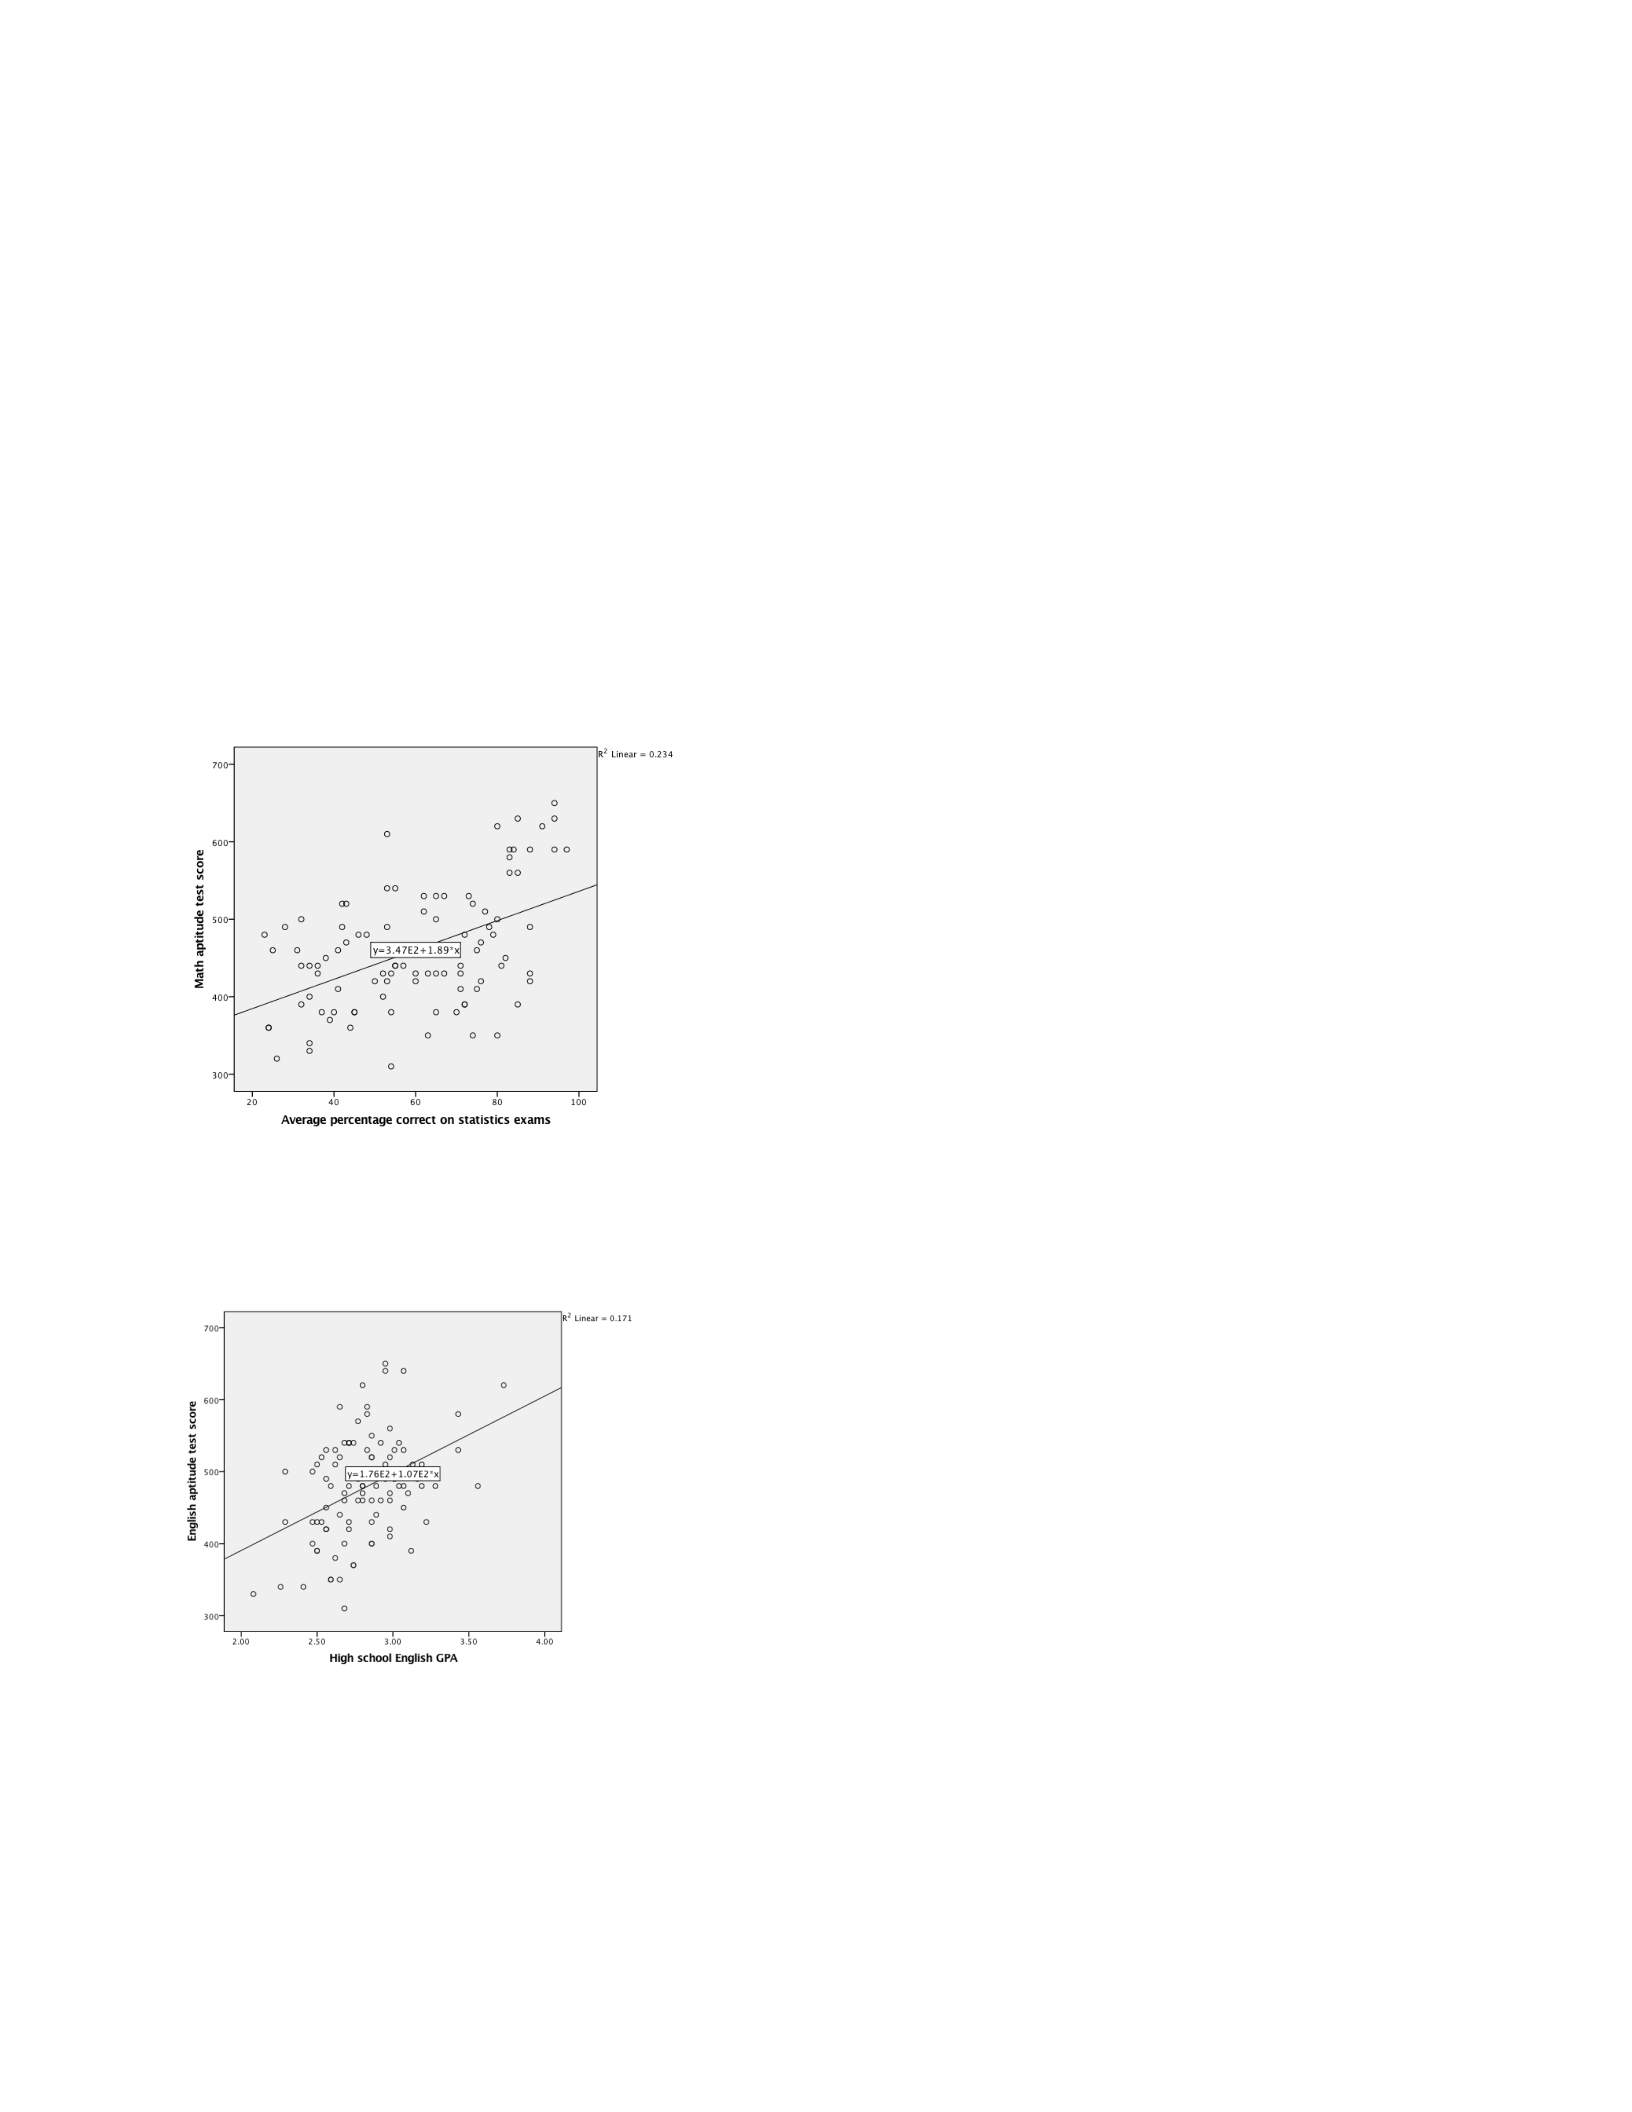
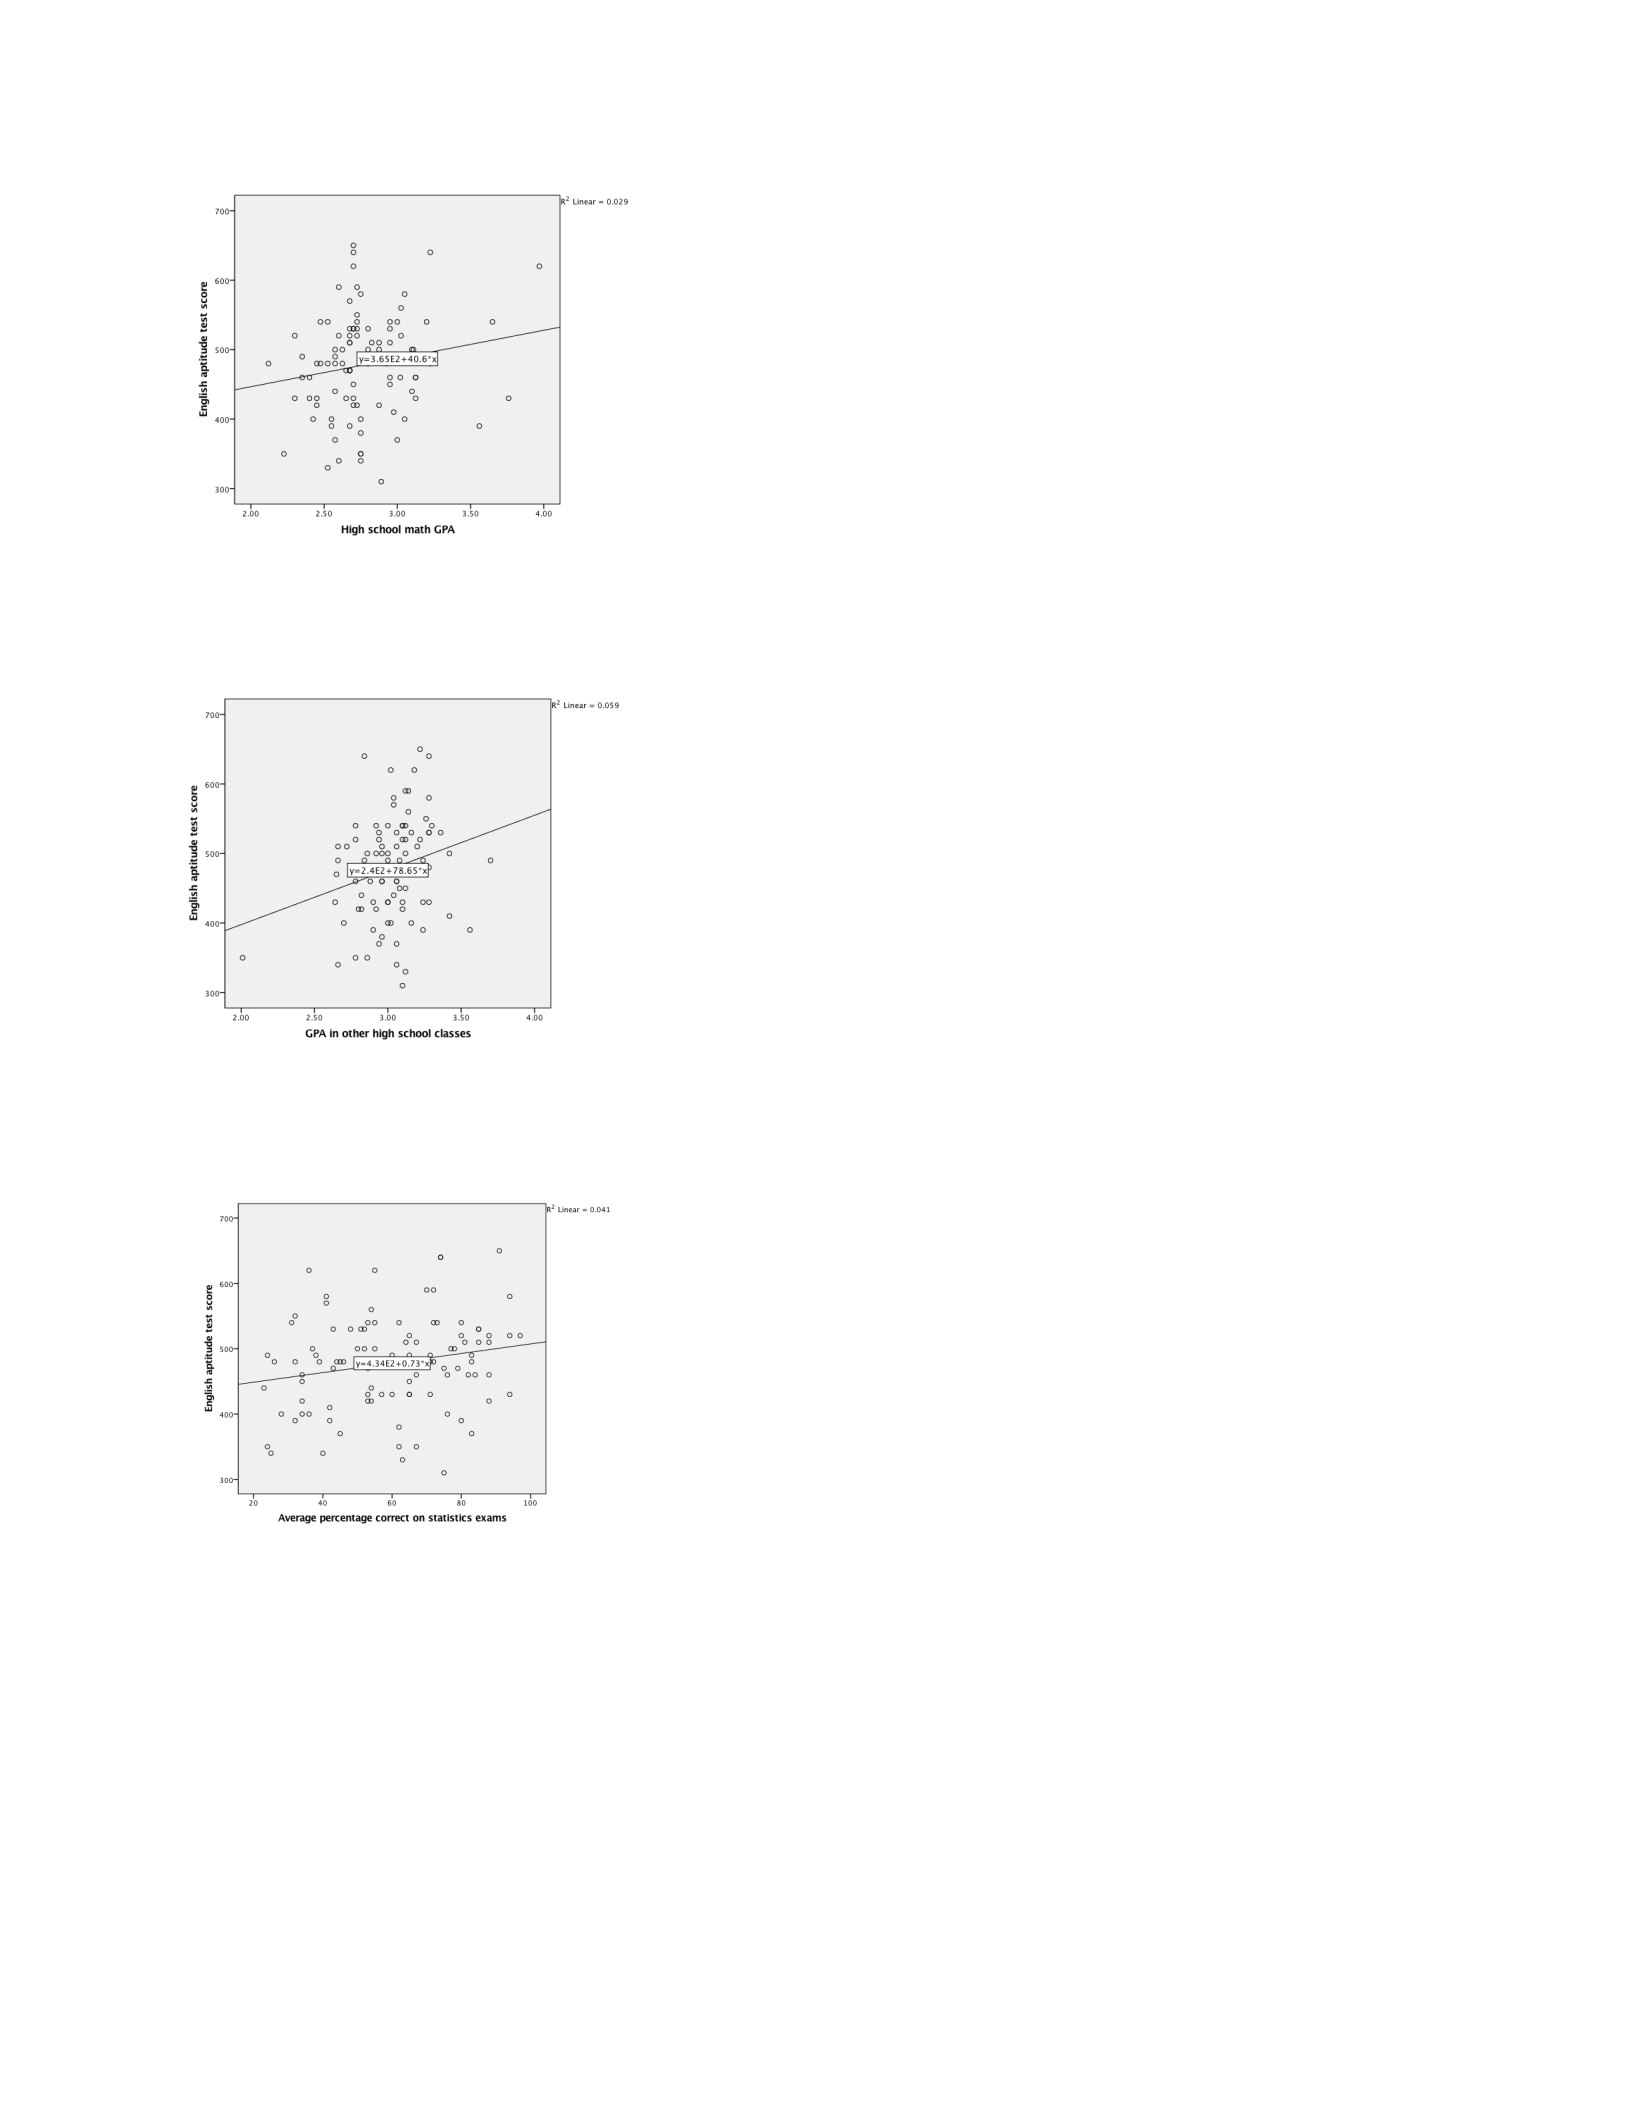
was tenable. See Figures 2 through 16 for the scatterplots for each set of variable comparisons.
GROUP 1 SPSS WORKSHEET 6 MULTIPLE REGRESSION FINDINGS 5
Figure 2. High School English GPA and Math Aptitude Test Score Scatterplot
Figure 3. English Aptitude Test Score and Math Aptitude Test Score Scatterplot
Figure 4. High School Math GPA and Math Aptitude Test Score Scatterplot
GROUP 1 SPSS WORKSHEET 6 MULTIPLE REGRESSION FINDINGS 6
Figure 5. GPA in Other High School Classes and Math Aptitude Test Score Scatterplot
Figure 6. Average Percentage Correct on Statistics Exams and Math Aptitude Test Score
Scatterplot
Figure 7. High School English GPA and English Aptitude Test Score Scatterplot
GROUP 1 SPSS WORKSHEET 6 MULTIPLE REGRESSION FINDINGS 7
Figure 8. High School Math GPA and English Aptitude Test Score Scatterplot
Figure 9. GPA in Other High School Classes and English Aptitude Test Score Scatterplot
Figure 10. Average Percentage Correct on Statistics Exams and English Aptitude Test Score
Scatterplot
GROUP 1 SPSS WORKSHEET 6 MULTIPLE REGRESSION FINDINGS 8
Figure 11. High School Math GPA and High School English GPA Scatterplot
Figure 12. Average Percentage Correct on Stat Exam and High School Math GPA Scatterplot
Figure 13. GPA in Other High School Classes and High School Math GPA Scatterplot
GROUP 1 SPSS WORKSHEET 6 MULTIPLE REGRESSION FINDINGS 9
Figure 14. Average Perc Correct on Statistics Exams and High School English GPA Scatterplot
Figure 15. GPA in Other High School Classes and High School English GPA Scatterplot
Figure 16. Average Percentage Correct on Stat Exams and GPA in Other High School Classes
Scatterplot

GROUP 1 SPSS WORKSHEET 6 MULTIPLE REGRESSION FINDINGS 10
Another important assumption of the regression analysis is the Assumption of
Multicollinearity among the Predictor Variables which assumes that the predictor variables are
not correlated among themselves. The Variance Inflation Factor is used to test this. A value larger
than 5 indicates violation of this assumptions. The result indicated no violation. See Table 2 for
Collinearity Statistics.
Table 2
Regression Model Coefficients
Model Unstand Stand 95.0% Collinearity
Coeff Coeff Confid Statistics
Interval
For B
__________________________________________________________________
B Std. Error Beta. t Sig. Lower Upper Tol VIF
Bound Bound
______________________________________________________________________________
Math Test .12 .03 .45 4.73 .000 .07 .16 .85 1.18
English Test .05 .03 .18 1.82 .07 -.01 .10 .80 1.25
English GPA -3.37 7.45 -.05 -.45 .65 18.15 11.42 .72 1.39
Math GPA 5.48 6.87 .08 .80 .43 -8.15 19.11 .71 1.42
Other GPA -9.70 8.50 -.11 -1.14 .26 -26.58 7.18 .85 1.17

GROUP 1 SPSS WORKSHEET 6 MULTIPLE REGRESSION FINDINGS 11
The Regression model Coefficients was then examined. Data was collected and the
results concluded and are reported in the Table 3, Regression Model Coefficients below.
Table 3.
Coefficientsa
Model
Unstandardized
Coefficients
Standardiz
ed
Coefficient
s
t
Si
g.
Collinearity
Statistics
B
Std.
Error
Bet
a
Toleran
ce VIF
Math aptitude test
score .116 .025 .453 4.726 .000 .847 1.181
English aptitude test
score .049 .027 .179 1.816 .073 .801 1.249
High school English
GPA -3.365 7.446 -.047 -.452 .652 .719 1.391
High school math
GPA 5.478 6.865 .084 .798 .427 .707 1.415
GPA in other high
school classes -9.702 8.500 -.109 -
1.141 .257 .854 1.172
a. Dependent Variable: Average percentage correct on statistics exams
Results for Null Hypothesis
An Regression Analysis was used to test the null hypothesis; relationship between the
criterion variable (Stats Exam Scores) and the linear combination of predictor variables (Math
test, English test, English GPA, Math GPA, and Other GPA) for college students and the
researcher proceeded to conduct an ANOVA to determine if the predictive model was statistically
significant. The null hypothesis was rejected at a 95% confidence level, F(5, 94) = 6.922, p <
0.001. See Table 4 for regression analysis.

GROUP 1 SPSS WORKSHEET 6 MULTIPLE REGRESSION FINDINGS 12
Table 4
ANOVA Results
Model Sum of df Mean F Sig.
Squares Square
______________________________________________________________________________
Regression 10432.432 5 2086.486 6.922 .000
Residual 28333.358 94 301.419
Total 38765.790 99
_____________________________________________________________________________
To determine which variable(s), if any, best predicts stats exam scores, the researcher
examined the Regression Model Coefficients. A correlation analysis reviewed the p-value of
each predictor variable under the t-stat coefficient. The results showed that the math aptitude test
score is the best predictor for stats exam scores, therefore the null hypothesis was rejected. See
Table 5 for the Regression Model Coefficients.
Table 5.
Regression Model Coefficients
Model Unstand Stand 95.0% Collinearity
Coeff Coeff Confid Statistics
Interval
For B
__________________________________________________________________
B Std. Error Beta. t Sig. Lower Upper Tol VIF
Bound Bound
______________________________________________________________________________
Math Test .12 .03 .45 4.73 .000 .07 .16 .85 1.18
English Test .05 .03 .18 1.82 .07 -.01 .10 .80 1.25
English GPA -3.37 7.45 -.05 -.45 .65 18.15 11.42 .72 1.39
Math GPA 5.48 6.87 .08 .80 .43 -8.15 19.11 .71 1.42

GROUP 1 SPSS WORKSHEET 6 MULTIPLE REGRESSION FINDINGS 13
Other GPA -9.70 8.50 -.11 -1.14 .26 -26.58 7.18 .85 1.17

