



ECON 350 - CLASSICAL
ECONOMICS - Descriptive statistics
Question Bank - Set 2
Liberty University
Question 1
Question
A data set consisting of the following values is given: 10, 15, 20, 25, 30, 35,
40, 45, 50. Calculate the mean, median, mode, range, variance, and standard
deviation of the data set.
Solution
Step 1: To find the mean, add up all the values in the data set and divide by
the total number of values.
Mean = 10 + 15 + 20 + 25 + 30 + 35 + 40 + 45 + 50
9
Mean = 270
9= 30
Step 2: To find the median, first, arrange the data set in ascending order:
10, 15, 20, 25, 30, 35, 40, 45, 50. Since there are 9 values, the median is the
middle value, which is 30.
Step 3: To find the mode, identify the value(s) that appear most frequently
in the data set. In this case, all values appear only once, so there is no mode.
Step 4: To find the range, subtract the minimum value from the maximum
value.
Range = 50 −10 = 40
Step 5: To find the variance, first, calculate the squared difference between
each value and the mean, then find the average of these squared differences.
Variance = (10 −30)2+ (15 −30)2+... + (50 −30)2
9

Variance = 400 + 225 + ... + 400
9
Variance = 900
9= 100
Step 6: To find the standard deviation, take the square root of the variance.
Standard Deviation = √100 = 10
Therefore, the mean is 30, the median is 30, there is no mode, the range is
40, the variance is 100, and the standard deviation is 10 for the given data set.
Question 2
Question
Suppose a statistics class has 25 students. Their scores on a quiz are as follows:
60, 70, 75, 80, 85, 90, 95, 100. Assuming these scores are the entire population,
calculate the sample mean, sample variance, and sample standard deviation.
Solution
Step 1: Calculate the Sample Mean The sample mean (¯x) is calculated using
the formula:
¯x=Pn
i=1 xi
n
where xiare the individual data points and nis the number of data points.
Given the data points: 60, 70, 75, 80, 85, 90, 95, 100 and n= 8 (number of
data points), we can find the sample mean.
¯x=60 + 70 + 75 + 80 + 85 + 90 + 95 + 100
8= 80
Therefore, the sample mean is 80.
Step 2: Calculate the Sample Variance The sample variance (s2) is
calculated using the formula:
s2=Pn
i=1(xi−¯x)2
n−1
where xiare the individual data points, ¯xis the sample mean, and nis the
number of data points.
Given the data points and the sample mean from before, we can find the
sample variance.
s2=(60 −80)2+ (70 −80)2+ (75 −80)2+ (80 −80)2+ (85 −80)2+ (90 −80)2+ (95 −80)2+ (100 −80)2
8−1
2

s2=400 + 100 + 25 + 0 + 25 + 100 + 225 + 400
7=1275
7≈182.14
Therefore, the sample variance is approximately 182.14.
Step 3: Calculate the Sample Standard Deviation The sample stan-
dard deviation (s) is the square root of the sample variance:
s=√s2=√182.14 ≈13.49
Therefore, the sample standard deviation is approximately 13.49.
Question 3
Question
A researcher collected data on the heights of 50 adult women. The mean height
was found to be 64 inches with a standard deviation of 3 inches.
(a) Calculate the coefficient of variation for the heights of these women.
(b) If the researcher mistakenly recorded the height of one woman as 70
inches instead of 60 inches, will this affect the coefficient of variation signifi-
cantly?
Solution
(a) The coefficient of variation is a measure of relative variability and is cal-
culated as the ratio of the standard deviation to the mean, expressed as a
percentage. It is given by the formula:
CV =Standard Deviation
Mean ×100%
Substitute the given values: Mean = 64 inches, Standard Deviation = 3
inches
CV =3
64×100%
CV = 0.0469 ×100% = 4.69%
Therefore, the coefficient of variation for the heights of these women is 4.69
(b) Let’s consider the effect of mistakenly recording the height of one woman
as 70 inches instead of 60 inches on the coefficient of variation.
1. Original mean height:
Mean = 64 inches
2. Original sum of heights:
Sum of heights = 50 ×64 = 3200 inches
3

3. Adjusted sum of heights after the mistaken recording:
Adjusted sum of heights = 3200 + 70 −60 = 3210 inches
4. Adjusted mean height:
Adjusted mean height = 3210
50 = 64.2 inches
5. Adjusted standard deviation: Given that standard deviation, s= 3
inches, we can calculate the new standard deviation after the adjustment.
6. Calculate the new coefficient of variation using the adjusted mean and
standard deviation.
CVadjusted =sadjusted
Meanadjusted ×100%
Since the mistake in recording only affects one data point out of 50, the
impact on the coefficient of variation is likely to be minimal.
Question 4
Question
A researcher collected data on the ages of participants in a study and found the
following summary statistics: mean age = 32.5, variance = 49.6, and standard
deviation = 7.04. Determine the median age of the participants.
Solution
Step 1: Recall that the variance is defined as the average of the squared differ-
ences between each data point and the mean. Mathematically, we have
Var = 1
n
n
X
i=1
(xi−¯x)2
where nis the number of data points, xiis the ith data point, and ¯xis the
mean.
Step 2: Given that the variance is 49.6, we can write
49.6 = 1
n
n
X
i=1
(xi−32.5)2
Step 3: We are also given that the standard deviation is 7.04. Recall that
the standard deviation is the square root of the variance, i.e.,
SD = √Var
4

Step 4: Substitute the given standard deviation into the equation for variance
to find the number of data points:
7.04 = √49.6
Step 5: Solving for n, we get
n=49.6
7.042≈49.6
49.5616 ≈1
Step 6: Since n≈1, we can deduce that the researcher only collected data on
one participant. Thus, the median age (which is the age of the sole participant)
is 32.5 .
Question 5
Question
In a study of the ages of students enrolled in a university, the following descrip-
tive statistics were calculated:
Mean: 22.5 years
Standard Deviation: 3.2 years
Minimum Age: 18 years
Maximum Age: 30 years
Given this information, determine the coefficient of variation for the ages of
the students.
Solution
To find the coefficient of variation, we use the formula:
Coefficient of Variation (CV) = Standard Deviation
Mean ×100%
Step 1: Calculate the Coefficient of Variation
Coefficient of Variation (CV) = 3.2
22.5×100%
= 0.1422 ×100%
= 14.22%
The coefficient of variation for the ages of the students is 14.22%.
5

Question 6
Question
Let’s say you have a dataset with the following values: 6, 8, 10, 6, 12, 6, 14, 8.
Calculate the mean, median, mode, variance, standard deviation, and range of
the dataset.
Solution
To find the descriptive statistics of the dataset, we will calculate the mean,
median, mode, variance, standard deviation, and range step by step.
Step 1: Calculate the mean The mean is calculated by summing up all
the values in the dataset and then dividing by the total number of values.
Mean = 6+8+10+6+12+6+14+8
8
Mean = 70
8= 8.75
Step 2: Calculate the median To find the median, we first need to
arrange the values in ascending order: 6, 6, 6, 8, 8, 10, 12, 14. Since there are
an even number of values, the median is the average of the two middle values.
Median = 8+8
2= 8
Step 3: Calculate the mode The mode is the value that appears most
frequently in the dataset. In this case, the mode is 6, as it appears three times.
Step 4: Calculate the variance The variance measures how spread out
the values in the dataset are. To calculate the variance, we first need to find the
squared differences between each value and the mean, then sum them up and
divide by the total number of values.
Variance = (6 −8.75)2+ (8 −8.75)2+ (10 −8.75)2+ (6 −8.75)2+ (12 −8.75)2+ (6 −8.75)2+ (14 −8.75)2+ (8 −8.75)2
8
Variance = 57.5
8= 7.1875
Step 5: Calculate the standard deviation The standard deviation is
the square root of the variance.
Standard deviation = √7.1875 ≈2.68
Step 6: Calculate the range The range is the difference between the
maximum and minimum values in the dataset. Range = 14 −6 = 8
Therefore, the mean is 8.75, the median is 8, the mode is 6, the variance is
7.1875, the standard deviation is approximately 2.68, and the range is 8.
6

Question 7
Question
Suppose a researcher collected the following data on the heights (in centimeters)
of 10 adult males:
175,180,165,190,185,170,175,160,200,195
Calculate the mean, median, mode, range, variance, and standard deviation
of the data set.
Solution
Let’s calculate the mean, median, mode, range, variance, and standard deviation
step-by-step.
Step 1: Calculate the Mean The mean (¯x) is calculated by adding up
all the values and dividing by the total number of values (10 in this case).
Mean = 175 + 180 + 165 + 190 + 185 + 170 + 175 + 160 + 200 + 195
10
Mean = 1775
10 = 177.5
Therefore, the mean height is 177.5 cm.
Step 2: Calculate the Median To find the median, we first need to
arrange the data in ascending order.
160,165,170,175,175,180,185,190,195,200
Since there are 10 values, the median is the average of the 5th and 6th values.
Median = 175 + 180
2= 177.5
Therefore, the median height is 177.5 cm.
Step 3: Calculate the Mode The mode is the value that appears most
frequently in the data set. In this case, there is no unique mode as each value
appears only once. So, the data set has no mode.
Step 4: Calculate the Range The range is the difference between the
largest and smallest values in the data set.
Range = 200 −160 = 40
Therefore, the range of heights is 40 cm.
Step 5: Calculate the Variance The variance is a measure of how spread
out the values in a data set are. It is calculated using the formula:
Variance = P(xi−¯x)2
n
7

where xiare the individual values, ¯xis the mean, and nis the total number of
values (10 in this case).
Variance = (175 −177.5)2+ (180 −177.5)2+. . . + (195 −177.5)2
10
Calculating this value gives us a variance of 140.25.
Step 6: Calculate the Standard Deviation The standard deviation is
the square root of the variance.
Standard Deviation = √140.25 = 11.84
Therefore, the standard deviation of the heights is 11.84 cm.
Question 8
Question
Let’s consider a dataset representing the heights (in inches) of 30 college stu-
dents. The descriptive statistics for this dataset are as follows: mean height =
65.7 inches, standard deviation = 3.5 inches. Assuming the heights are normally
distributed, calculate the z-score for a student who is 70 inches tall.
Solution
Step 1: Recall that the z-score formula is given by z=x−µ
σ, where xis the
value we are interested in, µis the mean, and σis the standard deviation.
Step 2: Substituting the given values into the formula, we have:
z=70 −65.7
3.5
Step 3: Calculate the z-score:
z=4.3
3.5= 1.2286
Step 4: Therefore, the z-score for a student who is 70 inches tall is ap-
proximately 1.2286. This means that the student’s height is 1.2286 standard
deviations above the mean height of the dataset.
Question 9
Question
Let X={8,12,15,21,24}and Y={10,13,17,22,28}be two data sets. Calcu-
late the median, mode, and range for each data set.
8

Solution
Step 1: To find the median of a data set, we first need to arrange the data set
in ascending order. For set X, the data set is {8,12,15,21,24}. When arranged
in ascending order, we get {8,12,15,21,24}. The median is the middle value,
which is 15.
For set Y, the data set is {10,13,17,22,28}. When arranged in ascending
order, we get {10,13,17,22,28}. The median is the middle value, which is 17.
Step 2: To find the mode of a data set, we need to identify the value that
appears most frequently. If there are multiple modes, the data set is considered
multimodal. For set X, all values appear only once, so there is no mode.
For set Y, all values appear only once, so there is no mode.
Step 3: To find the range of a data set, we need to find the difference between
the maximum and minimum values. For set X, the minimum value is 8 and the
maximum value is 24. Therefore, the range is 24 −8 = 16.
For set Y, the minimum value is 10 and the maximum value is 28. Therefore,
the range is 28 −10 = 18.
In conclusion, - The median of set Xis 15 and the mode is undefined. - The
median of set Yis 17 and the mode is undefined. - The range of set Xis 16
and the range of set Yis 18.
Question 10
Question
In a study of the heights of students in a university, the following data was
collected: 160 cm, 165 cm, 170 cm, 172 cm, 175 cm, 180 cm, 185 cm, 190 cm,
195 cm. Calculate the mean, median, mode, range, variance, and standard
deviation of the heights.
Solution
Step 1: Calculate the mean. The mean is calculated using the formula:
Mean = Pn
i=1 xi
n
where xiare the individual heights and nis the number of observations.
Calculating the mean:
Mean = 160 + 165 + 170 + 172 + 175 + 180 + 185 + 190 + 195
9=1592
9= 176.9 cm
Step 2: Calculate the median. To find the median, first arrange the data in
ascending order: 160, 165, 170, 172, 175, 180, 185, 190, 195.
Since there are 9 observations, the median is the middle value, which is the
fifth value: Median = 175 cm.
9

Step 3: Calculate the mode. The mode is the value that appears most
frequently in the data set. In this case, all values appear only once, so there is
no mode.
Step 4: Calculate the range. The range is the difference between the highest
and lowest values in the data set. Range = 195 cm - 160 cm = 35 cm.
Step 5: Calculate the variance. The variance is calculated using the formula:
Variance = Pn
i=1(xi−Mean)2
n
Calculating the variance:
Variance = (160 −176.9)2+ (165 −176.9)2+. . . + (195 −176.9)2
9=829.6
9≈92.178 cm2
Step 6: Calculate the standard deviation. The standard deviation is the
square root of the variance:
Standard Deviation = √Variance = √92.178 ≈9.6 cm
Therefore, the mean height is 176.9 cm, the median height is 175 cm, there
is no mode, the range is 35 cm, the variance is approximately 92.178 cm2, and
the standard deviation is approximately 9.6 cm.
Question 11
Question
Suppose a researcher collected data on the test scores of students in two different
classes. The mean test score for Class A was 85 with a standard deviation of 10,
while the mean test score for Class B was 78 with a standard deviation of 8. If
the two classes had the same number of students, calculate the pooled standard
deviation for the combined data.
Solution
Step 1: Calculate the pooled standard deviation using the formula:
Pooled standard deviation = s(n1−1)s2
1+ (n2−1)s2
2
n1+n2−2
where n1and n2are the number of observations in Class A and Class B re-
spectively, and s1and s2are the standard deviations for Class A and Class
B.
Given: n1=n2,s1= 10, s2= 8
Substitute the values into the formula:
Pooled standard deviation = s(n1−1)(10)2+ (n1−1)(8)2
2n1−2
10
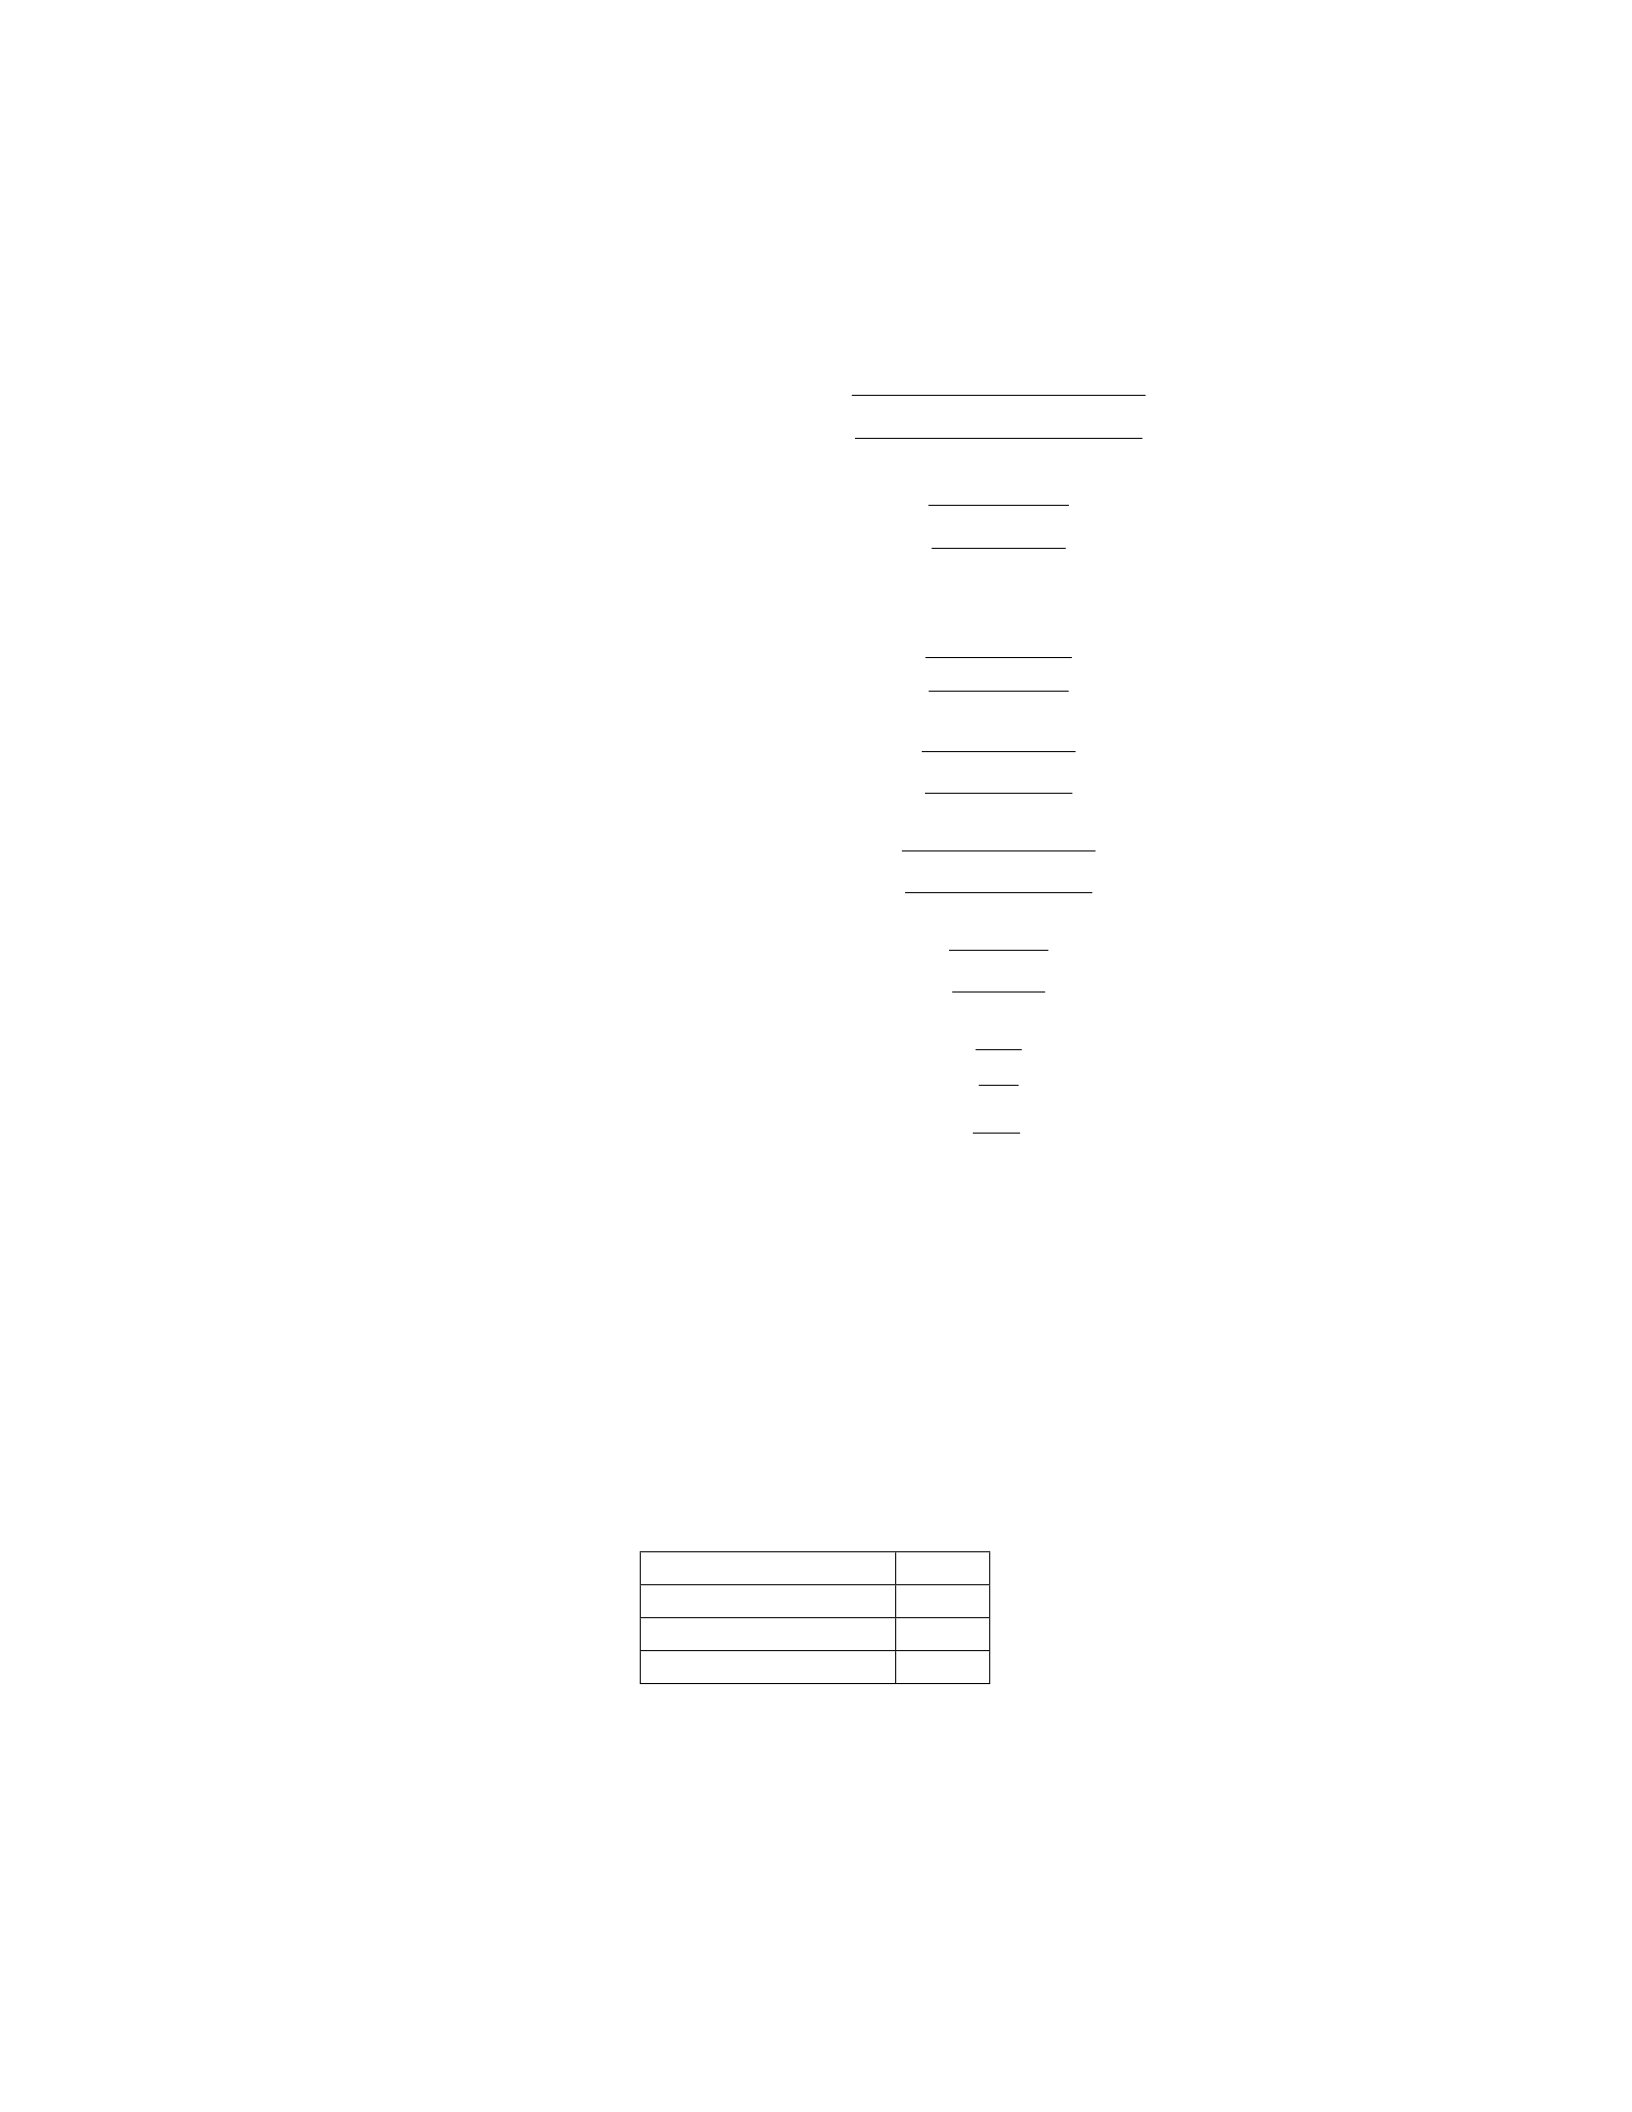
Step 2: Simplify the equation further:
Pooled standard deviation = s100(n1−1) + 64(n1−1)
2n1−2
Pooled standard deviation = s164(n1−1)
2n1−2
Step 3: Expand and simplify:
Pooled standard deviation = r164n1−164
2n1−2
Pooled standard deviation = s4(41n1−41)
2(2n1−1)
Pooled standard deviation = s4(41(n1−1)
2(2(n1−1) + 1)
Pooled standard deviation = s4(41)
2(2) + 1
Pooled standard deviation = r164
5
Pooled standard deviation = √32.8
Pooled standard deviation ≈5.72
Therefore, the pooled standard deviation for the combined data is approxi-
mately 5.72.
Question 12
Question
A researcher collected data on the monthly salaries of employees at a large
company. The data is summarized in the following table:
Mean $5000
Median $4800
Mode $4500
Standard Deviation $600
Based on the given information, is the distribution of monthly salaries skewed
to the left, skewed to the right, or approximately symmetric?
11

Solution
Step 1: Since the mean, median, and mode are all different, this indicates that
the distribution of monthly salaries is not symmetric.
Step 2: To determine whether the distribution is skewed to the left, skewed to
the right, or approximately symmetric, we can compare the mean and median.
Step 3: If the mean is less than the median, the distribution is skewed to
the left. If the mean is greater than the median, the distribution is skewed to
the right. If the mean is approximately equal to the median, the distribution is
approximately symmetric.
Step 4: In this case, the mean is $5000 and the median is $4800. Since the
mean is greater than the median, the distribution of monthly salaries is skewed
to the right.
Question 13
Question
Let X={3,5,7,8,11,15}and Y={2,4,6,9,12,14}. Compute the sample
mean, sample variance, and sample standard deviation for each set.
Solution
Step 1: Calculate the mean. The sample mean ¯
Xfor set Xis given by
¯
X=1
n
n
X
i=1
xi.
Similarly, the sample mean ¯
Yfor set Yis given by
¯
Y=1
m
m
X
j=1
yj.
Step 2: Calculate the variance. The sample variance s2
Xfor set Xis given
by
s2
X=1
n−1
n
X
i=1
(xi−¯
X)2.
Similarly, the sample variance s2
Yfor set Yis given by
s2
Y=1
m−1
m
X
j=1
(yj−¯
Y)2.
Step 3: Calculate the standard deviation. The sample standard deviation
sXfor set Xis simply the square root of the variance: sX=ps2
X. Similarly,
the sample standard deviation sYfor set Yis sY=ps2
Y.
12

Question 14
Question
A researcher collected the following data on the number of hours spent studying
for an exam by a group of students: 2, 3, 4, 5, 6, 7, 8, 9, 10. Calculate the mean,
median, variance, and standard deviation of the data set.
Solution
Step 1: Calculate the mean. The mean is calculated by summing all the data
points and dividing by the total number of data points.
Mean = 2+3+4+5+6+7+8+9+10
9=54
9= 6
Step 2: Calculate the median. To find the median, first arrange the data
in ascending order: 2, 3, 4, 5, 6, 7, 8, 9, 10. Since there are 9 data points, the
median is the middle value, which is the 5th value.
Median = 6
Step 3: Calculate the variance. The variance is the average of the squared
differences between each data point and the mean.
Variance = (2 −6)2+ (3 −6)2+ (4 −6)2+ (5 −6)2+ (6 −6)2+ (7 −6)2+ (8 −6)2+ (9 −6)2+ (10 −6)2
9
=16+9+4+1+0+1+4+9+16
9=60
9≈6.67
Step 4: Calculate the standard deviation. The standard deviation is the
square root of the variance.
Standard deviation = √6.67 ≈2.58
Therefore, the mean is 6, the median is 6, the variance is 6.67, and the
standard deviation is approximately 2.58.
Question 15
Question
In a research study involving a sample of 50 individuals, the heights (in inches)
were recorded and the following descriptive statistics were calculated:
Mean: 65.7 inches
Standard Deviation: 2.5 inches
Assuming the heights are normally distributed, calculate the z-score for a height
of 70 inches.
13

Solution
Step 1: Calculate the z-score using the formula: z=x−µ
σwhere xis the value,
µis the mean, and σis the standard deviation.
z=70 −65.7
2.5
z=4.3
2.5
z= 1.72
Therefore, the z-score for a height of 70 inches is 1.72.
Question 16
Question
The data below represents the number of hours spent studying per week by a
sample of 20 university students:
3,4,6,9,10,11,13,15,16,17,18,19,20,21,22,23,25,26,27,30
Calculate the mean, median, mode, range, variance, and standard deviation
for the given data.
Solution
Step 1: Calculate the mean. The mean is calculated by summing up all the
values and then dividing by the total number of values.
Mean = 3+4+6+9+10+11+13+15+16+17+18+19+20+21+22+23+25+26+27+30
20
Mean = 331
20 = 16.55
Step 2: Calculate the median. To find the median, we need to arrange the
data in ascending order and then find the middle value. Arranging the data:
3,4,6,9,10,11,13,15,16,17,18,19,20,21,22,23,25,26,27,30
Since there are 20 values, the median is the average of the 10th and 11th values.
Median = 16+17
2= 16.5
Step 3: Calculate the mode. The mode is the value(s) that occur most
frequently. In this dataset, there is no mode as all values appear only once.
Step 4: Calculate the range. The range is found by subtracting the minimum
value from the maximum value. Range = 30 - 3 = 27
14

Step 5: Calculate the variance. The variance is the average of the squared
differences between each value and the mean.
Variance = P(xi−Mean)2
n−1
Variance = (3 −16.55)2+ (4 −16.55)2+... + (30 −16.55)2
19
Calculating this gives the variance as 64.6474.
Step 6: Calculate the standard deviation. The standard deviation is the
square root of the variance.
Standard Deviation = √64.6474 ≈8.038
Question 17
Question
Let’s say we have a dataset with 50 observations. After calculating the mean,
median, range, and standard deviation, we noticed that the mean and median
are close but the range is very large, and the standard deviation is relatively
small. Discuss possible reasons for this discrepancy in descriptive statistics.
Solution
To understand the discrepancy in descriptive statistics, we need to consider the
characteristics of the dataset and how each measure is computed.
Step 1: Mean and Median - The mean is calculated as the sum of all
observations divided by the total number of observations. - The median is the
middle value in a dataset when the observations are ordered from smallest to
largest. - When the mean and median are close, it suggests that the dataset is
approximately symmetric.
Step 2: Range - The range is the difference between the maximum and
minimum values in the dataset. - A large range can occur when there are outliers
in the dataset, especially if these outliers are at the extremes.
Step 3: Standard Deviation - The standard deviation is a measure of
the dispersion of data points around the mean. - A relatively small standard
deviation suggests that the data points are clustered closely around the mean,
with little variability.
Step 4: Possible Reasons for Discrepancy - The dataset may have
outliers at the extremes, causing a large range but not affecting the mean sig-
nificantly due to the mean’s sensitivity to extreme values. - The dataset may
be approximately symmetric, explaining the closeness between the mean and
median. - The small standard deviation indicates low variability among the
data points, which is why the data points are clustered closely around the mean
despite the outliers.
15

In summary, the discrepancy in the descriptive statistics can be attributed
to outliers influencing the range but not affecting the mean significantly, the
dataset being approximately symmetric, and the low variability among data
points reflected in the small standard deviation.
Question 18
Question
Let Xbe a random variable with probability mass function given by:
P(X= 1) = 0.2, P (X= 2) = 0.3, P (X= 3) = 0.1, P (X= 4) = 0.4
Find the mean, variance, and standard deviation of the random variable X.
Solution
Step 1: Calculate the mean The mean of a discrete random variable is given
by:
µ=E[X] = X
x
x·P(X=x)
Substitute the given probabilities into the formula:
µ= 1 ·0.2+2·0.3+3·0.1+4·0.4
µ= 0.2+0.6+0.3+1.6=2.7
Therefore, the mean of the random variable Xis 2.7.
Step 2: Calculate the variance The variance of a discrete random variable
is given by:
σ2=E[(X−µ)2] = X
x
(x−µ)2·P(X=x)
Substitute the given probabilities and the calculated mean into the formula:
σ2= (1 −2.7)2·0.2 + (2 −2.7)2·0.3 + (3 −2.7)2·0.1 + (4 −2.7)2·0.4
σ2= 1.69 ·0.2+0.49 ·0.3+0.09 ·0.1+1.69 ·0.4
σ2= 0.338 + 0.147 + 0.009 + 0.676 = 1.17
Therefore, the variance of the random variable Xis 1.17.
16

Step 3: Calculate the standard deviation The standard deviation is the
square root of the variance:
σ=√σ2=√1.17 ≈1.08
Therefore, the standard deviation of the random variable Xis approximately
1.08.
Question 19
Question
Let’s say we have two datasets, dataset A and dataset B. Dataset A consists
of 20 data points with a mean of 45 and a standard deviation of 5. Dataset B
consists of 15 data points with a mean of 50 and a standard deviation of 8.
Given this information, can you determine which dataset has more variability
in the data? Justify your answer using the standard deviations of the datasets.
Solution
To determine which dataset has more variability in the data, we can compare
the standard deviations of the datasets. The standard deviation measures the
dispersion of data points in a dataset. A larger standard deviation indicates
more variability in the data.
Step 1: Calculate the Coefficients of Variation (CV) for each
dataset
The Coefficient of Variation (CV) is a relative measure of variability that
allows us to compare the standard deviations of datasets with different mean
values. It is calculated by dividing the standard deviation by the mean.
For Dataset A:
CVA=5
45 = 0.1111
For Dataset B:
CVB=8
50 = 0.16
Step 2: Compare the Coefficients of Variation
Since Dataset B has a larger coefficient of variation (0.16 ¿ 0.1111), this
indicates that Dataset B has more variability in the data compared to Dataset
A.
Therefore, Dataset B has more variability in the data than Dataset A based
on the standard deviations and coefficients of variation.
17

Question 20
Question
A researcher is conducting a study on the relationship between hours spent
studying per week and final exam scores for a group of university students.
After collecting the data, the descriptive statistics for hours studied per week
are as follows: mean = 15, median = 14, mode = 16, range = 10, and standard
deviation = 3.2. If a student studied 18 hours per week, how many standard
deviations is this value from the mean?
Solution
Step 1: Calculate the z-score using the formula:
z=x−¯x
s
Where: - x= 18 (hours studied per week by the student) - ¯x= 15 (mean
hours studied per week) - s= 3.2 (standard deviation)
Step 2: Substitute the values into the formula:
z=18 −15
3.2
Step 3: Calculate the z-score:
z=3
3.2= 0.9375
Step 4: Therefore, the student who studied 18 hours per week is 0.9375
standard deviations above the mean.
Question 21
Question
Let’s consider a dataset of 50 students’ scores on a midterm exam in a statistics
course. The data are as follows:
70,65,85,90,72,60,78,82,88,75,79,92,85,69,71,83,77,81,73,80,64,70,75,78,82,79,68,76,84,87,90,74,71,75,79,81,74,73,80,72,76,68,85,77,70,82,83,67,74
Calculate the following descriptive statistics for the dataset: 1. Mean 2.
Median 3. Variance 4. Standard deviation
18

Solution
1. Calculate the mean: Step 1: Add up all the values in the dataset.
70+65+85+90+72+60+78+82+88+75+79+92+85+69+71+83+77+81+73+80+64+70+75+78+82+79+68+76+84+87+90+74+71+75+79+81+74+73+80+72+76+68+85+77+70+82+83+67+74 = 3925
Step 2: Divide the sum by the total number of values in the dataset (50) to
find the mean.
Mean = 3925
50 = 78.5
2. Calculate the median: Step 1: Arrange the values in ascending order:
60,64,65,67,68,68,69,70,70,70,71,71,72,72,73,73,74,74,74,75,75,75,75,76,76,77,77,78,78,79,79,79,79,80,80,81,81,82,82,82,83,83,84,85,85,85,87,88,90,90,92
Step 2: Find the middle value. Since we have 50 values, the median will be
the average of the two middle values.
Median = 75 + 76
2= 75.5
3. Calculate the variance: Step 1: Find the squared difference between each
value and the mean, then sum these squared differences.
50
X
i=1
(xi−¯x)2
50
X
i=1
(xi−78.5)2= 1127.1
Step 2: Divide the sum by the total number of values in the dataset (50) to
find the variance.
Variance = 1127.1
50 = 22.542
4. Calculate the standard deviation:
Standard deviation = √22.542 ≈4.75
Question 22
Question
A researcher collected data on the heights (in inches) of 50 students in a uni-
versity. The sample mean height was found to be 65 inches with a standard
deviation of 3 inches. Furthermore, it was observed that the heights were nor-
mally distributed. Using this information, calculate the z-score for a student
who is 70 inches tall.
19

Solution
Step 1: Calculate the z-score using the formula for z-score:
z=x−¯x
σ
where: x= student’s height = 70 inches, ¯x= sample mean height = 65 inches,
σ= standard deviation = 3 inches.
Step 2: Substitute the values into the formula:
z=70 −65
3
z=5
3
z≈1.67
Step 3: Therefore, the z-score for a student who is 70 inches tall is approxi-
mately 1.67.
Question 23
Question
A researcher collected data on the starting salaries of 100 graduates from a
university. The mean starting salary was
$
50,000 with a standard deviation of
$
5,000. Assuming the data is normally distributed, calculate the z-score for a
starting salary of
$
45,000.
Solution
Let’s first recall the formula for calculating the z-score:
z=x−µ
σ
where: - xis the individual data point, - µis the mean of the data, - σis the
standard deviation of the data.
Step 1: Substitute the given values into the formula:
z=45000 −50000
5000
Step 2: Calculate the z-score:
z=−5000
5000
z=−1
Step 3: Answer: The z-score for a starting salary of
$
45,000 is -1.
20

Question 24
Question
Given the following dataset:
12,15,18,21,24,27,30,33,36,39
Calculate the mean, median, mode, variance, standard deviation, range, and
interquartile range.
Solution
Step 1: Calculate the mean:
Mean = 12 + 15 + 18 + 21 + 24 + 27 + 30 + 33 + 36 + 39
10 =255
10 = 25.5
Step 2: Calculate the median: Since we have an even number of data points,
the median is the average of the two middle values.
Median = 24 + 27
2=51
2= 25.5
Step 3: Calculate the mode: Since all values are unique, there is no mode.
Step 4: Calculate the variance:
Variance = P(Xi−¯
X)2
n=(12 −25.5)2+ (15 −25.5)2+. . . + (39 −25.5)2
10
Variance = 1582.5
10 = 158.25
Step 5: Calculate the standard deviation:
Standard deviation = √158.25 = 12.58
Step 6: Calculate the range:
Range = largest value −smallest value = 39 −12 = 27
Step 7: Calculate the interquartile range: First, find the first quartile (Q1)
and the third quartile (Q3). Since we have 10 data points, Q1 will be the average
of the 3rd and 4th values, and Q3 will be the average of the 8th and 9th values.
Q1 = 18 + 21
2= 19.5
Q3 = 33 + 36
2= 34.5
Then, calculate the interquartile range:
Interquartile range = Q3−Q1 = 34.5−19.5 = 15
Therefore, the mean is 25.5, median is 25.5, mode does not exist, variance
is 158.25, standard deviation is 12.58, range is 27, and the interquartile range
is 15.
21
Question 25
Question
A researcher conducted a study on the relationship between the number of hours
of study per week and final exam scores for a group of university students. The
data collected is as follows:
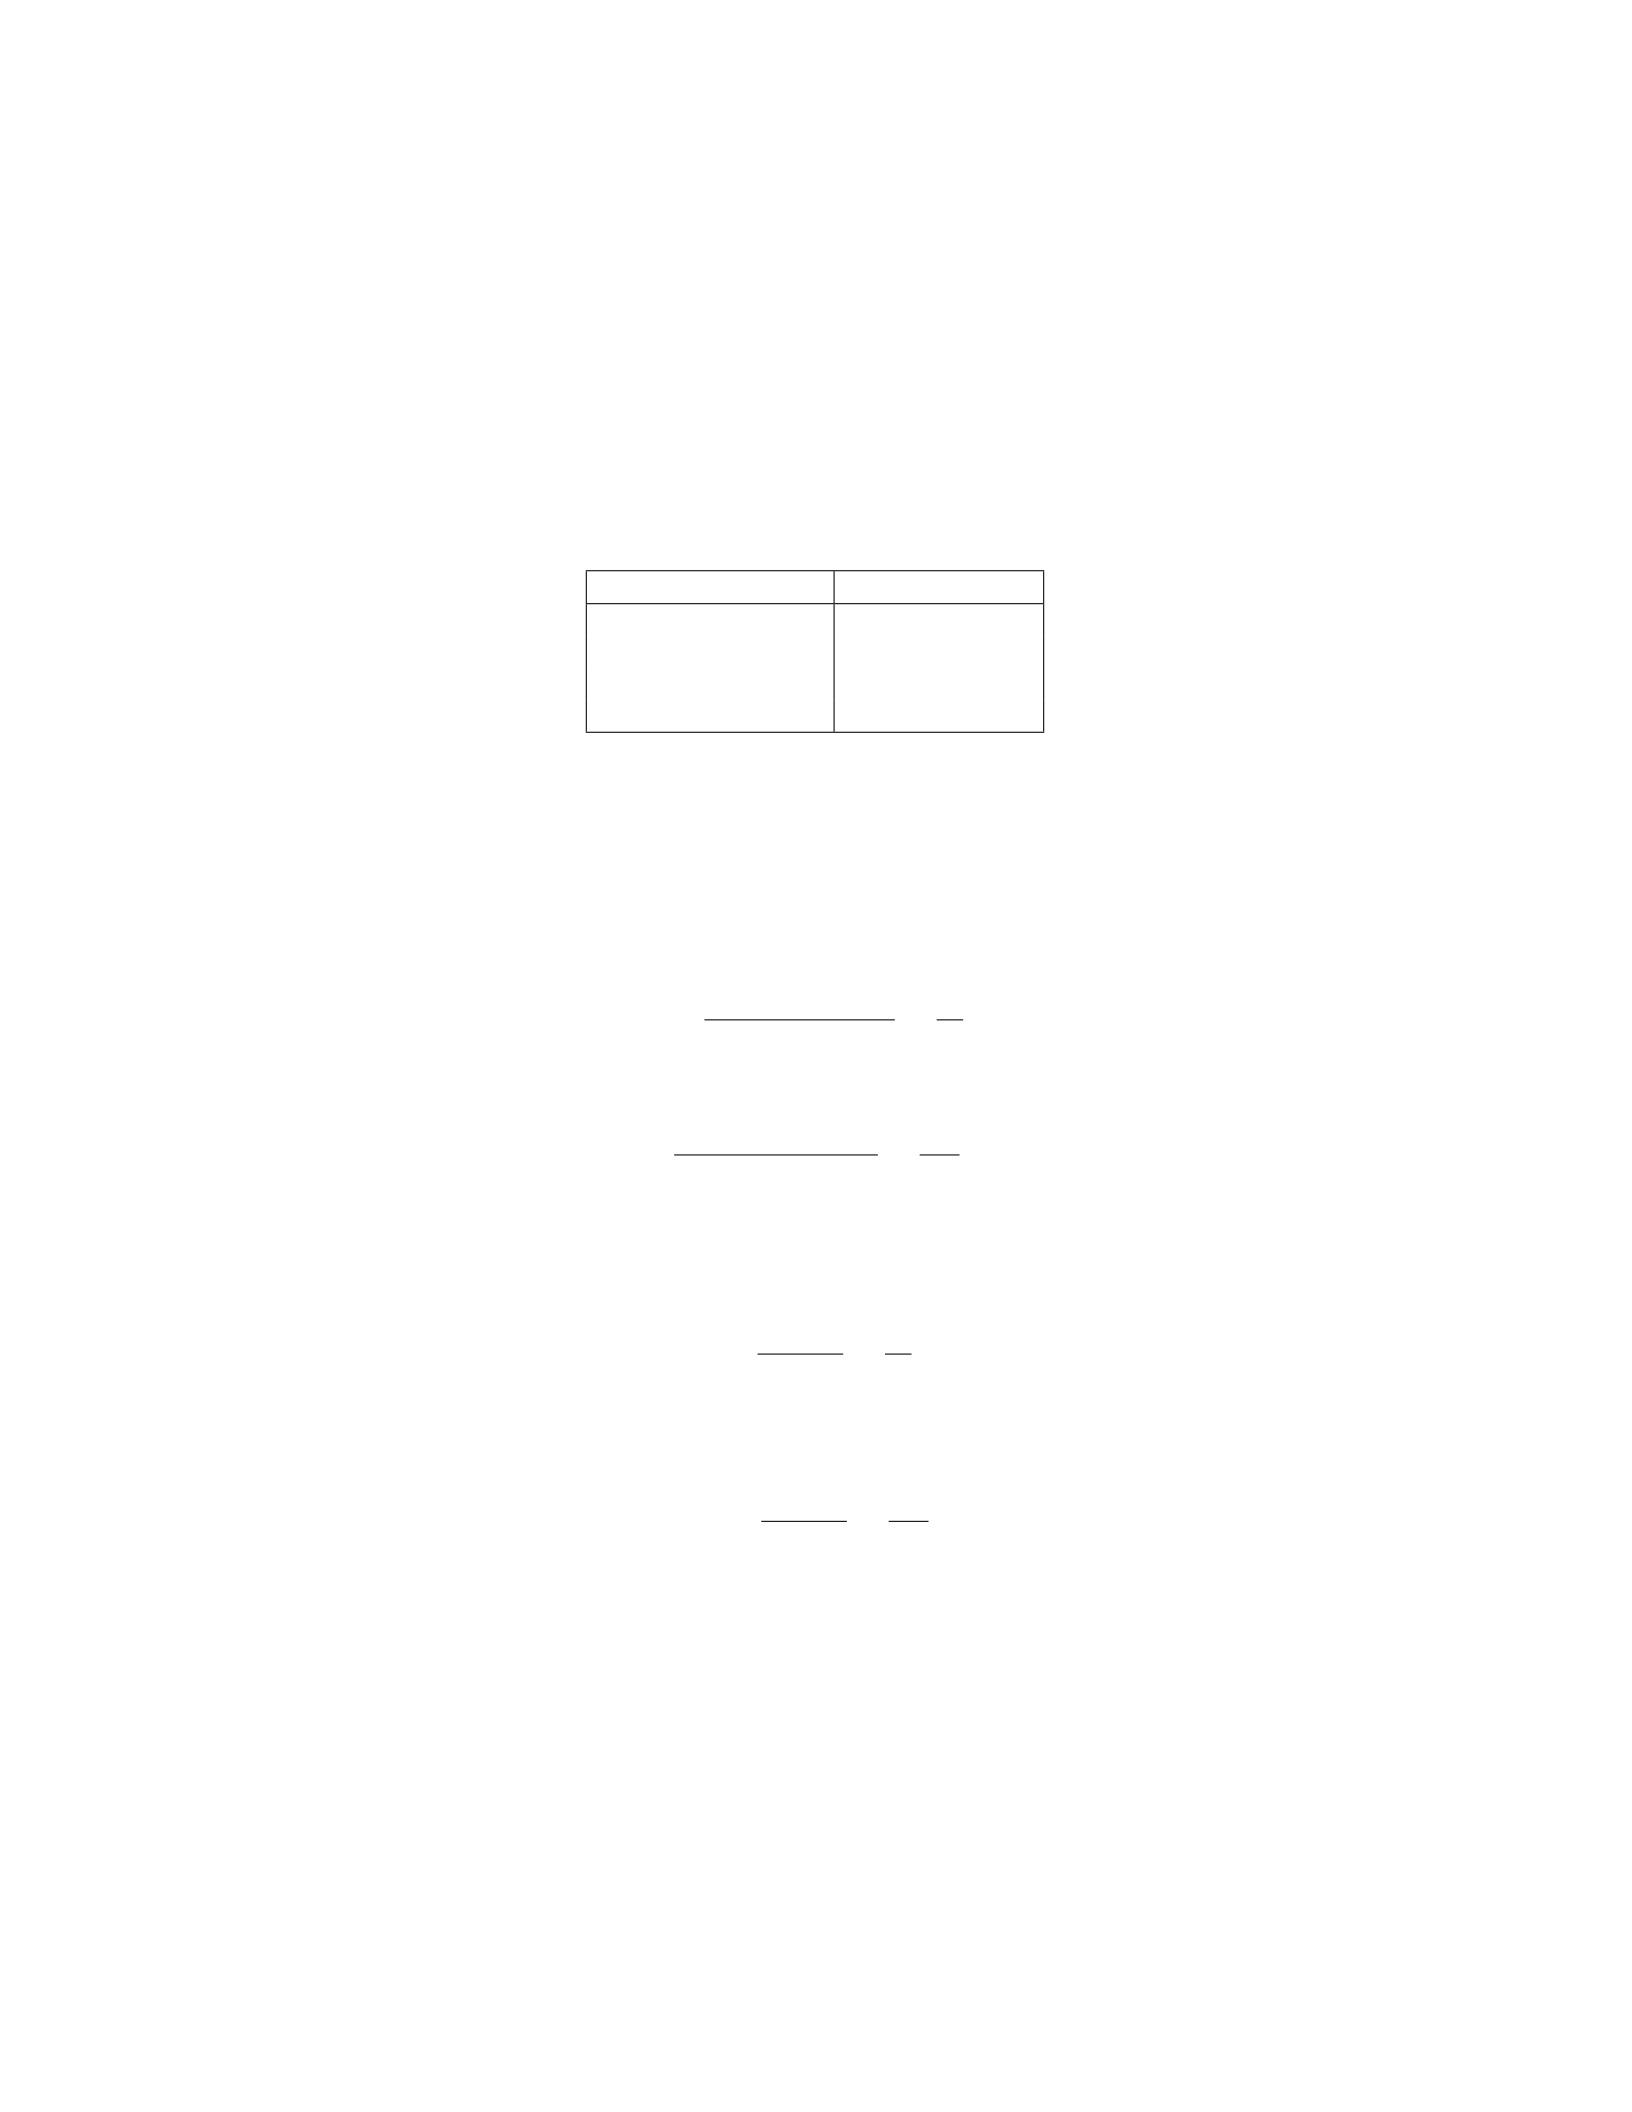
Hours of Study (x) Exam Score (y)
9 75
14 82
11 78
10 80
Calculate the mean, median, range, variance, and standard deviation for
both hours of study and exam scores.
Solution
Step 1: Calculate the mean for both hours of study and exam scores.
For hours of study,
Mean = 9 + 14 + 11 + 10
4=44
4= 11
For exam scores,
Mean = 75 + 82 + 78 + 80
4=315
4= 78.75
Step 2: Calculate the median for both hours of study and exam scores.
For hours of study, since the data is already arranged from smallest to largest,
the median is the average of the two middle values:
Median = 10 + 11
2=21
2= 10.5
For exam scores, since the data is already arranged from smallest to largest,
the median is the average of the two middle values:
Median = 78 + 80
2=158
2= 79
Step 3: Calculate the range for both hours of study and exam scores.
For hours of study,
Range = 14 −9 = 5
For exam scores,
Range = 82 −75 = 7
Step 4: Calculate the variance for both hours of study and exam scores.
22

For hours of study,
Variance = (9 −11)2+ (14 −11)2+ (11 −11)2+ (10 −11)2
4−1=4+9+0+1
3=14
3≈4.67
For exam scores,
Variance = (75 −78.75)2+ (82 −78.75)2+ (78 −78.75)2+ (80 −78.75)2
4−1=16.5625 + 6.0625 + 0.5625 + 1.5625
3=24.75
3≈8.25
Step 5: Calculate the standard deviation for both hours of study and exam
scores.
For hours of study,
Standard deviation = √4.67 ≈2.16
For exam scores,
Standard deviation = √8.25 ≈2.87
Question 26
Question
Suppose we have the following dataset representing the scores of 20 students in
a statistics exam:
60,75,82,67,89,93,78,71,76,85,69,73,79,81,88,70,64,77,84,72
Determine the mean, median, mode, range, variance, and standard deviation
of the dataset.
Solution
Step 1: Calculate the mean
Mean = 1
n
n
X
i=1
xi
Mean = 1
20×(60+75+82+67+89+93+78+71+76+85+69+73+79+81+88+70+64+77+84+72)
Mean = 1460
20
Mean = 73
Step 2: Calculate the median Since the dataset is already sorted from
least to greatest, the median will be the average of the 10th and 11th values.
Median = (73 + 76)
2
23

Median = 74.5
Step 3: Calculate the mode The mode is the score that appears most
frequently in the dataset. In this case, there is no score that appears more than
once, so there is no mode.
Step 4: Calculate the range
Range = Maximum value −Minimum value
Range = 93 −60
Range = 33
Step 5: Calculate the variance
Variance = Pn
i=1(xi−Mean)2
n
Variance = (60 −73)2+ (75 −73)2+. . . + (72 −73)2
20
Variance = 340.6
20
Variance = 17.03
Step 6: Calculate the standard deviation
Standard Deviation = √Variance
Standard Deviation = √17.03
Standard Deviation ≈4.13
Therefore, the mean is 73, the median is 74.5, the mode does not exist, the
range is 33, the variance is 17.03, and the standard deviation is approximately
4.13.
Question 27
Question
Consider the following dataset representing the scores of 20 students on a physics
exam:
73,78,82,65,88,91,72,95,79,84,77,73,86,90,68,81,76,89,74,80
Calculate the mean, median, mode, variance, standard deviation, and range
of the scores.
24

Solution
Step 1: Calculate the mean:
Mean = 1
n
n
X
i=1
xi
Mean = 1
20(73+78+82+65+88+91+72+95+79+84+77+73+86+90+68+81+76+89+74+80)
Mean = 1569
20 = 78.45
Step 2: Calculate the median: To find the median, we first need to arrange
the data in ascending order:
65,68,72,73,73,74,76,77,78,79,80,81,82,84,86,88,89,90,91,95
Since there are 20 values, the median is the average of the 10th and 11th values:
Median = 80 + 81
2= 80.5
Step 3: Calculate the mode: From the dataset, we can see that the mode is
73 since it occurs twice, which is more frequent than any other value.
Step 4: Calculate the variance:
Variance = 1
n
n
X
i=1
(xi−Mean)2
Variance = 1
20[(73 −78.45)2+ (78 −78.45)2+... + (80 −78.45)2]
Variance ≈36.9475
Step 5: Calculate the standard deviation:
Standard deviation = √Variance ≈√36.9475 ≈6.08
Step 6: Calculate the range:
Range = Max −Min = 95 −65 = 30
Therefore, the mean is 78.45, median is 80.5, mode is 73, variance is ap-
proximately 36.9475, standard deviation is approximately 6.08, and the range
is 30.
25

Question 28
Question
Let’s consider a dataset that represents the heights (in inches) of 50 university
students. The following descriptive statistics were calculated for this dataset:
Mean height: 65 inches
Standard deviation: 3.5 inches
Given this information, what can you conclude about the distribution of heights
among the university students?
Solution
To draw conclusions about the distribution of heights among the university
students based on the provided descriptive statistics, we need to consider the
properties of the mean and standard deviation.
Step 1: Mean The mean height of 65 inches indicates that, on average, the
university students are 65 inches tall.
Step 2: Standard Deviation The standard deviation of 3.5 inches measures
the variability or spread of heights around the mean. A smaller standard devia-
tion implies that the data points are closer to the mean, while a larger standard
deviation indicates that the data points are more spread out.
Step 3: Conclusion Since the standard deviation is relatively small at 3.5
inches, we can conclude that the heights of the university students are clustered
around the mean height of 65 inches. This suggests that the distribution of
heights is relatively narrow and the majority of students have heights close to
the mean height.
Question 29
Question
Consider the following data set:
12,15,18,22,25,29,33,35,40,42,45
Find the mean, median, mode, variance, and standard deviation of the data
set.
Solution
Step 1: Find the Mean Calculate the mean by summing up all the values and
then dividing by the total number of values.
Mean = 12 + 15 + 18 + 22 + 25 + 29 + 33 + 35 + 40 + 42 + 45
11
26

Mean = 316
11 = 28.73
Step 2: Find the Median To find the median, first arrange the data in
ascending order:
12,15,18,22,25,29,33,35,40,42,45
Since there are 11 values, the median is the middle value, which in this case is
the 6th value:
Median = 29
Step 3: Find the Mode The mode is the value that appears most frequently
in the data set. In this case, each value appears only once, so the data set has
no mode.
Step 4: Find the Variance Calculate the variance by finding the average of
the squared differences between each value and the mean.
Variance = (12 −28.73)2+ (15 −28.73)2+. . . + (45 −28.73)2
11
Variance ≈195.21
Step 5: Find the Standard Deviation The standard deviation is the square
root of the variance.
Standard Deviation = √Variance ≈√195.21 ≈13.97
Question 30
Question
Suppose we have a dataset with the following values:
12,15,18,20,22,24,25,27,29,30
Calculate the following descriptive statistics for this dataset:
Mean
Median
Variance
Standard Deviation
27

Solution
Let’s start by arranging the dataset in ascending order:
12,15,18,20,22,24,25,27,29,30
Step 1: Calculate the Mean The mean is calculated by summing all
values and dividing by the total number of values:
Mean = 12 + 15 + 18 + 20 + 22 + 24 + 25 + 27 + 29 + 30
10 = 22.2
Step 2: Calculate the Median Since we have an even number of values,
the median is the average of the two middle values:
Median = 22 + 24
2= 23
Step 3: Calculate the Variance The variance is calculated by finding the
average of the squared differences between each value and the mean:
Variance = (12 −22.2)2+ (15 −22.2)2+. . . + (30 −22.2)2
10
Variance ≈37.56
Step 4: Calculate the Standard Deviation The standard deviation is
the square root of the variance:
Standard Deviation = √37.56 ≈6.13
Therefore, for the given dataset, the mean is 22.2, median is 23, variance is
37.56, and standard deviation is approximately 6.13.
28

Question 6
Question
Let’s say you have a dataset with the following values: 6, 8, 10, 6, 12, 6, 14, 8.
Calculate the mean, median, mode, variance, standard deviation, and range of
the dataset.
Solution
To find the descriptive statistics of the dataset, we will calculate the mean,
median, mode, variance, standard deviation, and range step by step.
Step 1: Calculate the mean The mean is calculated by summing up all
the values in the dataset and then dividing by the total number of values.
Mean = 6+8+10+6+12+6+14+8
8
Mean = 70
8= 8.75
Step 2: Calculate the median To find the median, we first need to
arrange the values in ascending order: 6, 6, 6, 8, 8, 10, 12, 14. Since there are
an even number of values, the median is the average of the two middle values.
Median = 8+8
2= 8
Step 3: Calculate the mode The mode is the value that appears most
frequently in the dataset. In this case, the mode is 6, as it appears three times.
Step 4: Calculate the variance The variance measures how spread out
the values in the dataset are. To calculate the variance, we first need to find the
squared differences between each value and the mean, then sum them up and
divide by the total number of values.
Variance = (6 −8.75)2+ (8 −8.75)2+ (10 −8.75)2+ (6 −8.75)2+ (12 −8.75)2+ (6 −8.75)2+ (14 −8.75)2+ (8 −8.75)2
8
Variance = 57.5
8= 7.1875
Step 5: Calculate the standard deviation The standard deviation is
the square root of the variance.
Standard deviation = √7.1875 ≈2.68
Step 6: Calculate the range The range is the difference between the
maximum and minimum values in the dataset. Range = 14 −6 = 8
Therefore, the mean is 8.75, the median is 8, the mode is 6, the variance is
7.1875, the standard deviation is approximately 2.68, and the range is 8.
6

Question 7
Question
Suppose a researcher collected the following data on the heights (in centimeters)
of 10 adult males:
175,180,165,190,185,170,175,160,200,195
Calculate the mean, median, mode, range, variance, and standard deviation
of the data set.
Solution
Let’s calculate the mean, median, mode, range, variance, and standard deviation
step-by-step.
Step 1: Calculate the Mean The mean (¯x) is calculated by adding up
all the values and dividing by the total number of values (10 in this case).
Mean = 175 + 180 + 165 + 190 + 185 + 170 + 175 + 160 + 200 + 195
10
Mean = 1775
10 = 177.5
Therefore, the mean height is 177.5 cm.
Step 2: Calculate the Median To find the median, we first need to
arrange the data in ascending order.
160,165,170,175,175,180,185,190,195,200
Since there are 10 values, the median is the average of the 5th and 6th values.
Median = 175 + 180
2= 177.5
Therefore, the median height is 177.5 cm.
Step 3: Calculate the Mode The mode is the value that appears most
frequently in the data set. In this case, there is no unique mode as each value
appears only once. So, the data set has no mode.
Step 4: Calculate the Range The range is the difference between the
largest and smallest values in the data set.
Range = 200 −160 = 40
Therefore, the range of heights is 40 cm.
Step 5: Calculate the Variance The variance is a measure of how spread
out the values in a data set are. It is calculated using the formula:
Variance = P(xi−¯x)2
n
7

where xiare the individual values, ¯xis the mean, and nis the total number of
values (10 in this case).
Variance = (175 −177.5)2+ (180 −177.5)2+. . . + (195 −177.5)2
10
Calculating this value gives us a variance of 140.25.
Step 6: Calculate the Standard Deviation The standard deviation is
the square root of the variance.
Standard Deviation = √140.25 = 11.84
Therefore, the standard deviation of the heights is 11.84 cm.
Question 8
Question
Let’s consider a dataset representing the heights (in inches) of 30 college stu-
dents. The descriptive statistics for this dataset are as follows: mean height =
65.7 inches, standard deviation = 3.5 inches. Assuming the heights are normally
distributed, calculate the z-score for a student who is 70 inches tall.
Solution
Step 1: Recall that the z-score formula is given by z=x−µ
σ, where xis the
value we are interested in, µis the mean, and σis the standard deviation.
Step 2: Substituting the given values into the formula, we have:
z=70 −65.7
3.5
Step 3: Calculate the z-score:
z=4.3
3.5= 1.2286
Step 4: Therefore, the z-score for a student who is 70 inches tall is ap-
proximately 1.2286. This means that the student’s height is 1.2286 standard
deviations above the mean height of the dataset.
Question 9
Question
Let X={8,12,15,21,24}and Y={10,13,17,22,28}be two data sets. Calcu-
late the median, mode, and range for each data set.
8

Solution
Step 1: To find the median of a data set, we first need to arrange the data set
in ascending order. For set X, the data set is {8,12,15,21,24}. When arranged
in ascending order, we get {8,12,15,21,24}. The median is the middle value,
which is 15.
For set Y, the data set is {10,13,17,22,28}. When arranged in ascending
order, we get {10,13,17,22,28}. The median is the middle value, which is 17.
Step 2: To find the mode of a data set, we need to identify the value that
appears most frequently. If there are multiple modes, the data set is considered
multimodal. For set X, all values appear only once, so there is no mode.
For set Y, all values appear only once, so there is no mode.
Step 3: To find the range of a data set, we need to find the difference between
the maximum and minimum values. For set X, the minimum value is 8 and the
maximum value is 24. Therefore, the range is 24 −8 = 16.
For set Y, the minimum value is 10 and the maximum value is 28. Therefore,
the range is 28 −10 = 18.
In conclusion, - The median of set Xis 15 and the mode is undefined. - The
median of set Yis 17 and the mode is undefined. - The range of set Xis 16
and the range of set Yis 18.
Question 10
Question
In a study of the heights of students in a university, the following data was
collected: 160 cm, 165 cm, 170 cm, 172 cm, 175 cm, 180 cm, 185 cm, 190 cm,
195 cm. Calculate the mean, median, mode, range, variance, and standard
deviation of the heights.
Solution
Step 1: Calculate the mean. The mean is calculated using the formula:
Mean = Pn
i=1 xi
n
where xiare the individual heights and nis the number of observations.
Calculating the mean:
Mean = 160 + 165 + 170 + 172 + 175 + 180 + 185 + 190 + 195
9=1592
9= 176.9 cm
Step 2: Calculate the median. To find the median, first arrange the data in
ascending order: 160, 165, 170, 172, 175, 180, 185, 190, 195.
Since there are 9 observations, the median is the middle value, which is the
fifth value: Median = 175 cm.
9

Step 3: Calculate the mode. The mode is the value that appears most
frequently in the data set. In this case, all values appear only once, so there is
no mode.
Step 4: Calculate the range. The range is the difference between the highest
and lowest values in the data set. Range = 195 cm - 160 cm = 35 cm.
Step 5: Calculate the variance. The variance is calculated using the formula:
Variance = Pn
i=1(xi−Mean)2
n
Calculating the variance:
Variance = (160 −176.9)2+ (165 −176.9)2+. . . + (195 −176.9)2
9=829.6
9≈92.178 cm2
Step 6: Calculate the standard deviation. The standard deviation is the
square root of the variance:
Standard Deviation = √Variance = √92.178 ≈9.6 cm
Therefore, the mean height is 176.9 cm, the median height is 175 cm, there
is no mode, the range is 35 cm, the variance is approximately 92.178 cm2, and
the standard deviation is approximately 9.6 cm.
Question 11
Question
Suppose a researcher collected data on the test scores of students in two different
classes. The mean test score for Class A was 85 with a standard deviation of 10,
while the mean test score for Class B was 78 with a standard deviation of 8. If
the two classes had the same number of students, calculate the pooled standard
deviation for the combined data.
Solution
Step 1: Calculate the pooled standard deviation using the formula:
Pooled standard deviation = s(n1−1)s2
1+ (n2−1)s2
2
n1+n2−2
where n1and n2are the number of observations in Class A and Class B re-
spectively, and s1and s2are the standard deviations for Class A and Class
B.
Given: n1=n2,s1= 10, s2= 8
Substitute the values into the formula:
Pooled standard deviation = s(n1−1)(10)2+ (n1−1)(8)2
2n1−2
10
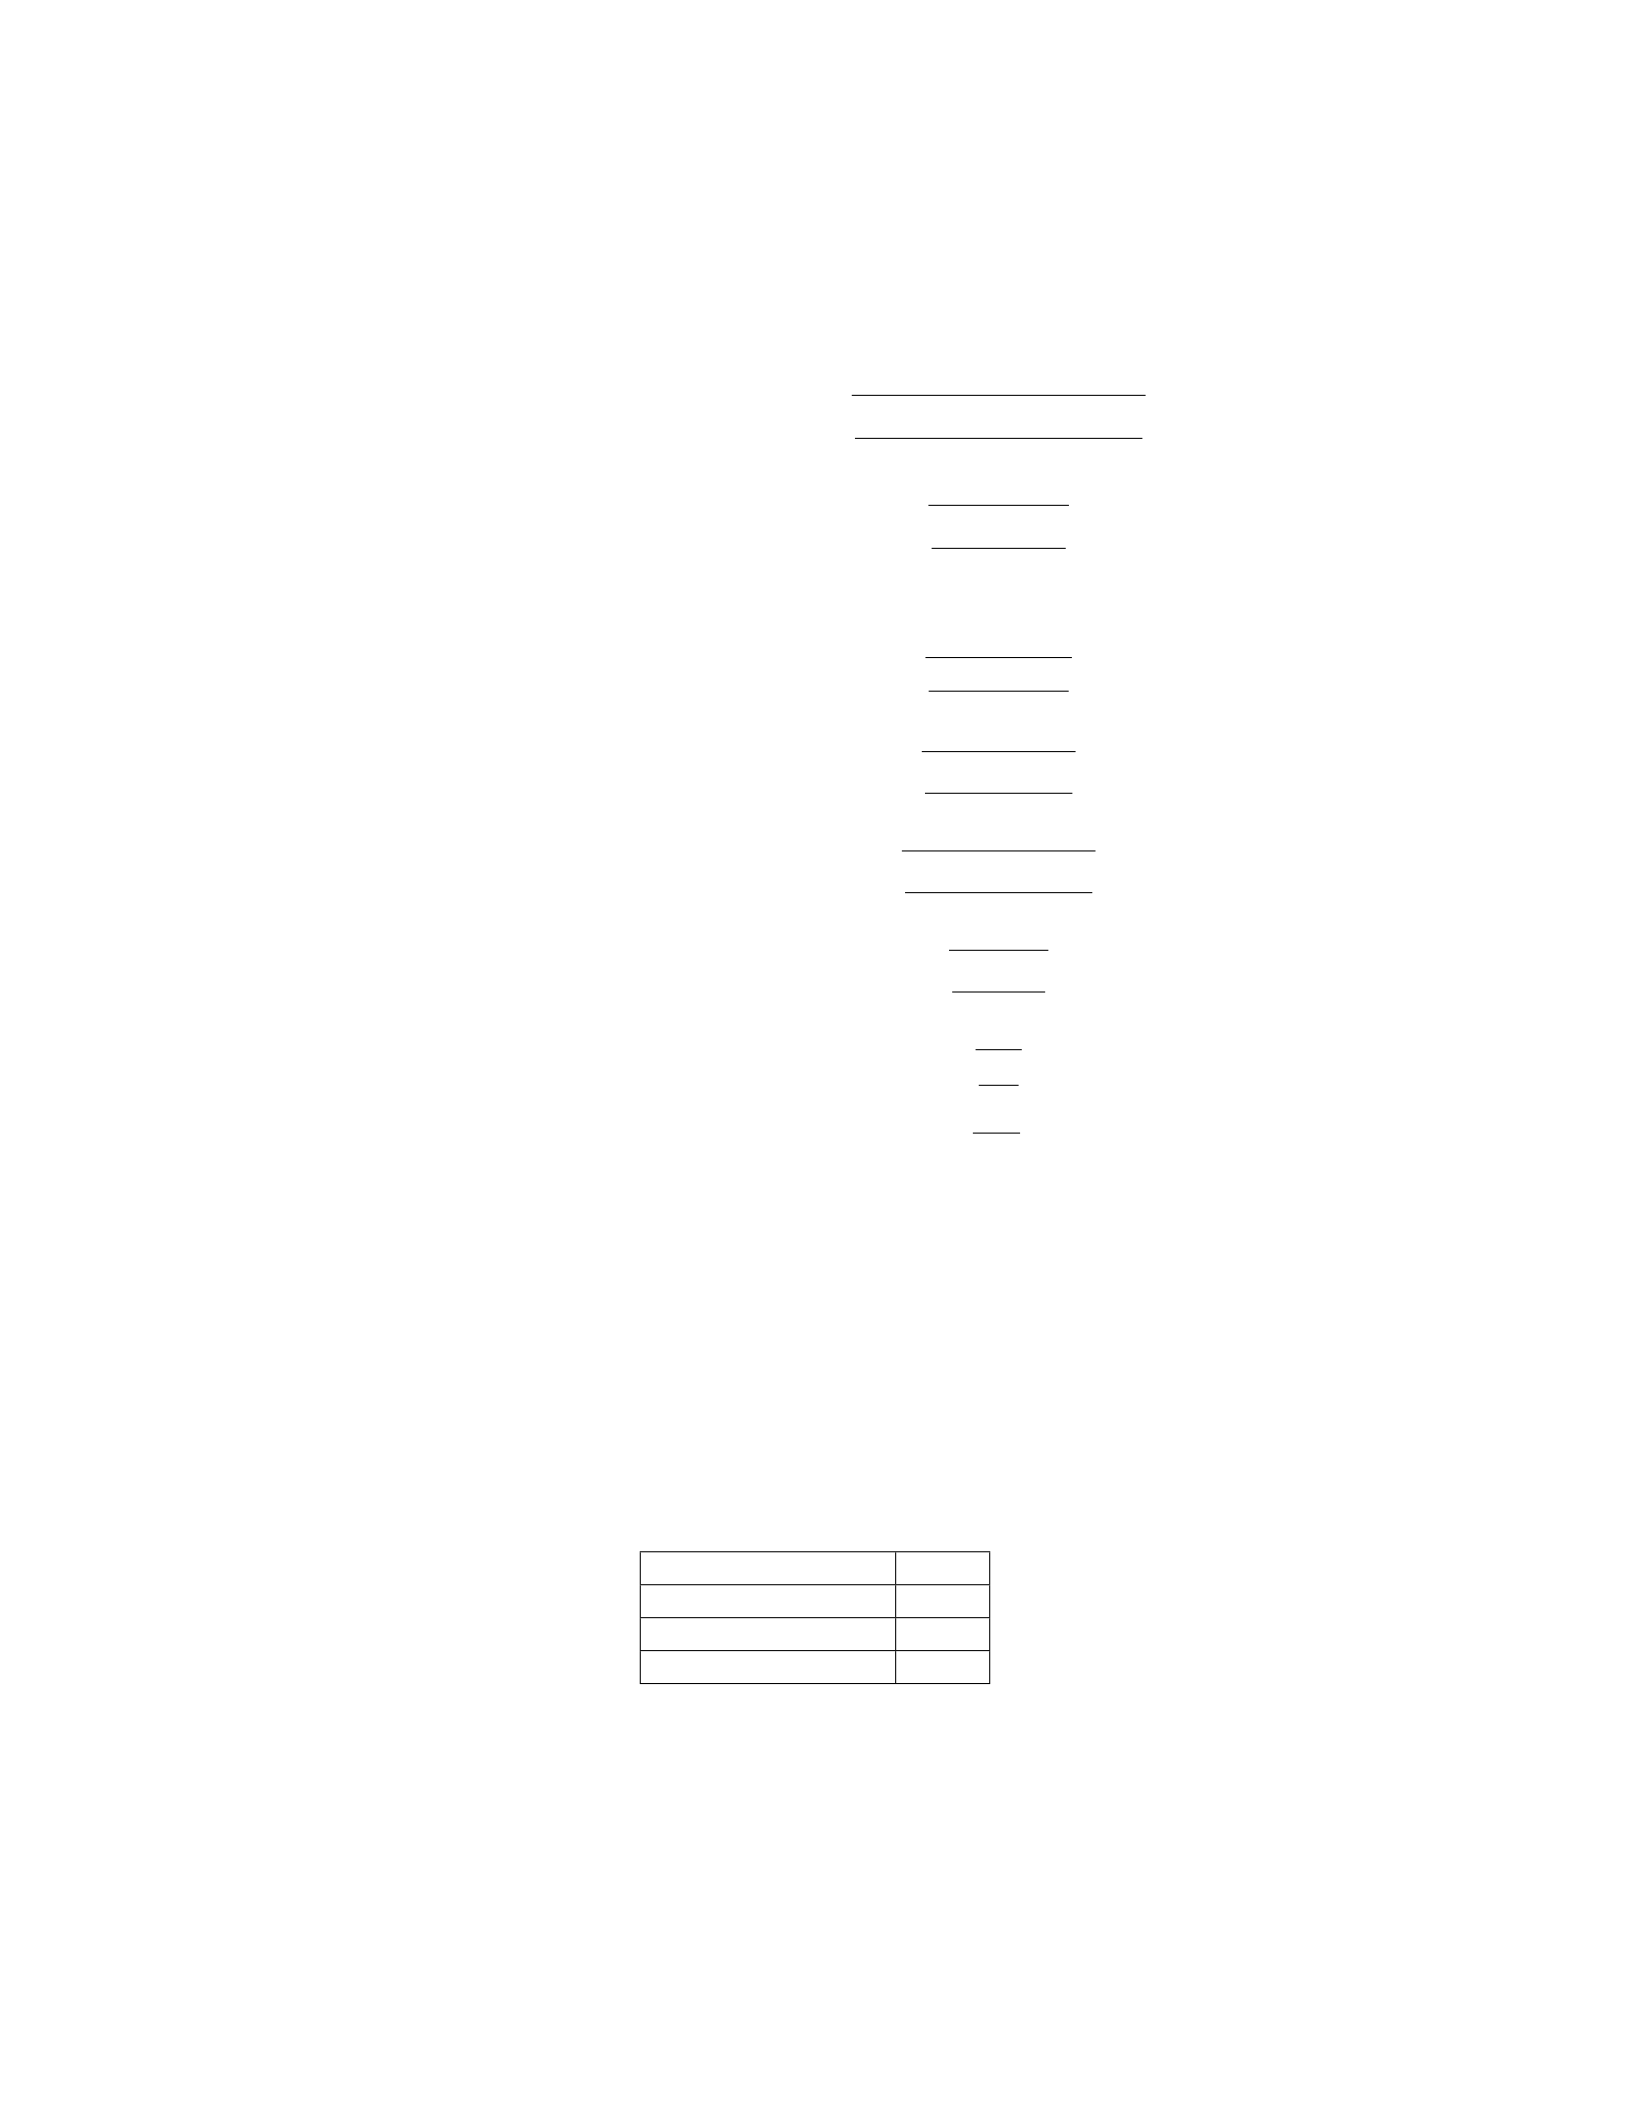
Step 2: Simplify the equation further:
Pooled standard deviation = s100(n1−1) + 64(n1−1)
2n1−2
Pooled standard deviation = s164(n1−1)
2n1−2
Step 3: Expand and simplify:
Pooled standard deviation = r164n1−164
2n1−2
Pooled standard deviation = s4(41n1−41)
2(2n1−1)
Pooled standard deviation = s4(41(n1−1)
2(2(n1−1) + 1)
Pooled standard deviation = s4(41)
2(2) + 1
Pooled standard deviation = r164
5
Pooled standard deviation = √32.8
Pooled standard deviation ≈5.72
Therefore, the pooled standard deviation for the combined data is approxi-
mately 5.72.
Question 12
Question
A researcher collected data on the monthly salaries of employees at a large
company. The data is summarized in the following table:
Mean $5000
Median $4800
Mode $4500
Standard Deviation $600
Based on the given information, is the distribution of monthly salaries skewed
to the left, skewed to the right, or approximately symmetric?
11

Solution
Step 1: Since the mean, median, and mode are all different, this indicates that
the distribution of monthly salaries is not symmetric.
Step 2: To determine whether the distribution is skewed to the left, skewed to
the right, or approximately symmetric, we can compare the mean and median.
Step 3: If the mean is less than the median, the distribution is skewed to
the left. If the mean is greater than the median, the distribution is skewed to
the right. If the mean is approximately equal to the median, the distribution is
approximately symmetric.
Step 4: In this case, the mean is $5000 and the median is $4800. Since the
mean is greater than the median, the distribution of monthly salaries is skewed
to the right.
Question 13
Question
Let X={3,5,7,8,11,15}and Y={2,4,6,9,12,14}. Compute the sample
mean, sample variance, and sample standard deviation for each set.
Solution
Step 1: Calculate the mean. The sample mean ¯
Xfor set Xis given by
¯
X=1
n
n
X
i=1
xi.
Similarly, the sample mean ¯
Yfor set Yis given by
¯
Y=1
m
m
X
j=1
yj.
Step 2: Calculate the variance. The sample variance s2
Xfor set Xis given
by
s2
X=1
n−1
n
X
i=1
(xi−¯
X)2.
Similarly, the sample variance s2
Yfor set Yis given by
s2
Y=1
m−1
m
X
j=1
(yj−¯
Y)2.
Step 3: Calculate the standard deviation. The sample standard deviation
sXfor set Xis simply the square root of the variance: sX=ps2
X. Similarly,
the sample standard deviation sYfor set Yis sY=ps2
Y.
12

Question 14
Question
A researcher collected the following data on the number of hours spent studying
for an exam by a group of students: 2, 3, 4, 5, 6, 7, 8, 9, 10. Calculate the mean,
median, variance, and standard deviation of the data set.
Solution
Step 1: Calculate the mean. The mean is calculated by summing all the data
points and dividing by the total number of data points.
Mean = 2+3+4+5+6+7+8+9+10
9=54
9= 6
Step 2: Calculate the median. To find the median, first arrange the data
in ascending order: 2, 3, 4, 5, 6, 7, 8, 9, 10. Since there are 9 data points, the
median is the middle value, which is the 5th value.
Median = 6
Step 3: Calculate the variance. The variance is the average of the squared
differences between each data point and the mean.
Variance = (2 −6)2+ (3 −6)2+ (4 −6)2+ (5 −6)2+ (6 −6)2+ (7 −6)2+ (8 −6)2+ (9 −6)2+ (10 −6)2
9
=16+9+4+1+0+1+4+9+16
9=60
9≈6.67
Step 4: Calculate the standard deviation. The standard deviation is the
square root of the variance.
Standard deviation = √6.67 ≈2.58
Therefore, the mean is 6, the median is 6, the variance is 6.67, and the
standard deviation is approximately 2.58.
Question 15
Question
In a research study involving a sample of 50 individuals, the heights (in inches)
were recorded and the following descriptive statistics were calculated:
Mean: 65.7 inches
Standard Deviation: 2.5 inches
Assuming the heights are normally distributed, calculate the z-score for a height
of 70 inches.
13

Solution
Step 1: Calculate the z-score using the formula: z=x−µ
σwhere xis the value,
µis the mean, and σis the standard deviation.
z=70 −65.7
2.5
z=4.3
2.5
z= 1.72
Therefore, the z-score for a height of 70 inches is 1.72.
Question 16
Question
The data below represents the number of hours spent studying per week by a
sample of 20 university students:
3,4,6,9,10,11,13,15,16,17,18,19,20,21,22,23,25,26,27,30
Calculate the mean, median, mode, range, variance, and standard deviation
for the given data.
Solution
Step 1: Calculate the mean. The mean is calculated by summing up all the
values and then dividing by the total number of values.
Mean = 3+4+6+9+10+11+13+15+16+17+18+19+20+21+22+23+25+26+27+30
20
Mean = 331
20 = 16.55
Step 2: Calculate the median. To find the median, we need to arrange the
data in ascending order and then find the middle value. Arranging the data:
3,4,6,9,10,11,13,15,16,17,18,19,20,21,22,23,25,26,27,30
Since there are 20 values, the median is the average of the 10th and 11th values.
Median = 16+17
2= 16.5
Step 3: Calculate the mode. The mode is the value(s) that occur most
frequently. In this dataset, there is no mode as all values appear only once.
Step 4: Calculate the range. The range is found by subtracting the minimum
value from the maximum value. Range = 30 - 3 = 27
14

Step 5: Calculate the variance. The variance is the average of the squared
differences between each value and the mean.
Variance = P(xi−Mean)2
n−1
Variance = (3 −16.55)2+ (4 −16.55)2+... + (30 −16.55)2
19
Calculating this gives the variance as 64.6474.
Step 6: Calculate the standard deviation. The standard deviation is the
square root of the variance.
Standard Deviation = √64.6474 ≈8.038
Question 17
Question
Let’s say we have a dataset with 50 observations. After calculating the mean,
median, range, and standard deviation, we noticed that the mean and median
are close but the range is very large, and the standard deviation is relatively
small. Discuss possible reasons for this discrepancy in descriptive statistics.
Solution
To understand the discrepancy in descriptive statistics, we need to consider the
characteristics of the dataset and how each measure is computed.
Step 1: Mean and Median - The mean is calculated as the sum of all
observations divided by the total number of observations. - The median is the
middle value in a dataset when the observations are ordered from smallest to
largest. - When the mean and median are close, it suggests that the dataset is
approximately symmetric.
Step 2: Range - The range is the difference between the maximum and
minimum values in the dataset. - A large range can occur when there are outliers
in the dataset, especially if these outliers are at the extremes.
Step 3: Standard Deviation - The standard deviation is a measure of
the dispersion of data points around the mean. - A relatively small standard
deviation suggests that the data points are clustered closely around the mean,
with little variability.
Step 4: Possible Reasons for Discrepancy - The dataset may have
outliers at the extremes, causing a large range but not affecting the mean sig-
nificantly due to the mean’s sensitivity to extreme values. - The dataset may
be approximately symmetric, explaining the closeness between the mean and
median. - The small standard deviation indicates low variability among the
data points, which is why the data points are clustered closely around the mean
despite the outliers.
15

In summary, the discrepancy in the descriptive statistics can be attributed
to outliers influencing the range but not affecting the mean significantly, the
dataset being approximately symmetric, and the low variability among data
points reflected in the small standard deviation.
Question 18
Question
Let Xbe a random variable with probability mass function given by:
P(X= 1) = 0.2, P (X= 2) = 0.3, P (X= 3) = 0.1, P (X= 4) = 0.4
Find the mean, variance, and standard deviation of the random variable X.
Solution
Step 1: Calculate the mean The mean of a discrete random variable is given
by:
µ=E[X] = X
x
x·P(X=x)
Substitute the given probabilities into the formula:
µ= 1 ·0.2+2·0.3+3·0.1+4·0.4
µ= 0.2+0.6+0.3+1.6=2.7
Therefore, the mean of the random variable Xis 2.7.
Step 2: Calculate the variance The variance of a discrete random variable
is given by:
σ2=E[(X−µ)2] = X
x
(x−µ)2·P(X=x)
Substitute the given probabilities and the calculated mean into the formula:
σ2= (1 −2.7)2·0.2 + (2 −2.7)2·0.3 + (3 −2.7)2·0.1 + (4 −2.7)2·0.4
σ2= 1.69 ·0.2+0.49 ·0.3+0.09 ·0.1+1.69 ·0.4
σ2= 0.338 + 0.147 + 0.009 + 0.676 = 1.17
Therefore, the variance of the random variable Xis 1.17.
16

Step 3: Calculate the standard deviation The standard deviation is the
square root of the variance:
σ=√σ2=√1.17 ≈1.08
Therefore, the standard deviation of the random variable Xis approximately
1.08.
Question 19
Question
Let’s say we have two datasets, dataset A and dataset B. Dataset A consists
of 20 data points with a mean of 45 and a standard deviation of 5. Dataset B
consists of 15 data points with a mean of 50 and a standard deviation of 8.
Given this information, can you determine which dataset has more variability
in the data? Justify your answer using the standard deviations of the datasets.
Solution
To determine which dataset has more variability in the data, we can compare
the standard deviations of the datasets. The standard deviation measures the
dispersion of data points in a dataset. A larger standard deviation indicates
more variability in the data.
Step 1: Calculate the Coefficients of Variation (CV) for each
dataset
The Coefficient of Variation (CV) is a relative measure of variability that
allows us to compare the standard deviations of datasets with different mean
values. It is calculated by dividing the standard deviation by the mean.
For Dataset A:
CVA=5
45 = 0.1111
For Dataset B:
CVB=8
50 = 0.16
Step 2: Compare the Coefficients of Variation
Since Dataset B has a larger coefficient of variation (0.16 ¿ 0.1111), this
indicates that Dataset B has more variability in the data compared to Dataset
A.
Therefore, Dataset B has more variability in the data than Dataset A based
on the standard deviations and coefficients of variation.
17

Question 20
Question
A researcher is conducting a study on the relationship between hours spent
studying per week and final exam scores for a group of university students.
After collecting the data, the descriptive statistics for hours studied per week
are as follows: mean = 15, median = 14, mode = 16, range = 10, and standard
deviation = 3.2. If a student studied 18 hours per week, how many standard
deviations is this value from the mean?
Solution
Step 1: Calculate the z-score using the formula:
z=x−¯x
s
Where: - x= 18 (hours studied per week by the student) - ¯x= 15 (mean
hours studied per week) - s= 3.2 (standard deviation)
Step 2: Substitute the values into the formula:
z=18 −15
3.2
Step 3: Calculate the z-score:
z=3
3.2= 0.9375
Step 4: Therefore, the student who studied 18 hours per week is 0.9375
standard deviations above the mean.
Question 21
Question
Let’s consider a dataset of 50 students’ scores on a midterm exam in a statistics
course. The data are as follows:
70,65,85,90,72,60,78,82,88,75,79,92,85,69,71,83,77,81,73,80,64,70,75,78,82,79,68,76,84,87,90,74,71,75,79,81,74,73,80,72,76,68,85,77,70,82,83,67,74
Calculate the following descriptive statistics for the dataset: 1. Mean 2.
Median 3. Variance 4. Standard deviation
18

Solution
1. Calculate the mean: Step 1: Add up all the values in the dataset.
70+65+85+90+72+60+78+82+88+75+79+92+85+69+71+83+77+81+73+80+64+70+75+78+82+79+68+76+84+87+90+74+71+75+79+81+74+73+80+72+76+68+85+77+70+82+83+67+74 = 3925
Step 2: Divide the sum by the total number of values in the dataset (50) to
find the mean.
Mean = 3925
50 = 78.5
2. Calculate the median: Step 1: Arrange the values in ascending order:
60,64,65,67,68,68,69,70,70,70,71,71,72,72,73,73,74,74,74,75,75,75,75,76,76,77,77,78,78,79,79,79,79,80,80,81,81,82,82,82,83,83,84,85,85,85,87,88,90,90,92
Step 2: Find the middle value. Since we have 50 values, the median will be
the average of the two middle values.
Median = 75 + 76
2= 75.5
3. Calculate the variance: Step 1: Find the squared difference between each
value and the mean, then sum these squared differences.
50
X
i=1
(xi−¯x)2
50
X
i=1
(xi−78.5)2= 1127.1
Step 2: Divide the sum by the total number of values in the dataset (50) to
find the variance.
Variance = 1127.1
50 = 22.542
4. Calculate the standard deviation:
Standard deviation = √22.542 ≈4.75
Question 22
Question
A researcher collected data on the heights (in inches) of 50 students in a uni-
versity. The sample mean height was found to be 65 inches with a standard
deviation of 3 inches. Furthermore, it was observed that the heights were nor-
mally distributed. Using this information, calculate the z-score for a student
who is 70 inches tall.
19

Solution
Step 1: Calculate the z-score using the formula for z-score:
z=x−¯x
σ
where: x= student’s height = 70 inches, ¯x= sample mean height = 65 inches,
σ= standard deviation = 3 inches.
Step 2: Substitute the values into the formula:
z=70 −65
3
z=5
3
z≈1.67
Step 3: Therefore, the z-score for a student who is 70 inches tall is approxi-
mately 1.67.
Question 23
Question
A researcher collected data on the starting salaries of 100 graduates from a
university. The mean starting salary was
$
50,000 with a standard deviation of
$
5,000. Assuming the data is normally distributed, calculate the z-score for a
starting salary of
$
45,000.
Solution
Let’s first recall the formula for calculating the z-score:
z=x−µ
σ
where: - xis the individual data point, - µis the mean of the data, - σis the
standard deviation of the data.
Step 1: Substitute the given values into the formula:
z=45000 −50000
5000
Step 2: Calculate the z-score:
z=−5000
5000
z=−1
Step 3: Answer: The z-score for a starting salary of
$
45,000 is -1.
20

Question 24
Question
Given the following dataset:
12,15,18,21,24,27,30,33,36,39
Calculate the mean, median, mode, variance, standard deviation, range, and
interquartile range.
Solution
Step 1: Calculate the mean:
Mean = 12 + 15 + 18 + 21 + 24 + 27 + 30 + 33 + 36 + 39
10 =255
10 = 25.5
Step 2: Calculate the median: Since we have an even number of data points,
the median is the average of the two middle values.
Median = 24 + 27
2=51
2= 25.5
Step 3: Calculate the mode: Since all values are unique, there is no mode.
Step 4: Calculate the variance:
Variance = P(Xi−¯
X)2
n=(12 −25.5)2+ (15 −25.5)2+. . . + (39 −25.5)2
10
Variance = 1582.5
10 = 158.25
Step 5: Calculate the standard deviation:
Standard deviation = √158.25 = 12.58
Step 6: Calculate the range:
Range = largest value −smallest value = 39 −12 = 27
Step 7: Calculate the interquartile range: First, find the first quartile (Q1)
and the third quartile (Q3). Since we have 10 data points, Q1 will be the average
of the 3rd and 4th values, and Q3 will be the average of the 8th and 9th values.
Q1 = 18 + 21
2= 19.5
Q3 = 33 + 36
2= 34.5
Then, calculate the interquartile range:
Interquartile range = Q3−Q1 = 34.5−19.5 = 15
Therefore, the mean is 25.5, median is 25.5, mode does not exist, variance
is 158.25, standard deviation is 12.58, range is 27, and the interquartile range
is 15.
21
Question 25
Question
A researcher conducted a study on the relationship between the number of hours
of study per week and final exam scores for a group of university students. The
data collected is as follows:
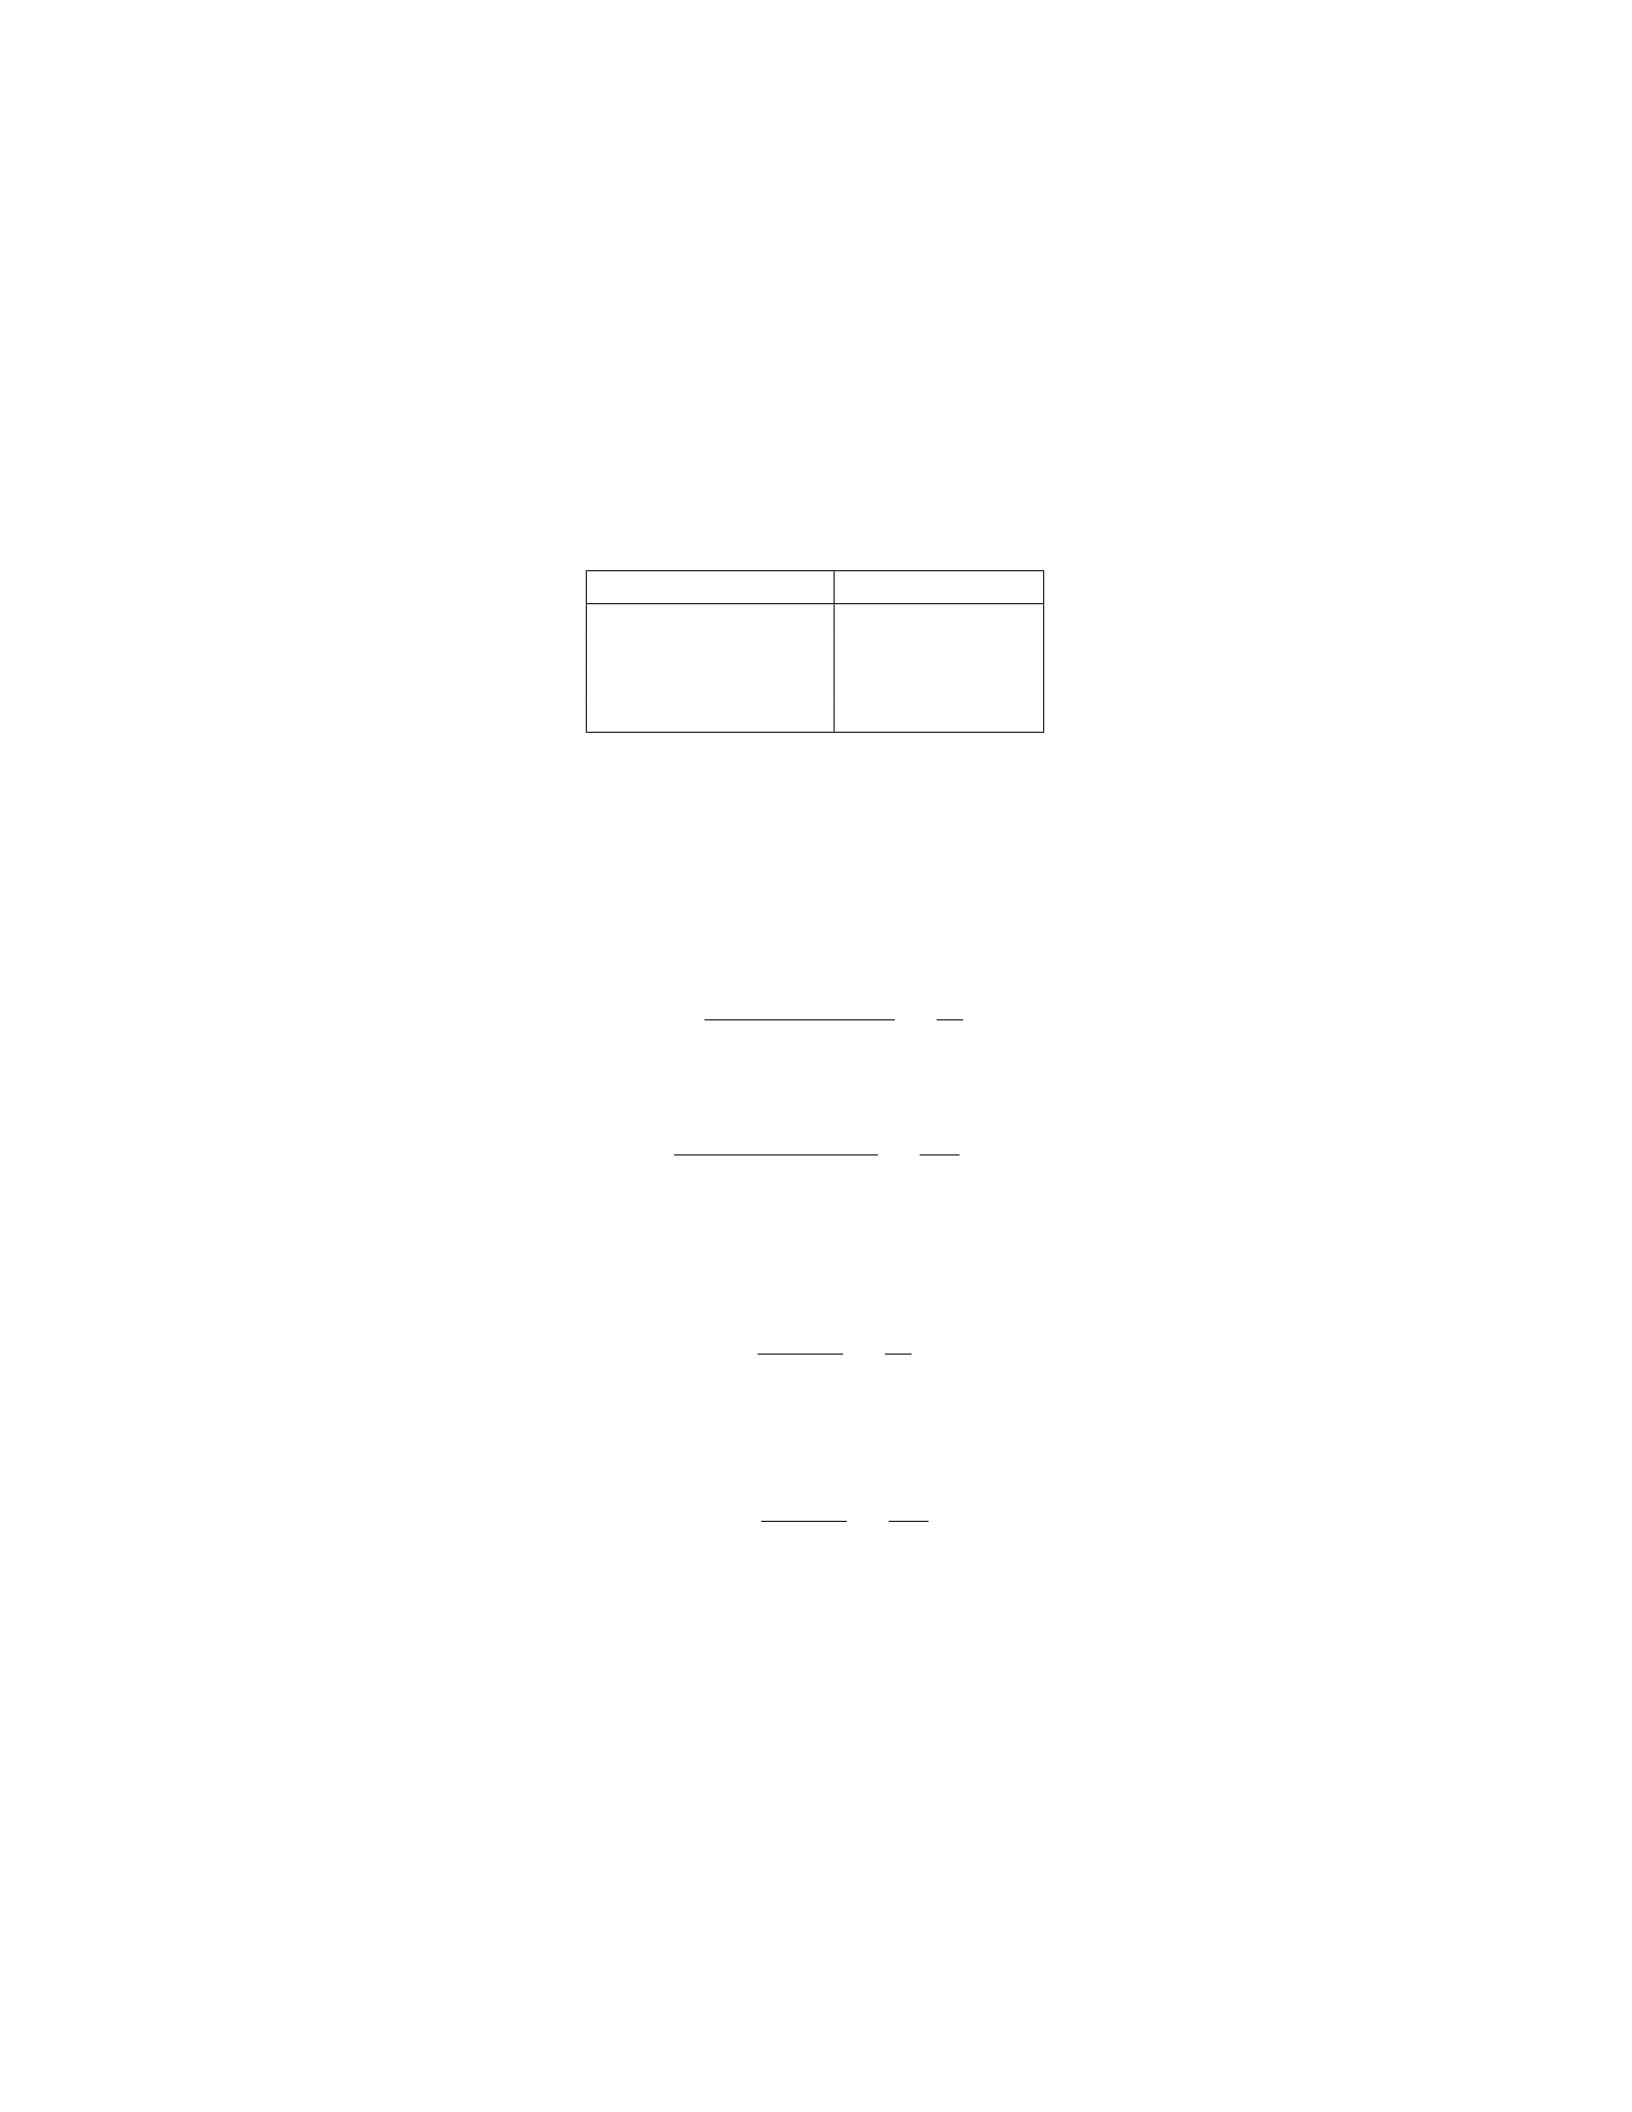
Hours of Study (x) Exam Score (y)
9 75
14 82
11 78
10 80
Calculate the mean, median, range, variance, and standard deviation for
both hours of study and exam scores.
Solution
Step 1: Calculate the mean for both hours of study and exam scores.
For hours of study,
Mean = 9 + 14 + 11 + 10
4=44
4= 11
For exam scores,
Mean = 75 + 82 + 78 + 80
4=315
4= 78.75
Step 2: Calculate the median for both hours of study and exam scores.
For hours of study, since the data is already arranged from smallest to largest,
the median is the average of the two middle values:
Median = 10 + 11
2=21
2= 10.5
For exam scores, since the data is already arranged from smallest to largest,
the median is the average of the two middle values:
Median = 78 + 80
2=158
2= 79
Step 3: Calculate the range for both hours of study and exam scores.
For hours of study,
Range = 14 −9 = 5
For exam scores,
Range = 82 −75 = 7
Step 4: Calculate the variance for both hours of study and exam scores.
22

For hours of study,
Variance = (9 −11)2+ (14 −11)2+ (11 −11)2+ (10 −11)2
4−1=4+9+0+1
3=14
3≈4.67
For exam scores,
Variance = (75 −78.75)2+ (82 −78.75)2+ (78 −78.75)2+ (80 −78.75)2
4−1=16.5625 + 6.0625 + 0.5625 + 1.5625
3=24.75
3≈8.25
Step 5: Calculate the standard deviation for both hours of study and exam
scores.
For hours of study,
Standard deviation = √4.67 ≈2.16
For exam scores,
Standard deviation = √8.25 ≈2.87
Question 26
Question
Suppose we have the following dataset representing the scores of 20 students in
a statistics exam:
60,75,82,67,89,93,78,71,76,85,69,73,79,81,88,70,64,77,84,72
Determine the mean, median, mode, range, variance, and standard deviation
of the dataset.
Solution
Step 1: Calculate the mean
Mean = 1
n
n
X
i=1
xi
Mean = 1
20×(60+75+82+67+89+93+78+71+76+85+69+73+79+81+88+70+64+77+84+72)
Mean = 1460
20
Mean = 73
Step 2: Calculate the median Since the dataset is already sorted from
least to greatest, the median will be the average of the 10th and 11th values.
Median = (73 + 76)
2
23

Median = 74.5
Step 3: Calculate the mode The mode is the score that appears most
frequently in the dataset. In this case, there is no score that appears more than
once, so there is no mode.
Step 4: Calculate the range
Range = Maximum value −Minimum value
Range = 93 −60
Range = 33
Step 5: Calculate the variance
Variance = Pn
i=1(xi−Mean)2
n
Variance = (60 −73)2+ (75 −73)2+. . . + (72 −73)2
20
Variance = 340.6
20
Variance = 17.03
Step 6: Calculate the standard deviation
Standard Deviation = √Variance
Standard Deviation = √17.03
Standard Deviation ≈4.13
Therefore, the mean is 73, the median is 74.5, the mode does not exist, the
range is 33, the variance is 17.03, and the standard deviation is approximately
4.13.
Question 27
Question
Consider the following dataset representing the scores of 20 students on a physics
exam:
73,78,82,65,88,91,72,95,79,84,77,73,86,90,68,81,76,89,74,80
Calculate the mean, median, mode, variance, standard deviation, and range
of the scores.
24

Solution
Step 1: Calculate the mean:
Mean = 1
n
n
X
i=1
xi
Mean = 1
20(73+78+82+65+88+91+72+95+79+84+77+73+86+90+68+81+76+89+74+80)
Mean = 1569
20 = 78.45
Step 2: Calculate the median: To find the median, we first need to arrange
the data in ascending order:
65,68,72,73,73,74,76,77,78,79,80,81,82,84,86,88,89,90,91,95
Since there are 20 values, the median is the average of the 10th and 11th values:
Median = 80 + 81
2= 80.5
Step 3: Calculate the mode: From the dataset, we can see that the mode is
73 since it occurs twice, which is more frequent than any other value.
Step 4: Calculate the variance:
Variance = 1
n
n
X
i=1
(xi−Mean)2
Variance = 1
20[(73 −78.45)2+ (78 −78.45)2+... + (80 −78.45)2]
Variance ≈36.9475
Step 5: Calculate the standard deviation:
Standard deviation = √Variance ≈√36.9475 ≈6.08
Step 6: Calculate the range:
Range = Max −Min = 95 −65 = 30
Therefore, the mean is 78.45, median is 80.5, mode is 73, variance is ap-
proximately 36.9475, standard deviation is approximately 6.08, and the range
is 30.
25

Question 28
Question
Let’s consider a dataset that represents the heights (in inches) of 50 university
students. The following descriptive statistics were calculated for this dataset:
Mean height: 65 inches
Standard deviation: 3.5 inches
Given this information, what can you conclude about the distribution of heights
among the university students?
Solution
To draw conclusions about the distribution of heights among the university
students based on the provided descriptive statistics, we need to consider the
properties of the mean and standard deviation.
Step 1: Mean The mean height of 65 inches indicates that, on average, the
university students are 65 inches tall.
Step 2: Standard Deviation The standard deviation of 3.5 inches measures
the variability or spread of heights around the mean. A smaller standard devia-
tion implies that the data points are closer to the mean, while a larger standard
deviation indicates that the data points are more spread out.
Step 3: Conclusion Since the standard deviation is relatively small at 3.5
inches, we can conclude that the heights of the university students are clustered
around the mean height of 65 inches. This suggests that the distribution of
heights is relatively narrow and the majority of students have heights close to
the mean height.
Question 29
Question
Consider the following data set:
12,15,18,22,25,29,33,35,40,42,45
Find the mean, median, mode, variance, and standard deviation of the data
set.
Solution
Step 1: Find the Mean Calculate the mean by summing up all the values and
then dividing by the total number of values.
Mean = 12 + 15 + 18 + 22 + 25 + 29 + 33 + 35 + 40 + 42 + 45
11
26

Mean = 316
11 = 28.73
Step 2: Find the Median To find the median, first arrange the data in
ascending order:
12,15,18,22,25,29,33,35,40,42,45
Since there are 11 values, the median is the middle value, which in this case is
the 6th value:
Median = 29
Step 3: Find the Mode The mode is the value that appears most frequently
in the data set. In this case, each value appears only once, so the data set has
no mode.
Step 4: Find the Variance Calculate the variance by finding the average of
the squared differences between each value and the mean.
Variance = (12 −28.73)2+ (15 −28.73)2+. . . + (45 −28.73)2
11
Variance ≈195.21
Step 5: Find the Standard Deviation The standard deviation is the square
root of the variance.
Standard Deviation = √Variance ≈√195.21 ≈13.97
Question 30
Question
Suppose we have a dataset with the following values:
12,15,18,20,22,24,25,27,29,30
Calculate the following descriptive statistics for this dataset:
Mean
Median
Variance
Standard Deviation
27

Solution
Let’s start by arranging the dataset in ascending order:
12,15,18,20,22,24,25,27,29,30
Step 1: Calculate the Mean The mean is calculated by summing all
values and dividing by the total number of values:
Mean = 12 + 15 + 18 + 20 + 22 + 24 + 25 + 27 + 29 + 30
10 = 22.2
Step 2: Calculate the Median Since we have an even number of values,
the median is the average of the two middle values:
Median = 22 + 24
2= 23
Step 3: Calculate the Variance The variance is calculated by finding the
average of the squared differences between each value and the mean:
Variance = (12 −22.2)2+ (15 −22.2)2+. . . + (30 −22.2)2
10
Variance ≈37.56
Step 4: Calculate the Standard Deviation The standard deviation is
the square root of the variance:
Standard Deviation = √37.56 ≈6.13
Therefore, for the given dataset, the mean is 22.2, median is 23, variance is
37.56, and standard deviation is approximately 6.13.
28

