


Multiple Regression Analysis
Quantitative Analysis Report: Multiple Regression Analysis
Adam King
Liberty University
CJUS 745: Quantitative Methods of Research
Dr. Marc Weiss
December 8, 2024
1

MULTIPLE REGRESSION
Staff Survey
Research Question
The survey was conducted, and numerous questions were asked concerning different areas across
sleep-related categories.
RQ 1: What is the factor structure of assessing employee satisfaction?
Literature Review
If employers want to reap one of the biggest benefits from their employees, they need to
have an environment where they feel genuine and comfortable sharing with others that the place
is a good place to work. One such influencing factor that promotes the willingness to share with
others is work-life balance, being considered favorable among employees. Other factors include
the types of jobs available, but work-life balance still ranks ahead of job type (Ahamad et al.,
2023). Employers must offer important benefits to employees and combat lethargy within the
work environment. Employee audits need to be completed for an organization to understand
where they stand within the market. Targeted interviews with employees who score moderately
on employee evaluations may give managers the best barometer of where the company stands.
These moderate performers may be treading water or have become burned out on the job which
could lead to them becoming poor performers, which ultimately could negatively affect an
employer’s ability to hire in the future if they have tainted the watering hole (Serenko, 2024).
Methods
A study was conducted at an Australian university in Melbourne. The study seeks to
understand relationships centered around length of service and type of employment with the
university. Employee satisfaction was judged through several categories by 479 permanent and
casual staff. The study utilized an independent T-test to understand if a significant statistical
2

MULTIPLE REGRESSION
difference could be found between the satisfaction of casual and permanent employees. A two-
way between-groups analysis was also conducted to understand the mean satisfaction when
considering length of service for casual and permanent staff. Staff were also asked if they were
likely to recommend their place of employment.
Results
The 10 variables on the Staff Survey were run through SPSS. A measure of sampling was
conducted and a value of 0.88 was extracted. This exceeds the recommended value of 0.6.
Bartlett’s test of significance indicated that p = 0.00 which shows statistical significance. Two
variables among the ten were found to have eigenvalues above one. Variable labeled q1a was
found to be responsible for 41.74% of the variance while q2a made up 11.52% of the variance.
Table 1.
Correlation matrix of the variables within staff survey
q1a q2a q3a q4a q5a q6a q7a q8a q9a q10a
Correlation q1a 1.000 .356 .223 .174 .262 .322 .243 .128 .165 .179
q2a .356 1.000 .337 .254 .264 .319 .369 .130 .218 .347
q3a .223 .337 1.000 .333 .398 .384 .413 .213 .352 .317
q4a .174 .254 .333 1.000 .682 .520 .427 .139 .591 .475
q5a .262 .264 .398 .682 1.000 .528 .435 .223 .594 .538
q6a .322 .319 .384 .520 .528 1.00
0
.478 .229 .396 .405
q7a .243 .369 .413 .427 .435 .478 1.00
0
.185 .381 .409
q8a .128 .130 .213 .139 .223 .229 .185 1.000 .081 .221
q9a .165 .218 .352 .591 .594 .396 .381 .081 1.000 .417
q10a .179 .347 .317 .475 .538 .405 .409 .221 .417 1.000
3

MULTIPLE REGRESSION
Table 2.
Measure of sampling and Bartlett’s Test
Kaiser-Meyer-Olkin Measure of Sampling
Adequacy.
.881
Bartlett's Test of
Sphericity
Approx. Chi-Square 1626.236
df 45
Sig. <.001
4
MULTIPLE REGRESSION
Table 3
PCA displaying communalities for the ten variables of the staff survey.
Communalities
Initial Extraction
q1a 1.00
0
.523
q2a 1.00
0
.553
q3a 1.00
0
.415
q4a 1.00
0
.730
q5a 1.00
0
.729
q6a 1.00
0
.542
q7a 1.00
0
.491
q8a 1.00
0
.205
q9a 1.00
0
.649
q10
a
1.00
0
.490
Table 4
Total variance of variables in staff survey
Discussion
Total Variance Explained
Component
Initial Eigenvalues
Extraction Sums of Squared
Loadings
Rotation Sums of
Squared
Loadingsa
Total
% of
Variance
Cumulative
% Total
% of
Variance
Cumulativ
e % Total
14.17
4
4
1.735
41.7
35
4.174 41.735 41.735 3.826
21.15
2
1
1.523
53.2
58
1.152 11.523 53.258 2.634
3.938 9.
384
62.6
43
4.756 7.
558
70.2
01
5.686 6.
860
77.0
61
6.609 6.
093
83.1
54
7.504 5.
035
88.1
89
8.499 4.
993
93.1
82
9.386 3.
860
97.0
43
10 .296 2.
957
100.
000
Extraction Method: Principal Component Analysis.
a. When components are correlated, sums of squared loadings cannot be added to obtain a
total variance.
5

MULTIPLE REGRESSION
Happy employees are satisfied employees. Satisfied employees are going to be benefits to
your organization. Many attributes are now known to affect one another. Positive culture,
psychology, trust, and happiness all run together and when one goes down the others are likely to
be affected (Ragan, 2019). Employee satisfaction also has a known correlation to customer
satisfaction. This known correlation has meant that employee care has received care in the last
decade (Chi & Gursoy, 2009). In capitalistic service industries, this certainly affects the margins
when your employees have so much say on the customer experience. In a university setting such
as the one from this survey, the staff can be seen as a service industry. The client is not making
daily exchanges of capital for service, but long-term investment occurs anytime they sign up for
another semester.
Conclusion
With the data from the survey, it should be evident that happy employees, whether they
are part-time or permanent should be treated equally important. They should be seen as assets
that can be used to keep employment levels full at the university. If they are willing to
recommend the university to others they are also likely to only recommend the job to people who
they would like to work with. This could create a self-fulfilling prophecy of sorts that would
ensure adequate staffing with high-level employees.
Sleep Survey
With these issues and expenditures in mind, the University in Melbourne, Australia
employees completed a survey to understand staff sleep issues (Pallant, 2020).
Research Question
6

MULTIPLE REGRESSION
The survey was conducted, and numerous questions were asked concerning different
areas across sleep-related categories.
The survey was conducted, and numerous questions were asked concerning different areas across
sleep-related categories.
RQ 1: How does Age, sex, physical fitness rating and the HADS scale scores predict total
Sleepiness and Associated Sensations Scale?
H01: Age, sex, and physical fitness ratings, and HADS depression scale scores are not good
predictors of the total scores on the Sleepiness and Associated Sensations Scales.
Ha1: Age, sex, physical fitness ratings, and HADS depression scale scores are good predictors
of the total scores on the Sleepiness and Associated Sensations Scales.
RQ 2: If sex and age are controlled, does physical fitness and depression predict a significant
amount of variance to the sleepiness scores?
Ho2:. If sex and age are controlled, physical fitness and depression does not predict a significant
amount of variance in sleep scores.
Ha2:. If sex and age are controlled, physical fitness and depression does predict a significant
amount of variance in sleep scores.
RQ 3: What differing factors affect the sleep variance in people’s lives.
Literature Review
Lack of sleep has been attributed to self-reported fatigue as well as lack of reaction time.
Those who have suffer from chronic lack of sleep are likely to have poor familial bonds that
could cause trouble at home, which only exacerbates sleep deficits (Mansyur et al., 2021).
Humans utilize circadian rhythm, which keeps the biological clock on-time and in sync with the
natural day/night cycle of the world. When this homeostatic management circuit is thrown out of
7

MULTIPLE REGRESSION
time a washdown effect occurs from sociological needs and biological (Khan et al., 2020).
Health concerns from a higher risk of diabetes, increased likelihood of depression, as well as
lowered work performance have been seen in those suffering from sleep deficits (Tay et al.,
2024).
Methods
A university in Melbourne Australia passed out a survey to its employees. The survey
was self-reporting in nature and sought to obtain data on over 50 data points. Nominal answers
were collected as well as a varying range of Likert scales were utilized. A range of 18-84 year
olds submitted surveys with 271 total responses. Personal questions from alcohol consumption to
if the respondents were smokers and how often they smoked were asked. Surveys were
anonymous, but identifying numbers attributed to height and weight were collected. Data points
attached to the Epworth Sleepiness Scale (ESS) were also collected during this study. Eight data
points are collected on scores from zero to three. These scores are then combined to indicate an
overall level of daytime sleepiness. Increased scores that indicate sleepiness are at ten or higher
while the max is 24. (Cangur et al., 2024). The questionnaire also asked what the participant’s
gender was. This was done as to see any significance in gender and sleepiness ratings.
Results
Analysis of the variance test reveals a statistical significance with a value of 0.01 which
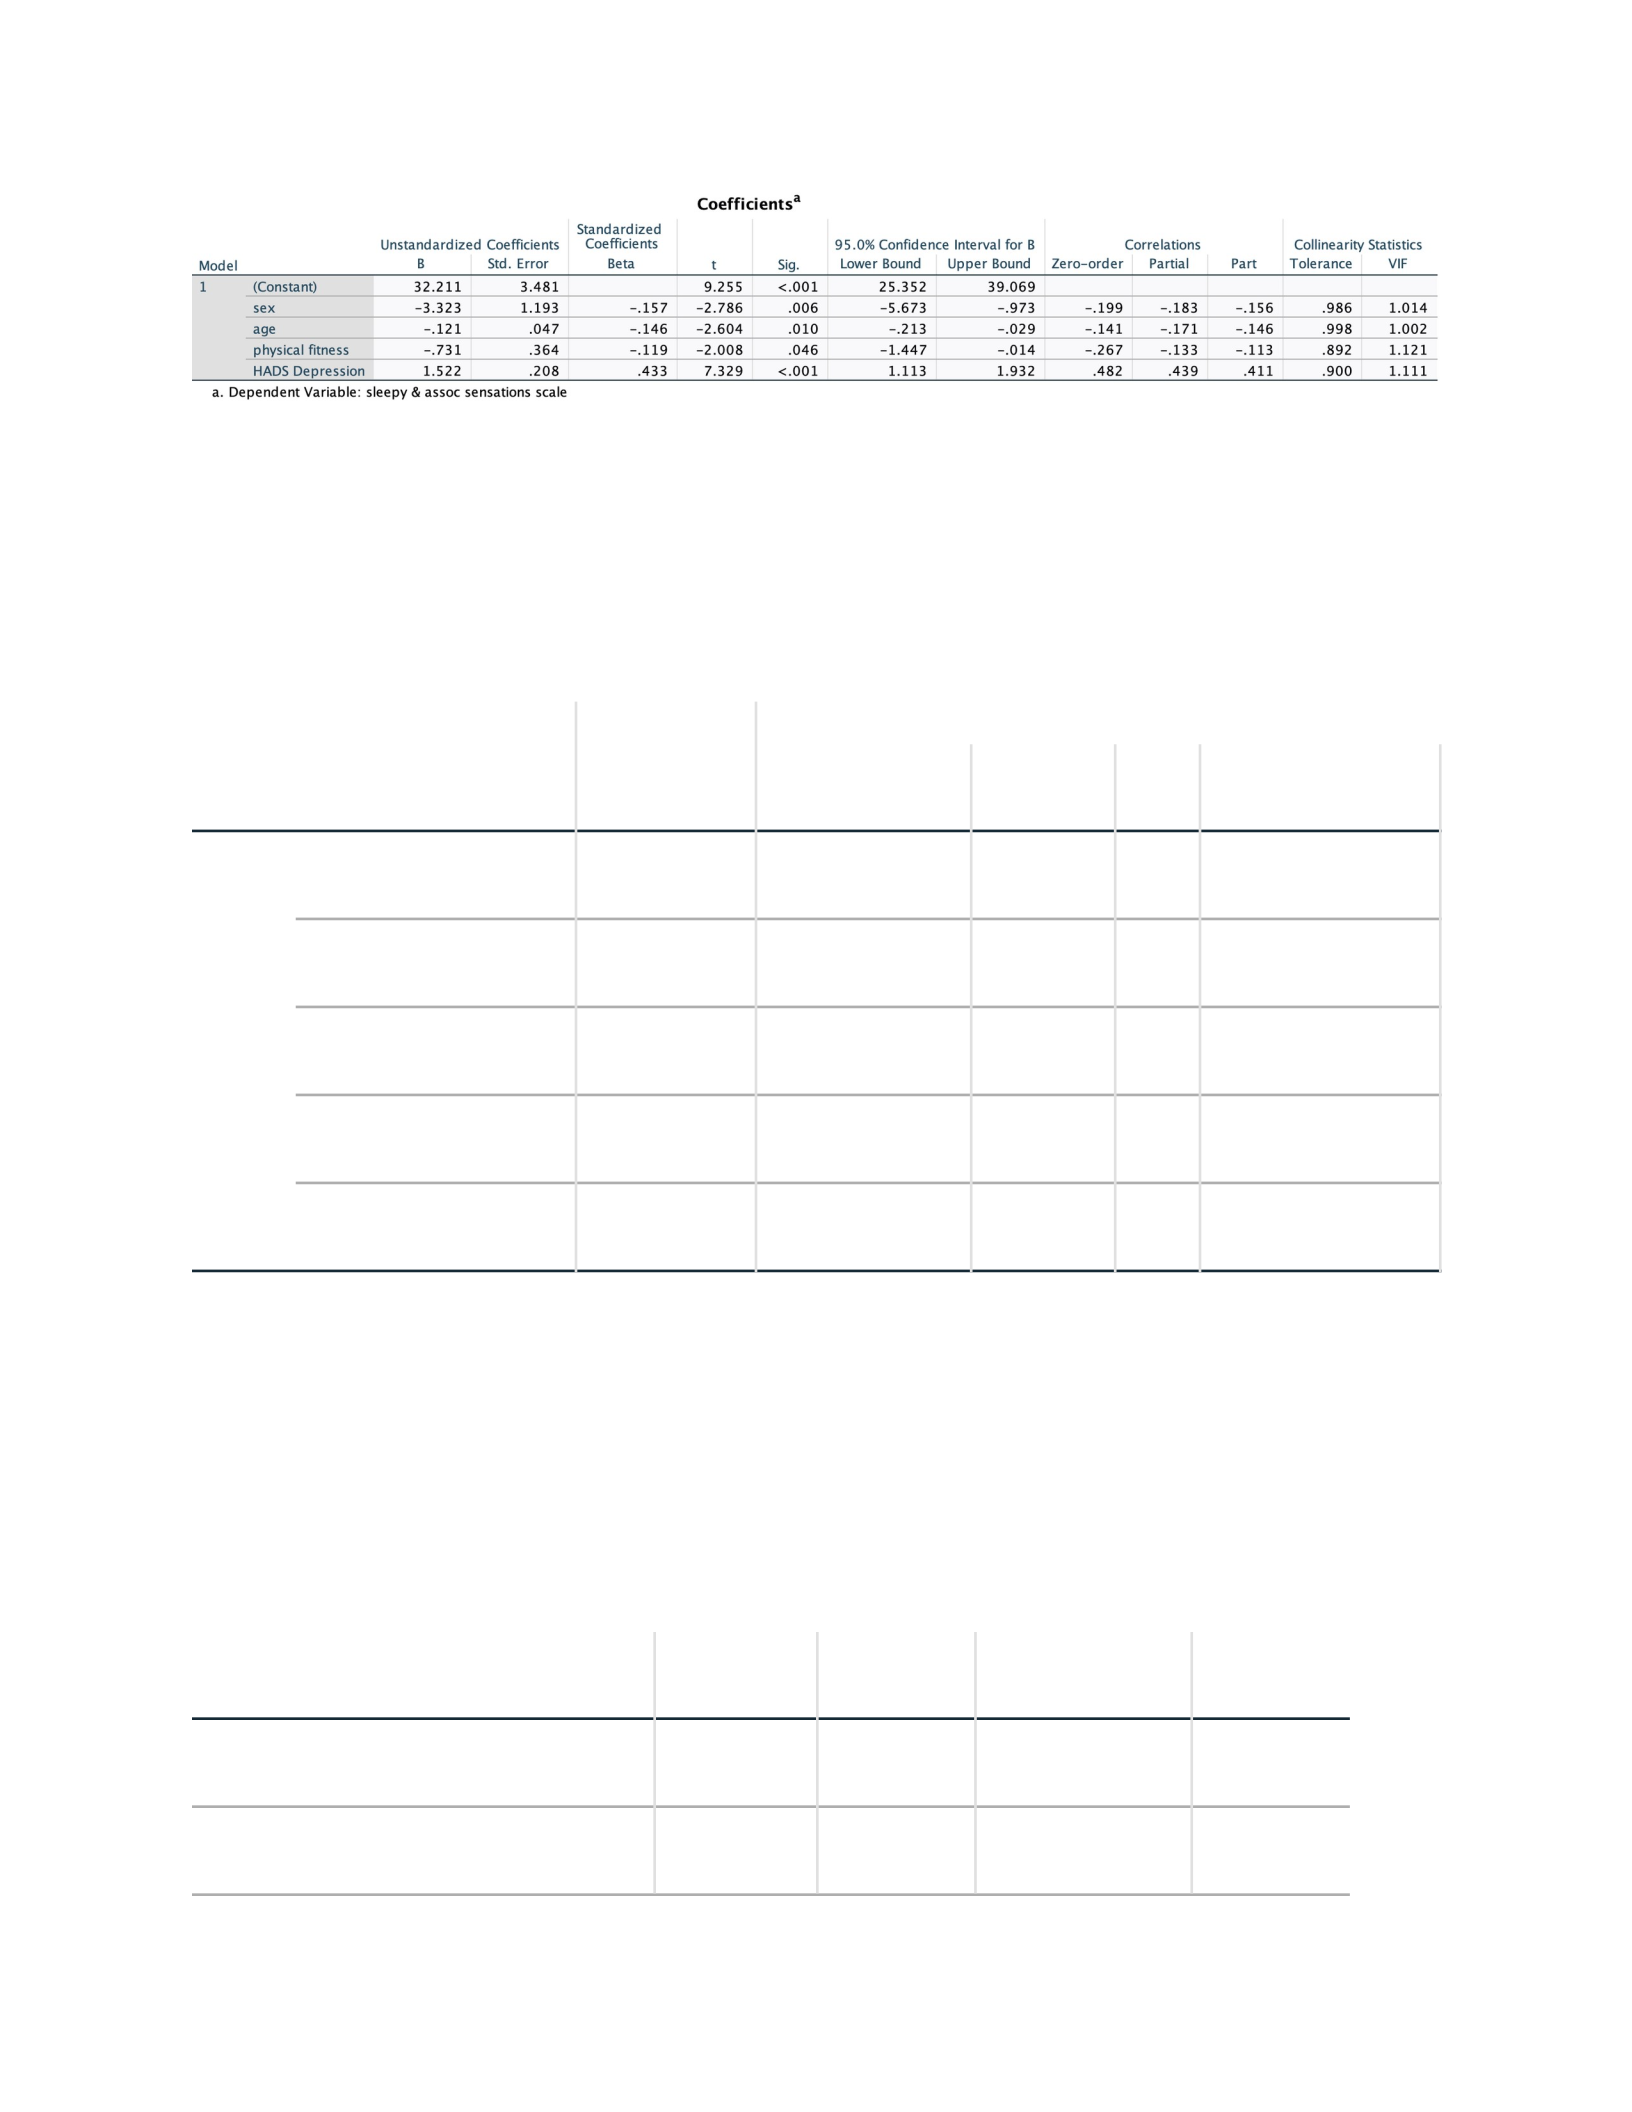
indicates significance. Collinearity test scores indicated by Table 6 reveal that age, sex, physical
fitness, and depression scores do not indicate scores for the Sleepiness and Associated Sensations
Scale.
Table 1
8
MULTIPLE REGRESSION
Statistics regarding sex, age, physical fitness ratings, and depression.
Descriptive Statistics
Mean Std. Deviation N
sleepy & assoc
sensations scale
26.04 10.520 251
sex .45 .498 271
age 43.87 12.684 248
physical fitness 6.42 1.717 266
HADS Depression 3.50 2.993 269
Table 2
Correlations
sleepy &
assoc
sensations
scale sex age
physical
fitness
HADS
Depression
Pearson
Correlation
sleepy & assoc
sensations scale
1.000 -.199 -.141 -.267
sex -.199 1.000 -.017 .110
age -.141 -.017 1.000 -.039
physical fitness -.267 .110 -.039 1.000
HADS Depression .482 -.071 -.004 -.314
Sig. (1-tailed) sleepy & assoc
sensations scale
. <.001 .017 <.001
sex .001 . .393 .037
age .017 .393 . .271
physical fitness .000 .037 .271 .
HADS Depression .000 .124 .473 .000
N sleepy & assoc
sensations scale
251 251 230 247
sex 251 271 248 266
age 230 248 248 243
9

MULTIPLE REGRESSION
physical fitness 247 266 243 266
HADS Depression 249 269 246 265
Table 3
Model Summaryb
Model R
R
Square
Adjusted R
Square
Std.
Error of the
Estimate
1.541a.293 .280 8.927
a. Predictors: (Constant), HADS Depression, age, sex,
physical fitness
b. Dependent Variable: sleepy & assoc sensations
scale
Table 4
ANOVAa
Model
Sum of
Squares df
Mean
Square F
Sig
.
1Regression 7413.34
3
4 1853.336 23.258 <.0
01b
Residual 17929.1
87
22
5
79.685
Total 25342.5
30
22
9
a. Dependent Variable: sleepy & assoc sensations scale
b. Predictors: (Constant), HADS Depression, age, sex, physical fitness
Table 5
10
MULTIPLE REGRESSION
Table 6
Collinearity Diagnosticsa
M
odel Dimension Eigenvalue Condition Index
Variance Proportions
(Constant) sex age physical fitness
11 4.027 1.000 .00 .02 .
00
.00
2.539 2.734 .00 .69 .
00
.00
3.343 3.424 .00 .28 .
02
.03
4071 7.509 .00 .01 .
62
.34
5.020 14.235 .99 .00 .
35
.63
a. Dependent Variable: sleepy & assoc sensations scale
Table 7
Residuals Statisticsa
Mi
nimum
Ma
ximum
Me
an
Std.
Deviation N
Predicted
Value
15.
04
42.
28
26.
15
5.653 24
2
Residual -2
4.781
19.
438
.17
8
8.839 22
5
11

MULTIPLE REGRESSION
Std.
Predicted Value
-1.
933
2.8
53
.01
8
.993 24
2
Std. Residual -2.
776
2.1
78
.02
0
.990 22
5
a. Dependent Variable: sleepy & assoc sensations scale
Discussion
The data indicates that women are more likely to suffer from sleepiness than men.
Determining why that is another matter. Higher sleepiness scores would indicate that there is an
irregular sleep cycle. Hindrances in the ability to fall asleep quickly could give physiological
reasoning (Taillard et al., 2024). With 25% of the population suffering from excessive daytime
sleepiness, solutions to the problem need to be found to lower that number. Lack of sleep causes
increased rates of stress which coupled with other understood health concerns could cause real
problems for those suffering from lack of sleep (Puretic et al., 2024).
Conclusion
Even God rested in Genesis 2:2, “On the seventh day God had completed His work that he
had done, and he rested.” (Christian Standard Bible, 2017). If an omnipotent and all-powerful God
believes it to be beneficial to rest then humanity should take note and do the same.
12

MULTIPLE REGRESSION
References
13

MULTIPLE REGRESSION
Ahamad, F., Saini, G. K., & Jawahar, I. (2023). Interactive influence of work-life balance
benefits, employee recommendation, and job attributes on employer attractiveness and
job pursuit intentions: Two experiments. Asian Business & Management, 22(4), 1215
-1242. https://doi.org/10.1057/s41291-022-00184-4
Christian Standard Bible. (2017)KHolman Bible Publishers.KNashville, Tennessee
Cangur, S., Balbay, E., & Weaver, T. (2024). Factors affecting daily functioning in turkish
patients with obstructive sleep apnea. Medicina (Kauna, Lithuania), 60(10), 1652.
https://doi.org/10.3390/medicina60101652
Chi, C. & Gursoy, D. (2009). Employee satisfaction, customer satisfaction, and financial
performance: An empirical examination. International journal of Hospitality
Management, 28(2), 245-253. https://doi.org/10.1016/j.ijhm.2008.08.003
Khan, S., Malik, B., Gupta, D., & Rutkofsky, I. (2020). The roe of circadian misalignment due to
insomnia, lack of sleep, and shift work in increasing the risk of cardiac diseases: A
systematic review. Cureaus, 12(1). https://doi.org/10.7759/cureus.6616
Mansyur, M., Sagitasari, R., Wangge, G., Sulistomo, A., & Kekalih, A. (2021). Long working
hours, poor sleep quality, and work-family conflict: Determinant factors of fatigue among
Indonesian tugboat crewmembers. BMC Public Health, 21(1), 1-1832.
https://doi.org/10.1186/s12889-021-11883-6
Pallant, J. (2020). SPSS survival manual: A step-by-step g uide to data analysis using IBM SPSS
14

MULTIPLE REGRESSION
Puretic, H., Bosnar Puretic, M., Pavlisa, G., & Jakopovic, M. (2024). Revisiting the Epworth
sleepiness scale. Is excessive daytime sleepiness stiall a valid screening tool for
obstructive sleep apnea in a population at risk? Wiener Klinische Wochenshcrift, 136(13-
14), 390-397. https://doi.org/10.1007/s00508-023-02213-4
Ragan, P. (2019). The Happiness factor: Happy employees are safer employees. Professional
Safety, 64(9), 35-38
Serenko, A. (2024). The human capital management perspective on quiet quitting:
Recommendations for employees, managers, and national policy makers. Journal of
Knowledge Management, 28(1), 27-43. https://doi.org/10.1108/JKM-10-2022-0792
Taillard, J., Micoulaud-Franchi, J. Martin, V., Peter-Derex, L., & Veccheirini, M. (2024).
Objective evaluation of excessive daytime sleepiness. Neurophysiologie Clinique, 54(2),
102983-102983. https://doi.org/10.1016/j.neucli.2023.102938
Tay, E., Koh, Y., Vaingankar, J., Abdin, E., Sambasivam, R., Zhang, Y., Shafie, S &
Subramaniam, M. (2024). Association between sleep quality and quality of life in
Singapore. Quality of Life Research, 33(6), 1707-1717. https://doi.org/10.1007/s11136-
024-03621-3
15

