


BUSI 600 Chapter 5 Atage 2: Sampliing Design Notes
This subprocess of research design answers the research from
whom or what (Target Population) does the data need to be
collected? How and from how many (Cases)?
Steps in the Subprocess
1. Define the target population and case (describe those
entities-collectively and individually-that possess the
desired information about the chosen variable and their
parameters.
2. Define the population parameters of interest (Summary
descriptors-proportion, mean, variance of study variables)
in the population.
3. Identify and evaluate the sample frame (list of cases within
the target population) or create one.
4. Define the number of cases needed (choose between a
census or sample; choose the size of any sample).
5. Define the appropriate sampling method (the type of
sample to be used).
6. Define the sampling selection and recruitment protocols
(choose standardized procedures or custom-design ones).
Target Population
People (individuals or groups: Case would be employees,
customers, or suppliers).
Organizations or Institutions (Case would be companies,
trade associations, professional communities, or unions)
Events and Happenings (Case would be trade association
meetings, presentation to financial analysts, industry
conventions, employee picnics).
Objects or artifacts (Case would be products, machines,
production wastes or byproducts, tools, maps, process
models, or ads).
Settings and environments (Case would be warehouse,
stores, factories, or distribution facilities).
Text & Records (Case would be annual reports,
productivity records, social media posts, emails, memos,
reports).
Case: A single element drawn from a target population
Define the po pulation parameters of interest (Summary
descriptors-proportion, mean, variance of study variables) in the
population.
Sample Statistics are descriptors of those same relevants
variables computed from sample data. They are used as
estimators of population parameters. They are the basis of our
inferences about the population.
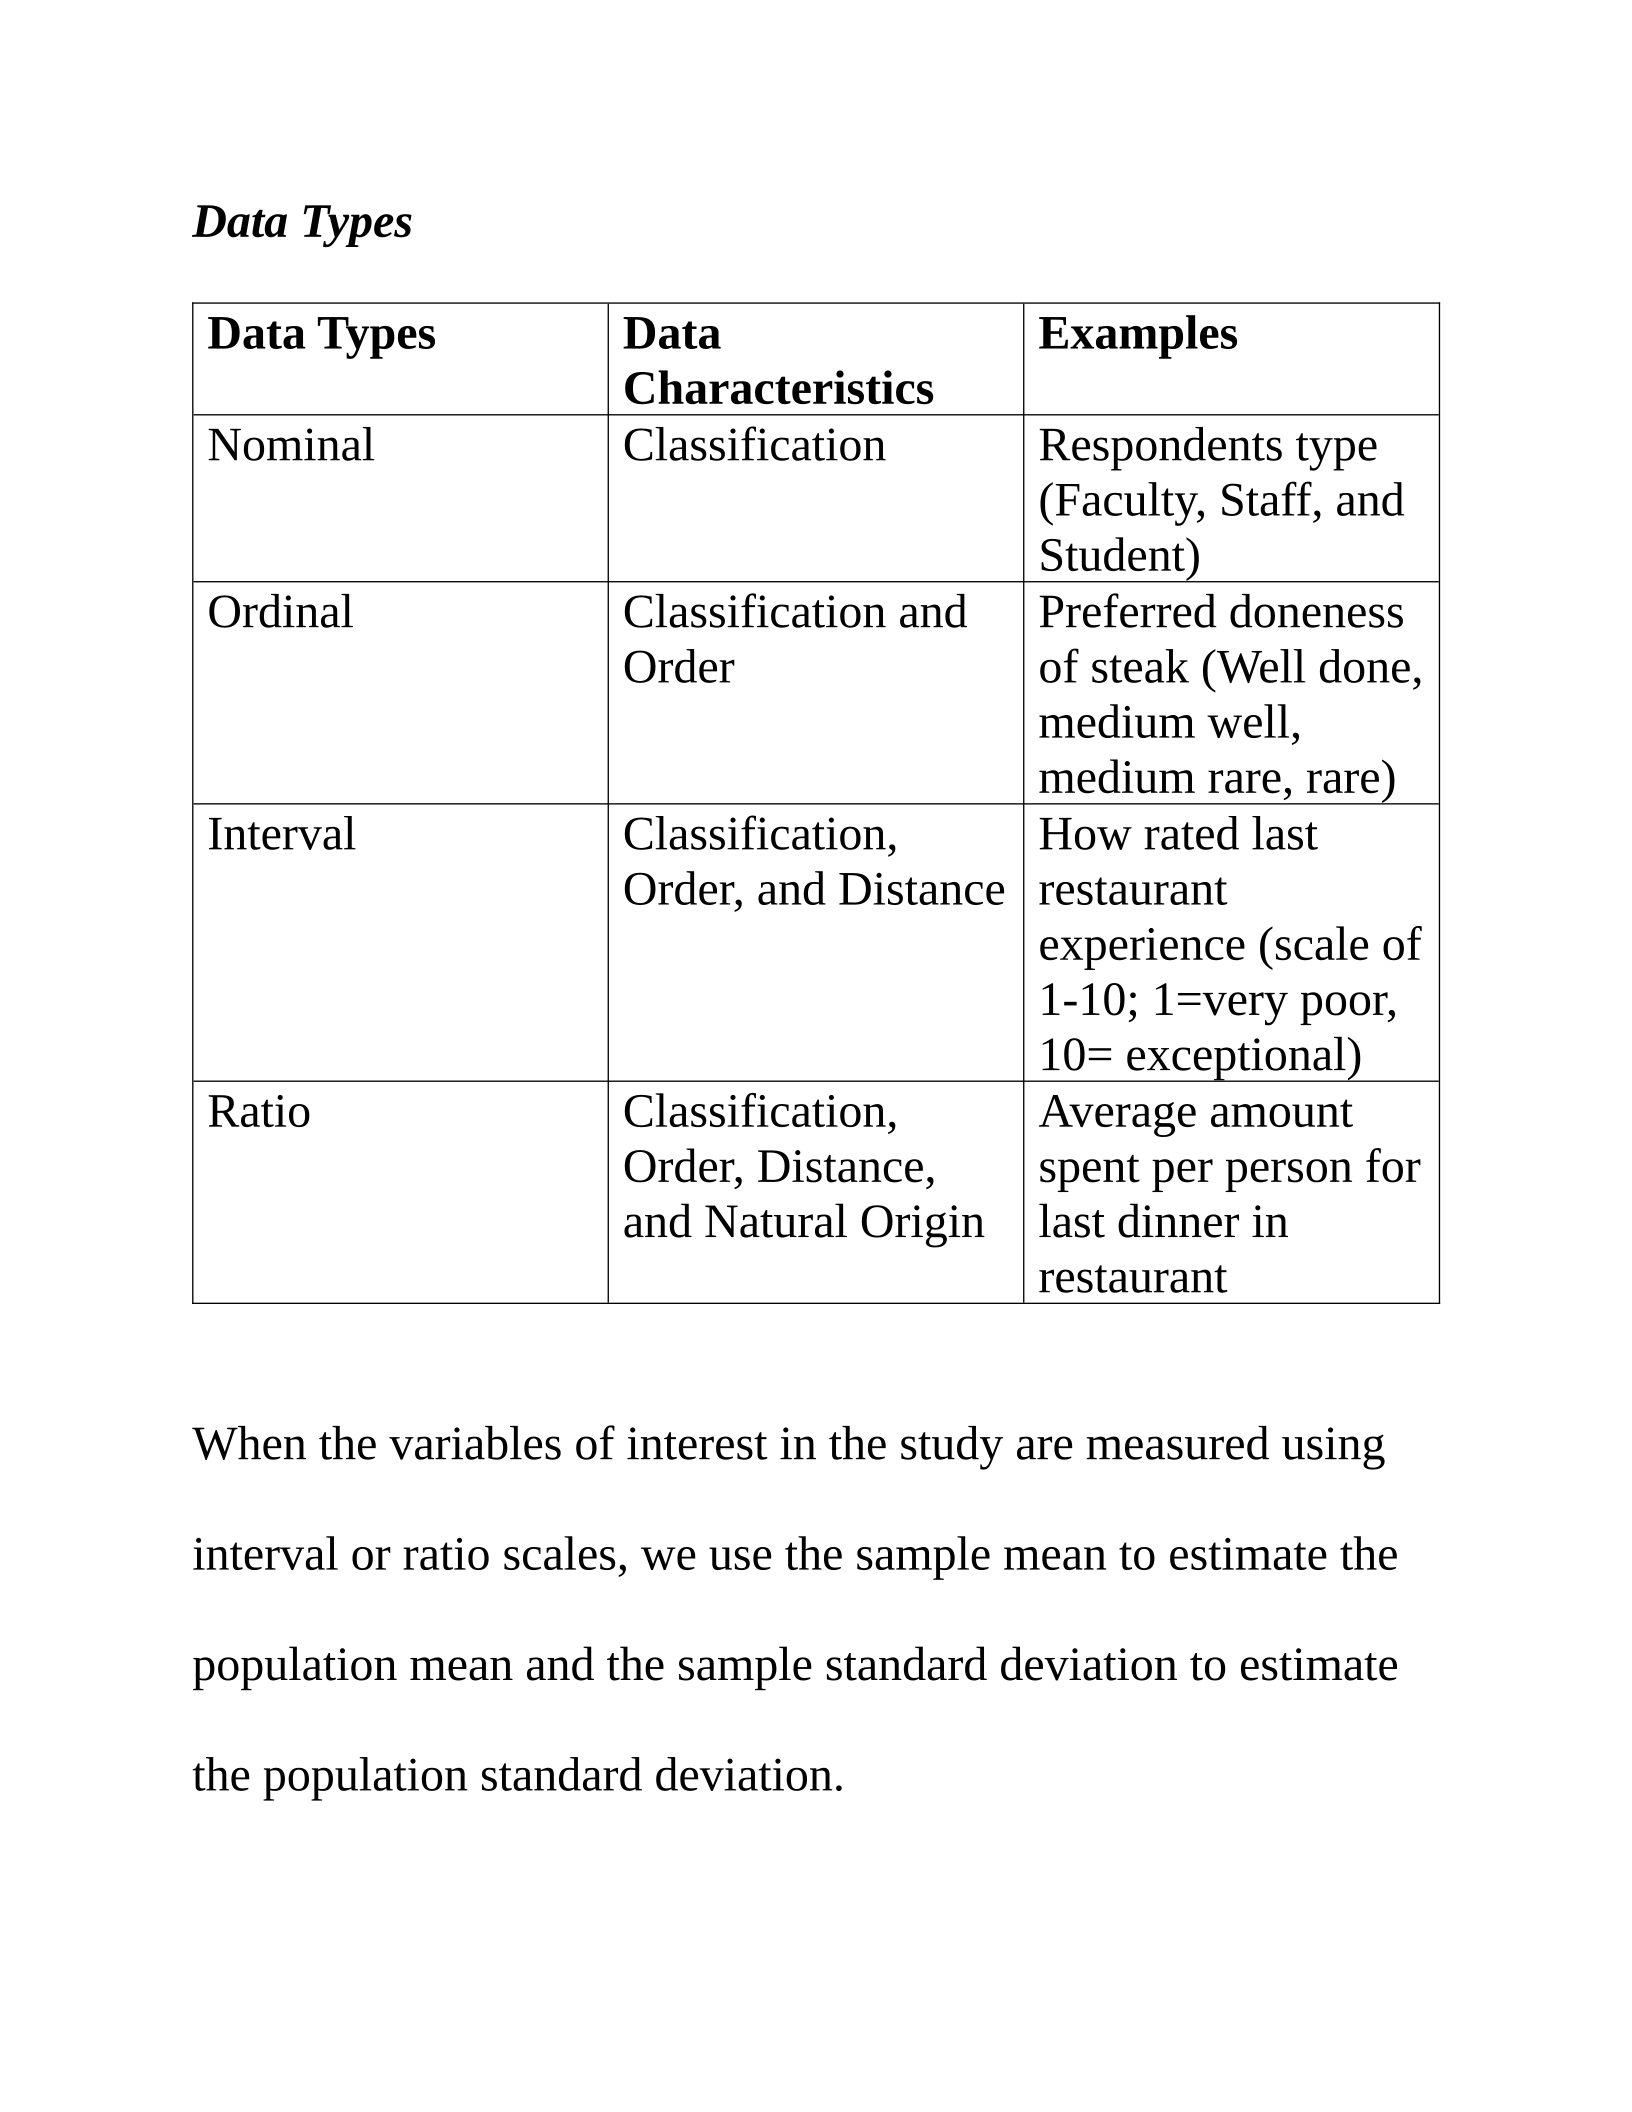
Data Types
Data Types Data
Characteristics
Examples
Nominal Classification Respondents type
(Faculty, Staff, and
Student)
Ordinal Classification and
Order
Preferred doneness
of steak (Well done,
medium well,
medium rare, rare)
Interval Classification,
Order, and Distance
How rated last
restaurant
experience (scale of
1-10; 1=very poor,
10= exceptional)
Ratio Classification,
Order, Distance,
and Natural Origin
Average amount
spent per person for
last dinner in
restaurant
When the variables of interest in the study are measured using
interval or ratio scales, we use the sample mean to estimate the
population mean and the sample standard deviation to estimate
the population standard deviation.
When the variables of interest in the study are measured using
nominal or ordinal scales, we use the sample Proportion of
Incidence (p) to estimate the population proportion and the (pq0
to estimate the population variance where q= (1-p).
The proportion of incidence is equal to the number of cases in
the population belonging to the category of interest, divided by
the total number of cases in the population.
The sample frame (list of cases within the target population) or
create one. The sample frame differs from the desired
population. A directory is an inaccurate list as a sample frame.
A Community is a collection of digitally literate individuals
who who want to engage with each other and with a company to
share ideas, concerns, information, and to assist with decision
making.
Software used to draw samples from communities should be
judged by sample characteristics.
Quality (Participants will be engaged throughout the
research, repeated use controls are in place so individuals
are not participating in too many research projects, fraud
prevention was used during recruitment to the community
so sample units are who they claim they are).
Replicability (parameters that define sample units remain
consistent over time, so you can draw comparable samples
over time).
Control (new parameters can be added, the researcher can
prescreen with as many parameters as necessary)
Size & Diversity (sufficient participants meeting the
desired parameters are members of the community)
Define The Number of Cases needed (choose between a census
or sample; choose the size of any sample).
Research participants to avoid
Non-compliers (don’t follow directions)
Rush-throughs (tend to speed; they fail to give thoughtful
answers to questions or be careful in executing activities)
Liars (are dishonest, either intentionally or unintentionally)
Frequent repeaters
Fakes (may be human or nonhuman like bots in a survey)
Straightliners (Do not give careful thought to their answers
Reasons for using a Sample (subset of a target population)
rather than a Census (all cases within a population)
1. Lower Costs
2. Greater speed of data collection
3. Availability of population cases
4. Greater accuracy of results
Errors in research
Sampling Error: Estimates of a variable drawn from a
sample differ from true value of a population parameter
Non-sampling Errors: Errors not related to the sample but
to all other decisions made in the research design
Response Errors: occurs when participants gives inaccurate
responses (guesses, lies) or when true responses are
inaccurately recorded or misanalyzed by researchers.
Non-response Errors: Occurs when participants selected for
a sample choose not to participate.
Systematic Variance The variation in measures due to some
known or unknown influences that cause the scores to lean in
one direction more than another
Define the appropriate sampling method (the type of sample to
be used).

