


1
Chapter 1: Introduction to the Study
Introduction
This study explored the use of applied data-modeling concepts to refine the data
model for management analytics and decision support in a big data environment. The
study sought to address the challenges facing data analytics projects, which included, the
overwhelming availability of big data, the growing complexity of business domains, the
demands of operational accountability, and the explosion of analytic techniques (De
Smedt, 2013; McAfee & Brynjolfsson, 2012; Storey & Song, 2017). The issue was that
insights and solutions from these projects lost alignment to well-known data and the
intuitive cognitive models required for the management problem-solving.
Chapter 1 covers the following topics: background of the study, the purpose of the
study, the research questions, the nature of the study, the theoretical foundation, the
definition of critical terms; the scope, delimitations, and limitations of the study; and the
significance of the study to management theory, business practice, and social change.
Background of the Study
I was motivated to study this topic due to a combination of research and personal
experience showing that companies’ efforts in the areas of data analytics and decision
support were often neither effective nor efficient. Most management decisions and
actions of business analysts and executives used intuitions and cognitive models, and not
insights or solutions from data analytics and decision support systems (Yeoh & Popovič,
2015). The difficulty was the framing of specific management problems or opportunities

2
with available data. For this reason, management questioned the value proposition of
investments in data analytics and decision support systems. Strategic decision failures,
such as, the 2008 global economic collapse and many other such occurrences in history
were examples that made formal analysis and decision support systems suspicious as
viable management problem-solving tools (Bosch, Nguyen, & Buckle-Henning, 2014).
With the advent of business big data, the data analytics projects faced three
challenges: (a) taming the information chaos caused by the exponential growth of
information assets, (b) relieving the mounting pressure to use these information assets to
advance efficiency and predictability of decision-making, and (c) addressing acute
problems of information deluge on decision-making, including analysis paralysis,
escalating indecision, reification, and strategic ambiguity (Block, 2012; Tien, 2013).
From these challenges the following two problem scenarios arose. The more important
was the difficulty in the discovery of underlying structures and associations about
subjects of interest. The other issue was transforming these structures and associations
into actionable business insights and organizing them into scenarios to improve
management programs for predictable and positive outcomes (Resmini, 2012).
These challenges were reduced when the data were in models that connected
underlying elements and their associations (Hand, 2012; Thompson, 2011). A well-
constructed data model captured the structure, content, and context of the underlying
elements. Such models also captured mechanisms and situations responsible for the
outcome observations of the domain of interest (Burch, 2018). The data model provided

3
the stable and accurate representation of subjects within the enterprise (Johnson, 2014).
Furthermore, the data model provided the foundation for the continuous discovery of the
attributes of dominant subjects for management problem-solving (Beroggi, 2010;
Kwakkel, Walker, & Marchau, 2010). Additionally, the data model carefully rationalized
and integrated the attributes from all relevant data sources without compromising the
integrity of the data generation processes, therefore, provided the most comprehensive
collection of the subjects responsible for the performance of the enterprise.
With the advent of big data, input data structures came in many different forms. It
was not uncommon for data structures like online transaction processing (OLTP), online
analytic processing (OLAP), relational, object-relational, hierarchical (or graph),
network, document, and flat data structures to be part of a single data analytics project
scope. Because of the size and dimensionality of these data sources, it was typical for
contemporary analytic processes to partition and sample the data to limit complexity.
Partitioning led to the deluge of partial analytic solutions and data silos, for example,
static reports, dynamic reports (dashboards, scorecards), and analytic algorithms (Kalou
& Koutsomitropoulos, 2014). Sampling raised issues of representativeness, bias, and the
requirement of statistical validation. New and advanced data analytics methodologies
arose to overcome these concerns.
The advanced data analytics techniques included semantic data analysis, statistical
data analysis, symbolic data analysis, functional data analysis, topographical data
analysis, projection pursuit analysis, exploratory system dynamics and modeling, data

4
mining, and deep learning to name a few. These advanced data analytics techniques were
responses to the growing availability of data and the demand to use them to guide
knowledge and learning (Paganoni & Secchi, 2014). A unique challenge of these
advanced analytic methods was in the pre-processing of the data for the analytic
technique selected (Kaisler, Espinosa, Armour, & Money, 2014). This pre-processing
step required the selection of attributes, sampling of the data, and transformations of the
data in ways that caused loss of business interpretability and value (Kalou &
Koutsomitropoulos, 2014; Ma et al., 2014). For this reason, I chose the approach of
analyzing the data to determine how to extend the model to accommodate the unique
challenges posed by big data in data analytics projects for management problem solving
without the constraints imposed by analytic methodologies.
Problem Statement
Most business analysts and executives found the outputs from big data projects
inadequate for management analytics and decision support (Bendre & Thool, 2016).
From 2006 to 2016, an estimated average of 50% of these projects failed to deliver
acceptable and actionable outputs to business users (Gartner Inc, 2016). Also, the
percentage of failed data analytics projects continued to rise with the exponential growth
of data within organizations (Khan et al., 2014). The general management problem was
that the outputs did not reconcile the intuitive cognitive model of the problem situation of
business analysts and executives and the accustomed available data (Zicari et al., 2016).
In many cases, these outputs were incomplete, difficult to understand, and difficult to

5
translate into management actions because of their black-box nature (Günther, Mehrizi,
Huysman, & Feldberg, 2017). The outputs were also disconnected from available data
and from dominant cognitive conceptualization of the management problems and
solutions by analysts and executives (Flath & Stein, 2018; Ransbotham, Kiron, &
Prentice, 2017). The specific management problem was the inappropriate representation
of information by big data projects for management analytics and decision support
(Sivarajah, Kamal, Irani, & Weerakkody, 2017; Storey & Song, 2017).
Purpose of the Study
The purpose of this quantitative descriptive study was to examine the data model
of a typical data analytics project in a big data environment for opportunities to improve
the representation of information. I identified the data model as the primary focus of the
study because the expression of information in the data model was known to improve
understanding and application of the data (Burch, 2018). I adopted nonexperimental
design-based research (DBR) to study the data model for artifacts that would improve the
expression of the underlying management situations.
The research questions of this study focused on extracting expressions in the
available data to improve the discovery, identification, specification, and resolution of
management problems. Using 15-terabyte secondary data sets from U. S.-based
multinational medical product distribution company on orders, payments, products,
customers, sales channels, and marketing activities, I applied ontology learning to
identify operational concepts within the business domain. I used data engineering to

6
connect the concepts to available data through direct transformations, and analytic
formulations to abstract functional forms from the available data. This approach ensured
that any resulting analytic insights and solutions maintained the connection to the
available data.
I assessed the performance of the data model artifacts on empirical measures of
analytic importance such as information gain, intelligence density, decision yield,
cognitive gain, empirical lift, Bayesian yield, the weight of evidence, and strength of
association measures, as necessary. The results of this study could increase (a) the
acceptance of big data analytics outputs by business analysts and executives, (b) the
return on investment for big data analytics projects, and (c) the overall efficiency of data-
driven management analytics and decision support. The social change implication was an
increase in management engagement in social programs to sustain good corporate
citizenship within stakeholder communities, including sponsorship of community events
and social programs.
Research Questions
The research questions focused on finding artifacts within enterprise data to
model key business scenarios for management problem-solving as follows:
Research Question 1: Can data model extensions improve the discovery of
management scenarios from big data?
Research Question 2: Can data model extensions improve insights about the
management scenarios?

7
Research Question 3: Can data model extensions express the complex constraints
and rules needed to compose the acceptable and actionable solutions for analysts and
executives?
Research Question 1
I relied on the relational model as the primary approach to modeling enterprise
data. This modeling approach and subsequent enhancements solved significant problems
in the use of databases to deliver information systems. The initial relational data model
proposal unified data representation and addressed issues of data integrity. The proposal
also added enhancements, for example, the relationship and the data catalog (or
dictionary extensions) to improve the capture of the meaning of data and the use of the
database for analysis (Werro, 2015). However, the capture of meaning was limited to
low-order predicate logic, based on the quantities of attributes. Advanced analytics and
decision support required higher-order logic, ontological argument assertions, and
association reification to address complex analytic needs of management (Fried, Jansen,
Hahn-Powell, Surdeanu, & Clark, 2015). The premise of this research question was that
the manifestation of this higher-order logic, ontological argument assertions, and
association reification at the data level had the potential to improve the analytics and
decision support for management problem-solving.
Research Question 2
The challenge of representing business insights and solutions derived from big
data was the consequence of the increase in complexity of enterprise business processes

8
which manifested in applications, systems, and data environments. Addressing this
complexity in the use of databases for analysis led to data warehousing and business
intelligence applications. Data warehouses consolidated the data into single logical or
physical repositories, while business intelligence applications automated the exploration
of the data. From these systems and other sources, the creation of specialized datasets for
advanced analysis, for example, statistical analysis, mathematical programming, system
dynamics modeling, data mining, symbolic data analysis, functional data analysis, deep
learning, to name a few, became a necessity. This practice resulted in analytic silos which
constrained general expression of the enterprise within analytic solutions. The need to
segment analytic processing arose when the business analysis was limited to simple
aggregations in the presence of lots of data. The need also arose due to inadequate
computational power for all attributes and instances of the data in analytic processing.
Fortunately, these situations have changed in the modern enterprise, so high-
dimensionality analysis can be taken advantage of in creating insights for management
analytics and decision support (Liu, Liu, & Li, 2017). This new perspective allows
information about randomness, uncertainty, and dynamism to be expressed within
available data. It also allows the supporting data processing to adopt a distributed and
parallel approach, co-opting the resources needed for the computational task at hand.
Research Question 3
The success of algorithms in analytic processing was an essential contribution of
the last decade. In advanced analytic processing, extensions to properties of infinitely

9
differentiable functions are used to specify real complex lines and planes (Veech, 2014).
These extensions established analytic continuity and discontinuity (or breaks) in analytic
scenarios. The extensions contributed to analytic solutions such as complex response
surface topology, convoluted neural networks, restricted Boltzmann machines, and many
others that are capable of expressing difficult conditions and constraints as chains, trees
or forests of logic within the analytic space (Paganoni & Secchi, 2015). The implication
was that these techniques could be incorporated into the formulation of analytic
characteristics and associations to enhance data for management analytics and decision
support.
To address these research questions, I investigated methods of analytic data
representation. The investigation involved exploration of metadata, the underlying
ontology of the available data, and the intuitive cognitive conceptualization of the
management problem scenario. Since the business environment was not static, it was
critical to integrate continuous adaptation of the representation and annotation of the
characteristics and facts in the business domain. The implication was that contemporary
approaches to analytic data-modeling, which were mostly static, needed innovation to
capture changes in the attribution of concepts within the domain. The innovation was the
application of analytic formulation techniques to derive additional data from the source
data inputs while preserving the links between the input and derived data. Preserving the
links improved the explainability of the insights generated, when the derived data were
multi-valued, non-decomposable attributes, statistical moments, weighted scores (for

10
example, propensity scores, rank scores, linear weights or variates), domain markers,
patterns, profiles, perceptrons, coefficients, and so on. These derived data expressed
concepts and constructs not directly captured by the available data to broaden the scope
of the data for management problem-solving. Addressing the complexity of the derived
data in the data model was critical. I used partitioning, classification, segmentation,
grouping, and so on, to control the extant complexity under consideration, much the same
way as randomization and blocking during experimentation.
Theoretical Foundation
In this study, I integrated theories of information science and theories in applied
management and decision science. The key theories from information sciences were
relational, dimension, and information theories. I used these theories from Information
sciences to extend the theories from applied management and decision sciences in the
design of the data model for the management analytics and decision problem
representation. Specifically, information entropy and high-dimensional utility theories
were critical in the deconstruction of data for management problem-solving. A brief
discussion of these theories follows.
The relational theory provided the grounding for representing data as relations
and specializing these relations as facts and dimensions in the multidimensional data
model for analytic processing (Gosain & Singh, 2015). The multidimensional data model
fact relation types were the numerical attributes and dimension relations were categorical
attributes or derivations thereof which lacked formalized analytic space. With large and

11
complex business scenarios, classical multidimensional designs lost flexibility due to
high dimensionality and complex interdependencies (Al-Aqrabi, Liu, Hill, &
Antonopoulos, 2015).
Dimension theory addresses complex attribution and interdependencies through
the synthesis of the invariant properties required to specify the metric or vector space
expressed by available data (Rasetti & Merelli, 2016). The theory guided quantitative
expression of the dimensionality of the abstract space (Shen, Davis, Lin, & Nachtsheim,
2013). Its application resulted in the projection of classical multidimensional space into a
metric space for analytical processing. The techniques depended on the assumptions of
the nature of the space under consideration as follows. Programmatic methods (for
example, linear, stochastic, integer programming; time series) mapped well-defined
input-output spaces. Statistical (for example, analysis of variances, regression) and
probability (for example, bayesian, frequency) methods defined linear smooth metric
spaces. Numerical methods (for example, neural networks, decision trees, evolutionary
algorithms) defined nonlinear smooth metric spaces. Finally, algorithmic heuristics (for
example, data mining, deep learning, artificial intelligence algorithms) applied to
unknown metric spaces. However, the specification of the metric space required standard
measurements, which was lacking in management (Diamantini, Potena, & Storti, 2013).
Therefore, it was critical to use the available data to formulate the ontology to enhance
the representation and interpretation of expressions of underlying subjects of interest, as
proposed by information theory (Schutz, Neumayr, & Schrefl, 2013).

12
Information theory supports the recoding of available data to improve the
representation of a subject (Budhathoki & Vreeken, 2017). This application of
information theory abstracts available data into specific elements for the analytic
requirements. The application of information theory to data analysis created a number of
methods, including classical data analysis, semantic data analysis, symbolic data analysis,
functional data analysis, topological data analysis, projection pursuit analysis, symbolic
dynamics, complexity analysis to name a few. These methods contributed to data
abstraction as follows.
Classical data analysis described the standard data table which contains raw
information while semantic data analysis re-described the data using atomic and
molecular predicate logic in specific and intended decision-support problem-solving
scenarios (Kaytoue, Kuznetsov, Napoli, & Polaillon, 2011). Functional data analysis
represented information as mathematical and logical functions of underlying elements.
Symbolic dynamics captured multilevel, multiphase information for complex dynamic
analysis and decision-support problem-solving, with a well-developed construct of
symbolic extension which organized each level or phase of a subject into differentiated
zero-dimensional arrays. (Downarowicz, Travisany, Montecino, & Maass, 2014). In
complex analysis, analytic extensions are used to generalize the solution for infinitely
differentiable functions and variables without setting the thresholds beyond which
variables had no business analytic or decision significance and lost management

13
problem-solving value. The theories of applied management and decision science
established the significant threshold of analytic and decision value for management.
The integration of these analytic formulation constraints imposed by theories of
applied management and decision science transformed available data into the ontology
for management analytics and problem-solving. Rasch theory adds to this through the
construction of the measurements (or mereology and metrology) for management tasks
using latent variables (Bond & Fox, 2013; Sofroniou, 2011). Shafer-Dempster theory
generalized the Bayesian belief by integrating uncertainty reasoning into evidence
derived from available data (Beynon, 2011). Analytical hierarchical process theory
proposed steps for aligning the order of the contributing factors and influences exerted by
ontological and epistemological elements (Deng, 2017). The Blackwell theorem
expanded the application of information filters to isolate signals that were most critical to
decision making (Roy & Rao, 2017)
The organizational theory proposed that the factors and influences exerted by the
business elements occurred in the transactions it conducted. The opportunity to control
the behavior of organizations was in administering their transactions efficiently and
effectively (Powell & DiMaggio, 2012). Organizational theories evolved through task
specialization (or division of labor), behavioral, contingency, information processing, and
computational organization propositions. Each of these propositions established the
decision as the most critical cognitive activity of the organization. Therefore, the decision
theory was a framework for problem identification, specification, and resolution. The role

14
of data processing was central to decision theory formulations, which determined the
prevailing operational decision theory as rational, cognitive, behavioral, naturalistic,
garbage can, computational, or combinations thereof (Cegielski, Allison Jones-Farmer,
Wu, & Hazen, 2012; Pourshahid, Richards, & Amyot, 2011).
Nature of the Study
In this study, I examined the data model of a typical data analytics project in a big
data environment. I used design-based research (DBR) because of the focus on the design
of artifacts to support the research (Chakrabarti & Blessing, 2014). The focus was on the
design of data model for a typical data analytics project in a big data environment for
management problem-solving. The DBR approach had gained popularity in design
science disciplines like Information systems, Computer sciences, Engineering,
Cybernetics, Artificial intelligence, and others (Cronholm & Göbel, 2015). The research
approach focused on the scheme of the items within a subject under study to highlight
relationships and the impact of changes in the scheme on the overall expression of the
subject (Chakrabarti & Blessing, 2014). With DBR methodology, I was able to evaluate
and compare designs of the situation under consideration (Cronholm & Göbel, 2015).
I used a nonexperimental descriptive format. This format supported the discussion
of the methodology used in the progressive transformation of the data into the concepts of
the management problem. I applied ontology learning, data engineering, and analytic
formulation techniques to extend the data model. The ontology learning identified the
concepts and the cognitive map of the business problem domain. Data engineering

15
transformed the concepts to the available data. Analytic formulation fostered the
discovery and quantification of the associations and dependencies embedded in the data.
This approach ensured that representation of analytic insights and solutions retained the
connections to the available data.
To illustrate the data-modeling approach, I used secondary data from a U. S.-
based medical products manufacturer and distributor. This analysis scenario required an
integrated corporate action sequence of six different management areas of responsibility
within the enterprise: customer service, marketing, pricing, product development, sales,
and distribution. The case illustration reflected a typical data analytics project situation in
modern organizations where there were lots of data but no clarity on management
problems or the strategies to resolve them.
Definitions
This section includes definitions of key terms used throughout this study.
Analytic extension: The result of the process of expanding or continuing complex
function(s) or variable(s) into simpler function(s) or variables to derive solutions (Segura,
& Sepulcre, 2015).
Bayesian yield: The degree to which the data model facilitates the generation and
evaluation of alternatives, derived from the conditional entropy of Bayes (Deng et al.,
2014).
Classical data attribute: An attribute defined by the values captured at the lowest
level of granularity possible for item or individual of interest (Diday, 2012).

16
Classical multidimensional data model or data cube: A subject-based
arrangement of measures by categorical attributes to support online analytic processing
(OLAP) operations including slice, dice, roll-up, drill-down, and pivot (Kuznetsov &
Kudryavtsev, 2009).
Classical dimension attributes: A set of categorical attributes organized in a
hierarchy for the partitioning of measures during OLAP operations (Kuznetsov &
Kudryavtsev, 2009).
Classical measure or fact attributes: A set of numerical attributes which are
quantitative expressions of the subject(s) of interest (Kuznetsov & Kudryavtsev, 2009).
Cognitive gain: The degree to which data improved the understanding, reasoning,
and inference within the domain of interest (Curşeu, Jensen, & Chappin, 2013).
Data model extension: an appendage of a data model used to express specific
characteristics of underlying subjects to improve the depth of information representation,
for example, relationship, semantic, temporal, spatial, graphic, provenance, and others
(Smirnov & Kovalchuk, 2014).
Decision yield: The estimate of the likelihood of the use of the data in the
resolution of the decision problem because of the added precision, consistency,
simplicity, cost efficiency, and agility (Fish, 2012; Wu et al., 2012).
Empirical lift: The degree of expression of the critical empirical factors in the
data model, derived from information entropy concept of Claude Shannon (Deng et al.,
2014).

17
Enterprise data model: Rationalized integrated third normal form data model of
application and systems used to capture activities of the enterprise (Metz, 2014).
Enterprise data warehouse: Physical implementation of an enterprise data model
in as a database management system for analytic uses (Metz, 2014).
Intelligence density: The ratio of conceptually recognizable attributes to a total
number of data elements in the model (Bai, White, & Sundaram, 2011).
Symbolic data attribute: An attribute defined by values transformed from classical
data to express the characteristic of an attribute for specific analytic intentions (Diday,
2012).
Symbolic dimension attributes: A set of attributes that form an axis of analysis
used to qualify a subject of interest in specific terms for specific analytic objectives
(Noirhomme‐Fraiture & Brito, 2011).
Symbolic measures or facts attributes: Measures of a domain of interest used to
express numerical characteristics of a domain for specific analytic objectives
(Noirhomme‐Fraiture & Brito, 2011).
Symbolic extension: Specialized encoding of attributes that uniquely represents
the distinct state of existence of a subject of interest (Downarowicz et al., 2014).
Symbolic primitives: Functions automatically generated by data mining
algorithms, for example, symbolic regression, classification or time series, which include
fit functions, formulae, control commands, and so on, used in expressing the

18
mathematical relationship between attributes (Zelinka, Davendra, Senkerik, Kasek, &
Oplatkova, 2011).
Assumptions
Assumptions are conditions that a researcher holds as true with no demonstrable
proof. The first assumption in this study was that the available data for the data analytics
project in the big data environment were comprehensive and reflected the real world of
the enterprise and its management decision problems. The complexity of the enterprise
reflected its management problems, such that data model would offer the analysts and
decision makers the ability to establish the importance of operational concepts within the
management domain. This use of data-modeling preserved the lineage between the raw
data input and enhanced data generated for problem-solving (Caron, 2013).
The second assumption was that the abstraction of data preserved the validity of
the derived insights. The application of analytic formulation techniques to transform
attributes emphasized associations and influences that were specific to the analysis
situation under consideration. For example, analytic transformations such as class
assignments, use of nth order statistical moments, frequency estimates, probability
distribution functions, the coefficient of determination, correlation coefficient, and so on,
expressed association between the indicator and response attributes under consideration.
For example, joint probability estimates applied to situations where independence was
verifiable. Conditional probabilities were the preferred method of quantifying association
when independence was not verifiable.

19
The third assumption was that it was possible to extract insight from available
data. This perspective was different from contemporary research studies, in which the
data were from a controlled data generation process, an experiment. In this study, the
focus was on the data model of the available data for data analytics project. The data
combined information generated in the day-to-day operations of business integrated with
information captured by other sources external to the organization. In this scenario, the
data analyst had no control of the data generation process and was unable to manipulate
the situation directly. Data analysis and modeling required inferring influences of
attributes on one another to determine their consequences on management decisions and
business programs.
Scope and Delimitations
This study focused on the enhancements to the data model of the available data
for data analytics project in a big data environment. I did not construct a separate OLAP
multidimensional model or create an alternative analytical model building outside the
context of the data model. The former was the case with OLAP application system, while
the latter was the case with statistical and mathematical programming, system dynamics,
decision analytic processing, data mining, deep learning techniques, and algorithmic
heuristics applications and systems. This focus on the data model of the available data for
data analytics project in a big data environment was adopted because it offered the most
elegant solution to analytics in management compared to the alternative approach of
contrived subject-oriented OLAP models or constrained analytic algorithms. The OLAP

20
data model limited associations between the subject areas of the enterprise. Analytic
algorithms further limited data participation as required to control dimensionality of the
input data for computational and methodological purposes.
This data model research defined data structures that advanced data-driven
problem-solving in management. The tasks included decision discovery, scenario
generation, prediction, inference, evaluation, and choice tasks. The approach focused on
the abstraction of data elements from their raw form into structures, referred to as
analytic extensions, and their application to the creation of solutions to support these
tasks. This approach was different from the classical research approach in which
empirical study drove data generation and analysis. Instead, this work aligned the
objectives of the data model to structural, formal, and resolution expectations of the area
of interest. Through the data model, established relationships between the data objects
and analytic methods fulfilled the requirements of composing evidence and determining
effects and influences on entities.
I did not provide the detailed treatment of any of the analytical techniques used,
or their mathematical proofs because all the techniques were mainstream and did not
require justification as part of this study. I focused on the applied aspects of these
concepts and constructs, and their integration into the data model for management
analysts and decision makers.

21
Limitations
I used secondary data to illustrate the enhancements of the data model of the
available big data for analytics and decision-support in management. The source of data
for the study was proprietary, so the data was de-identified as required by the data owners
to protect the sources. The validation of the results, presented for the study, may not
account for all the situations of anomalies in the data or with the analytic formulation
techniques applied.
The interviews of business analysts and executives conducted established the
conceptual scope and the prevailing hypothesis of the analytic problem. The evaluation of
the resulting data model depended on management acceptance and actionability criteria
established by the business analysts and executives through the interviews. I also used
empirical measures of business and analytic significance, for example, information gain,
Bayesian yield, intelligence density, and other similar measures. This business result
orientation was different from traditional research where the statistical evaluation was
preferred.
I drew from my experiences as a management analyst and researcher for Fortune
10, 50 and 500 companies and government agencies in the United States, seeking
assistance with measurement, estimation, inference, and forecasting solutions to address
transactional, operational, or strategic problems. In this role, I needed to advance
capabilities in existing business intelligence and decision support systems to integrate
inferential capabilities (programmatic, diagnostic, predictive, intelligence) into their

22
decision-support environment and analytic processing workflow. Expectations included
the creation of a measurement and metrics framework for shared performance
management across diverse management domains. I designed and implemented
application systems to support management effectiveness and efficiency. The driving
force was to generate value from data assets and monetize them through the creation of
value-added information solutions and services, for both internal and external use. Since
these situations were specific subsets of data, analytics, and decision-support scenarios
faced in business management, the perspectives driving this work were from these
business settings. Therefore, the application of the study outside the business
management context would be limited. Extension of the data model may not be necessary
for data gathered through a controlled experiment or in situations where measurements of
underlying elements are well established as in science and engineering contexts.
Significance of the Study
Significance to Theory
In this study, I addressed gaps in data-modeling of extensive secondary data for
analytics and decision-support in management research. I advanced the use of ontology
learning, data engineering, and analytic formulation techniques to transform available
data from the classical data format in the form of scalar data types, through matrices and
arrays, to functionals with specific ontological commitments. This approach closed the
conceptual gap between analytical insights and cognitive concepts of domains of interest

23
which, Beroggi (2010) argued, lagged behind advances in information and computer
technology.
This study systematized an adaptive and progressive stepwise process of
designing data models that connect meanings and signals embedded in the data. This
framework generated derived data elements in specific analytic contexts. Many
conventional approaches to decision modeling such as the analytical hierarchical process
(AHP) of Saaty, generalized utility models, generalized risk models, and others which
required heuristic approximations by experts. A meticulous transformation of existing
data through ontology learning, data engineering and analytic formulation of the metric
space of the subject of interest replaced the rates and weights approach of decision
analysis methodologies.
The adaptive approach relaxed the controls and assumptions of traditional data-
modeling and allowed relationships captured within data to drive the formulation of
empirically rigorous, pragmatic data models that incorporated hierarchies not purely
based on cardinality and linear functional dependencies. This integrative approach to data
analytics in management maximized utilization of information and knowledge assets for
decision processing. It aligned the processing of available data to the ontology of the
subject under consideration specified by business analysts and executives.
Significance to Practice
The significance of this study was in the construction of a data model for data
analytics projects in a big data environment for management problem-solving. The focus

24
was the use of the data model to deconstruct complexity within available data and the
management problem-solving situation. The goal of this data model research was to make
transparent the discovery, evaluation, and resolution of management opportunities within
the domain.
The deconstruction of complexity was crucial to the creation of a useful data
model. Complexity is the state of lack of transparency between inputs (causes) and
outputs (effects) of nondeterministic systems. Complexity manifests as the interaction of
the inputs, the input output process, and the outputs themselves. Analytic deconstruction
of complexity is critical to decision processing, through programmatic (if known inputs,
outputs), diagnostic (if unknown input, known output), predictive (if known input,
unknown output), and intelligent (if unknown input, unknown output) means. The
construction of data models that accounted for the complexity of underlying data
elements and their interactions improved analytics and decision-support in management.
Making analysis more concrete and quantitative furthered Busemeyer and Townsend’s
(1993) decision field theory proposal. The decision field theory reflected some universal
propositions for resolution of choice problems through systematic perceptions of the
environment based on the information. It also included the utility of numeracy in the
decision makers’ coping to determine the need for decision-support by information
systems and technology (Peters, 2012).
The final area of professional application of this study was in the creation of
management support applications. The typical input to decision processes was a set of

25
rates and weights compiled from experts and surveys. Decision analytic techniques such
as hierarchical analytic processing, network analytic processing, info-gap decision
processing, and many others, required in-depth knowledge of the domain of interest and
the ability to reduce the knowledge into weights and rates of the decision problem. The
weights and rates formulated analytically from the available data were more accurate than
those defined by experts (Dezert & Tchamova, 2014).
Significance to Social Change
Business enterprises are essential instruments of societal prosperity because they
provide employment, support the needs of the population by providing goods and
services, and contribute to social efforts within many communities through donations and
volunteerism. The influence of business enterprises have increased due to globalization,
the information age, the convergence of business and politics (for example, the U.S.
Supreme Court Citizens United decision), and the adoption of free-market economics
around the world. These developments have added complexity to the working
environment for executives and managers of enterprises. The modern business enterprise
is not just expected to be solvent; it is also expected to contribute to the social aspects of
the communities in which it is doing business by improving the quality of life of
customers and community. The evidence needed to guide decisions and actions to
maximize benefits of the business enterprise to all its stakeholders and the public at large
was made possible by extending analytics to account for these considerations (Burns &
Jindra, 2013). Broadening the characterization of the influences of the enterprise

26
highlighted opportunities for management engagement in social issues. In many cases,
the issues that impact the marketplace also influenced the performance of the
organization. An example of social change that could be realized through the case
illustration includes social programs to improve daily activities of patients and residents
of health care institutions served by the company, especially incentives for sales
representatives to volunteer their time at facilities they covered.
Summary and Transition
This chapter introduced the study of a model of the available data for data
analytics project in a big data environment. The goal of the study was to search for data
model extensions to address the issues of representation of insights about problems and
solutions. This approach required organizing all available data into structures for that
mapped the available data to the cognitive conceptualization of the management problem
situation. This study is expected to contribute to reducing the high degree of failure in
management analytics and decision-support, which accounted for an estimated $2.7
trillion in wasteful spending in 2016. The link between available data and solutions of
management decision problems established a favorable relationship between investments
in data asset development, quality of decision-making, and the business value achieved.
In Chapter 2, I review the literature on online analytic processing
(multidimensional) data-modeling, the use of dimensional analytic techniques to achieve
functional form expression of available data, issues of big data analytic scenarios, and
challenges with computational and algorithmic analytic processing. In Chapter 3, I

27
describe the research methodology, including a justification for a DBR methodology, the
use of the descriptive, nonexperimental, quantitative format, the choice of the secondary
data, and the data abstraction methodology that integrated ontology learning, data
engineering, and analytic formulation techniques. The results of the study are in
presented in Chapter 4, and the discussion of the results are presented in Chapter 5.

28
Chapter 2: Literature Review
Introduction
The purpose of this descriptive nonexperimental quantitative, DBR study was to
examine the data model in a typical data analytics project scenario to address difficulties
encountered with the acceptance of big data projects outputs. The literature on data
models with data analytics revealed a very strong favorable association (Zohuri &
Moghaddam, 2017). The conceptual data model was the primary tool for communicating
the structure, content, and context of available data in organizations, yet big data
analytics projects favored an approach that bypassed this critical artifact. The result was
that business analysts and executives found the outputs from data analytics projects
inadequate for management analytics and decision-support (Bendre & Thool, 2016).
In this chapter, I describe the literature search strategy on big data analytics
process. I preview the state of analytic data-modeling, the role of functional form
expression in data models, the problem of representing large scenarios for analytic
processing, and the challenges with computational/algorithmic solutions in data analytics.
I conclude with a discussion of the issue of the dissociation of the data from resulting
analytic solutions which was my motivation for this data model approach to the
challenges of big data project outputs (MacLeod & Nersessian, 2018).
Literature Search Strategy
The primary source of material for the study was Academic Search Complete, an
EBSCO academic research database, available through Walden University. Searches

29
included Google Scholar, Elvsier, Association for Computing Machinery (ACM), and the
Institute of Electrical and Electronic Engineers (IEEE) digital databases.
The keywords used in the search included empirical model building, analytic
model building, multidimensional modeling, online analytic processing), exploratory
model building, exploratory system dynamics modeling, statistical database, business
intelligence, knowledge discovery from databases, data mining, data modeling, decision
models, domain models, big data modeling, business intelligence, expert systems,
symbolic data analysis, dimensional analysis, symbolic dynamics, artificial intelligence,
reasoning systems, artificial intelligence modeling, deep learning modeling, and symbolic
computation. The search was conducted from the year of study until about 600 articles
were retrieved and reviewed. Changes in popularity of these keywords over time
complicated the task of limiting materials included in the study to publications in the last
five years, as required by Walden dissertation guidelines. Some of the most relevant
materials cited publication dates as early as 1990, which indicates that the problem of
making sense of data emerged with Information / Systems era of this decade. Despite the
age of these materials, the concepts expressed aligned with contemporary usage and
understanding.
Of the roughly 600 articles I retrieved and reviewed. I cited 259 articles in this
document. Of these, 87% were peer-reviewed and published between 2013 and 2018
based on Walden library databases designations. Ten percent of these citations were
either books or conference materials.

30
Theoretical Foundation
This study integrated theories in information science and applied management and
decision sciences to extend the data model for management analytics and decision
problem representation. Relevant theories in information science included relational,
dimension, and information theories. The applied management and decision sciences
theories were organization and decision theories. A brief discussion of these theories
follows.
The relational theory provided the grounding for representing data as relations of
attributes such that every record within them was an instance of occurrence or members
of the relation. The relational theory also provided the constructs for specializing these
relations as fact relations and dimension relations in the multidimensional data model for
analytic processing (Gosain & Singh, 2015). The multidimensional data model facts
relations were the numerical attributes and dimension relations were categorical attributes
or derivations thereof, without any attempt to formalize the space defined. With large and
complex business scenarios, the classical multidimensional designs resulted in problems
of large dimension sizes and complex interdependencies (Al-Aqrabi, Liu, Hill, &
Antonopoulos, 2015).
Dimension theory addresses complex attribution and interdependencies through
the synthesis of the invariant properties required to specify the metric or vector space
expressed by available data. The theory guided quantitative expression of the
dimensionality of the abstract space (Shen, Davis, Lin, & Nachtsheim, 2013). Its

31
application resulted in the projection of classical multidimensional space into a metric
space for analytical processing. The techniques used depending on the assumptions of the
nature of the space under consideration as follows. Programmatic methods (for example,
linear, stochastic, integer programming; time series) projected well-defined input-output
spaces. Statistical (for example, analysis of variances, regression) and probability (for
example, Bayesian, Frequency) methods projected linear smooth metric spaces.
Numerical methods (for example, neural networks, decision trees, evolutionary
algorithms, etc.) applied to nonlinear smooth metric spaces. While algorithmic heuristics
(for example, data mining, deep learning, artificial intelligence algorithms) came in
useful in projecting unknown metric spaces. However, the specification of the metric
space required standard measurements, which was lacking in the field of management
(Diamantini, Potena, & Storti, 2013). Therefore, it was critical to use the available data
and subsequent derivations to formulate the ontology for the representation and
interpretation of expressions of underlying subjects of interest, using Information theory
proposals (Schutz, Neumayr, & Schrefl, 2013).
Information theory supported the re-coding of available data to improve the
representation of a subject. This application of information theory abstracted available
data into elements specific for analytic requirements. Many methods of data analysis
resulted from the application of information theory. Examples were classical data
analysis, semantic data analysis, symbolic data analysis, functional data analysis,
topological data analysis, projection pursuit analysis, symbolic dynamics, complexity

32
analysis to name a few. Essentially, these were methods of data abstraction that can be
integrated into the data analytics framework to drive extensions of the data model for
insight generation discussed below.
Classical data analysis described the data available in the classical data table,
while semantic data analysis extended the data analysis to the underlying atomic and
molecular predicate logic (Nalepa, 2017). Symbolic data analysis further abstracted
classical or semantic data for intended analysis and decision-support problem-solving
(Kaytoue, Kuznetsov, Napoli, & Polaillon, 2011). Functional data analysis provided the
framework for the representation of information as mathematical and logical functions of
underlying elements. Symbolic dynamics provided the framework for representing multi-
level, multi-phase information for complex dynamic analysis and decision-support
problem-solving (Downarowicz, Travisany, Montecino, & Maass, 2014). Furthermore,
SD has a well-developed construct of symbolic extension which organizes the data at
each level or phase of a subject into a zero-dimensioned array for differentiation. In
complex analysis, analytic extensions were used to generalize the solution for infinitely
differentiable functions and variables. However, the boundaries of analytic or decision
significance and management problem-solving value were not considerations of these
methods. The theories of applied management and decision science established the
significance and value threshold of analytic outputs in management.
The translation of available data into an ontology for managerial tasks required
the application of theories of applied management and decision science. Applied theories

33
like Rasch, Shafer-Dempster, analytical hierarchical process theories advanced the
integration of analysis into management and decisions sciences. Rasch theory was useful
in the construction of the measurements (or mereology and metrology) within the
management domain using latent variables (Bond & Fox, 2013; Sofroniou, 2011). Shafer-
Dempster theory generalized the Bayesian belief by integrating uncertainty reasoning into
evidence derived from available data (Beynon, 2011). Analytical hierarchical process
theory proposed steps for aligning the order of the contributing factors and influences
exerted by ontological elements (Deng, 2017).
The organizational theory proposed that the factors and influences, exerted by the
business elements, occurred in the transactions it conducted. The opportunity to control
the behavior of organizations lay in administering these transactions efficiently and
effectively (Powell & DiMaggio, 2012). For this reason, the organizational theories
evolved through task specialization (or division of labor), behavioral, contingency,
information processing, and computational organization propositions. Each of these
propositions held as its central theme that the decision was the most critical cognitive
activity of the organization. Decision theory provided the framework for problem
identification, specification, and resolution. This placed analytic processing at the center
of decision theory proposition. The degree of analytic processing was responsible for the
prevailing operational decision theory as rational, cognitive, behavioral, naturalistic,
garbage can, computational, or combinations thereof (Cegielski, Allison Jones-Farmer,
Wu, & Hazen, 2012; Pourshahid, Richards, & Amyot, 2011).

34
The integration of these theories converged on the utility of analytic processing in
the disambiguation of the business environment for analysts and executives. The essential
contribution of analytic processing compared to other analytic techniques (i.e., reporting,
modeling, algorithms, and computation) was complete automation of the data analytics
process from input to the generation of actionable insights and recommendations for all
levels of the enterprise. The requirement to integrate data and technology assets, i.e.,
database management systems, and computer application programs into seamless
processing were critical. Equally important was ensuring the outputs of the analytic
processing exercise was transparent in management decision making. The transparency
of analytic processing remained the primary challenge of applied management and
decision science practitioners and researchers, hence the primary motivation for this
study.
Literature Review
As noted above, analytical techniques provided frameworks for systematizing
analytic processing (Kwakkel at al., 2010). They helped determine the nature of
associations between attributes in the data to answer business and research questions
about underlying subjects (Chen, Chiang, & Storey, 2012). The structure, content,
context, unit of analysis and granularity of the data dictated their breadth, depth, and
application to management analytics and decision-support. In recent years, users have
challenged the utility of analytical techniques in addressing complex business questions
facing management (Gomes, 2014). The response to this challenge was online analytic

35
processing (OLAP). OLAP has two aspects: the multidimensional data model and
algebraic operations. The OLAP data model provided the framework for organizing data
the multidimensional structure. The multidimensional structure is an n-relational structure
or data cube. The OLAP algebraic operations specified exploration and navigation
procedures for the data cube (for example, slice, dice, drill, pivot). Currently, OLAP
remains state of the art in the analytic processing despite challenges of limited analytic
capabilities. To gain perspective on solutions to the challenges and issues with OLAP, I
review the literature on the synthesis of a logical representation of complex subjects and
large business analytic scenarios that advances high dimensional analytic processing. I
provide a discussion of multilevel ensemble formulation through
algorithmic/computational analytic processing. I highlight the absence of data models to
support these higher forms of analytic processing, which is the gap I am seeking to
address with this study.
Online Analytic Processing
Edgar F. Codd was the central figure in data-modeling literature for proposing
both relational and online analytic processing (OLAP) data-modeling techniques (Wade
& Chamberlin, 2012). Relational data-modeling drove advances in database technology,
including the principle of data definition and manipulation using declarative language
such as the structured query language (SQL). The framework of the relational data model
was the theory, algebra, and calculus of relations which were stable and closed. At the
core was the representation of data items as related sets, to which rules of normalization

36
were applied to ensure efficiency and accuracy of data capture and storage. The OLAP
proposal generalized the relational data-modeling approach from few to large relational
structures. The OLAP model was responsible for the rapid adoption of data-driven DSS
of the last decade, including a change in the role of the data warehouse from a passive
repository for static enterprise reporting to an active platform for dynamic real-time
analytics and decision-support.
At the core of the OLAP proposal was the multidimensional data-modeling
technique. This data-modeling technique organized numerical data as facts (or measures)
and categorical data as dimensions to form a multidimensional array (Gosain & Singh,
2015). This scheme enabled sophisticated navigation of large data sets and high-
performance data retrieval operations.
The original multidimensional data-modeling proposal by Codd was rather strict
about the designation of data attributes as measures or dimensions, and about the
relationship between fact and dimension relations. Intense research into multidimensional
data-modeling led to revisions. Gosain & Singh (2015) presented the most
comprehensive survey of such revisions, which identified 23 characteristics of the 16
most complete multidimensional models. Table 1 shows the characteristics of the
revisions.

37
Table 1
Characteristics of OLAP Multidimensional Designs
Aspect
Characteristic
Rationale
General
Atomic and non-atomic
measures
Capture of measures at whatever level of granularity available
Derived measure
Deriving new measures from existing ones, as needed
Derived dimension attributes
Deriving new dimension attributes, as needed
Flexible additivity
Support for full additivity, semi-additivity, and non-additivity
Non-hierarchical dimension
A single level dimension attribute
Cross dimension attributes
Dimension attributes that reference multiple dimensions
Degenerate facts
Measures that may not be accurate all the time
Degenerate dimensions
Dimension attribute with no content except its primary key
Sharing dimensions
Dimension shared by multiple fact relations
Sharing dimension levels
Dimension level sharing by multiple fact relations
Parallel hierarchies
Creation of more than one hierarchy in a dimension
Different roles of dimensions
Dimensions that serve different roles depending on the context
Fact-dimension
relationship
Incompleteness association
Allowing the occurrence of missing associations
Non-strictness association
Dynamic associations
Fact-dimension
relationship
Incompleteness association
Allowing the occurrence of missing associations
Non-strictness association
Dynamic associations
Inter-dimension
relationship
Generalization
Generalization/ Specialization relationship between levels of
dimension
Association
Functional dependencies between dimension attributes
Fact constellation
More than one fact in a dimensional model
Implementation
Technique
Modeling technique include ad-hoc, E-R, UML
Mathematical/analytical
constructs
Inclusion of mathematical/analytic operations
Transformation of hierarchy
Mapping for transforming hierarchies
Guidelines
Availability of an implementation guideline

38
According to Gosain & Singh (2015), the state-of-the-art analytic data-modeling
retained the basic n-dimensional schema of fact relations and corresponding dimension
relations. Representation of fact and dimension as relations allowed fact elements with
the same dimensional architecture to connect to dimension elements at the same group
level. This representation created the classical multidimensional structure commonly
referred to as snowflake schema design, providing significant flexibility over the earlier
proposal, the star schema design (Sharma & Sood, 2013).
Each dimension of the multidimensional schema represents sets of categorical
data elements with a partial order from top to bottom, such that one categorical data
element is greater than another if the members of the former are subsumed by the latter.
The topmost element of the dimension corresponds to the largest possible dimension
element size because it logically subsumes all the other elements in the dimension. The
partial order of the categories forms the hierarchy of the dimension. The hierarchy of the
dimensions was the navigational paths or graphs. Essential characteristics of these paths
or graphs are: (a) that they are acyclic paths or graphs which means no re-entry loop and
(b) that their direction reflects the cardinality of the relationship between the sets of
dimension elements based on their occurrence (Pedersen, 2013).
The practice was to apply Codd’s rules of normalization to the structuring of the
dimension elements to create homogeneous dimension levels. This practice allowed
multiple hierarchies for different navigation and aggregation paths on the data. It also

39
allowed specialization of the relationship between dimension levels into six types: (a)
covered relationship in which the lower dimension level subsumes all the elements of the
higher dimension level; (b) onto relationship in which there is a one-to-one
correspondence between the dimension levels, typically modeled implicitly within the
relation defined for the dimension level; (c) non-covering relationship which implies the
dimension level is in a path parallel to a considered dimension level, with skipped levels;
(d) non-onto relationships which are the absence of a parallel relationship at the one-to-
one cardinality; (e) self-into relationship in which there is a self-referential requirement at
the one-to-one level of cardinality creating an implicit hierarchy in the dimension level;
and (f) self-onto relationship, a situation where a self-reference returns an empty set,
which was the condition of a fully normalized dimension design (Pedersen, 2013).
The nature of the dimension is also an essential consideration in modeling. A
dimension can be universal or domain. Universal dimensions include time and location,
which can be modeled on their own or used to qualify other dimensions, as is the case in
the spatiotemporal data model. Domain dimensions are those that have a specific
significance in the subject under consideration; for instance, in the business domain,
examples of dimensions were Store, Product, Customer, and so on. It is also essential to
determine whether the dimension is static or dynamic and, if dynamic, whether it has a
cycle and whether the cycle is or is not stationary (Pedersen, 2013). Managing dynamism
in the design of dimensions creates the concept of slowly changing dimensions, which
have defined types as follows: (a) Type 0 – insert only; (b) Type 1 – update in place; (c)

40
Type 2 – dimension versioning; (d) Type 3 – use of dimension effective and expiry date;
(e) Type 4 – use dimension change or history relation to capture changes; and (f) Type 6
(hybrid of 1, 2, 3) with the current value, old value, start date, end date and current status
flag (Kimball & Ross, 2011; Leonard, Mitchell, Masson, Moss, & Ufford, 2014). The
assumption was that rapidly changing dimensions should not exist, but they did. For
example, the customer was a very popular dimension in the business domain model
which grew with changes in essential characteristics. The characteristics of the customer
were not part of the classical fact-dimension scheme of the multidimensional model. The
model did not explicitly reflect the change in state of the customer related to its activities
and did not establish a connection with related concepts like party, prospect, and so on
(so-called polymorphism).
The modeling of the dimensions was critical as it defined the axis of analysis or
navigation for the user and provided the analysis flow process the user could adapt to
formulate explanations to situations of interest progressively. However, some problems
emerged with this design of dimensions including (a) that the relationship between the
dimensions was primary key-foreign key reference; (b) that the dimensions are
independent of each other; (c) within each dimension the different dimension hierarchies
partition the dimension space equally or carry the same weight in terms of impact; (d) at
each dimension level the effect of the dimension values were equally weighted; and (e)
when there were elements in the dimensions that had a numerical value, they should be
treated as categorical attributes during analytic processing (Caron, 2013).

41
The measure or facts of the multidimensional data model are typically the
numerical attributes in the available data set. Fact or measures are assumed to be the
numerical translation of the results of the interaction of the dimensions at the appropriate
levels of details (Schutz, Neumayr, & Schrefl, 2013). For example, sales facts or
measures such as sale amount, sale quantity, sale price, or sale discounts are a numerical
representation of the interaction of customer and product dimensions within the business
domain.
Different approaches were used to derive the facts or measures. One approach is
the use of the concept of key performance indicators (KPI), which identifies measures
that were significant contributors to the performance of the domain of interest
(Diamantini et al., 2013). Another approach is the concept of the balanced scorecard
(BSC), proposed by Norton and Kaplan, as a measure of organizational growth and
learning that integrates operational and financial perspectives of organizations (Morard,
Stancu, & Jeannette, 2012). KPIs and BSCs were part of visual displays commonly
known as dashboards, which are constructed at different levels of an organization to
provide a point-in-time (cross-sectional) or progression-over-time (longitudinal) view of
performance. Current challenges with the definition of measures, related to the question
of constructing an appropriate measurement model for items and activities that were not
directly measurable. Morard et al. (2012) determined that the measurement model
derived deductively from available data differed from the BSCs and KPIs expressed by
management.

42
In a classical OLAP conceptual data model, there is no assumption of
independence in the facts or measures, so they should not be combined. Also,
contemporary designs advocate annotation of facts or measures such that there is
information on whether they are natural or derived. When they are derived, it is also
necessary to specify what operations (statistical, mathematical, or logical, for instance)
were applied. Because the classical OLAP data model design constrains the
implementation of hierarchies between measures, navigating the facts or measures in the
same way as dimensions were not allowed. The design became an important issue when
data gathered was at multiple levels of granularity and association between facts could
not be derived through the navigation of the dimensions. Contemporary OLAP designs
also assume that the value of the fact or measure is immutable and that the significance of
the value of the fact or measure is stable over time (Diamantini et al., 2013). For this
reason, there is no formal concept of changing facts and measures or adjustments to facts
or measures to ensure that change in the significance of the value is in the classical
multidimensional model.
Another important aspect of a multidimensional model is the relationships
between fact and dimension relations. The contemporary approach advocates relating the
fact to the dimension at the right level of granularity. The nature of this relationship is
essential to the accurate functioning of OLAP operations, especially aggregation
operations. An important reason for this is that aggregation operations navigate lattice
expressed by the intersection of the dimension and fact elements in three different ways:

43
additively (sum), non-additively (average, min, max), and by counts (cardinality). Other
considerations handled in contemporary design include (a) ranges by using value-
equivalent tuples with annotations to specialize OLAP operations on the ranges as slice
operations – time slice or space slice operations (Pedersen, 2013); (b) handling of
uncertainty in the data value and relationships as probability or conditional probability
using the probability operations applied, within and between fact relations and/or within
and between dimension relations (Cuzzocrea, 2011; Moole, 2005); and (c) heuristic
mapping of fuzzy attributes to actual dimensions and measures based on specified rules
(Fasel, 2014).
The process of determining the attributes in an OLAP data model was not
straightforward, mainly because the availability of data from multiple sources was
overwhelming (Romero & Abello, 2011). Data modeling methods took on two main
frameworks: demand-driven based on user requirements or supply-driven based on the
available metadata and data. A hybrid which integrates both frameworks was gaining
popularity (Romero & Abello, 2011).
According to Romero and Abello (2011), the demand-driven approach followed
the classical Information System (IS) engineering process which depended on the end-
users to provide input to inform the data-modeling process, while the supply-driven
approach depended on the available metadata. However, in real-world scenarios, end
users may not be aware of all the potential analysis opportunities and may overlook
critical requirements that could dramatically improve decision-making. Also, metadata

44
may not be comprehensive to allow the data modeler to infer all the attributes required
for analysis of the data elements. Also, available data was the noisy and unsupervised
discovery of features within the data was overwhelming and useless to decision-making,
and sometimes downright misleading. Most recent proposals called for the use of
ontologies to model data for analytics and decision-support (Padillo & Mazon, 2011).
Ontology, in the context of the data model, was the formalized conceptualization
of a subject within the domain of interest through its available data. Ontology was,
therefore, the most differentiated version of the “data about the data” or metadata
(Jareevongpiboon & Janecek, 2013). Contemporary documentation of data was in the
form of the data dictionary, which was limited to the name, description and the syntactic
attributes of the data including data type, uniqueness, nullable, and so forth. Data
glossaries expanded the number of semantic attributes that were captured to include
examples, concepts, constructs, to name a few. Thesaurus and vocabularies extended the
symbolic attributes further to include lateral relationships like types, similarity,
dissimilarity. Taxonomies captured dimensional attributes, including hierarchical
relationships within a set of concepts allowing partial ordering of these concepts.
Ontology brought all these characteristics together to achieve an ultimate
conceptualization of a subject of interest capturing all relevant concepts, constructs,
constraints, controls, and constants (Martinez-Cruz, Blanco, & Vila, 2012).

45
According to Pardillo and Mazon (2011), there were ten shortcomings of the
multidimensional model design, use of ontologies solved. Table 2 summarizes these
shortcomings and related solutions.
Table 2
Ontology proposals for OLAP Data Models
No
Situation
Current state
Rationale
Solution
1
Multidimensional
design
requirements
Limited to
classical
attributes
defined by the
users
Needs for specific
concepts that
provide meaning
to the analytics
and decision-
support situation
• Use of Foundation ontology
with representation and
interpretation mappings
2
Requirement for
data source
reconciliation
Direct or
syntactic
reconciliation
only
Semantic
reconciliation is
more appropriate
• Dimension and measure
discovery through matching and
subsumption,
• Selecting measure and
dimensions for defining facts
and classes,
• Establishing bases for searching
and pruning (grouping rules
etc.),
• Defining aggregation
hierarchies through part-whole
relationships,
• Use of heuristics on structural
aspects, for example, instance
counts,
• Inserting frequencies,
cardinality, etc.

46
(table continues)
No
Situation
Current state
Rationale
Solution
3
Data model
completeness
Syntactic
completeness
Semantic
completeness
• Use of published ontologies
and taxonomies to ensure
representation of
metonymy/homonymy or
hyponymy/hyponymy
relationship and other issues of
polysemy
4
Data types of
measures
Measures of
analysis
declared as
numeric
without any
sense of unit
or scale
Measures have
units and scales
normalized
• Use of levels of measurement:
nominal, ordinal, interval and
ratio, which improved the
implementation of aggregation
semantics for the different
measurement levels, for
example, mode and chi-squared
aggregation for nominal
measures, mean, standard
deviation, correlation, etc.
aggregation for interval data
5
Summarizability
Additivity
constraint
Semantic
summarizability
• Classification of measures:
additive, semi-additive and non-
additive;
• Classification of summary
attributes as flow (rate), stock
(level) or value per unit;
• Classification of non-additive
measures into ratios,
percentages, measures of
intensity, average, minimum,
maximum, etc.
6
Conformed
dimensions
Hub-and-
Spoke vs. Bus
approach to
design
Design consistency
that allows
complete
specification of
subject of interest
• Use of annotation and links that
map results to the input data
used

47
(table continues)
No
Situation
Current state
Rationale
Solution
7
Traceability
Loss of
traceability
between the
source and
model
semantics
Semantically
traceable data
models
• Integration of
transformation logic into
the data model
8
Reasoning
support
OLAP
algebra and
calculus
Reasoning
requires logic for
proof
• Integrate logical
propositions provided by
ontology into the data
model
•
9
Visualization
Issues of
visualization
of high
dimensional
hierarchical
data
Layered
visualization
with appropriate
visual gallery
• Semantic annotation of
measure and dimensions
for visualization
10
Security
Ad-hoc
• Inferred from ontology
about credentials,
permissions, and rights
Table 2 refined the approach to the determination of the content of the
multidimensional data model. The ontology approach emphasized the explicit
specification of knowledge available about the domain, either from internal sources or
public sources. The approach required inference of any domain-specific attribution not
available in the data. Hoang, Jung, and Tran (2014) advocated the creation of this
enterprise ontology, independent of the information systems development projects to
ensure that there was a systematic approach to qualification and quantification of the
elements relevant to knowledge of the domain of interest.

48
While ontologies captured comprehensive conceptualization of the domain of
interest, it provided no guidance on their essential and relative influence on the events
and activities of the domain of interest. It also did not provide a framework to reduce a
complex domain or concept into its components for examination. The dimensional
analysis technique provided such a framework by enabling functional form expression as
discussed below.
Functional Form Expression
The primary reason multidimensional models was so useful in analytics and
decision-support was their structural alignment to dimensional analysis and reasoning
than contemporary relational models(Savinov, 2013). Dimensional analysis generalized
linear algebra, reducing complex problems into simple forms for solutions (Shen et al.,
2013). The principal use of dimensional analysis was to deduce from data the final form
of quantities of dependent and independent attributes of the subject of interest devoid of
scale or units, according to Buckingham’s π-theorem. This dependence on normalized
standard quantities for expressing relationships preserved the concept of similarity and
prevented coincidence of equivalence and differences caused by measurement units and
scales. Using the similarity principle, it was possible to formalize the problem
mathematically and simplify the solution by reducing the space of the data matrix to
achieve a better functional form for underlying relationships.
The dimensional analysis required the manipulation of three classical constructs:
properties, quantities, and units to derive attributes whose units canceled out when

49
multiplied or divided, such that their absolute significance was maintained despite the
change in numerical magnitude (Bridgman’s principle) (Shen et al., 2013). The formula
that satisfied this principle of absolute significance of relative magnitude was the power
law form expression:
Q = αAaBbCc… (1)
where
• Q is the derived attribute
• A, B, C. are numerical values of base quantities
• a, b, c are real numbers whose values distinguish one type of base quantity
from another
• α invariant scale that guarantees similarity of Q and base quantities
(similarity coefficient)
These derived power form attributes were the dimensions. A dimension of the first kind
was from the base units of the numerical value of base quantities, and dimensions of a
subsequent kind from dimensions of the first kind, and so on. In this context, the
dimensions may not represent a tangible characteristic of the subject of interest. Each
base quantity, by definition, was its dimension. The dimension was, therefore, a
formulaic expression of how the value of the quantities transformed when the size of the
base units changed. For example, the dimension of a base quantity, Q,
[Q]=W (2)
Where

50
• [Q] represents a dimension of property Q
• W represents the concept of the measurement unit, in this case, the
concept of width
If the width unit size, W, increases by a factor of f, the numerical value of Q will increase
by a factor of f-l . Also, the dimension of a dimension conferred the same information
about the general form. A dimension, Q, defined by:
Q=α𝐿1
𝑙1𝐿2
𝑙2…𝑀1
𝑚1𝑀2
𝑚2…𝑡1
𝜏1𝑡2
𝜏2… (3)
Where
• Li, numerical values of certain lengths
• Mi, numerical value of mass
• ti, values of certain times
• α, exponents of real numbers
If the length unit changes by a factor, l, mass unit changes by m and time unit changes by
t, the value of Q changes to:
Q1=n-1Q (4)
where
n=(𝑛𝐿)∑𝑙𝑖(𝑛𝑚)∑𝑚𝑖(𝑛𝑡)∑𝑡𝑖
Q transformed like the numerical value of the base quantities with a unit whose size was
proportional to the sizes of the underlying units. When the numerical value did not
change with its base unit value, then the dimension was considered stable or
dimensionless.

51
In analytics and decision-support, one seeks functional relationships between
numerical values of quantities that describe, estimate, infer, or forecast the situation of
interest, devoid of coincidence of choice of units - dimension homogeneity. Dimensional
homogeneity implied both sides of the quantitative expression should have the same
dimension, and dimensionless, the quantities and the terms must be of the same
dimension or dimensionless, and any arguments of any exponential, logarithm,
trigonometric or other special functions that appear in the equation must be
dimensionless. Dimensional analysis demanded formulation of equations to capture the
functional relationships between sets of independent and dependent quantities expressed
in equation form as follows.
Q0 = f(Q1,Q2,…, Qn) (5)
Where
Q0 is the dependent quantity
Q1, Q2,…, Qn are independent quantities
f is the conversion factor that confers similarity to the expression
The relationships expressed in (5) above was the result of laws or policies
governing the occurrence of the quantities of the property of the subject of interest. This
relationship should hold despite the sizes of the base units of the quantities included, per
Bridgman’s principle. The system of units that defined the quantities determined its
dimension along with exponents that were dimensionless numbers following from this
definition. Assuming that

52
1. Q1, Q2,…, Qk were dimensionally independent subset of quantities, where none
of the members had a dimension that expressed the dimensions of the
remaining members
2. Qk+1, Qk+2,…Qn were the rest of remaining independent attributes expressed
regarding the dimensions of the subset Q1, Q2,…, Qk
3. Q0 remained the product of powers of Q1, Q2,…, Qk and Qk+1, Qk+2,…Qn to
achieve dimensionally homogeneous expression
4. k < n
Then
πi= 𝑄𝑘+𝑖
𝑄1
𝑁(𝑘+𝑖)1𝑄2
𝑁(𝑘+𝑖)2…𝑄𝑘
𝑁(𝑘+𝑖)𝑘 (6)
where
i=1, 2, …, n-k were dimensionless form of the dependent variable
Q0
and,
π0= 𝑄0
𝑄1
𝑁01𝑄2
𝑁02…𝑄𝑘
𝑁0𝑘 (7)
where
1 .. k was the dimensionally independent form of the dependent
variable, Q0
Then,

53
π0 = f(Q1,Q2,…, Qk; π1, π2, …, πn-k) (8)
According to Bridgman’s principle and following the Buckingham’s π-theorem, the
reduced form of the expression of the expression should be:
π0 = f(π1, π2, …, πn-k) (9)
This final form satisfied, the Buckingham’s π theorem which stated that when a complete
relationship between dimensional quantities was in the dimensionless form, the number
of independent quantities that appear reduced from the original n to n-k where k was the
maximum number of the original n that are dimensionally independent. This theorem
facilitated the discovery of the dimensions of dependent attributes, but not the form of the
dimension. The form had to be discovered deductively from both exploration of the
properties and the values of the data set, guided by existing knowledge of the subject of
interest, available data, theories, propositions, and experimentation (Shen et al., 2013).
Dimensional transformation of data in a pre-determined fashion ensured that the
underlying relationships remained intact and enhanced as needed for the analysis under
consideration (Shen et al., 2013). This analytic process eliminated coincidences of
similarity that may occur. Dimensional independence conferred statistical and
mathematical independence which made the analysis much more valuable and
informative. The reduction in the number of attributes eliminated redundancies
encountered with large data sets, (for example, redundant non-distinguishing dimension
attributes and records; identification of dimensions with similar effects of interest). Also,

54
dimensional transformation demanded numerical expression for dimensions, which is
different from the concept of dimension in a classical multidimensional model.
The requirement of numerical expression of attributes can be problematic with
non-numeric properties or attributes. Multivariate algebra, the grounding for multivariate
statistics, solved this problem through the coding of attributes, using functions. Examples
were enumeration, dummy coding (or identity coding), threshold-based coding, target-
based coding, the weight of evidence coding, cluster coding, smoothed weight of
evidence, etc. (Wickens, 2014, pp. 5-15). Other methods of categorical data
transformations include Rasch model of measurement based on tabulation of expected
frequencies and Shafer-Dempster model of evidence-based on the tabulation of the log-
odds of probabilities (Bond & Fox, 2013, pp. 15 – 28; Cuzzolin, 2012). The typical
dimensional analysis focused on extents of objects or subjects under consideration, as the
generalization of their linear algebraic expression. Extending this concept from defined
measurable objects or subjects to undefined abstract space covering the interaction of
objects and subjects, required specification and integration of subspaces. The
specification of large complex scenarios became the primary challenge of management
analytics and decision-support.
Expression of Large and Complex Scenarios
Data warehouses and OLAP applications evolved as a response to growing
complexity of information technology and data environments supporting business
functions and management activities. A typical enterprise data warehouse was made up

55
of many records with a large number of attributes. A simple mathematical estimate of
candidate models in an enterprise model design space can be calculated using the
formula, LA , where A is the number of attribute and L is the average number of levels (or
values) of the attributes. For a simple modeling problem with one hundred attributes at
two levels each, the number of solutions would be about 1030 (Michalewicz, Schmidt,
Michalewicz, & Chiriac, 2011, p. 25). Technically, the number of empirical model
candidates within a model design space was huge, but there were a limited number of
these models that would satisfy the design requirements of the analysis exercise.
Therefore, the characterization of the enterprise model design space required a
careful examination of the underlying analytics opportunities. Model spaces were the
factors and functions that drove the transactions to express states of existence (of entities,
domains, systems) responsible for the outcome variations, which made up the utility and
preference relations for the management decision maker (Hsu, Ito, Schweikert, Matsuda,
& Shimojo, 2011). Considering the potentially large number of solutions within an
enterprise model design space and the constraints imposed by subject based
multidimensional modeling approaches, the consensus in the literature converged on
multi-tier ensemble analytical architecture. Hsu et al. (2011) presented three-tier
architecture paradigm based on computational informatics perspectives to include: (1)
structure layer models for structural components of the domain, (2) function layer models
for functional components of the domain, and (3) application layer models for application
components of the domain. The application of this architectural approach to the analysis

56
of the brain system resulted in a computational fusion method for the assessment of
gender variation in facial attractiveness is shown in Figure 1 below.
Figure 1. Multilevel modeling applied to the brain system. From “Combinatorial Fusion
Analysis in Brain Informatics: Gender Variation in Facial Attractiveness
Judgment,“ by D. F. Hsu, T. Ito, C. Schweikert, T. Matsuda & S. Shimojo, 2011,
Active media technology, p.9. Copyright 2011 by Springer-Verlag Berlin
Heidelberg. Adapted with permission of the author.
Beroggi (2010, p. 12) discussed a three-step analytical formulation process:
structural, formal, and resolution steps, across three common modeling paradigms: data
(observation), domain (or system), and decision to create a 3X3 analytical model

57
architecture matrix. The first step of the analytical formulation was the structural level, a
graphical portrayal of the relations and dependencies which may be causal (non-
symmetric), correlational (symmetric), conditional (probabilistic) or informational
(definitional) allowing the subject of interest to reflect the underlying data structures. The
second level was the formal level where the relations and dependencies transformed into
attributes to calibrate or define the subject of interest. The third level was the resolution
level in which procedures were applied to generate solutions about the subject of interest.
At each level of the analytic formulation, the level of analysis determined the format,
content, and context of expressed relations. Appendices F and G were compilations of the
details of the approaches. Further, Hendry (2009, pp. 16-19) identified four practical
knowledge levels: measurement, estimation, modeling and forecasting levels, based on
the nature of probability distribution and data generation processes. Table 3 below
combined these proposals on representing complex subjects of interest from its available
data.

58
Table 3
Multi-Level Model Ensemble for Complex Subjects
Knowledge
Level:
Formulatio
n Steps
Dominant
approach
Modeling paradigm
Observation /
Record
Domain / System
Decision /
Application
Level A:
Structural
Measurement,
probability,
and statistical
theory
Underlying
transactions
organized to
expose effect
and coefficients
Underlying
processes that
connect the
transactions,
establishing input
and output
attributes
Underlying
mechanisms to
which the
knowledge of
transactions and
processes can
be applied
Level B:
Formal
Estimation
Measurement
and latent
models that
underlie the
coefficients of
interaction
captured in the
transaction
Functions and
equations for each
of the processes
within the domain
and system
Estimates
(heuristic,
probabilistic,
statistical,
mathematical)
that underlie the
mechanisms
Level C:
Inferential
Reduction,
Likelihood,
Expectation
maximization
Given specific
conditions,
determine what
inferences made
about the data
Starting with
initial values,
determine new
values for the
levels, flows, and
converters
Evaluate the
formal model
and determine
elimination,
integration and
recursive
approach
Level D:
Forecasting
Numerical
optimization,
simulation,
heuristics
Extend
conditions
beyond
representation
in the data to
include
potential
innovations
and emergence
Extend values
within the model
to new futures for
levels, flows, and
converters
Evaluate the
new futures for
applicability
and
implementation

59
In Table 3, an integration of the dominant approaches and modeling paradigms in
the literature cuts across disciplines from statistics to cybernetics. This matrix charts the
paths for data from the left upper corner through insights to foresight on the right lower
corner of the matrix. The modeling paradigms had modeling standards or patterns. The
data model paradigm represented the entity objects as the primary subject of interest,
while the domain (or system) models represented a collection of entity objects that
interact to achieve congruent outcomes. The decision (or application) model paradigm
represented the expression of relations to achieve alternative futures of existence for
specific goals and objectives.
The discussion so far established the multi-level design architecture as the
effective analytic representation in the presence of complexity. This architecture was
achievable through progressive reduction of the available data, and the exploration of the
results for candidate representations of the subject of interest. This approach included a
feedback loop for incremental updating of the model to improve its performance over
time. Analysis of the data, domain, and decision situations in complex areas of endeavor
required incremental construction and manipulation of models, such that one set of
models replaced another set of models. The ability to integrate and compare multiple
models in a domain of interest was critical to this type of empirical model building.
Analytic model building in complex domains demanded the construction of an ensemble
of models of various forms and specifications, for comparative analysis and integration
(Windschitl, Thompson, & Braaten, 2007). An epistemic comparison of the classical

60
approach and this alternate approach, multi-level empirical model building, was
synthesized in Table 4 below.
Table 4
Classical versus Layered Empirical Modeling
Model
characteristic
Classical
Layered
Goal
Find patterns in natural
phenomena
Find patterns and defensible
explanations for the way the natural
world works
Construction
Hypothesis often stated as
predictions about isolated
aspects of the phenomena
Adaptation often represented as
interaction of the phenomena within
the domain of interest
Validation and
Revisability
Evaluation of predictions
result in acceptance or
rejection of the prediction,
with limited opportunity to
revise them
Evaluation of hypothesis occurs in
the context of design, revisions to
the design allow further validation
of the predictions
Explainability
In the form of conclusions,
summarizing the trends and
patterns in the data
Uses patterns in the data to build
evidence for explaining the design.
The design serves as a tool for
explaining the phenomena
Extensibility
Insights on how the
phenomena could beyond
the scope of the data are not
possible
Provides insights into the
phenomena beyond the scope of the
data, through analysis of alternative
designs
Generative
New hypothesis or theories
are end-product
Alternative designs are the product
A necessary implication of the multi-level empirical model development in the
large enterprise space was the need to automate the generation and comparison of a large

61
number of models as part of the analytic processing. This created demand for
computational and algorithmic analytic processing techniques discussed below.
Computational/Algorithmic Analytic Processing
An emerging approach to handling large analysis scenarios was the adoption of a
computational or algorithmic approach. With this approach, computer scientists or
algorithm designers look at exploring large complex datasets as a computation or
algorithmic problem. The objective was the discovery of the models for the data using
statistical, machine learning (numerical heuristics), summarization (likelihood,
similarity), and feature extraction (frequent itemsets, similar items) methods. A large
number of algorithms had been developed to support computational extraction of models
from data. The most common algorithms being C4.5 and higher, k-means, support vector
machines, apriori algorithm, Expectation-Maximization algorithm, PageRank, AdaBoost,
naïve Bayes, Classification And Regression Trees (CART) (Wu et al., 2008). Other
algorithms included autometrics (Hendry & Mizon, 2011), neural networks, genetic
programming, grammatical evolution, multi-expression programming, evolutionary
algorithms, self- organizing migrating algorithm, differential evolution, simulated
annealing, analytical programming, Pareto genetic programming (Zelinka et al., 2011).
These algorithms integrated attribute manipulation, numerical simulation, numerical
optimization, bootstrapping, and other techniques in the evaluation of the data to discover
models that can be used to measure, estimate, infer or forecast a subject of interest.

62
A class of algorithms referred to as symbolic algorithms had become particularly
popular because they modify the underlying data model to improve the efficiency of
discovery of models within the data. Symbolic programming discovered symbolic data
from the available data (Syme, Granicz, & Cisternino, 2012). This approach constructed
symbolic structures from available data and used this structure in the discovery of
models. The structures in Figure 2 represent the result of implementing symbolic
regression or classification to produce fit functions, formulae, control commands
examples from Zelinka et al. (2011).
Figure 2. Examples of structures derived from symbolic algorithms.
This approach to analytic processing had been equally enabled and challenged by
data size and dimension explosion. Algorithms implement a static set of procedures with

63
established decision thresholds. The black box nature of their implementation required
that the user acquire a significant mathematical skill. Also, in many practical situations,
the nature of the available data was overwhelming, noisy, localized, inconsistent, and
incomplete. As such, the extraction of valuable insight through generalization of every
numerical relationship had limits. Input from expert to differentiate the raw input became
necessary to simplify the computational complexity of the algorithms. However, input
from expert had limits and introduced bias into the generation of useful generalizations of
relations within the subjects of interest. A much more comprehensive approach was
direct manipulation of the data model to discover the attributes that support analytic
continuation beyond the classical multidimensional space into formalized metric spaces
and subspaces.
Summary and Conclusions
In this chapter, I discussed different analytic processing methods. OLAP was the
only method with a well formalized for data-modeling process. I highlighted the issues
with OLAP data models, including, heterogeneous and irregular dimensions, handling of
different types of aggregation operations, handling time and uncertainty, symmetrical
treatment for dimension and fact elements, and support for different levels of granularity
in the facts and dimensions. Also, contemporary analysis scenarios handled with OLAP
were small and narrowly defined data cubes. As the size of data and complexity of the
analytic scenarios increased, specialized designs were introduced to improve their
analytics and decision-support capabilities, for example, planning, prediction, inference,

64
probabilistic, Gaussian, OLAM, programmatic OLAP (prolap), and many other OLAP
formats. Another critical issue was the determination of the proper attribution of fact and
dimension relations of the data cubes to ensure alignment with cognitive models of
underlying subjects. The classical multidimensional models and data cubes did not
address secondary issues associated with independence and parsimony of attributes in the
data model design. The result was sparse data cubes whose application was limited to
descriptive analytics.
Improving data models for advanced analytics and decision-support required three
key changes to the data-modeling process. It was important to learn the ontology of the
subject of interest from the available data, not the other way around as it has been the
case in contemporary ontology engineering. An important part of ensuring that the data
model has the right content for analytic processing was leveraging data engineering and
analytic formulation techniques to evolve the data to the right unit and level for analytic
processing, such that similarity principle critical to data analysis and decision-support
problem-solving would be applicable. Finally, refining the normed metric space through
rigorous specification of proper functional forms of relationships in the data ensured
reduction of the metric space to orthogonal expressions of underlying data to limit
interdependence of indicator or characteristic attributes.
The solution opportunities in the use of ontologies included representation and
interpretation mappings, and the use of measures and encoded indicator attributes in fact
relations. Ontologies would also establish the base for searching and pruning of

65
categorical and measure attributes in fact relations. Also, ontologies would use heuristics
to express structural aspects of the data. Other opportunities with ontologies were the use
of summary attributes and transformation logic and many others. Other solution options
were the use of data engineering and analytic formulation techniques, especially semantic
data analysis, symbolic data analysis and dimensional data analysis to establish the
ontology of the subject of interest within the analytic data models. Additionally, using
constructs from complexity analysis and symbolic dynamics, the analytic data model
should be transformed from a static artifact to an active one by expressing dynamism,
uncertainty, and fuzziness within the data model.
The mathematical constructs of Bridgman’s principle, Buckingham’s π-theorem,
and Blackwell theorem were helpful in the construction of extensions to express the
complex features embedded in the data. This integration of critical concepts from
dimension and complexity analysis into the relational data model to derive solutions in
management analytics and decision-support provided the basis for the analytic extensions
on relations adopted by this study. In the next chapter, I describe the research
methodology adopted to study this subject. I argue that data-modeling should be
considered a critical step in research involving secondary data, especially, when the data
exceed sizes typically considered adequate for normal distribution assumptions. A data
analytics project without a data model that accurately reflected the concepts and
constructs of the domain of interest cannot be expected to produce outputs that are
explainable or actionable by business analysts and executives.

66
Chapter 3: Research Method
Introduction
The purpose of this quantitative descriptive study was to examine the data model
of a typical data analytics project in a big data environment for opportunities to improve
the representation of information. I identified the data model as the primary focus of the
study because the expression of information in data models is known to improve
understanding and utilization of the data (Burch, 2018). I adopted nonexperimental DBR
to study the available data and to map it to the cognitive models of the underlying
management situation. This alignment of analytic outputs to cognitive models provided
the basis for the acceptance and actionability of data analytics outputs (Okoli & Watt,
2018).
In this chapter, I discuss the details of the research method. This study
emphasized design theories and concepts for extraction or extrapolation of knowledge
from the available data. Therefore, discussion of the specific issues of the industry of the
data source in this research was not relevant. Because the focus of the study was
constructing the data model that captured underlying concepts for management decision
problem-solving, requirements of population characteristics, sampling, and sampling
procedures were not relevant. The discussion of threats to validity focused on construct
validity since issues of external and internal validity or ethical considerations were not
significant to the methodology.

67
Research Design and Rationale
I used a quantitative, nonexperimental, descriptive design format for this study to
examine the data of the typical data analytics projects to find data model extensions that
would improve the discovery, identification, specification, and resolution of management
decision problems. The research questions guided the study:
Research Question 1: Can data model extensions improve the discovery of
management scenarios from big data?
Research Question 2: Can data model extensions improve insights about the
management scenarios?
Research Question 3: Can data model extensions express the complex constraints
and rules needed to compose the acceptable and actionable solutions for
analysts and executives?
The demonstration of the improvement in data analytics projects on the above
questions would indicate an affirmative response to them. For this demonstration, I used
secondary data from a typical enterprise data analytics project. In such a project scenario,
the specific the needs of the users are vague or non-existent. Additionally, the current
data analytics processes that occur in business intelligence, data mining, knowledge
discovery from databases, deep learning, and artificial intelligence tended to create
incomplete, nuisance and challenging insights and solutions. The secondary data used for
the demonstration was made up of 140 datasets from five different sources with about
1000 data attributes, 1.75 billion rows totaling about 15 terabytes.

68
The selection of a design research methodology informed the focus of this study,
which was building and evaluating data model designs to improve management analytics
and decision making. It is typical for the type of problem, the research objective, and the
expectations of the researcher to dictate research methodology and approach (Cooper,
Hedges, & Valentine, 2009). The type of problem may be normative, descriptive, and
prescriptive. The objective of research may be to test a proposition or hypothesis, explain
an occurrence, or qualify the impact of structure or function. The expectation of the
researcher may be to validate a theory, advance an acceptable explanation, and guide
practice (Bakker & Van Eerde, 2012; Hussain, Elyas, & Nasseef, 2013; Leech &
Dellinger, 2012; Reimann, 2011; Turner, 2010). The alignment of these factors was
critical in the selection of research methodology and design of the study.
Cooper et al. (2009) argued that the impact of these factors were reflected in the
classes of research methodology in the literature. There were three key classes of research
methods as follows. The first class was inquiry driven by theoretical formulations
(theory-based research), the contemporary scientific research approach. The second class
was inquiry driven by epistemic needs (case-based research) which was made popular by
social and behavioral sciences. The third class was inquiry driven by the need to improve
design (DBR) which was made popular by design and engineering sciences. These
classes of inquiry also determined the degree of interaction of the researcher with the
subjects under investigation. In theory-based research, a high degree of direct
interactivity and control is assumed to ensure that the measurements of the inputs capture

69
the characteristics (or attributes) of the subject, unencumbered by nuances of the
surrounding or the researcher. A high degree of indirect interactivity and control is
necessary with case-based research because the inquiry focuses on understanding
underlying epistemology (for example, phenomenology, ethnography, case study.). For
inquiries driven by the need to improve design (so-called DBR), any interactivity or
control biases the context (Kuechler & Vaishnavi, 2012). This study’s research approach
sought to capture the natural architecture and to determine changes in design to pursue to
improve knowledge expressed by available data for management problem-solving. The
researcher interacted with the scheme or configuration of elements (the design) in the
domain of interest to understand the problem and propose solutions to them as needed.
This research approach required the definition, construction, and test of the candidate
designs of the subject of interest to achieve outcomes that did not result naturally
(Kuechler & Vaishnavi, 2012).
The DBR approach was well established in Information Science and Engineering
research (Bakker & Van Eerde, 2012; Kuechler & Vaishnavi, 2012), and was considered
an important area of applied research for developing information, technology, and
engineering solutions using existing knowledge and artifacts (Blessing & Chakrabarti,
2009). Chakrabarti (2011) argued that this form of research allow the researcher to
develop new methods, constructs, and artifacts to simplify the application of knowledge
and engineering rigor for consistent results. This approach differed from the
contemporary research methodology of scientific evidence, which focused on the

70
theoretical development and statistical hypothesis testing. Fortunately, work in the last 50
years has increased the acceptance of DBR methodology because of its success in driving
advances in information and engineering disciplines (Kuechler & Vaishnavi, 2012).
The DBR to address several issues central to research studies as follows. The first
issue was the nature of and approaches to a subject in the real world rather than the
laboratory. It was also developed to address the issue of the use of a broader set of
measures of the subject that emphasize competency rather than theoretical knowledge.
The DBR was also positioned to address issues of the synthesis of recommendations for
design or process improvement based on the formative evaluations, compared to
summative evaluation of the classical research methodology. The DBR approach to
research allowed proper integration of the “difficulty with the complexity of real work
situations and their resistance to experimental control,” the availability of large amounts
of data, and issues related to “comparing cross designs” (Herrington, 2012). The role of
DBR in the researcher’s toolkit was to create practical knowledge to realize theoretical
formulations. It also allowed for formative research to test and refine designs based on
theoretical principles derived from practical measures, prior research, and progressive
refinement through assessment (Hogue, 2013).
According to Blessing and Chakrabarti (2009), DBR methodology occurs in four
parts. In the first part of the methodology, an existing design’s circumstances and
constraints were presented and analyzed (the analysis phase of design research). In the
second part, the researcher studied the interaction between the design and the results (the

71
design phase of design research). In the third part, the researcher deliberately manipulated
the design to change the interactions within the domain of interest by addressing design
constraints that may be responsible for the results (the evaluation phase of design
research). Finally, the researcher proposed and tested new designs and tools (the test
phase of design research). Design-based studies required the analysis of designs within a
robust framework of comparative inferences on structure and function. In this study, the
designs were the data models for management analytics and decision-support problem-
solving.
This research methodology required a quantitative format. The use of a
quantitative format for a study created explicit links between theory and results, limiting
the bias of the researcher (Creswell, 2011). In a quantitative study, the essential elements
of the analysis are mathematical constructs. Quantitative research techniques differ from
qualitative techniques, which use linguistic constructs (Creswell, 2011). Within the
domain of quantitative research, there were five main research design types: randomized
experiment, quasi-experiment, comparative, associational, and descriptive (Creswell,
2012). The first two types were experimental techniques, while the last three belong to
the non-experimental class of techniques. According to Creswell (2012), there were four
items to consider when selecting the approach to a quantitative design: random
assignment of subjects, intervention or treatment by the researcher, structure of the
criterion variables, and approach to the examination of relationships between variables.
In comparative study design, there is no randomization of the assignment of subjects to

72
the groups and no specific intervention against subjects in the study. However, there was
the requirement to define numerical quantities for comparison of the items studied. In a
descriptive study design, the expectation of comparison relaxed for the study to focus on
the design.
Methodology
Based on the framework discussed above, the choice for this study was a
descriptive approach. The secondary nature of data for the study dictated the selection of
the descriptive approach. The availability of suitable secondary data allowed progress
without the burden of collecting data. Secondary data also allowed a focus on the original
attribution of the subject of interest as represented by the available data sources, but
imposed constraints on the causal interpretation of the underlying effects and influences.
Population
In study design, the population refers to the group studied. The population in this
study was not typical. The data used in this study was sales data from a medical product
distribution company which captured purchasing habits of customers, selling
characteristics of agents, market demand, pricing actions on products, and marketing
actions to drive penetration of products within the marketplace. The scope of the data was
enterprise-wide, which meant, it contained all the information captured by the
organization from its business activities related to the products, pricing, sales, marketing,
and customer servicing. Each of these areas had sets of concepts which were extracted to

73
facilitate the analytic activities. I expanded on the Resources-Events-Agent (REA)
ontology framework proposed for business. See Appendices F & G for details.
Sampling and Sampling Procedures
This study did not utilize sampling or sampling procedures. Analytics and
decision-support problems in management required the participation of all data points in
the analytic processing. The focus of the study was to construct the data model that
leveraged every necessary data point in analysis and decision-support problem-solving.
This approach was selected to overcome the challenges of existing data analytics
processes where the use of sampling added complexity to the insights generated due to
the concerns of representativeness of the sample compared to the entire population of
items under consideration.
Archival Data
I used secondary data in this study. The data sources included SAP/R3 Enterprise
Resource Planning (ERP) system order processing module, along with additional sources
of product and market information gathered from second- and third-party sources. The
dataset spanned three years, from 2007 to 2009. Appendix A shows the list of data sets
included in the data use agreement approved by Institutional Review Board (IRB). The
IRB approval number 10-28-15-0015433 was issued October 25, 2015. The use of
historical data was deliberate and should not impact the outcome of the research. The
data came from a data asset repository used for exploratory data analysis and analytic
pilot projects. The data was completely de-identified. Randomly generated identifiers

74
related the different segments of the data together. The next chapter contains the
description of the data used to illustrate the data model extension approach. The chapter
also covers the anomalies in the data set addressed to ensure accurate transformation into
analytic and decision attributes.
Data Analysis Plan
A data analysis plan should present the description of the software, data cleansing
and screening procedures, details of the statistical tests, procedures, variables, and how
results will be interpreted. Because this study focused on data model designs for analytics
and decision-support problem-solving in management, the emphasis was on discovering
attributes of the data for managerial tasks. For this reason, I expanded this section to
include the processes of ontology learning, data engineering, and analytic formulation
which were critical to the data model extension methodology and the data analysis in
large complex analytic and big data scenarios.
Data Model Extension Methodology
As mentioned above, the data available for data analytics projects in a big data
environment came in different formats, data types, and data naming conventions. To
conduct a proper analysis of the underlying data model, I constructed data asset diagrams
at two levels: high-level and detail-level. The high-level data asset diagram provided a
panoramic view of all the data asset available for the analytic exercise, and the links
between the datasets. The detail-level data asset diagram showed the content of each data
asset, including the logic for the links between the data assets when they existed. The

75
dataset link logic was of three types: direct referential association (primary key – foreign
key association), indirect reference association through matching or associative relation.
The typical dataset for big data analytics described above contained duplication,
redundancy, inconsistencies, and other data issues. These data assets also embedded the
critical data, process, and business rules that are helpful in the application of the data
model to uncovering problem scenarios. To highlight these situations in the data, I
refined that data asset diagram using a generalized entity relation recognition algorithm to
restructure the data asset into a generalized entity relation model and generated an
accompanying entity relation diagram for visualization of the data model. At this level,
the data model applied all the normalization rules to ensure data quality and integrity in
the data. This data model reflected the piece of the “real-world” expressed by the
available data, as interconnected elements of a type system with one or more schema(s),
devoid of artifacts of physical implementation as databases, data-files, and applications.
(Puonti, Lehtonen, Luoto, Aaltonen & Aho, 2016).
For big data analytics, this real-world was complicated and contained tens of
schemas. Each schema formed the collection of relations within a data model connected
by association restrictions, including, domain, cardinality, and referential types. The data
model at this point still embedded the functional and transitive associations. Additionally,
the data model did not express the progression of the concepts with the data over time.
This classical data model was also limited to relations to real entities within the schema

76
as such the resulting design manifestation was known as the entity-relationship data
model (Puonti et al., 2016).
In this classical data model, given properties, P1, P2,…, Pn, a relation, R, was
defined by the n properties such that each instance or tuple had its first property from P1,
its second property from P2, and so on. A relation, R, was the subset of Cartesian product
P1, P2,…, Pn or ∏𝑃
𝑗
𝑛
𝑗=1 . Pj is the jth property of R with degree n, hence referred to as, n-
ary relation, with the following characteristics (Kumari & Singh, 2017):
1. Each row was an instance of the relation or tuple of R,
2. Row ordering was not consequential,
3. All instances or tuples of R were distinct or unique,
4. Column ordering corresponds to the ordering of the set of attributes of R,
5. Term label corresponding to the set domain conveyed the significance of each
attribute
6. The term labels applied to the attributes were unique and conferred some
interpretative value to its content
7. The combination of attributes covered by R uniquely described an entity, subject,
object, or class with the rows or tuples reflecting the membership in the collection
8. Property values assumed standard data types, including, integer, decimal,
character, and currency, all of which were of scalar type.

77
9. Advanced data types like user data types (UDTs), algebraic data types (ADTs),
statistical data types (SDTs) and functional data types (FDTs) were not allowed in
data models.
10. A typical data model of the enterprise units contained hundreds of relations within
tens of schemas.
The entity relations of the enterprise data model were not well differentiated.
They could represent people, groups, events, actions, transactions, resources, place, and
other ontological classes. To facilitate the translation of entity to ontology relations, I
derived a list of 16 possible ontology commitments for management analytic and
decision-support problem problem-solving shown in Appendix G. I used the list of
candidate ontology commitments to refine the relations and properties within each data
set into ontology classes and properties as data model extensions. These derived relations
differentiated the entity relations into higher forms encompassing complex associations
and constraints.
To derive data model extensions, I generalized the analytic continuity concept of
functions to the relations through analytic elements. Analytic elements were projections
of the properties of the relations beyond initial specifications, but which maintained
logical continuation as follows. Considering the data model as a collection of properties,
P, of relations, where each relation, R, was the generalized functional of a unique aspect
of an ontology, O, of a domain, D, in the universe, U. Each property, P, was an analytic
element, (a, l), where, a, was attribution represented by the property, and l was the

78
function or logic on a. The original analytic element in a data model was (a0, l0) and
subsequent derivation results in a matrix (a1, l1), …, (a i, lj) were extensions of each other
through the connection component, σ, of the set a0 ∩ a1 ∩, …, ∩ ax if l0| == l1| σ, …, == lx|
σ*. The analytic element defined by the pair, (a, l), therefore, continued to the boundary
point, ɛ, with ∂a ⸦ D. These elements continued the expression of the relation, R, beyond
the defined scope. This universal cover was the original scope for extensions of the
analytic elements of the relation, or the analytic space. The maximal analytic extension of
the relations was, therefore, an unambiguous holomorphic functional of complex
properties differentiable about every point in the domain. This new relation, σ*, specified
the region where the sum of terms of the sequences of the relation, or its infinite series,
became divergent. It extended the point beyond which values existed, and when the
expectation of the return of a single point was unrealistic (so-called mathematical
singularity).
The use of complex numbers reinforced extensions, especially, when defined on
more than one property of the relation. Complex numbers eliminated the need for
mathematical singularity or isolated points and favored algebraic or geometric varieties
with a mathematical plurality or cohomology. The dimension axioms defined expanded
the analytic space of the relation as follows. Given that complex numbers were
expressions of the form y0 + xi where x and y were real numbers, and i was the imaginary
unit, the solution to quadratic equation y2+1=0, and satisfied the equation y2 = −1.
Complex numbers extended the dimensionality of real numbers which were, technically,

79
points or zero-dimensional. For example, 1-dimensional number line was extendable to
the 2-dimensional plane by using the horizontal axis for the real numbers and the vertical
axis for the imaginary part of the complex number. The complex number y0 + xi
identified point coordinates (y, x) in the complex plane. A complex number whose real
part was zero was said to be purely imaginary, whereas a complex number whose
imaginary part was zero was a real number. Therefore, complex numbers were analytic
extensions on ordinary real numbers, converging on an area defined by a range of real
numbers within the domain, the germ, g, of the power series.
Assuming two germs, g1 and g2, were the sets of vectors, when the absolute
difference between the set of vectors was less than the radius of convergence of g1, and if
the power series defined by g1 and g2 specify identity relations on the intersection of the
domains, then g2 was an extension of g1, making up the point (or sheaf) of the extension.
The union of the germ sheafs identified from the power series of the domain by sets,
Ur(g), for all r > 0 and g ∈ G defined the basis for an open set for the topology on G.
Connected components of G, equivalence relations, formed the analytic extension map of
space. A map defined by φg(h) = h0 from Ur(g) to C where r was the radius of convergence
of g, represented the chart of the extension. The set of such charts formed the atlas for G
or the universal relation. Therefore, an analytic extension of the relation generalized the
power series defined from the sequences of the underlying properties. They created
objects within topological spaces of class equivalence with others of the same type with
shared local properties. Therefore, the converging power series of the relation properties

80
enhanced the underlying information and resulted in sets of vectors around the points or
space of expression within the empirical domain.
Analytic extensions on relations provided the paradigm for extension of data
models to include high-order logic. The extensions specified the analytic space through
the derivation of algebraic varieties of the domain ontology and topology was possible.
This algebraic variety ranged from simple ones like variables to intermediate types such
as features, identity vectors, and eigenvectors to name a few. Complex algebraic varieties
like tensors or co-dimensional entities resulted from the further projection of the
intermediate algebraic variety. At the level of the complex algebraic varieties, the
dimensions were degenerates of real dimensions with about half the number. That is, if
the dimension of the complex algebraic variety were, d, its real dimension would be 2d.
The real algebraic variety of equations with real coefficients became the dimension. The
real dimension referred to the maximum number of manifolds contained in the set of its
real points. Also, the real dimension was never greater than the complex dimension and
equals it if the variety was irreducible and had real points that are singular. For example,
the relation of a complex algebraic variety with dimension two would be a surface, but
with a real dimension zero. It had only one real point, (0, 0, 0), which was singular. The
relation representing a smooth complex hypersurface in complex projective space of
dimensions, n, was a manifold of dimension 2(n − 1). The complex hyperplane did not
separate a complex projective space into two components, instead, expressed them as
having real co-dimension of 2.

81
Based on this methodology, analytic extensions on relations were, inherently,
more robust than an analytic extension of functions, and enabled the differentiation of
data using analytical geometry. It transformed scalar data into algebraic varieties. The
additional properties improved the expressiveness of the relation for problem-solving
based on the set points or boundaries of differentiation that would satisfy the analysis
problem. Considering the properties of relations as analytic elements made them heuristic
translators, mapping one property to another, within the domain defined.
Composing an enterprise from relations of algebraic varieties transformed the data
model into empirical ontology with a well defined analytic topology. The progressive
differentiation and integration of these varieties expanded the characterization of the
domain but maintained a universal cover on the relation reducing analytic over-reach.
Analytic continuation or extension reached its boundary when the data model captured
very concepts of the domain in alignment with the intuitive cognitive model of the
business analysts and executives.
Expanded Data Analytics Process
The data analysis process started with the arrangement of the available input
datasets, followed by extraction of the underlying entities and relationships, and the
reconciliation of the attribution of entities and relationships across the datasets to achieve
a rationalized metadata model of the input data. Further abstractions of the metadata
captured characteristics of the underlying data not explicitly expressed by its metadata.

82
Contemporary literature on data analysis assumes the creation of a data model
should precede data collection. It also often assumes that the data is in a structured
format, mostly from databases. In the light of big data, these assumptions were no longer
valid. Relaxing these assumptions allowed data in any form and from any source to
participate in analytic processing. In this scenario, the data-modeling became the
dynamic process of discovering the characteristics and relationships between the
available data sources. This study used secondary data gathered without an explicit data
model of the analytic needs. I adopted a data analytics process made up of the five
following steps.
The first step of this expanded data analysis plan was to create the catalog of the
datasets that were available for analytic processing. This catalog specified the nature of
the datasets along with the format, the number of attributes, and the nature of attributes
available to establish the scope and boundaries of the analysis problem. The catalog
mapped datasets to the analytic processing objective. This mapping exposed gaps, when
they existed, within the available data sets. Connections between the datasets, included
referential keys, common attributes, hierarchical, temporal, or spatial association types.
The second step was to expand the datasets into entities and attributes. This step
involved a critical review of the structure of the datasets. It included the capture of user-
friendly names, descriptions, database data types, analytic data types, measurement scales
for each attribute in the dataset. The classical data models typically ignored measurement
scales, creating confusion with the interpretation of numbers.

83
The third step was to expand the metadata catalog to include relationships within
and between the datasets, such as extension (1:1), subsumption (1:M), and qualified
(M:N) relationships. These were cardinality relationships within the data model, which
were expanded to accommodate non-cardinality semantic, symbolic, and dimensional
expressions between and within entities in the data sets.
In the fourth step, attributes were organized into unique subject areas or
functional domains to understand the extent of representation of the subject area or
functional domains, as well as its association and dependence on other subject areas or
functional domains captured in the data sets. Analysis of the data within the entity
structure determined whether there were dynamic components of the attributes indicating
the data may be of a repeating nature, either longitudinal (single subject over time) or
cross-sectional (multiple data points at the same time from different sources). This
orientation of the data was critical to determining the appropriate types of data
engineering and analytic formulation processes to apply to the data. This decomposition
of the subject areas or functional domains into static and dynamic components furthered
the data model.
The fifth step was to establish the measurement frames for the concepts and then
generate new attributes or values needed to operationalize them with the available data.
The step continued for all the concepts of the decision-support problem. In classical
business analysis scenarios, the optimal data model should allow business users access
the attributes of the subject of interest in a way that aligned to the cognitive or conceptual

84
representation of the domain. This outputs from this data model should support business
analysts and executive in the tasks of management - plan, organize, lead and control
without any need to for technical knowledge of the analytic techniques or data
engineering method requirements.
Threats to Validity
Because this study employed DBR, which does not require interaction between
the researcher and the subject or the data collection process, the common threats to
validity did not apply. In studies where the researcher has direct or indirect interactivity
with the subject, it is critical to address threats to validity. Addressing these threats
prevent issues with study design (external validity), subject selection (internal validity),
and inference from sample to population (construct validity). External validity issues
include reactivity, interaction effects, specificity of variables, and interference. Internal
validity issues include self-selection, non-stationary effects, and subject retention.
Construct validity issues are related to statistical conclusion requiring correction. In
classical scientific studies, the validation techniques in these situations may be statistical.
In this study, I took an analytic and decision-theoretic approach to validity.
Analytic and decision-theoretic techniques evaluated models in the context of
specific analysis and decision needs of the users. The analytic and decision-theoretic
approach to model validation, though relatively new, has shown promise in alleviating
interpretation constraints imposed by pure statistical validation approaches (Welton &
Thom, 2015). The analytic and decision-theoretic approaches focused on determining the

85
strength of evidence for a model’s empirical power in the context of the specific analytic
and decision situation, without consideration of the generalizability (Jiang, Yuan,
Mahadevan, & Liu, 2013).
External Validity
The nature of the business data used in this research does not present situations
that would challenge external validity. The goal of the study was to support strategic
decisions in a domain of responsibility by establishing a methodology for data model
extension. The data-modeling exercise would explicitly define attributes to address the
reactivity, the interaction between subjects, the specificity of attributes, and the
interferences existing in the data to enhance analytics and decision-support requirement
of managerial tasks.
Internal Validity
Issues of internal validity also did not apply to this study because of the nature of
the data under consideration. The analysis provided insights for decision-support
problem-solving in management. In business analysis, absolute precision was not
necessary. However, management requires consideration of history, maturation,
regression, churn, and interaction, which are part of the practical expression of the subject
for decision-support.
Construct Validity
In this study, construct validation was limited to analytical and decision-theoretic
conclusions based on the significance to management analysis and decision-support. An

86
important criterion in construct validity was the degree of alignment of conceptual or
cognitive expectation of the management analysts or decision makers of the enterprise
functional unit or domain. For this reason, the measures used in this study focused on
business alignment, for example, intelligence density, decision yield, cognitive gain,
empirical lift, and Bayesian yield. When necessary, statistical reference attributes,
including f-statistic, t-statistic, f-statistic, and others were computed to assist the
interpretation of the strength of evidence.
Ethical Procedures
The source data used in the study came from the data warehouse I maintained for
analytic model and decision algorithms development. Personally identifiable information
was removed from the data. The study did not require human subjects or interviews. The
data was more than five years old. It was large enough for the study of extensions of
relational data-modeling needed to advance analytic processing in databases, beyond the
current state allowed by online analytic processing (OLAP).
Summary
The goal of this research was to study data model extension for management
analytics and decision-support using a DBR methodology. The choice of this
methodology aligned with the purpose and nature of the study. The quantitative non-
experimental descriptive research format provided the ideal approach to the study of the
data model and the opportunities to improve them through the implementation of analytic
extensions.

87
A critical component of this methodology was the modified data analysis plan,
which addressed the complexity of the available data for analytic processing. The data
analysis plan also addressed the links, both functional and non-functional, within and
between the datasets. Using the extended data analysis plan led to the identification of
conceptual data elements of the available data, which connected the available data to the
intentions of the management analytics and decision-support. These abstract and
conceptual data elements connected the measurement frames of subjects in the available
data. These measurement frames were the quantitative expression of effects, influences,
and other characteristics embedded in the data.
A point of the expanded data analysis plan was that large and complex domains of
an enterprise required reconciled attributes to map to the ontology of the underlying
subjects. The mapping from data to ontology helped align structural, formal, and
resolution expectations at appropriate levels of analysis. The mapping also allowed
measurement, estimation, inference, and forecast needed to resolve business questions
and management problems. Implementing analytic extensions at the data level
transformed data from raw input into attributes for cognitive processing. For this reason,
the focus of evaluation of these analytic attributes was on the empirical measures of
analytics and decision-support, such as intelligence density, cognitive gain, empirical
power, and others. Statistical measures of evidence such as statistical power, confidence
interval, p-value, parametric statistics, and others were secondary to the analytic and
decision-theoretic measures.

88
Chapter 4 contains further discussion of the analytic extensions, the details of
answers to the research questions, and an application in a big data analytics scenario of a
medical product distribution company. In Chapter 5, I provide a discussion of the
findings and the implications for research in applied management and decision science.

89
Chapter 4: Results
Introduction
The purpose of this quantitative descriptive study was to examine the data model
of a typical data analytics project in a big data environment for design alternatives to
address issues of misalignment of data analytics project outputs, available data, and the
prevailing intuitive cognitive model of the problem and solution scenarios. The objective
of the study was to improve the acceptance and actionability of data analytics outputs by
business analysts and executives. I identified the data model as the primary focus of the
study because the expression of information in data models was known to improve
understanding and application of the data to management problem-solving (Burch, 2018).
The research questions of this study were as follows:
Research Question 1: Can data model extensions improve the discovery of
management scenarios from big data?
Research Question 2: Can data model extensions improve the formulation of
insights about the management scenarios?
Research Question 3: Can data model extensions express the complex constraints
and rules needed to compose the acceptable and actionable solutions for
analysts and executives?
In this chapter, I discuss the results of the data model extension methodology and
the extended data analysis plan, as described in the previous chapter. I follow the

90
discussion of the results with an application of this data model approach to a typical data
analytics project in a big data environment.
Data Collection
Data collection in a classical research situation provides information on the data
collected for the analysis of the research subject including recruitment rate, response rate,
discrepancies from plan, baseline statistics, sample representativeness, and so forth. In
this study, I used secondary data and discuss the data collection process for a big data
project in a DBR context.
The data analytics projects in big data environment start with a list of available
data assets and a vague description of the business objective of the analytic and decision-
support exercise. The available data assets represented the universe of data for the
formulation of the analytic problem under consideration. The vague description of the
business objective stipulates the expectations of the analytic exercise. Detailed
requirements were problematic due to the overwhelming availability of data and the
complexity of the information about the business problem.
The key steps in big data analytics projects were the collection of all the datasets
available for the analysis, preparing the data for analytic algorithms, running the analytic
algorithms to generate analytic models, running the analytic models against new data to
determine its performance, reporting the performance of the models, reviewing the results
in the context of the business problem under consideration (Zicari et al., 2016). When
the results do not provide satisfactory answers to the business questions, this process is

91
iterated until an acceptable answer is produced. Using the data model extensions and
extended data analysis plan to update the data model throughout all these steps ensures
that progression of the data analytics process. The extensions of the data model created
the cognitive breadcrumbs needed to adapt the analytic processing for complex business
problem-solving. The data collection process went as follows.
Since the big data environment was the collection point for the available data in
the organization, and it ingested and maintained the data as-is from the source systems,
whether structured (data files, tables) or unstructured (documents, records, graphs,
multimedia) formats. The first step in the data collection was capturing the names of the
data assets, number of files in the set (if more than 1), partition logic (if multiple files),
format, size, number of rows, and the number of columns in all the datasets and
documents provided. For each of the files in data asset, I determined whether there were
links between the files, and if so, which attribute(s) established the link. I generated a
data set link inventory to sustain the connections between the data assets for further
processing.
I processed each data set further to gather details of the content. This included
data element labels, data type, number of unique values, and cardinality ratio. The data
element label was either the first row in the data set, declarations at the beginning of the
data set for filetypes like parquet or Avro, separate metadata files like flat files, or
database catalog of the primary source system. Data types were primary scalar data types
of numeric and non-numeric types. Variants of numeric data types like integer, big-

92
integer, decimals, money, float, and non-numeric datatypes like character, variable
character, text, binary, variable binary were derived when not explicitly provided with the
initial data set. A row in the data set was either a record for structured data or a line for
unstructured data. Unique values were derived by counting the unique occurrence of the
values of the data element either in a row of structured data or line of unstructured data.
The unique values were the tokens of the underlying subjects. I calculated the cardinality
ratio as the number of unique values divided by the number of the rows in the data set.
Using the cardinality ratio, I implemented the following relation identification algorithm
Table 5
Relation extraction algorithm
0
For each data set, set dataset name to dataset label
1
For all data elements in the data set
2
if there is a data element with cardinality ratio = 1 and
the data element is not a timestamp;
then assign this data element a relation property key status
assign the label of the data element as the name of the relation;
3
if
the sum of all cardinality ratios = 1
then assign all data elements relation property key status
assign the concatenated label of the data elements as a name of
relation;
4
If
the sum of all cardinality ratios > 1
then
find the combination of the sum of data element keys that add to 1
assign each combination a relation property key name
assign each combination a relation name that combined the name of
property names
5
if

93
data element with cardinality ratio = 1 and the data element
is a timestamp,
then
skip timestamp data element
find the combination of the sum of data element keys that add to 1
assign each combination a relation property key name
assign each combination a relation name that combined the name of
property names
6
If the sum of all cardinality ratios < 1
then
find a partition of the data with a combination of the sum of data
element keys that add to 1
assign each combination a relation property key name
assign each combination a relation name that combined the name of
property names.
If
no partitions were found that meet this criterion,
flag dataset for manual review
7
End;
The following relation types were collected through this process.
1. The primary relation which enumerated instances of items with similar
characteristics, for example, customer, product, sales representative, time,
location, and others.
2. The composite relations which captured the interaction of the primary
relations in the data model, for example, a sale became the relationship
relation of the interaction of product, customer, sales representative, time,
space, price, and so on.
3. Detail primary relation with high cardinality attributes of the primary
relation properties.

94
4. Detail composite relation with high cardinality relation properties of
composite relations.
The cardinality ratios separated the relations into two groups. The third normal
form relational data model that resulted from this process captured the universe of
attributes available for processing the goals and objectives of the data analytics project.
The collection of data about the data model extensions used the four types of
relations – primary, primary detail, composite, and composite detail, captured with the
relation recognition algorithm as input. Noting that the detail relation types extended the
primary relations, the connections between these relations were extensions.
For primary relations, the connection could be one-to-one, union (full or partial),
or none. If one-to-one, the relations were combined without any loss of data. If the full
union, that meant the two primary relations could be concatenated together without a
change of the number of properties in the resulting combined data set. If partial union, the
relations had common properties which were concatenated such that each relation had
properties that were unique to them and no values for the relation properties that were not
common. When the properties of two primary relations did not map to a single set of
properties, I combined their properties and allowed the attributes unique to each relation
to remain as missing values. The missing value treatment such as elimination or
imputation was applied at a later stage in the process as deemed appropriate. A relation
connection type of “None” indicated complete independence of the two primary relations.
Before declaring that the relations are completely independent, I searched for non-natural

95
connections between the relations, such as, geographical location or timestamp, and so
forth.
For each relation property within the relations of the data model, I created a new
property to represent the association between the relation properties. The realization of
these associations depended on the analytic formulation needed to quantify the
association. The applicable analytic formulation process depended in the assumptions
about the association which can be linear or non-linear, continuous or non-continuous
(see Appendix F). As such, I adopted a process of appending the name of the analytic
process to the name of the association. When multiple analytic formulations are
applicable, I used as many of the techniques as needed to facilitate capture the data about
the representativeness of the technique. I evaluated relation property values to discover
transformation that would result in new relation properties. I also evaluated each pair of
relation property values for form expressions of the association between them. The form
expression between these attributes resulted in new relation properties. Recalling from
Chapter 2 on the expression of large analytic domains that the formulation of form
expressions for every combination of attribute resulted in very large matrix, I limited the
discovery of form expressions to those that would advance the ontology learning of the
objective of the analytic processing.
With new relation properties, I labeled and integrated them into the data model.
This process continued until all the functional associations were discovered and
integrated into the data model. The universe of attributes expressed by the relations in the

96
data model at this point would be comprehensive for the discovery, identification,
specification, and resolution tasks for the data analytics project. I used the conceptual
model generated from the process to evaluate the appropriateness of the data for the
analytic exercise.
To evaluate the information within the data model, I used information entropy
calculation. For each relation and the relation property of the data model, the information
entropy was calculated as the sum of the proportions of the values multiplied by the
normal log of the proportions of the values. The relation or the relation property would be
1 when there was an equal proportion of all values and approach zero the more the
variation of the proportions of values are in the relation. For the ontology learning
process, relation properties with large information gain calculation had low ontology
classification. Also, low information gain represented high ontology class. This situation
of the ontology class was an indication of the generalizability of the concept across the
domain. The information gain distribution of the relation properties was used in the
determination of the ontological commitment for each property value in the data model
and the derivation of data model extensions.
Study Results
Using the data collected from the process described above and the information
entropy calculation discussed above, I grouped the relation property values into three
classes. Property values with information entropy > 0.75 were specialized ontology
concepts which were helpful in defining the dimensions of the subjects of the data model.

97
Those with analytic significance metric between 0.35 to 0.75 contained ontology
concepts that had moderate generalizability and were helpful in extending the data model
for specific analytic situations. Finally, the property values < 0.34 were helpful in
extending the data model for general expression. This data model extension approach
preserved the operations of relational algebra and calculus, including union, difference,
product, selection, projection, logic, and arithmetic. It, also, sustained the connection of
input data to the analytic expressions constructed for knowledge discovery, business
intelligence, and decision-support in management.
Recall that the analytic elements of the properties of the relation had an attribute
component (a) and the logic component (l), where the attribute element had value (v) and
scale (s) sub-components. The manipulation of the a, l components of the analytic
element resulted in the differentiation of the property or properties of the relation. These
extensions were higher-order conceptual relations or properties derived from lower-order
classical relation or properties using established data engineering and analytic
formulation techniques (Foster & Stein, 2013). The catalog of ontological element types
and analytic formulations are shown in Appendix F and G respectively. Further
discussion of the extensions follows.
Semantic Extension
Semantic extension formed interpretation continuity on attributes of the relation.
This extension involved manipulating the v-subcomponent of the a-compoentt of the
analytic element pair, (a,l), discussed above. This manipulation expanded the expression

98
of the relation property into a relation that captures all forms of representation based on
the value expression (Krogstie, 2012; Feilmayr & Wöß, 2016). Semantic extensions of
the data model transformed the scalar quantities of the relation properties into vector and
matrix formulations of the relation. The extension impacts non-numeric attributes the
most since their vectorization requires coding or transformation, such as dummy coding,
threshold coding, proportionality coding, probability coding, the weight of evidence
coding, Rasch coding, Dempster-Shafer coding, Likert scale coding, and so on and so
forth. The implementation of semantic extensions identified the cases and the states of
expression of characteristics of subjects within the data.
Semantic extension expanded the data model into its first-order logical
expression. First-order logic system were sets of propositions on concepts conferring
meaning to the underlying objects and subjects arising from the interaction of objects. In
turn, propositions were sets of atomic predicates connected with logic connectives into
compound predicates. The atomic predicates formed the units of expression of the object
or subjects and offered interpretation context(s) reflected in the term or name reference of
the predicate, the value assignment, data type, and scale of this value. The semantic
relation became the collection of propositions for the expression of the instances of the
relation with both conjunctive and disjunctive logic. Note that the typical entity relation is
of conjunctive normal form only.
Semantic extension transformed the entity-attribute-value structure of the data
model into the subject-predicate-variable structure of first-order logic. Semantic relations

99
were made up of elements whose instances were variables of well-formed atomic
formulas of first-order predicate logic with bounded values. For example, attribute, A,
was the predicate logic for the instance or variable of A, p (?a), within attribute domain of
A given entity, |a|, such that,
A: p(?a, |a|) = true & p(?a, not |a|)=[false | undefined]
Every attribute value was, therefore, the predicate logic assertion. For example, if
attribute A was “year”, its variable, ?year, with a domain, |year|= |2010, 2011, 2012,
2013|, an assertion for predicate, p(?year, 2010) = true and p ( ? year, 2014) = false
(closed world interpretation) or undefined (open world interpretation). The number of
distinct predicates became fewer than the number of variables. Essentially, every instance
or set of instances of attributes transformed into first-order predicate semantic relation.
The semantic expansion described above, based on first-order predicate logic,
transformation resulted in many variables in a relation, especially when dealing with
qualitative attributes of high cardinality or quantitative attributes whose magnitude had
significance. For these attributes, semantic continuity was established with count, order,
or ratio measures respectively. This improved expressivity of the semantic relations,
allowing aggregation of lower-order predicates over well-defined sets, supersets, and
higher levels of predicate cardinalities using following qualifiers:
• the many-sorted logic to partition instances into populations, groups, and
types;
• intuitionistic type logic to link variables to proof and dependency types;

100
• Logic modal qualifiers, such as
o alethetic for the states of possibility, impossibility, necessity
o temporal for the timestamp, time span, time horizon
o spatial for point, area, space
o deontic for mandatory, obligatory, permissible,
o epistemic for propositional, hypothetical, theoretic, proven
o doxastic for temporal-spatial, situational, positional, and
o fuzzy logic for heuristic categories
Essentially, semantic extensions of the data resulted in atomic concepts of the
underlying data in a fully specified form. As noted above, this organization of data
favored the derivation of scalar quantities representing the magnitude of the properties of
the subjects as expressed in the data. The degree of connectivity of logic represented the
complexity of expression. The associations or correlations between the variables
provided the guide needed to answer complex questions about the subjects using the
available data. The estimate of the size of the semantic database was the product of the
sum of arities of all semantic relations and the number of relations.
The implementation of this extension of the data model required the following
transformations:
1. For attributes with assignment devoid of order or interval, each assignment
became a variable with binary values, commonly coded as one if present and
zero if absent respectively.

101
2. For attributes with an assignment with order but devoid of the interval, the
value is translated into a rank order further transformed, normalized,
regularized as needed to capture the magnitude of expression.
3. For attributes with an assignment with order and interval, the value
transformations eliminated covariation (standardization), scale issues
(regularization and normalization) as needed
4. For attributes with characteristic assignment devoid of order with a large
number of values, were grouped
5. For attributes with a characteristic assignment with order and a large number
of values, were rank ordered
6. For attributes with numeric assignment devoid of order with a large number of
values, were grouped
7. For attributes with a numeric assignment with order and many values, were
rank ordered
Symbolic Extension
The symbolic extension formed subject-object relations which layered expression
of entity types and groups into conceptual boundaries for similarity, discriminant, or
other quantitative distance measures (Diday, 2012). They were extensions on the l-
complement of the (a,l) pair of the analytic element. With these extensions, the concept
of CUSTOMER became vector or spectrum of expression based on figurative
characteristics like purchase frequency, price sensitivity, lifetime value, churn

102
probability, to name a few. This vector could compare to the PROSPECT vector to show
the flow between them in the PARTY vector of vectors. This result was the map of the
journey of a PARTY through the enterprise from the cradle to the grave. Superimposing
the actions of management responsible for changes in the characteristics of these vectors
over the lifetime of the PARTY brought clarity to the consequence of management
decisions and actions.
While the semantic extension evolved the data model into the relation of variables
and captured the logical association behind the expression of the subjects within the
domain of interest, the symbolic extension quantifies this expression for the comparison
of the subjects (Jiao, Zhou, & Chu, 2016). Symbolic extension of the data model adds a
transformation to records of the subject of interest to represent the distance from each
other, or to a normative reference. This extension derived attributes of the subject of
interest as a specific form of lossless encoding of the characteristics of the subject. The
results were mappings, π, from a space of expression, y, to that which defined it, x,
represented as follows:
π : y → x
y = π(x), that the subject of interest, y, encoded by the set of variables of the subject of
interest, x. It was not necessary for this mapping to be injective, that is, for the same
expression of the subject of interest transformed similarly by the same set of inputs (one-
to-one mapping between expression and input(s)).

103
An emphasis on this extension was the capture of the space of expression that was
identifying the subjects of interest to make similarity or discriminant assessment
quantitative. Each element y ∈ Y determined a unique set x= π(y) ∈ X, where every x ∈
X was representative of one or more elements of y ∈ Y. Space, Y, was the Cartesian
product of finite metric spaces defining the boundaries of the topology of the subject of
interest. This space simplified the assessment of similarity compared to using the natural
metrics within the space, X.
With this extension, the enterprise transformed into an abstract topological
dynamical system, 𝒴 = (Y, T) where Y was a metric space and T is a continuous function
within the metric space. That is, 𝒴, had n-dimensional axis reflecting states of as subset
of the entire space, 𝒴 = (Y, 𝜎). This space consisted of finite form expression Y=(yn)n∈
𝒴 over a finite relation, which was transformed using a shift map σ(y)=(yn+1)n ∈ 𝒴. The
relation between 𝒴 and (Y, T) was the factor map which controls the translation of Y into
𝒴 dynamical system, such that the lower layer was made up of fine grain attributes that
encoded general characteristics of the subjects of the domain, while higher layers were
responsible for specific characteristics of the subject.
The first k attributes jointly represent the union of a unit of order k, with every
unit translating into a factor of the subject, independently. The units of the first order
form into disjoint blocks or groups, each unit of order k included a piece of the kth
attribute and a finite collection of attributes of lower orders. The result was an association

104
or concept hierarchy based on criterion induced by order of expression which was subtler
than a strict hierarchical or graphical association based explicit criteria in the information.
To further explain the data model extension, let y1,...,yp be the set of variables, Dj
be the underlying domain of Yj and |Y|j the range of Yj for j=1,...,p., set of values for Y.
Given a symbolic relation, S, with p-tuple (y1,...,yp) with yj ∈ |Y|j for j=1,...,p. S ={
s1,...,sn} were the relation instances, then Yj(si) ∈ |Y|j for j =1,...,p, and i=1,...,n.
Therefore, the data array consisted of n relations, one for each instance si ∈ S, such that
(Y1(si),...,Yp(si)) for i =1,...,n. The data types of the symbolic variables took on additional
forms besides intervals and count integers of the semantic space, such as arrays of
different dimensions, functional expression/mapping, nominal and ordinal values, modal
values, standard numeric valued data types (Noirhomme‐Fraiture & Brito, 2011).
An important relationship in symbolic extension was the concept of full or partial
dependence. A symbolic relation, S1 may be fully or partially dependent on another
relation, S2, if it could only be applied when S2 takes expression within the all or given
set for S1. The relation, S1, was dependent on the relation, S2, if S1 made no sense for
some values of S2, and hence became non-applicable.
Dimension Extension
Dimension extension established the accurate and orthogonal axes of expression
of the abstract interrelated analytic spaces within the domain of interest given semantic
and symbolic differentiation and integration. This extension “dimensionalizes” the
domain into invariant quantities with the absolute significance of relative magnitude, per

105
Buckingham π theorem and Bridgman’s principle (Shen, Davis, Lin, & Nachtsheim,
2014). Applied to the example of the PARTY, the complex dimension extension, defined
the multiple paths for the PARTY vector of vectors which connects to the different
outcomes within the domain, for example, customer tenure, type of order, purchase
frequency, willingness to pay threshold, to name a few. Dimensional extensions allowed
the definition of metrics like party conversion velocity and acceleration useful in
determining the progression towards management targets.
Mathematically, a dimension is an axis or aspect of the expression of a subject or
object defined in the geometric form. It is the derived extent on measures, metrics,
moments, and coefficients of expression such as length, breadth, volume, height, to name
a few of a subject or objects assuming its geometric realization. Dimensional extension
represented these extents in the form of invariant quantities (or points) in an abstract
space allowing accurate inference, projection, simulation, and optimization of the
characteristics of the realized geometric form. In this sense, this extension applied to
subjects and algebraic rules governing quantities, such that, calculations and derivations
maintained correspondence with the properties of the subjects represented. It assumed an
abstract space of expression defined by the dimensions inherent in the available data in
which each record occupied a point in the space. The dimensional extensions provided
the abstract coordinate system for analytic exploration of a subject of interest based on
available data, allowing the manipulation of the numbers without concern of the units of
measurement underlying the properties under consideration.

106
The construction of a dimensional extension to the data model required the
abstract assignment of input and output features of the subject of interest, based on the
provenance of the subject or the objective of the analytic exercise. Output features
represent the result of the interaction of inputs. Consider, the input dimension elements
denoted as X1,..., Xp and the resulting response element denoted as Y0, the conventional
dimensional model became:
Y0 = f(X1,...,Xp),
Xis were the symbolic attributes or the features of the subject of interest standardized to
avoid mathematical issues with unit differences. f was the function expressing the
association of the two sides of the relationship.
Additional assumptions of dimensional extension included the base quantities
which constitute a subset of the inputs, denoted X1,...,Xt, where t ≤ p, to satisfy non-basis
quantities, [X0],[Xt+1],...,[Xp] expressed by the combinations of the dimensions of the
base quantities, [X1],...,[Xt], in the form of the power law. It is important to note that
basis quantities cannot combine dimensions of other base quantities. Furthermore,
assume that [X0] can be expressed by the combinations of [Xi] for i = 1,...,p, otherwise it
violates dimensional homogeneity. This assumption led to the existence of the basis
quantities that may not be unique or independent. To address this, the transformation of
the attributes uses basis quantities based on Buckingham’s Π-theorem. For example,
[Xi] = [X1]di1...[Xt]dit for i = 0,t + 1,t + 2,...,p.
Consequently, the transformed quantities are

107
Πi = Xi((X−di1)1···(X−dit))t for i = 0, t+1, t+2, ... , p
where
[Πi] = [((XiX−di1)1···(X−dit))t ] = [X1]di1...[Xt]dit[X1]−di1...[Xt]−dit = 1
The response function can be rewritten:
Y0 = f(X1,...,Xt,Xt+1,...,Xp).
Using Πi instead of Yi, the following expression resulted
Π0((Xd0)1 ···(Xd0t)t)= f(X1,...,Xt,Πt+1Xdt+1,1 1 ···Xdt+1,t t ,...,ΠpXdp1 1 ···Xdpt t),
and
Π0 = (X−d01)1 ···(X−d0t)t ·f(X1,...,Xt,Πt+1Xdt+1)1 ···(Xdt+1,...,ΠpXdp1)1 ···(Xdpt)t )
where f is the function to be estimated.
Or,
Π0 = g(X1,...,Xt,Πt+1,...,Πp)
where
Πi,i = 0,t + 1,...,p are quantities and
X1,..., Xt are considered independent of one another
Based on Buckingham’s theorem, Πi represented the final expression of the output
regarding the dimensions of the input.
Resolving the Research Questions
The research questions are restated here:
Research Question 1: Can data model extensions improve the discovery of
management scenarios from big data?

108
Research Question 2: Can data model extensions improve the formulation of insights
about the management scenarios?
Research Question 3: Can data model extensions express the complex constraints
and rules needed to compose the acceptable and actionable solutions for analysts and
executives?
Research question 1. To answer the research question 1, I examined the datasets
that resulted from the use of the extended data model for the management scenarios.
Within this data model, management scenarios were connections which expressed
associations between sets of data elements about resources (for example, products), and
agents (for example, sales representatives) in transactions (for example, sales
transactions) leading to business outcomes (for example, profit margin). These were
multi-dimensional association matrices of the semantic, symbolic, and dimension
attributes of the available data. Within the multi-dimensional association matrices, the
semantic attributes expressed degrees of similarity or dissimilarity to other values of the
property, symbolic extensions established the congruence of properties to each other, and
the dimensional extensions established the distance between relation instances.
Management scenarios, G*, such that each management scenario, G, was
represented as
(V, E = {𝐸0, 𝐸1, …, 𝐸𝑚 ⊆ (V xV)}),
a multi-dimensional relational matrix where
A ∈ {0 … 1}𝑛.𝑛.𝑛{0…1} and
(11)

109
𝐴𝑖,𝑗
𝑘 > 0 if (i, j) ∈ 𝐸𝑚: 1 ≤ k ≤ m or 0 otherwise
Thus, each extension data element E represented an adjacency matrix, and the
combination of m adjacent matrices formed a complete expression of the management
scenarios. Within this scenario space, the multidimensionality of the associations
characterized the different conditions that apply to the scenario. Each condition became
the unique path of connections with a unique set of functions and constraints which
mapped to unique outcomes. Using the analytically extended data model representing all
relevant multi-relational paths within the available data between all data elements, the
paths with the same starting point and end-point formed the scenarios when there are
discriminating combinations of initial value and end outputs. Based on this analysis, an
analytically extended data model provided the relevant scenarios for management
analysts and executives, through the extension attributes which connected inputs to
outputs. Simply, a scenario was the path from a specified input point to a specified output
point within the data model. The data model extension improved the discovery of
management scenarios from big data.
Research Question 2. To answer research question 2, I studied the type of
information any management analyst or executive would consider an actionable insight.
Important requirements of insight were explainability, interestingness, and relevance. An
insight was considered explainable if it was capable of being understood within the
domain of interest. The capability to understand represented the alignment of the analytic
results to the intuitive conceptualization of the subject of interest. That is, an insight was

110
considered explainable if it connected well-established concepts within the domain of
interest. When an insight revealed new connections and new concepts, the insight was
found to be interesting. An insight was considered relevant by management analysts and
executives when the connection to resources and agents had utility since these were the
items the management analyst or executive could manipulate to solve the management
case.
The extensions that connected the resource (for example, product, price,
marketing, customers), agent (sales representatives, customer service representatives,
product development, Pricing analyst) and transaction (sales) ontology elements
addressed explainability, interestingness, and relevance. At the data level, the insights
were the quantities that qualified the associations between the transactions and the
interaction of resources and agents that provided the management analyst with clarity on
where optimization opportunities existed in achieving the satisfactory outcome.
The extended data model captured the different levels of insights depending on
the analytic objective of the exercise. The insight was descriptive if it provided
perspective on current and historical occurrences. It was inferential when it provided
information on one situation for the estimation of another. For example, inferential
insight was diagnostic when it used existing information to provide a reason for an
ongoing condition. It was predictive inferential insight when it used information of a
current and past situation to make guesses about the future. The insight was considered a
forecast when it took into account a point in the time in the future for which these

111
assumptions could be realized all things being equal. The data model extensions
improved the formulation of insights about management scenarios.
Research Question 3. As noted above, constraints and rules were expressions of
different forms of logic. Constraints were logic of limits, and rules were logic of
associations or projections. Complex constraints and rules are, therefore, n-order logic, in
which lower order predicates or propositions were nested to create higher order
predicates and propositions. As stated above, the classical relation could be considered
the collection of first-order predicate logic at the attribute level, and first-order
propositional logic at the tuple level. Data-model extensions grouped and nested the
predicate and propositional logic in different combinations for the discovery,
identification, specification, and resolution of management problem scenarios. In the
extended data model, the logic of limits, associations, and projections were data points.
The data model extensions captured complex constraints and rules needed to improve the
acceptance of analytic outputs by management analysts and executives.
Application
This section contains the application of data model extension and extended data
analysis methodologies to a big data analytics project scenario in a U.S. based global
medical equipment manufacturer and distributor. A brief overview of the company and
management needs set the context for the analytic exercise. The primary goal of the data
analytics exercise was to identify the contributors to profit margin and overall growth of
the company. The company consistently missed its annual revenue and profit goals, so

112
management wanted the project to discover what was responsible for the situation and
provide a recommended remediation plan.
Case Overview
The company was a huge manufacturer and distributor of medical supplies,
uniquely positioned to provide products, education, and support services across the
continuum of healthcare. It marketed as much as 100,000 products, including hospital
furniture (bed, mattresses, seats, and tables of all types and specifications), durable
medical equipment, housekeeping supplies, exam gloves and garments, and many others.
Its customer base included hospitals, long-term care facilities, physician offices/practices,
home health providers, and retail outlets. For large customers, they offered inventory,
supply chain, logistics, technology and analytics and equipment customization solutions.
Its more than 11,000 sales representatives marketed the products and services through
some 200 distribution centers in 13 countries in North America, Europe, and Asia /
Oceania. It operated a delivery fleet for high throughput routes and used delivery services
to drop ship purchases as necessary. The company operated manufacturing plants in the
China and Singapore. Its manufacturing plant in the United States closed about five years
before this analysis.
Executive management was concerned about its stagnation of revenues and
profits. The profit margins were much lower than peers in the same industry. The
executive management considered its poor performance on key market valuation metrics,
for example, price per share, earning per share, price to earnings ratio, price change, price

113
change percentage, and market capitalization as indicative of the erosion of profit
margins. They believed that their forward guidance of the market was responsible for the
pessimistic view of the company by the market, the result being its low market valuation
and stock pricing. Management believed that a better attribution of the profit margin
would provide the tool to manipulate their operational activities to achieve higher levels
of profitability which should command market valuation that was better than its peers.
The prevailing belief was that the company had a pricing issue, much more than a
cost issue. An earlier profit strategy study proposed revenue estimates, targets and
forecasts based on price increases and commission reductions only. Management wanted
validation of these strategic proposals, quantitatively. They also wanted to design
programs to achieve a consistent growth of the company and increase product footprint in
existing and new customers over time which would translate into a higher market
valuation of the company. They needed a comprehensive solution that can achieve profit
margin expansion while minimizing the downside impact of price and commission
changes on the customers and sales force.
Data
The enterprise transaction processing system (SAP/R3 Enterprise Resource
Planning (ERP) system) of the company was the primary data source for the study.
Additional data sources included data from GHX Market Intelligence, Distribution
Feedback Reports, and Health Product Information System (HPIS) data which was the
source for standardized health care product codes, along with competitive and

114
complementary product information. Also, reports generated to support sales, customer,
pricing, and product management contained information needed for analysis. Many of
these reports were monthly and quarterly snapshots which had been saved off as
documents for management use. Examples were active account reports provided as
active_account.xls, Credit analysis by Reason Code report, provided as Credit analysis by
Reason Code report.pdf, and so on. The data were representative of the complexity of
enterprise data in modern organizations. Table 5 contains the summary of data assets in
the study.
Table 5
Study Data Overview
Item
Value
Comment
The total size of data
15 terabytes
(TB)
Considered Very Large Data Set (VLDS) for analytic
modeling
Total number of fields in
all data sets
700
A large number of fields means that the dimensionality
of the dataset would be very high, which would make
computability difficult
Number of datasets
137
All data sets would be linked to compose a complete
universe of data asset for the analytic modeling
exercise
Number of sales
transaction records
1.7 billion
A large number of sales transactions means that the
observation set for the analytic case of very robust, and
it is likely to reflect the different mechanisms and
subjects that underlie the data generation process
completely
Timespan
3 years
More than one business cycle for analysis since
systems aligned well with the calendar year

115
% of numeric attributes
30
As much as 210 numeric data elements are available as
candidate variables
% of character attributes
70
As much as 490 characteristic variables are available
candidate variables
The range of character
attribute levels
1 – 5,000
A large number of levels of the natural classes, and
potential explosion of dimensionality and contraction
of degrees of freedom
Range of numerical
attributes
-100,000 to
+5,000,000
A large number of the cardinality of numerical
attributes. Negative numbers meant quantities or
money flowing in the opposite direction of what was
expected. For example, negative order quantity was
order quantity returned by customers, negative
payment amount was amounts returned to the
customers
The total data size was 15 terabytes, made of 1.7 billion sales transactions over
three years. A total of 139 datasets and documents were available for the analysis, with
358 data elements. A ratio of 3:7 of numeric to characteristic attributes. The characteristic
attribute levels ranged from 1 to 5,000, while numeric attributes ranged from -100,000 to
+ 5,000,000. Table 6 shows this diversity of data assets.
Table 6
Data Formats in Input Dataset and Documents
Data asset Type
Data Asset description
File source
# of data assets
DAT
Database output file
ERP data archive
1
DBF
Database file
ERP system
59
Mdb
Microsoft Access Database file
User Application
1
Xlsx
Microsoft Office 2000 Excel
File format
Extracts from ERP and other
systems
1
Xls
Microsoft Office Excel File
format
Extracts from ERP and other
systems
20
CSV
Character separated values file
Extracts from ERP and other
systems
2
PDF
Adobe Acrobat Portable
document format file
Internal and third party reports
16
RAR
Compressed file
Data file archive
14

116
SPOOL
Database or Application output
file
ERP and other applications
1
DOC
Microsoft Office Word File
format
Reports and analysis
1
DOCM
Microsoft Office Word Macro
File format
Reports and analysis
1
TXT
Text file
Extracts from ERP and other
systems
23
Total number of data assets
140
As noted in the table above, available data also included several documents with
unstructured or semi-structured information. The documents contained information
needed for the analysis, so it became necessary to extract this information from the
documents. I converted PDF, DOC, DOCM documents to unformatted texts documents
before using the Open SourceText Mining algorithms within Pentaho Data Integration to
process and ingest the data into the PostgreSQL database, which was capable of handling
structured, unstructured, and hierarchical data representation. The conversion of the
different data formats were vital activities of the data analysis process. The meticulous
process of converting the non-structured data assets into structured data facilitated their
integration with the structured data was an essential and significant undertaking. It is
worth noting that the need for a document database like MongoDB or Graph database
like Neo4j did not arise as the relational database selection had capabilities of handling
these structures as relational constructs.
Appendix A displays the data use agreement obtained from the study showing the
detail list of available data. Table 6 summarizes the data formats used in the study, and

117
Figure 3 shows the data diagram of the data-files, documents, and database extracts. The
data diagram guided the arrangement for further data model development, by organizing
140 different data assets (data files, database tables, and documents) into a scheme with
the linkages between the data assets. The diagram highlighted data assets from the SAP
R/3 ERP system, which contributed most of the data. The non-SAP R/3 data assets
included those from GHX Market Intelligence, for example, Distribution Feedback
Reports and HPIS product data.
The data diagram represented groups of data assets with similar structure and
source. The items in the box were the instances of data assets. For example, SALES
ORDER data were in data sets of monthly data because of the size of the files, so were
pulled into a single group. In this situation, it was necessary to break up the extraction
process into monthly chunks for massively parallel extraction routines which minimized
the window needed for the extraction process.

118
Figure 3. Study data asset diagram.

119
A significant number of the data files provided for the analysis contained sales
order data (59 data files). Distribution feedback reports from an external source came in
14 files, and price history data came in 9 files. These three data file groups made up the
top 3 datasets for the analysis.
Data Modeling
Base Relational Model. Each data file group was further processed to identify
entity or entities it contained using the entity recognition (ER) algorithm described in the
data collection section above. The ER algorithm produced classical and associational
relations in a 3rd normal form with its primary key column and any foreign key columns
identified. This output generated the data model made up of 30 entity relations, connected
by 32 referential constraints. For the data dictionary of the data model, see Appendix B.
The generated data model addressed cardinality between the entities of the data
sets within and between the datasets, as well as duplicates in the join keys that can
inadvertently result in Cartesian unions. The data model brought together the available
data from different sources and domains into a rationalized framework addressing data
integration issues.

120
Figure 4. Study data model.

121
Data model extensions
Semantic extension of the data model expanded the attribution of relations for
characterizing profit margin of sales from the universe, shown in Appendix E. I derived
semantic extensions for each of the non-numeric attributes. I encoded the attribute
relations to capture occurrence and non-occurrence of the attribute value. The figure
below illustrates an example of semantic relations for PAYMENT ADVICE and the
SALES ORDER PRICING relations including, BILL TYPE, BILL DATE, SALES
ORDER TYPE, SALES OFFICE, SALES ORDER REASON, PLANT, PRICING
CONDITION CODE, PRICING DATE, and SALES UNIT OF MEASUREMENT. The
use of these semantic relations generated matrices of Boolean, nominal, ordinal, or ratio
scale values of the underlying subjects within the sales domain.
I further extended the data model by adding symbolic elements. As noted in the
section above, these symbolic elements are specific to the analysis problem under
consideration. I determined items derived from domain of interest, listed in Appendix D.
For example, the symbolic extension for the ORDER entity captured the additional
attributes, for example, price blocks, returns (orders with negative sale amount),
promotion sales (sale with special price type), samples (sales with zero amount and
pricing type is sample), new sales reps (sales reps with tenure less than 1 month),
specialized sales reps (sales reps with doctorate degrees for specialized equipment
demonstrations and sales), and so on and so forth.

122
Finally, the dimension extensions captured the further expression of the enterprise
as abstract units. For example, the frequency of the order, order to order size change,
order to order price change, change in price impact on customers, price change impact on
orders, and so on were dimensional extensions. It is typical for these expressions to be
dimensionless (i.e., devoid of units) so that their applications are not constrained, and so
that the quantities represent the absolute value of relative quantities. Ratios, percentages,
coefficients, moments were used to formulate them in the data model. The final analytic
data model resulting from the implementation of the extensions discussed above for
margin expansion and growth was extensive, and too large for display here. Using the
extended data model, I constructed datasets that made the profit margin the subject of
interest or the outcome (target or dependent) variable of the data model. All other
classical attributes and the analytical extensions derived from the available data were the
indicator or input variables. Appendix I shows the catalog of analytic processes that are
useful for continued formulation the management problems and solutions to arrive at the
results in the management analysis and recommendation discussed below.
Management Analysis and Recommendations
Figure 5 below shows the conceptual determinants of profit margin, along with
their interaction effects. I constructed the determinant from analytic extensions of the
base data model. To determine the contribution of the different attributes to the profit
margin, I utilized a random forest regression method. This analytic formulation method
was selected since profit margin had a noncontinuous, nonlinear association with

123
attributes within the management domains. As shown in the figure, there were no
dominant contributors to the profit margin levels in the available data. The factors
contributed between 1.98% and 3.50%, as such management intervention had to be broad
to achieve any effect.

124
Figure 5. Profit margin determinants
124

125
Figure 6. Summary of determinants by management area
The summary of the determinants of the profit margin by the different
management areas showed marketing the lead contributor. The others area in order were
pricing, customer and finally product management areas.
The profit margin coefficients estimated the impact of each of the concepts in the
figure below. I, also, extracted these contributions using a random forest regression
algorithm.
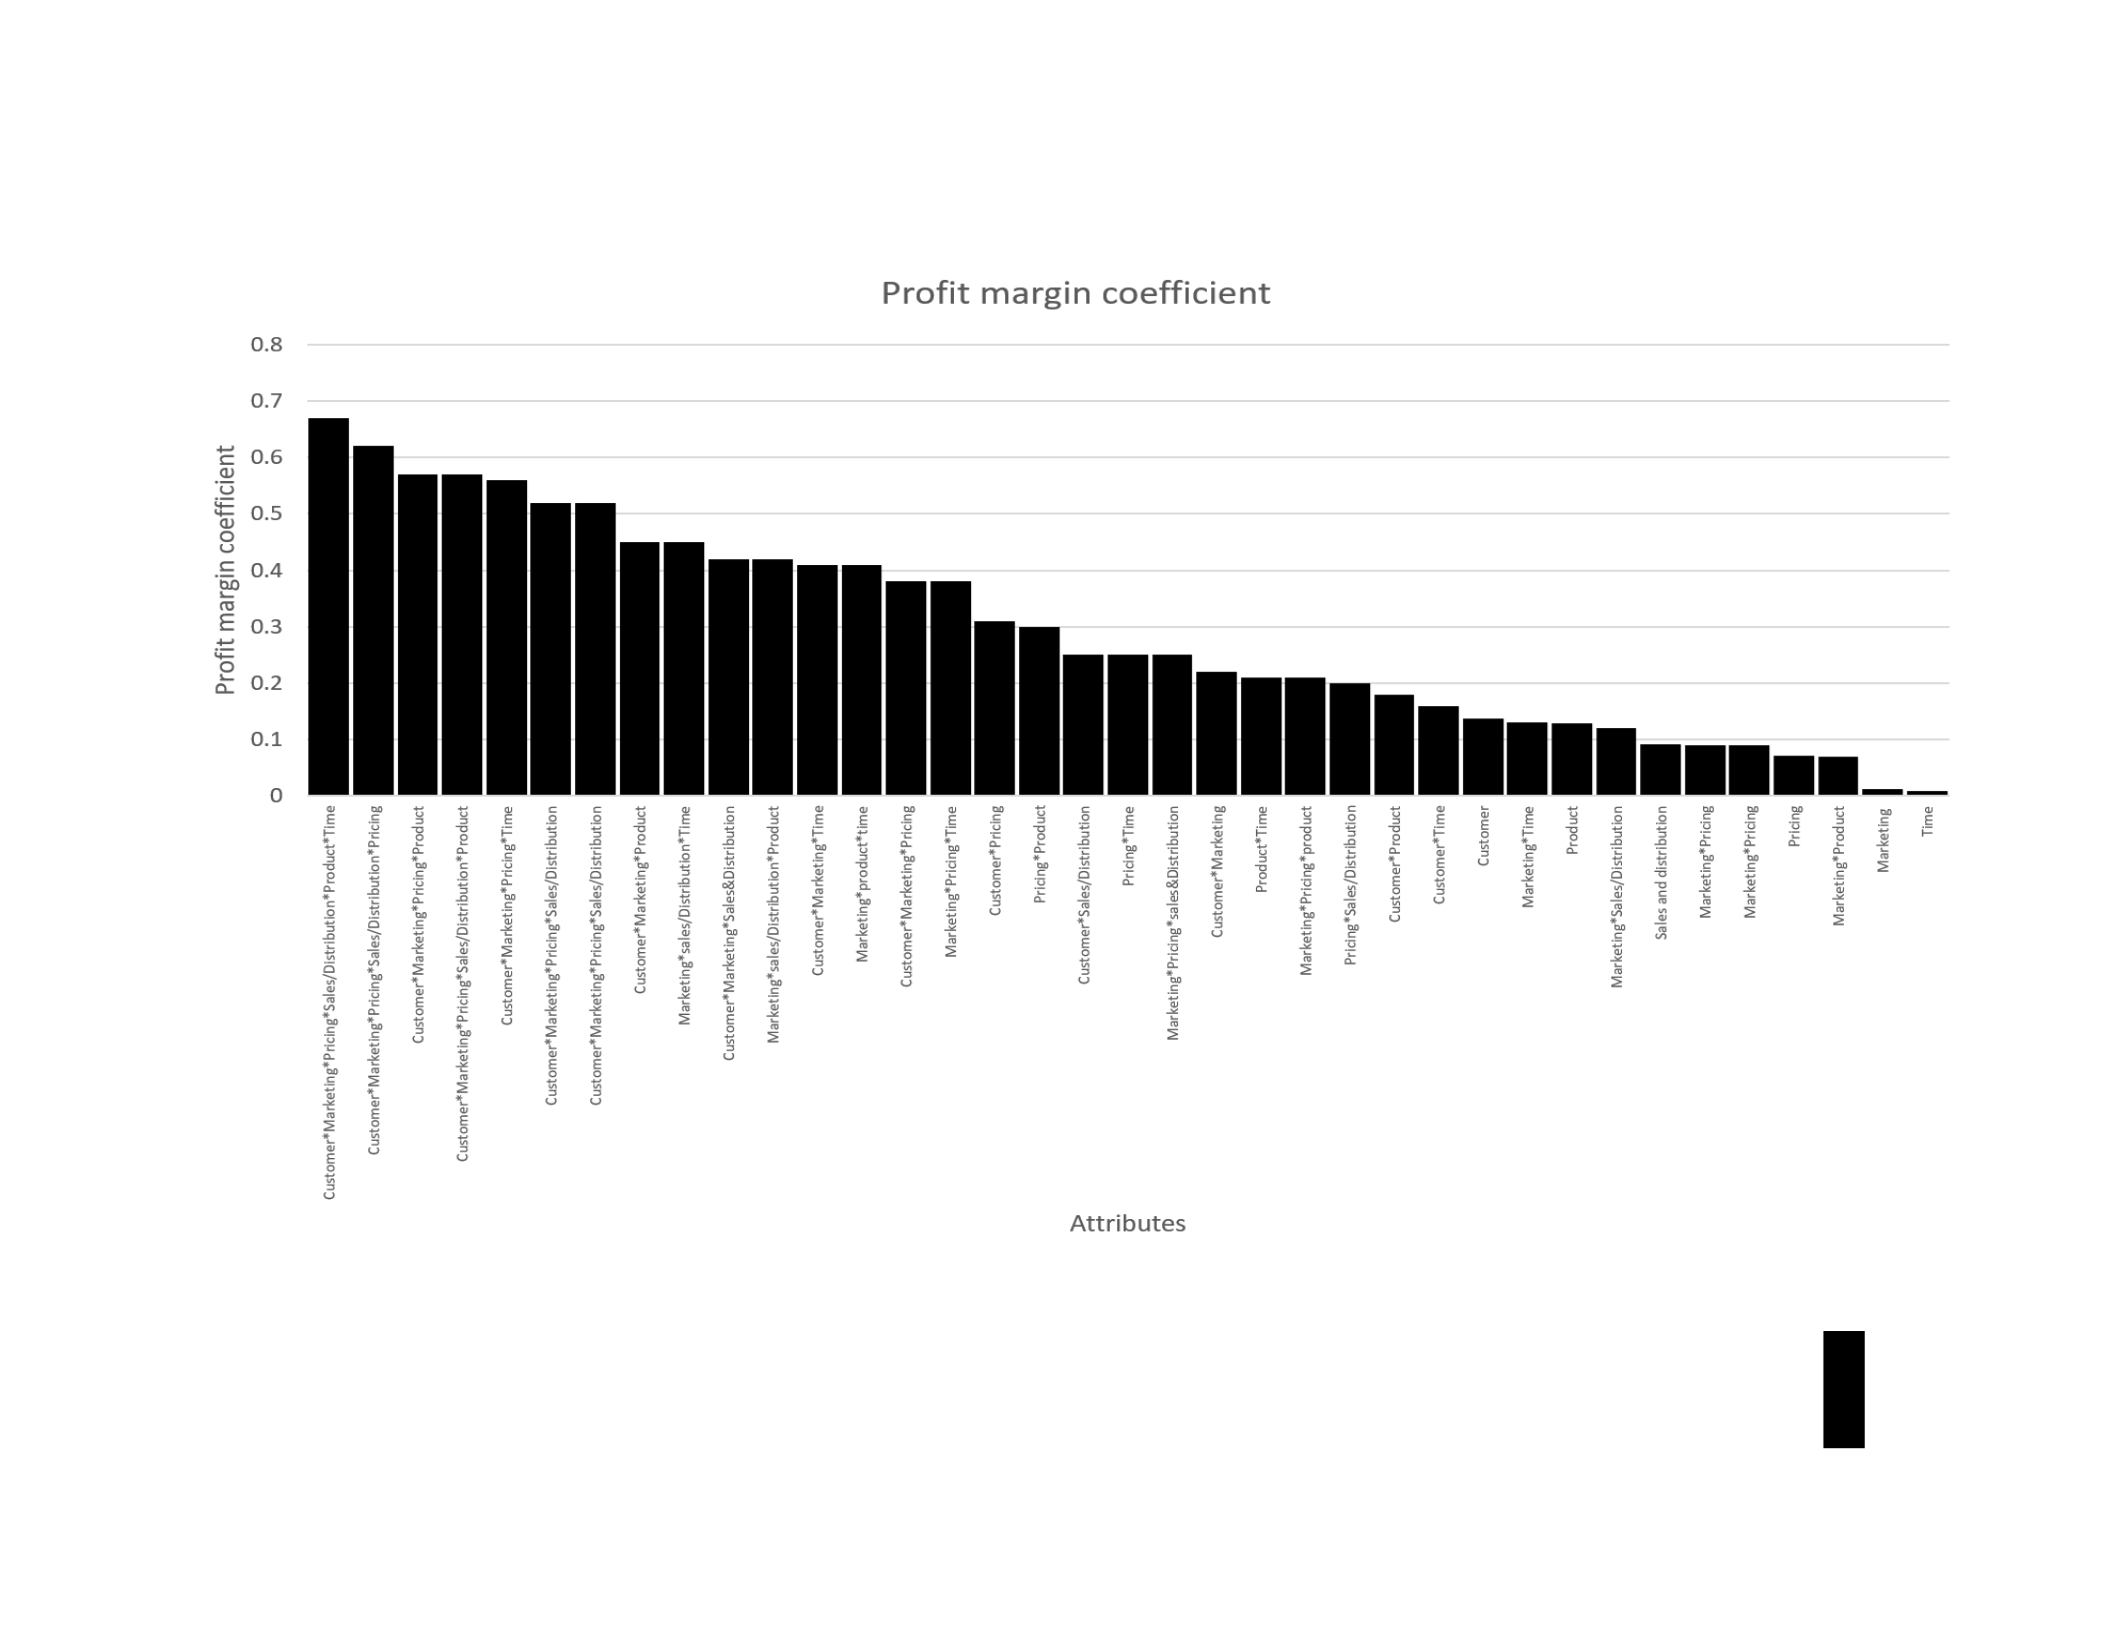
126
Figure 7. Profit margin coefficients
126

127
Figure 8. Profit margin coefficient by management area
Figures above show the impact of the concepts on profit margin level
(determinants) and the profit margin change (coefficients). The determinants identified
the critical aspects of the business driving profit margin levels. The profit management
coefficients identified the contribution of each management area to the increase in the
profit margin. Combining these two measures created the following order of influence on
profit margin: marketing, customer, product, pricing, and sales/distribution management
areas as shown in the pie chart below.

128
Figure 9. Management area influence of profit margin
The following charts show further decomposition beyond the management areas
based on the key concepts derived from the ontology learning, data engineering and the
analytic formulation methods against the available data.

129
Figure 10. Bar chart of customer management area details
Figure 12 above represents the decomposition of the customer management area
into the concepts discovered in the area. Within the customer management domain, the
most important contributor to the profit margin was the customer size based on their
revenue. There was also the tendency for sales agent engagement with the customers to
produce orders, especially, when the company collaborated with the customer to develop
specific products for the customer, for example, special hospital beds for geriatric
patients and disabled patients and so on.

130
Figure 11. Bar chart of pricing management area detail
The pricing management area decomposition identified the impact of different
pricing concepts. The price elasticity, relative price of a product to comparable products,
the type size price differential as well and the revenue leakage based on pricing policies
all impacted profit margins and profit growth.

131
Figure 12. Bar chart of sales and distribution management area details
A look at the sales and distribution management area revealed that the primary
concept impacting the profit margin was the sales representative promotional
performance. These were promotions initiated directed by the sales agents in
collaboration with the sales and marketing team. The average margin per sales
representatives was significant the overall profit margin. Also important was the
preferences expressed by the sales agents related to the products they were responsible
for driving sales.
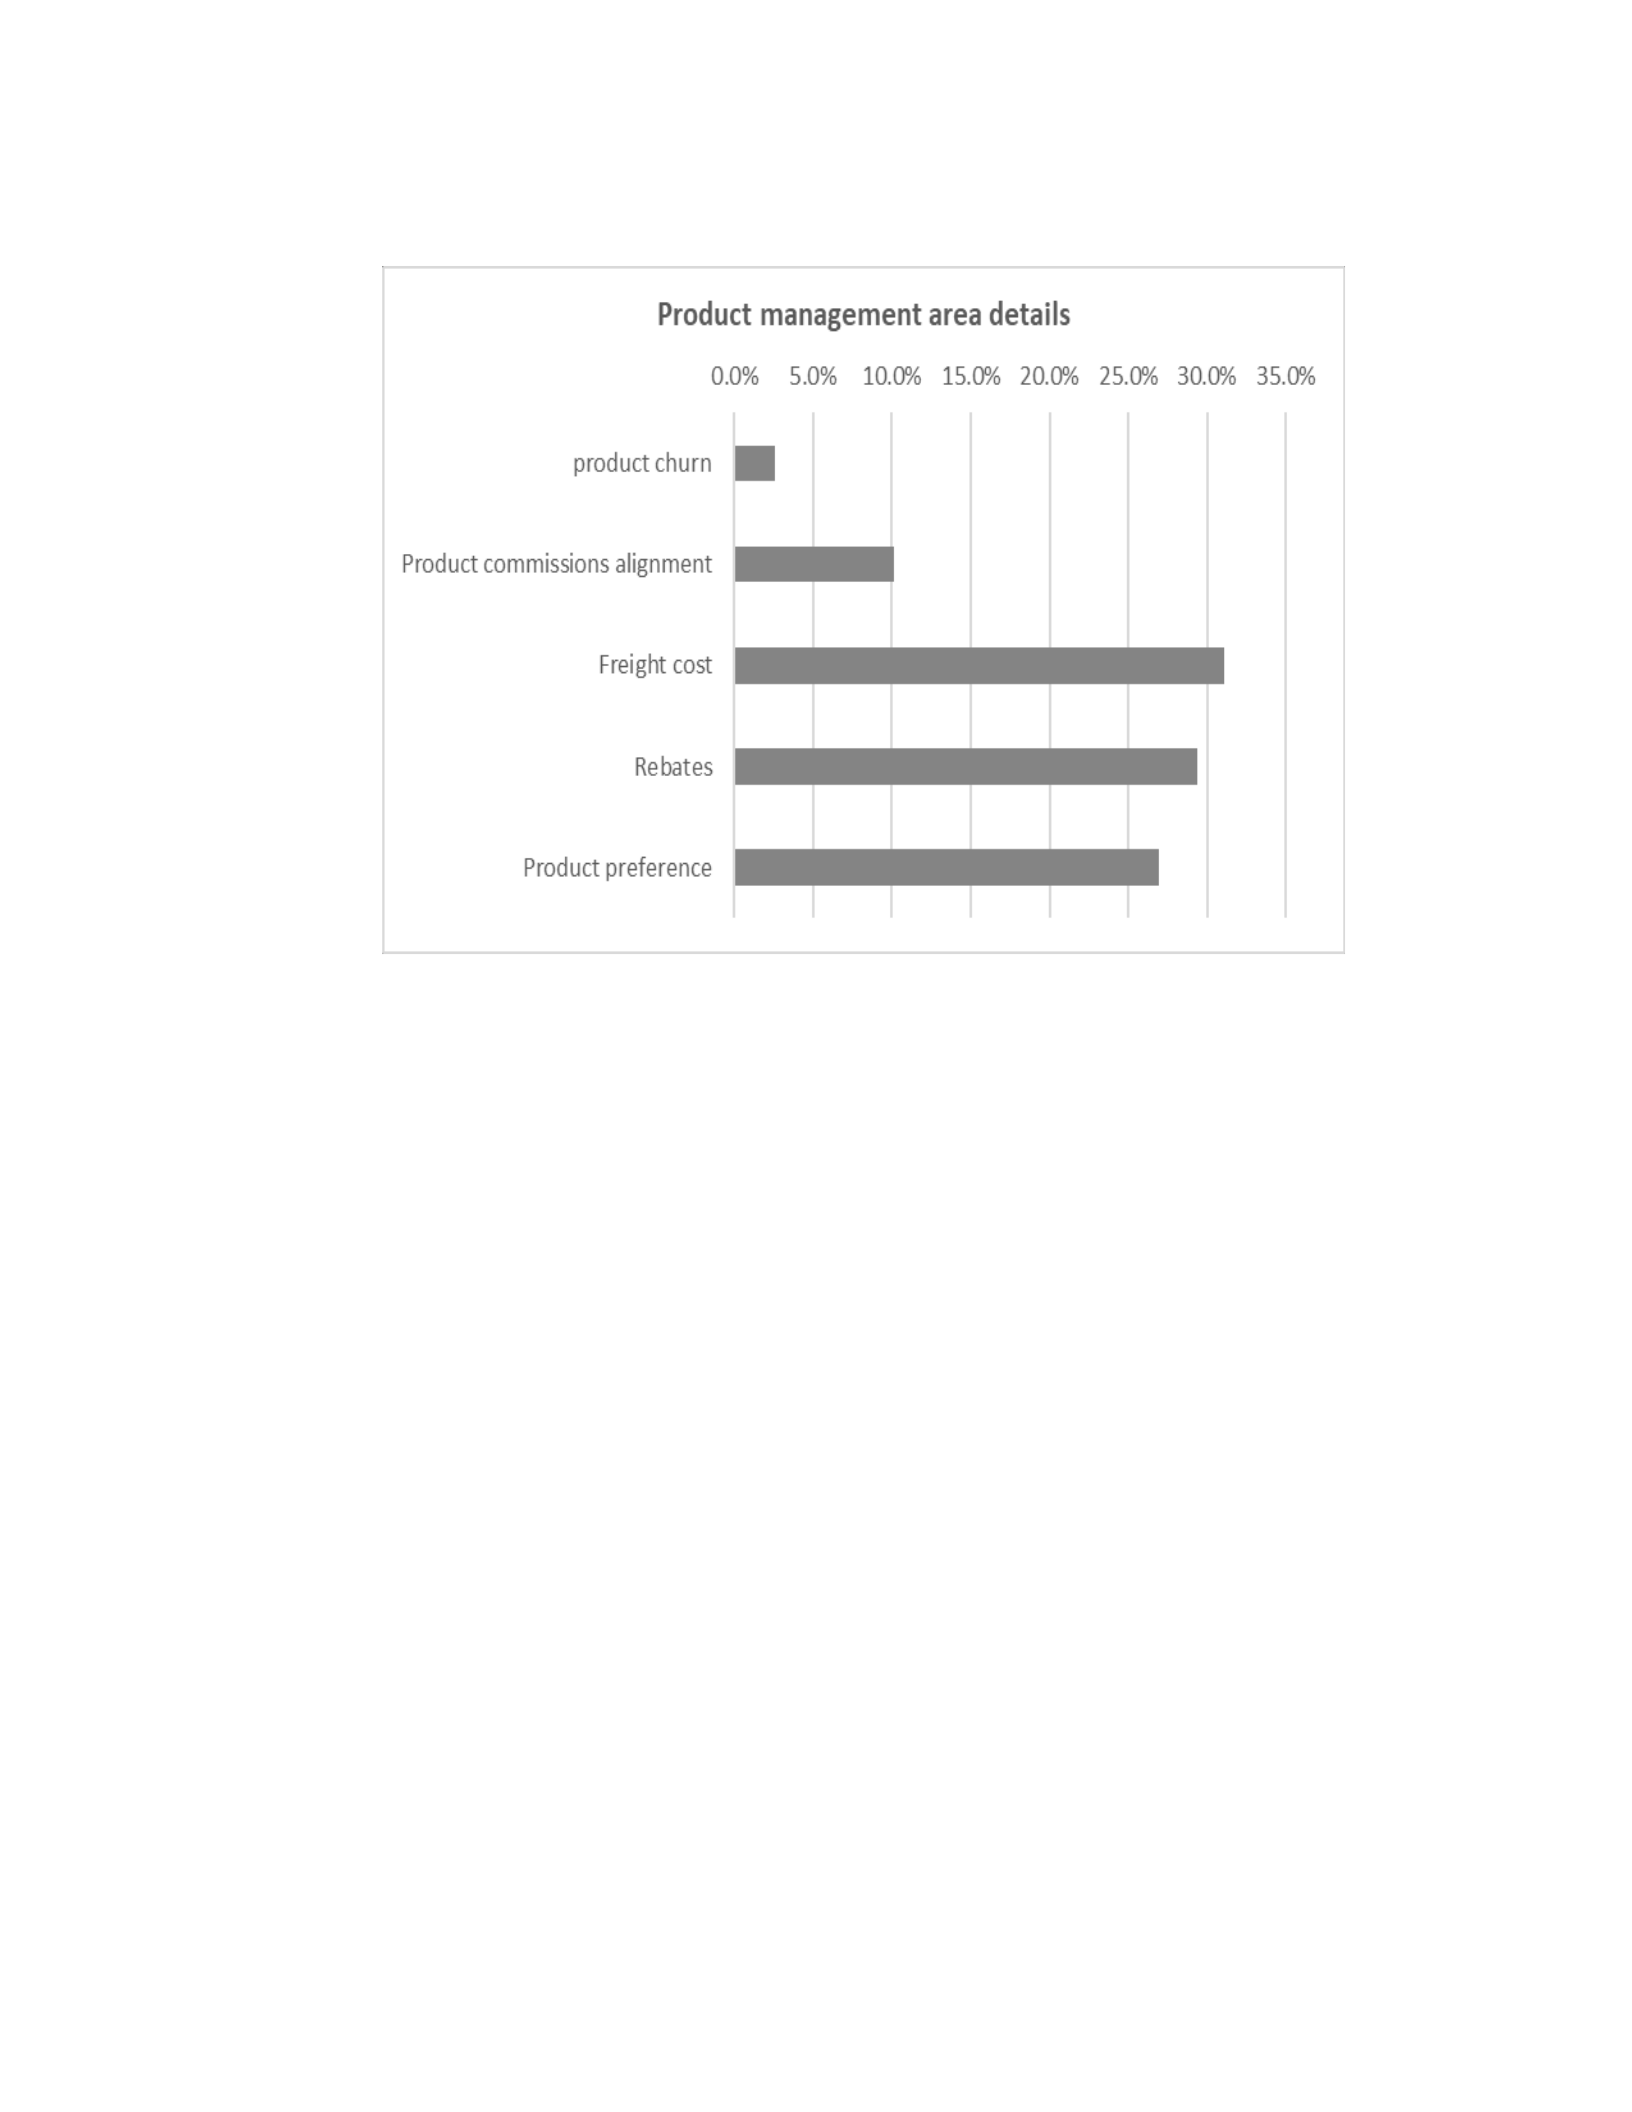
132
Figure 15. Bar chart of the product management area
The product management concepts of importance where the freight cost which
seemed to add to the overall invoiced cost of sales, rebated products was also critical to
the profit margin improvement of the company. Rebated products were products that
were distributed by the company. The rebated products turned out to better priced than
products the company manufactured.
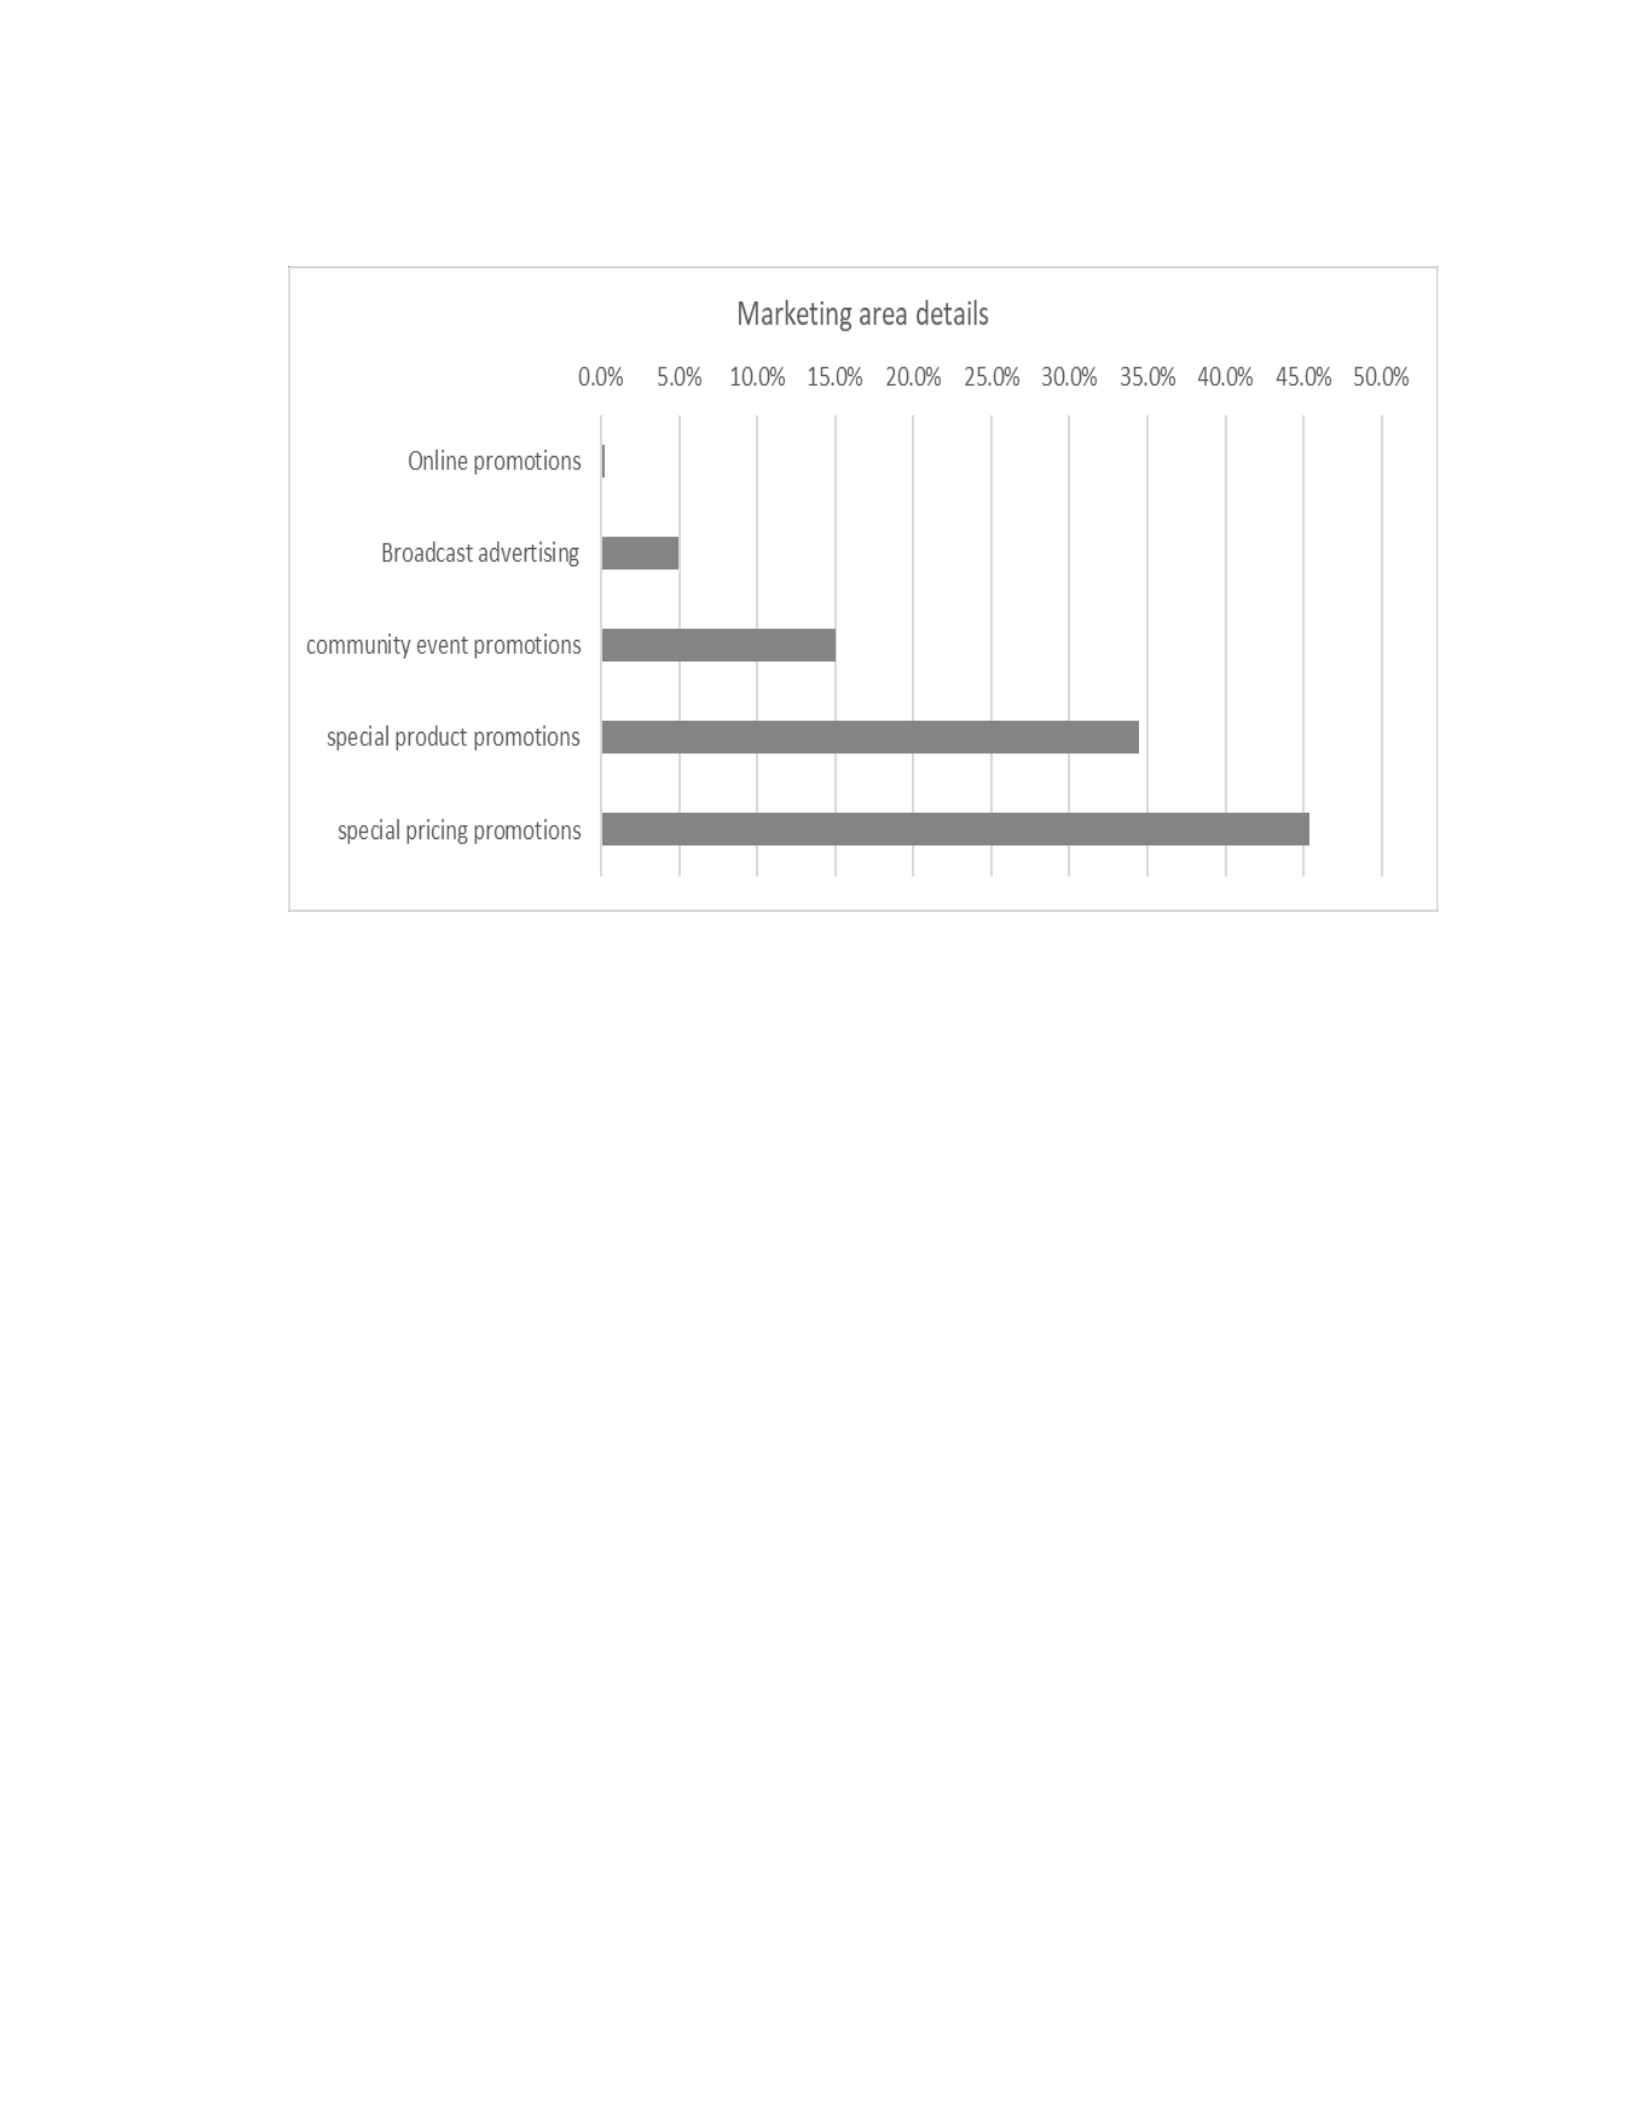
133
Figure 14. Bar chart of the marketing area details
Marketing area details showed most important concept in this area was the special
pricing promotions conducted by the company, followed by the special products
promotions. Also important was promotional activities at community events.
Based on the analysis conducted on these management area concepts the
following programs were recommended for implementation. Each program had well-
defined outcomes expectations:
Special pricing and product promotions with sales representatives – The
management analysis above indicated that marketing contributed poorly to the profit
margin growth. It also highlighted the most effective marketing promotions in achieving
improvements in profit margin to be special pricing and special products promotions
conducted with the sales agents within each of the sales territories. This program

134
proposed a marketing process that gathered input from the sales representatives in each
territory to determine the best approach, the product and the potential prospects to target.
The manager of each of the sales territories established targets for the number of
promotions to complete and the return on investment to target for continued investment
on marketing within that sales territory. This program also identified companies to target
for marketing, sales, and investment activities. It included actual investment in customers
by extending products credits and allowing tiered payment cycle of 3, 6, 9, 12, 18, and 24
months to help improve the cash flow situation and growth of customers.
Group pricing arrangement and rebating program –This program administered group
discount pricing arrangement to ensure compliance. The program monitored the volume,
identifying customer groups that did not meet agreement for a rebalancing of the price to
the actual volume. If the group exceeded the volume arrangement, rebate or credits were
triggered. Not meeting the conditions of volume arrangement triggered reverse rebate or
debits from the customer to the company. This program improved margins by 13% in the
first year of implementation.
Onsite supply management program expansion: This program was implemented
for the very large clients, to ensure retention. The company accepted responsibility for
supply management, for exclusive multi-year supply arrangements. This program became
so popular that it became a standard offering of the company. This program resulted in
20% increase in product penetration in existing clients, as well as 80% retention of
rapidly growing clients

135
Pricing block improvement program: This program addressed the problem of the
price blocks which occurred when the offer price is much below the standard price. The
sales representatives used this to lower the price so they can get a volume that allowed for
their commission to be competitive. Price blocks also delayed the delivery of items to the
customer who added to challenges of customer satisfaction. This program established the
policy that all price blocks should be cleared within 1 hour of the occurrence of the block
by the sales representative or escalated to the Regional pricing manager. This lead to the
recapture of an average of 7% of the profit margin which was eroded by price blocks.
Product manufacturing improvement program – this program targeted
manufactured products to determine how to make the manufacturing more competitive.
The target was for products manufactured by the company to be cheaper by about 20% so
these products can compete effectively. This lead to many manufacturing strategic
decisions, including outsourcing of manufacturing operations which allowed the
achievement of the objective of getting manufactured products to 20% of the cost of
comparable distributed products
The case overview showed that using analytic extensions to the data model to
derive semantic, symbolic and dimensional attributes related to the profit margin
problem, it was possible to apply advanced analytic processing techniques to discover the
management scenarios underlying the problem. Though the business problem was vague,
using the analytic extensions to enhance the data model, I was able to construct analytic
attributes to represent the concepts described in Appendix D. These concepts like

136
customer size, customer tenure, customer payment behavior, and many others were better
at representing the management scenarios responsible for the problem. In relatiom to
research question 1, these data model extensions improved the discovery of the
management scenarios of underlying problems from big data.
Using the management scenarios discovered, it was not very difficult to connect the
management scenarios to management insights needed to address these challenges
imposed by the scenario. In the case above, the insights about marketing that led to the
recommendation of special pricing and product promotion campaign with the sales
representative at key clients was from the finding that this integrative approach to
marketing contributed more to profit margin than other forms of promotion. About
research question 2, the data model extensions and the additional analytic processing
improved the insights about the management scenarios, and provided credible
explanations and solutions for the problem under consideration.
The use of analytic extensions enabled the construction of attributes that captured
complex rules and constraints needed to represent the domain knowledge. Analytic
attributes like order to order interval, order to order quantity change, order to order price
change, and many others allowed the capture of the complex business rules and
constraints related to the behavior of the different participants in the transactions. Also
special policies related to price block management were reflected in the data by
identifying transactions in which these policies contributed negatively to the management
situation under consideration. Therefore, the answer to the research question 3 was that it

137
was possible to use data model extensions to represent complex constraints and business
rules needed for the composition of acceptable and actionable solutions for analysts and
executives.
Summary
In the study, I demonstrated that the use of the analytic extensions improved
discovery of management scenarios, insights about these scenarios, and the representation
of complex business rules and constraints needed compose acceptable and actionable
solutions for business analysts and executives The use of analytic extensions supported
the realization of quantities for management analysis. The approach expanded the
representation of information for management analysis and reduced the complexity of the
model. Using different analytic formulations, I was able to define and operationalize
critical concepts within the management domain needed to formulate solutions for
management analysis and decision-support. The concepts I derived and quantified using
analytic extensions to the data model captured difficult and complex conditions and
constraints existing in the domain of interest for analytic problem-solving. Management
problem-solving required the design and execution of business and technology programs
to address the conditions and constraints within the enterprise preventing the achievement
of desired outcomes. The need to improve the utilization of data in the design of
management processes continued to increase with improvements in data gathering,
storage, and retrieval techniques. Through significant work had been done in the
construction of statistical databases for very large datasets as well as in knowledge

138
discovery from databases, using data models to formalize the data architecture for these
solutions remained a gap.
In this study, I worked on extending the classical relational data model with
attributed with specific ontological commitments using semantic, symbolic and
dimensional expression forms. While the classical data model saw the attributes as a
primitive expression of the subjects within the enterprise domain, this approach of
implementing extensions to the data fostered the capture of concepts which represented
patterns, profiles, features, and facets directly within the data model.
This approach to the extension of the attribute space simplified the analysis of the
contribution of the different elements to the behavior of the domain of interest. An
illustration of this approach to management problem solving in the medical products
distribution company led to recommendations that were well accepted by analysts and
executives in the business. The programs included special pricing and product promotion
campaigns with the sales representatives to expand market share, group pricing
arrangement and rebate program monitoring to minimize profit leakage. Other
recommendations included Onsite supply management program to increase customer
loyalty, active price block administration to minimize inadvertent underpricing and
overpricing scenarios, and product manufacturing process evaluation to target
manufacturing cost for some of the products that were being cannibalized by rebated
distributed products.

139
These recommendations aligned to the intuitions of the business analysts and
executives. The approach avoided the issue of the use of esoteric technical and
assessment methods with limited business and management value. In empirical
management analysis, there was no value in comparing the results to chance or
theoretical distributions to determine the significance of the problem or the outcome
expectation. In classical research, the statistical power and significance of the variables
are basic requirements. Using the data model, I was able focus analysis and
recommendations on business impact of the attributes within the management domain.
The validation of business effects of attributes was critical for the executive decision
maker. These business effect estimates were important drivers of the design, execution,
and administration of management programs that transformed the company to
profitability.

140
Chapter 5: Discussion, Conclusions, and Recommendations
Introduction
The purpose of this quantitative nonexperimental descriptive DBR was to
examine data model of a typical enterprise data analytics project to determine data model
extensions that would improve the formulation of management problems for analytic
processing. I focused on a typical data analytics project in a modern data-rich
organization. These projects dealt with very large and complex analytic scenarios
expressed with big data. The management analysis and decision-support requirements
were ambiguous and sometimes unknown. This situation made the classical data analysis
process and analytic processing techniques unsatisfactory. Hence, there were high levels
of failure of these projects in the fulfillment of management needs to resolve business
problems through well-informed recommendations that were acceptable and actionable
by management analysts and executives.
In this chapter, I interpret the findings and the limitations of the study, followed
by recommendations for further studies into the business knowledge discovery and
modeling for management analytics and decision-support research. I conclude the chapter
with a summary of further research opportunities for data analytics and decision-support
in management.

141
Interpretation of Findings
Contribution to Knowledge and Research
In Chapter 2, I reviewed the literature on data-modeling for analytic processing. I
also discussed the challenges of increasing complexity of the data and the size of analytic
scenarios in data analytics projects.
The data analytics started with the static composition of data as reports and the
use of reporting databases. The static outputs evolved to more functional expression in
data warehouses, data marts, and business intelligence systems. In the last decade, more
sophisticated analytical expression based on statistical and mathematical methods in
software packages provided important advancements to the data analytics practice. The
most recent progress has been in programmatic or computational expression using
algorithms to evolve logic from associations within the data.
Despite this progress in analytic solution development, challenges remained in
knowledge discovery, business intelligence, and decision-support for management
problem-solving. Significant gaps existed between data, management problems and
analytic solutions proposed. In this study, I demonstrated an approach to the problem
with big data analytics with progressive transformation of the data and the creation of
extensions to the data model for management problem formulation. This approach also
allowed management analysts to apply the analytic insights in the composition of
solutions for management problems. In this study, I emphasized the data model to
establish the boundaries of analytic transformations and search for associations in the

142
data. The absence of this analytic transformation boundary was the critical gap with
existing algorithmic analytic processing approaches, which tended to create solutions that
were difficult to translate to management programs which were needed to address
business problems.
The confluence of big data, advances in analytic algorithms, and abundance of
computational power provided the opportunity for transparent enterprise empirical
modeling for intelligent management. This situation buffered issues, like (a) concerns of
representativeness from using part of the data (sampling), (b) the need for theoretical
distribution to estimate parameters or probabilities (curve-fitting), (c) the curse of
dimensionality requiring variable selection, (d) the need for data fabrication or imputation
of missing values to fill gaps in the data, and (e) the need for data reduction to match
computational power availability that are important considerations on existing data-
analytics projects. With these advances, the primary challenge of research in applied
management and decision science becomes the design of data analytics processes that
overcome legacy scenarios of limited data and computability. The approach to the study
of this problem was to extend the data model to enhance the expressiveness of the
underlying schema for the formulation of management problems and the design of
solutions to these problems. The analysis indicated that this approach improved all types
of analytic solutions developed to support management.
Data solutions supported the creation of the exact schema for the problem and
solution scenarios. Analytic extensions to data solutions improved heuristic solutions by

143
enabling the discovery of exact rules to replace approximate rules of heuristics. It also
benefited analytical solutions which depended on exact theorems (or formulae, functions)
by identifying the right combinations of propositions that make up the theorems.
Numerical and computational solutions’ dependence on exact procedures and algorithms
required on proper representation of the information in the data model to support the
different permutations of logic that make up the algorithm. In general, data models and
their extensions enhanced the creation of relevant schemas with relevant rules and
theorems and connections, which improve the algorithms and computational solution
generation.
Enterprise data was fraught with complexity imposed by the data generation
process including the lack of explicit connection between cause and effects, functional
dependencies and associations. Data model extensions provided the tools to realize these
embedded features for management problem-solving. Accurate insights on the
performance of enterprise functions on value delivery to the marketplace were critical to
sustaining viability. To this end, the perspective of enterprise outcomes should neither be
completely random nor completely systematic. If the former were the case, management
would be at the mercy of nature, locked in a game of chance, governed completely by the
statistical and probabilistic processes. Conversely, if the latter were the case, management
would be a pure game of quantitative choice governed by deterministic mathematical and
numerical processes.

144
The findings of this study support the consensus in the literature that management
is a game of strategy involving the creative design of enterprise programs to guide the
interaction of resources and agents to create events and transactions for the fair exchange
of goods and services (Colman, 2016; Weirich, 2017). The formulation and execution of
this game were, therefore, the most critical activity of management, and defined the
management actions in specific problem-solving situations.
Technically, management problems are constrained optimization problems of the
form:
∫
These were problems of integration of functions that minimize or minimize multiple
objectives subject to constraints. The resulting complex Lagrangian functional
represented the generalized coordinates with partial derivatives expressing changes in
underlying variables and interactions over time. Figure 17 shows a conceptual diagram of
its data model.
min|max f(a, b, …)
subject to g(a, b, …) >=0
(10)

145
Figure 14. Generalized data model for the management problem formulation.
Note: a – attributes; c – coefficients, b, d – constraints; u, l – boundary data
Essentially, the data model was sets of attributes, coefficients, constraints,
constants, and controls for each objective within the management domain. Because many
of these were not the natural attributes of the domain of interest, their derivation
depended on evolving them from data available, hence the need for the data model
extensions.
Contribution to Data Analytics
As noted earlier, the use of schema-based analytic solutions was responsible for
the rapid adoption of data warehousing and business intelligence systems in the last
decade. The functional reorganization of data resulted in the adoption of analytics and
decision-support technology in the enterprise. Differentiation of relations into fact and

146
dimension relations provided rearrangement of the data for exploration. Unfortunately,
their implementation in OLAP tools limited the application of advanced analytic
programming.
The approach of analytic extensions to the relational data model discussed in this
study overcame the constraint imposed by OLAP. With these extensions, the
reorganization of the database schema was unnecessary. The additional translations of the
data were layered onto the basic relational data schema, to enhance the representation of
the underlying information. These layers of transformation contain the semantic,
symbolic, and dimensional attributes needed to express similarity among values of the
property of a relation, the congruence between two or more properties of a relation or the
association between two or more relations in the data model.
The semantic extension focused on the logical continuation of values of the
attributes and expressed the atomic concepts of the data. As discussed in the previous
section, this involved implementing a data encoding process to derive variables which
continue expression of concepts as arrays or vectors. This extension eliminated the fixed
fact and dimension relations. Semantic extension considered any attribute as a fact or a
dimension depending on the objective of the analysis. Analytic problem solving became
much more flexible than currently possible with the OLAP multi-dimensional data
model. These extensions allowed question-answering regarding values of the attributes
represented by the data.

147
The focus of the symbolic extension was on connecting classes to alternative
intentional logic to expand their expression. This extension was useful in imposing
equivalence over property expression space to answer complex questions. That is, this
extension organized data for the interpretation of association of the sets with breaks in
semantic continuity but where there was congruence. The extension was akin to
organizing characteristics of various levels or states of expression of a dynamical system,
such that each level or state was a shift from another level. Symbolic extension fostered
innovative aggregations of data allowing sophisticated description and redescription
processing for profile classification, niche finding, analogical reasoning, story
construction, schema matching to name a few.
With the dimension extension, the focus was on identifying the empirical
dimensionality of the subject of interest based on the data. For example, the distribution
of customers at every price point became the customer dimension of the price. This
perspective of dimension was different from the classical definition of dimension in
multidimensional modeling or dimensional analysis. In multidimensional modeling, the
concept of a customer dimension for the price was not achievable at the attribute level.
These data model extensions made the answering of questions using the data
directly possible at the all levels of knowledge and business intelligence: strategic,
tactical, operational, and transactional. The schemes reflected the precise empirical
ontology of the enterprise as proof systems (theorems) or automatic procedures
(algorithms) for problem-solving. Using them, business analysts and executives could

148
compose programs, test their feasibility, assess the expectations, and estimate the
benefits. Data-driven and result-oriented management program development created
predictability and efficiency in the practice of management.
Contribution to big data management research
Another contribution of this study was the application of the design-based
methodology to data analytics in management research. The typical management research
methodology advocated a process of identifying the problem, formulating the research
questions, operationalizing the research questions as hypotheses, and identifying the
variables for which data can be collected to test the hypothesis. Where necessary, the
researcher designed the experiment and created the measurement instrument for the
research. The researcher then gathered data, applied analytic techniques to fit the data to
theoretical distributions, and determined whether the evidence in the data was significant.
This DBR started with the data and then learned from the data what was useful in
solving the problems presented by the interaction of factors within the data generation
process. With DBR, the problem did not need specification at the start of the research.
The requirement was to learn the problems and the solutions from the data or direct
manipulation of the data generation process or the learning environment. The learning
requirement made the availability of big data, advanced analytic algorithms, and
computing power critical to the advancement of this emerging research methodology.
This methodology was robust to address the data analytic problems that increase in
complexity with the nature of analytic problems. This research approach challenged

149
variable selection, model selection processes, sampling, data reduction, data treatment
applied to achieve better performance in model results, and many other research practices
in the contemporary scientific inquiry. It also challenged the use of mathematical
solutions and statistical routines. Mathematical solutions were needed when there was no
data to express complex function. Statistical routines were useful when the data was not
enough to support an assumption of accurate population representation. In the modern
data-rich organization, none of these situations existed.
The use of DBR in this study illustrated the opportunity in using the data to
discover and express issues existing in any domain of interest. It also demonstrated the
use of the same data to seek solutions to the problem that would satisfy the end users of
the analytics. Through the iterative transformation of the data, it was possible to quantify
many of the concepts for cognitive processing of the domain of interest. The use of
analytic extension eliminated the need to persist logic in the form of mathematical
expressions. Rather these can be converted into attributes in a data model that can be
analyzed and used in decision making. The use of the data form rather than the functional
(or mathematical) form of the expression improved the interpretation of the results and
the acceptance of the recommendations that were derived.
Limitations of the Study
The limitations that arose from the study regarding the generalizability, validity,
and reliability of the research design, research methodology, and the study outcomes are

150
discussed in this section. These were the issues discovered only after all the data had
been analyzed.
The use of data model to broaden the characterization of the domain of interest for
management problem-solving limited the solution scope to the available data. Influences
that could not be extracted directly or indirectly from the available data were not
considered. Anecdotal evidence that could not be substantiated with the business data
could not be included in the analysis. For example, in the illustration, management
analysts and executives believed that the nature of group purchasing contracts and
arrangements contributed to revenue leakage. Since contract data was not available for
analytic processing, their potential influences were not reflected in the recommendations
and the resulting management programs.
The data model was the consequence of the data generation processes and the
controls established within them to ensure the accuracy of the information captured. The
nature of the data generation process, also, determined the representativeness of the
underlying mechanisms and observations about the subjects within the captured data.
Therefore, results of the analytic processes were limited by the context, content, and the
relationships within the data generation process. These in turn limited the solution
proposed for management problem-solving. This limitation was moderated by the use of
big data which ensured the inclusion of all the data elements gathered about the subject of
interest without consideration of methodological and computational needs.

151
The selection of the data from medical equipment manufacturing, supply, and
distribution company as the source of the data for illustration of the data modeling
approach was a consequence of the objective of the study which required the use of big
data. The complexity manifested in the large number of products marketed by sales
representative and the different classes of customers and markets in the United States.
This selection of this industry was a natural and unavoidable limitation of the study.
However, this selection limited the relevant business concepts to those of the industry.
For example, there were different types of medical equipment and supplies for many
different medical management scenarios. Some of them were used for therapeutic and
others for diagnostic purposes. The equipment required different levels of skills from the
sales representatives. These differential characteristics of the products had to be
explicitly modeled for management analysis and decision-support. However, only those
differential characteristics that were influential within the data set were reflected in the
analytic results and management action recommendations. The specific extended data
model constructed for the management problem-solving may not generalize to other
management problem-solving scenarios within the industry or to other industries.
However, the modeling approach which expanded the conceptualization of subjects and
their alignment to the cognitive model of the domain of interest improved the
management analytics and decision-support problem-solving in general.
Furthermore. the data model for management analytics and decision support for
profit margin problem solving may only be limited to similar situations of profit margin

152
optimization with complex interaction of products, pricing, customer, sales and
marketing characteristics. However, the description of the methodologies adopted for
ontology learning from available data, the application of data engineering to quantify
abstract concepts, and the use of analytic formulation techniques to determine the
functional association between sets of attributes have broader application.
The selection of the data was representative of a typical big-data environment
with data size of more than 1 terabyte. The selection of large data meant that concepts
would occur at a frequency that were statistically powerful, and therefore, relevant for
management analytics and decision support. The approach of analyzing all the available
data, instead of a subset of the data required the construction of a plethora of measures
and metrics at different levels, such that one level can be linked to the next. This resulted
in an architecture for the measures and metrics comparable to neural networks (Zelinka et
al., 2011). The difference was that with this approach of extending the data model, the
analysts would have control of the types of transformations within each layer. Although,
this may prevent erroneous transformations, it also limited the transformations applied to
those that are interpretable in business terms. As such, in situations where unconstrained
transformations were allowed, different analytic outcomes and recommendations could
result. Experience with unconstrained transformation was that they sometimes included
transformation that do not have management analytics and decision support value
(Zelinka et al., 2011).

153
Apart from the limitations of the study discussed above, there were no other
limitation of the study that arose from the study. The acceptance of the management
programs that resulted from the analysis process indicated that that the limitations
discussed above did not materially impact the quality of the analytic recommendation
derived from the data model constructed from the data available for analytic processing.
Recommendations
The use of analytic extensions addressed the different levels of information
expression (measured, estimated, inferred, and forecasted) necessary for management
analytic and decision-support problem-solving. This analytic extension of data models
provided avenues to incorporate complex data elements of higher order logic into analytic
processing and programming framework. The derived data was made available to the end
user through the traditional analytic application user interfaces. The analytic extension of
the data model led to an information representation scheme that aligned with the
cognitive model of the domain of interest. It supported identification and classification of
objects of interest within the domain. It also supported the abstraction of these
information artifacts to the level needed for analytics and decision-support in
management. The study identified three levels of data model transformation or analytic
continuity concepts: semantic, symbolic, and dimensional extensions
The methods applied to the transformations at each level were also driven by
specific theories. The theories of measurements (metrology) which advocated the
formulation of measurement scales and instruments in all scientific disciplines drove

154
semantic extensions. These theoretical formulations enabled scales developed for
quantitative expression of non-physical quantities in nature, for example, key
performance indicators (KPIs), balanced scorecard (BSC) metrics, customer lifetime
value, customer churn, intelligent quotient, to name a few. The symbolic form addressed
issues related to the optimal specification of the objects in a specific analytic context. At
this level, accurate statistical and heuristic abstraction of data was necessary. The
dimensional form addressed characteristics of subjects of interest mapped to abstract
geometric forms.
The goal was to answer complex management decision questions directly from
available data. For example, these transformations integrated the determinants and
coefficients of expression within the domain of interest. Analytic extensions allowed
reasoning about problems using the data model, rather than analytic algorithms.
Therefore, in data analytics with big data where there would be many attributes, attribute
levels, and analytic models, the use of data model extensions to persist these artifacts is
recommended. The output of the analytic algorithm should also be captured in the data
model and within the analytic application to enable real time comparison of analytic
expectations to actual.
Implications
As mentioned in the previous section, as much as 50% of efforts to develop
decision-support systems for management fail. The implication of such failures was the
misalignment of fundamentals and market value of organizations. The situations of

155
undervaluation or overvaluation had a long-term impact on organizations, as has been
demonstrated by the technology industry burst of 2002 and financial industry failure and
subsequent global market turmoil beginning in 2008.
Market economies depend on the accurate valuation of companies, which in turn
depends on the predictability of the management activities of public and private
companies. Since capitalism has become the dominant national economic philosophy in
the world, the private sector plays an important role in national economic productivity,
market efficiency, and overall societal prosperity. The productivity of organizations are
important to the economic and social well-being of the society.
This study contains a schema-based approach to analytic problem-solving in
management. That is, the solution to management analytics and decision-support
problems lies in building a good data model to support analytic processing at all levels of
the organization. In recent years, the focus on algorithms which are black-box solutions
created the cognitive gap between empirical situation and analytic solutions. This
schema-based solution provided a new layer of solutions that ensured proper application
of analytical and numerical solution techniques.
About the contribution to social change, the company in the case illustration was a
major distributor of medical equipment and a supplier to health care organizations.
Discovering the causes of profitability issues, such as wasteful manufacturing processes,
low value products, pricing discrepancies, product development partnership opportunities
and so on brought the company closer to its customer base and the communities they

156
served. The partnerships with Non-profit Community Hospitals and Health Centers in
urban inner-city communities in Chicago, Detroit, Memphis, Atlanta, and many others
opened up avenues for involvement in Community wellness and disease management
programs. The company established incentives for the sale agents to participate in social
programs within the communities they covered. The company established a foundation to
support Health care facilities whose primary patients were Medicaid recipients to help
cover losses from under-reimbursement for services from the U. S. government. The
company also reached out to medical missions to South America, Africa, and Middle
East to provide medical equipment and medical supply donations that these missions
depended on for the free services they offered to very needy patients. The social change
that could be realized through all these activities was improvement in health conditions of
many communities, improvement in the daily activities of patients and residents of health
care institutions served by the company, and support for non-profit organizations that
were active in improving conditions of patients around the world.
Conclusions
The need for data-driven decision-making in organizations will only increase as
data gathering, storage, and retrieval techniques improve. Significant work has been done
in the construction of statistical databases for very large databases as well as in
knowledge discovery from databases. While statistical databases lack the scalability of
relational databases, relational databases based on classical data models were not able to
provide the level of knowledge representation made possible by statistical databases. This

157
study’s goal was to evolve data-modeling beyond an organizing framework for data. The
goal was device tools and method to model data for higher levels of information
representation necessary for business knowledge and intelligence discovery.
The discussion above showed that further extensions of the relational data model
allowed a fundamental redefinition of the concept of the dimension from one popularized
by OLAP community to one that was much more aligned to the mathematical
interpretation (Hart, 2005). While the classical multidimensional model had attributes
like dimensions, the dimensional extension approach provided a higher-order logic for
constrained optimization and simulation problem-solving in management. The approach
avoided the issue of the use of theoretical statistical distributions since comparison to
chance was not valuable for management analytics and decision making.
In this study, I examined the use of analytic extensions to the data model to
improve the discovery of management scenarios, insights, and complex business rules
and constraints from big data. I established that the use of these analytic extensions was
not just necessary but important to align available data to the intuitive concepts within the
domain of interest. By using a combination of ontology learning, data engineering, and
analytic formulation techniques in the derivation of these analytic extensions, the
resulting data model was the concise and compact representation of the management
scenarios, insights, and the rules that the management analyst and executive would
optimize to achieve predictable outcome states. The use of analytic extensions closed the
gap between analytic solutions and intuitive cognitive models of the business problems.

