


WPC 300 – Final Term Exam Study Guide
Different analytical modeling techniques, be able to understand
what is the best analytical technique for different business scenarios
(multiple choice)
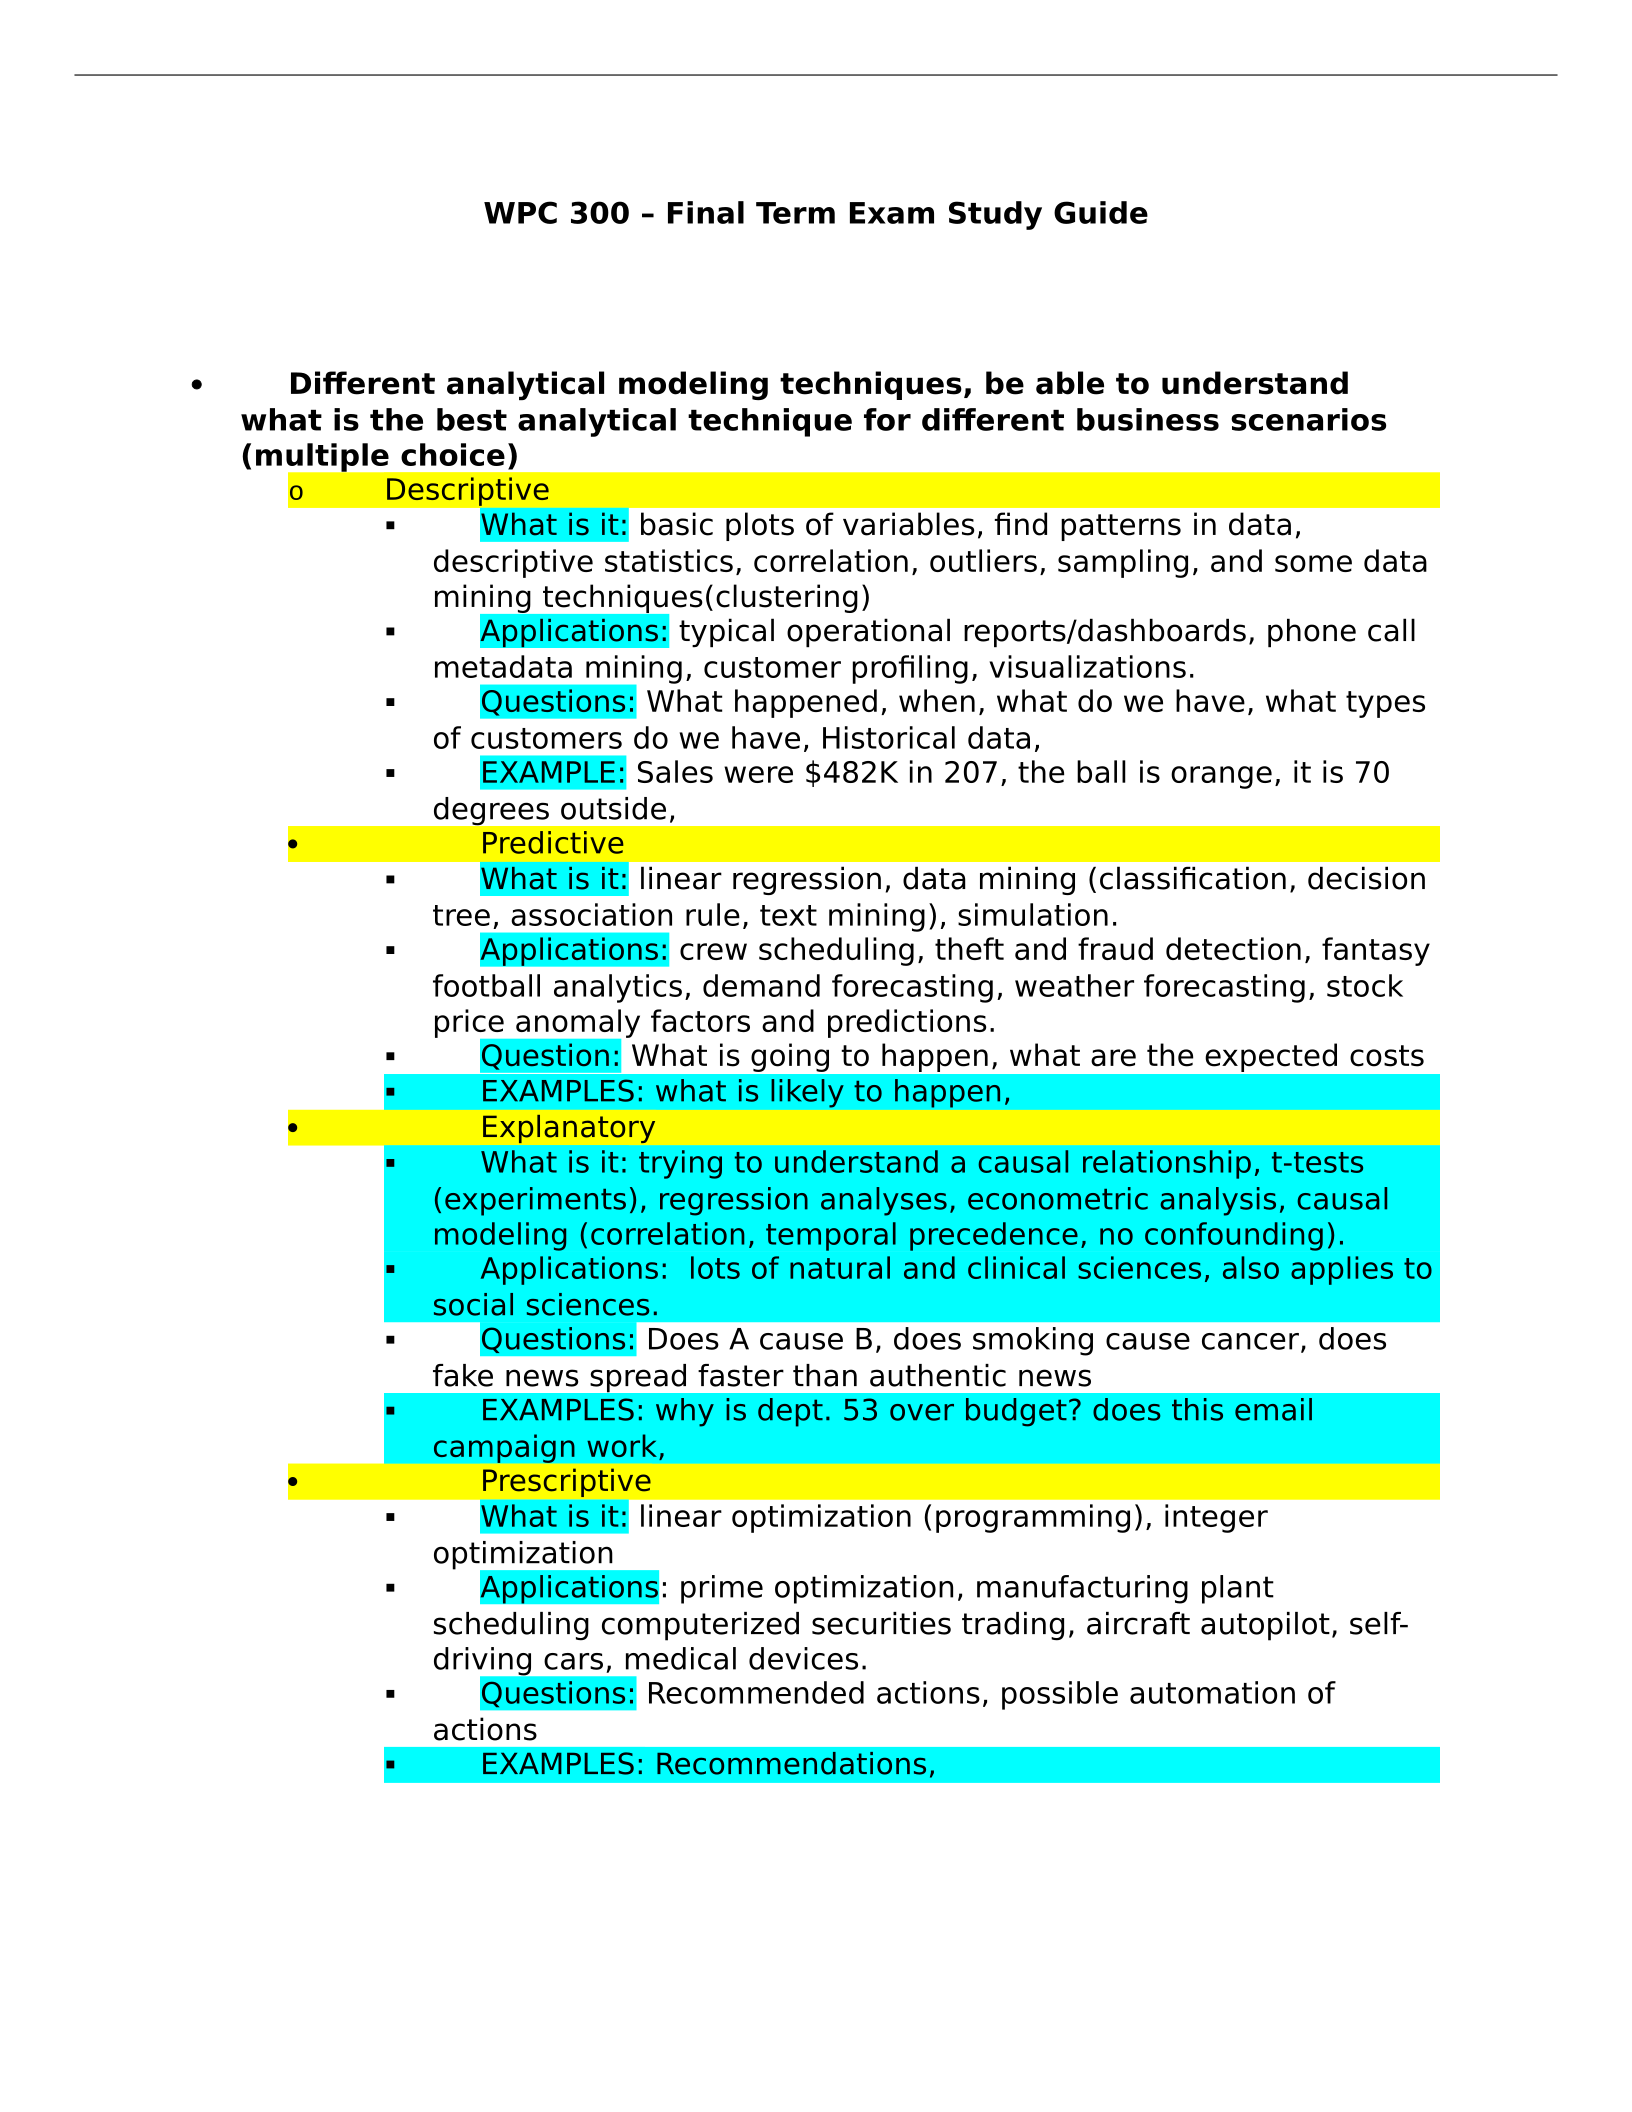
oDescriptive
What is it: basic plots of variables, find patterns in data,
descriptive statistics, correlation, outliers, sampling, and some data
mining techniques(clustering)
Applications: typical operational reports/dashboards, phone call
metadata mining, customer profiling, visualizations.
Questions: What happened, when, what do we have, what types
of customers do we have, Historical data,
EXAMPLE: Sales were $482K in 207, the ball is orange, it is 70
degrees outside,
Predictive
What is it: linear regression, data mining (classification, decision
tree, association rule, text mining), simulation.
Applications: crew scheduling, theft and fraud detection, fantasy
football analytics, demand forecasting, weather forecasting, stock
price anomaly factors and predictions.
Question: What is going to happen, what are the expected costs
EXAMPLES: what is likely to happen,
Explanatory
What is it: trying to understand a causal relationship, t-tests
(experiments), regression analyses, econometric analysis, causal
modeling (correlation, temporal precedence, no confounding).
Applications: lots of natural and clinical sciences, also applies to
social sciences.
Questions: Does A cause B, does smoking cause cancer, does
fake news spread faster than authentic news
EXAMPLES: why is dept. 53 over budget? does this email
campaign work,
Prescriptive
What is it: linear optimization (programming), integer
optimization
Applications: prime optimization, manufacturing plant
scheduling computerized securities trading, aircraft autopilot, self-
driving cars, medical devices.
Questions: Recommended actions, possible automation of
actions
EXAMPLES: Recommendations,
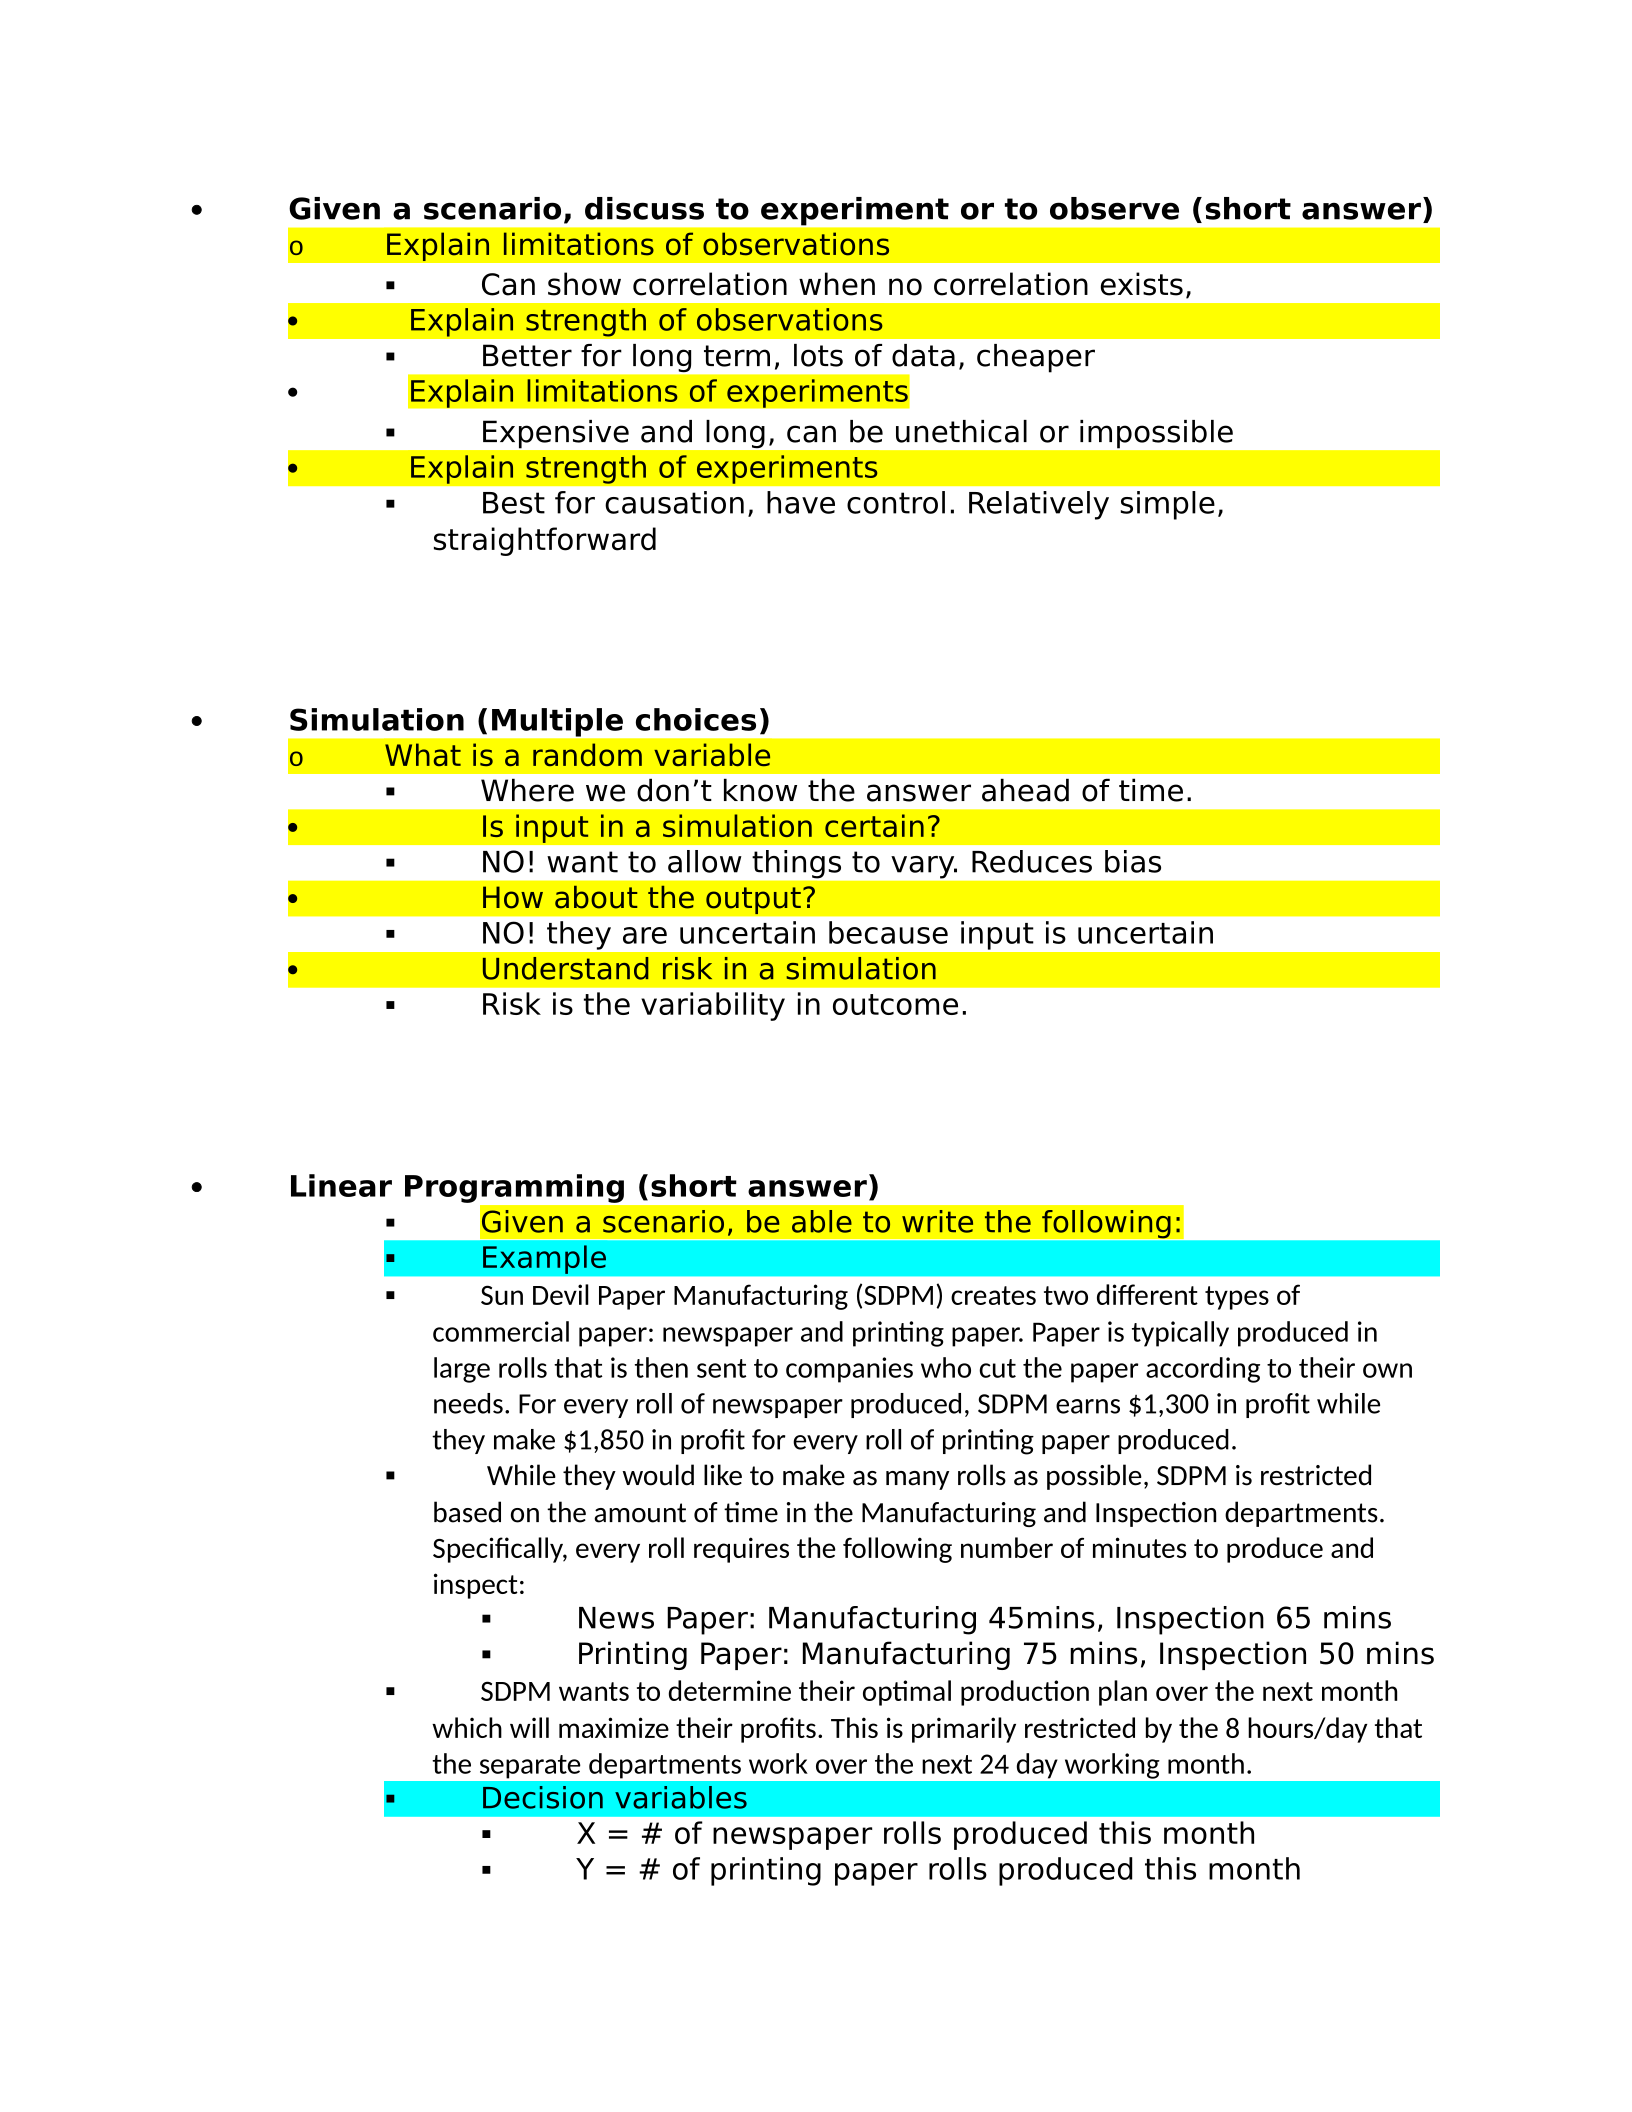
Given a scenario, discuss to experiment or to observe (short answer)
oExplain limitations of observations
Can show correlation when no correlation exists,
Explain strength of observations
Better for long term, lots of data, cheaper
Explain limitations of experiments
Expensive and long, can be unethical or impossible
Explain strength of experiments
Best for causation, have control. Relatively simple,
straightforward
Simulation (Multiple choices)
oWhat is a random variable
Where we don’t know the answer ahead of time.
Is input in a simulation certain?
NO! want to allow things to vary. Reduces bias
How about the output?
NO! they are uncertain because input is uncertain
Understand risk in a simulation
Risk is the variability in outcome.
Linear Programming (short answer)
Given a scenario, be able to write the following:
Example
Sun Devil Paper Manufacturing (SDPM) creates two different types of
commercial paper: newspaper and printing paper. Paper is typically produced in
large rolls that is then sent to companies who cut the paper according to their own
needs. For every roll of newspaper produced, SDPM earns $1,300 in profit while
they make $1,850 in profit for every roll of printing paper produced.
While they would like to make as many rolls as possible, SDPM is restricted
based on the amount of time in the Manufacturing and Inspection departments.
Specifically, every roll requires the following number of minutes to produce and
inspect:
News Paper: Manufacturing 45mins, Inspection 65 mins
Printing Paper: Manufacturing 75 mins, Inspection 50 mins
SDPM wants to determine their optimal production plan over the next month
which will maximize their profits. This is primarily restricted by the 8 hours/day that
the separate departments work over the next 24 day working month.
Decision variables
X = # of newspaper rolls produced this month
Y = # of printing paper rolls produced this month
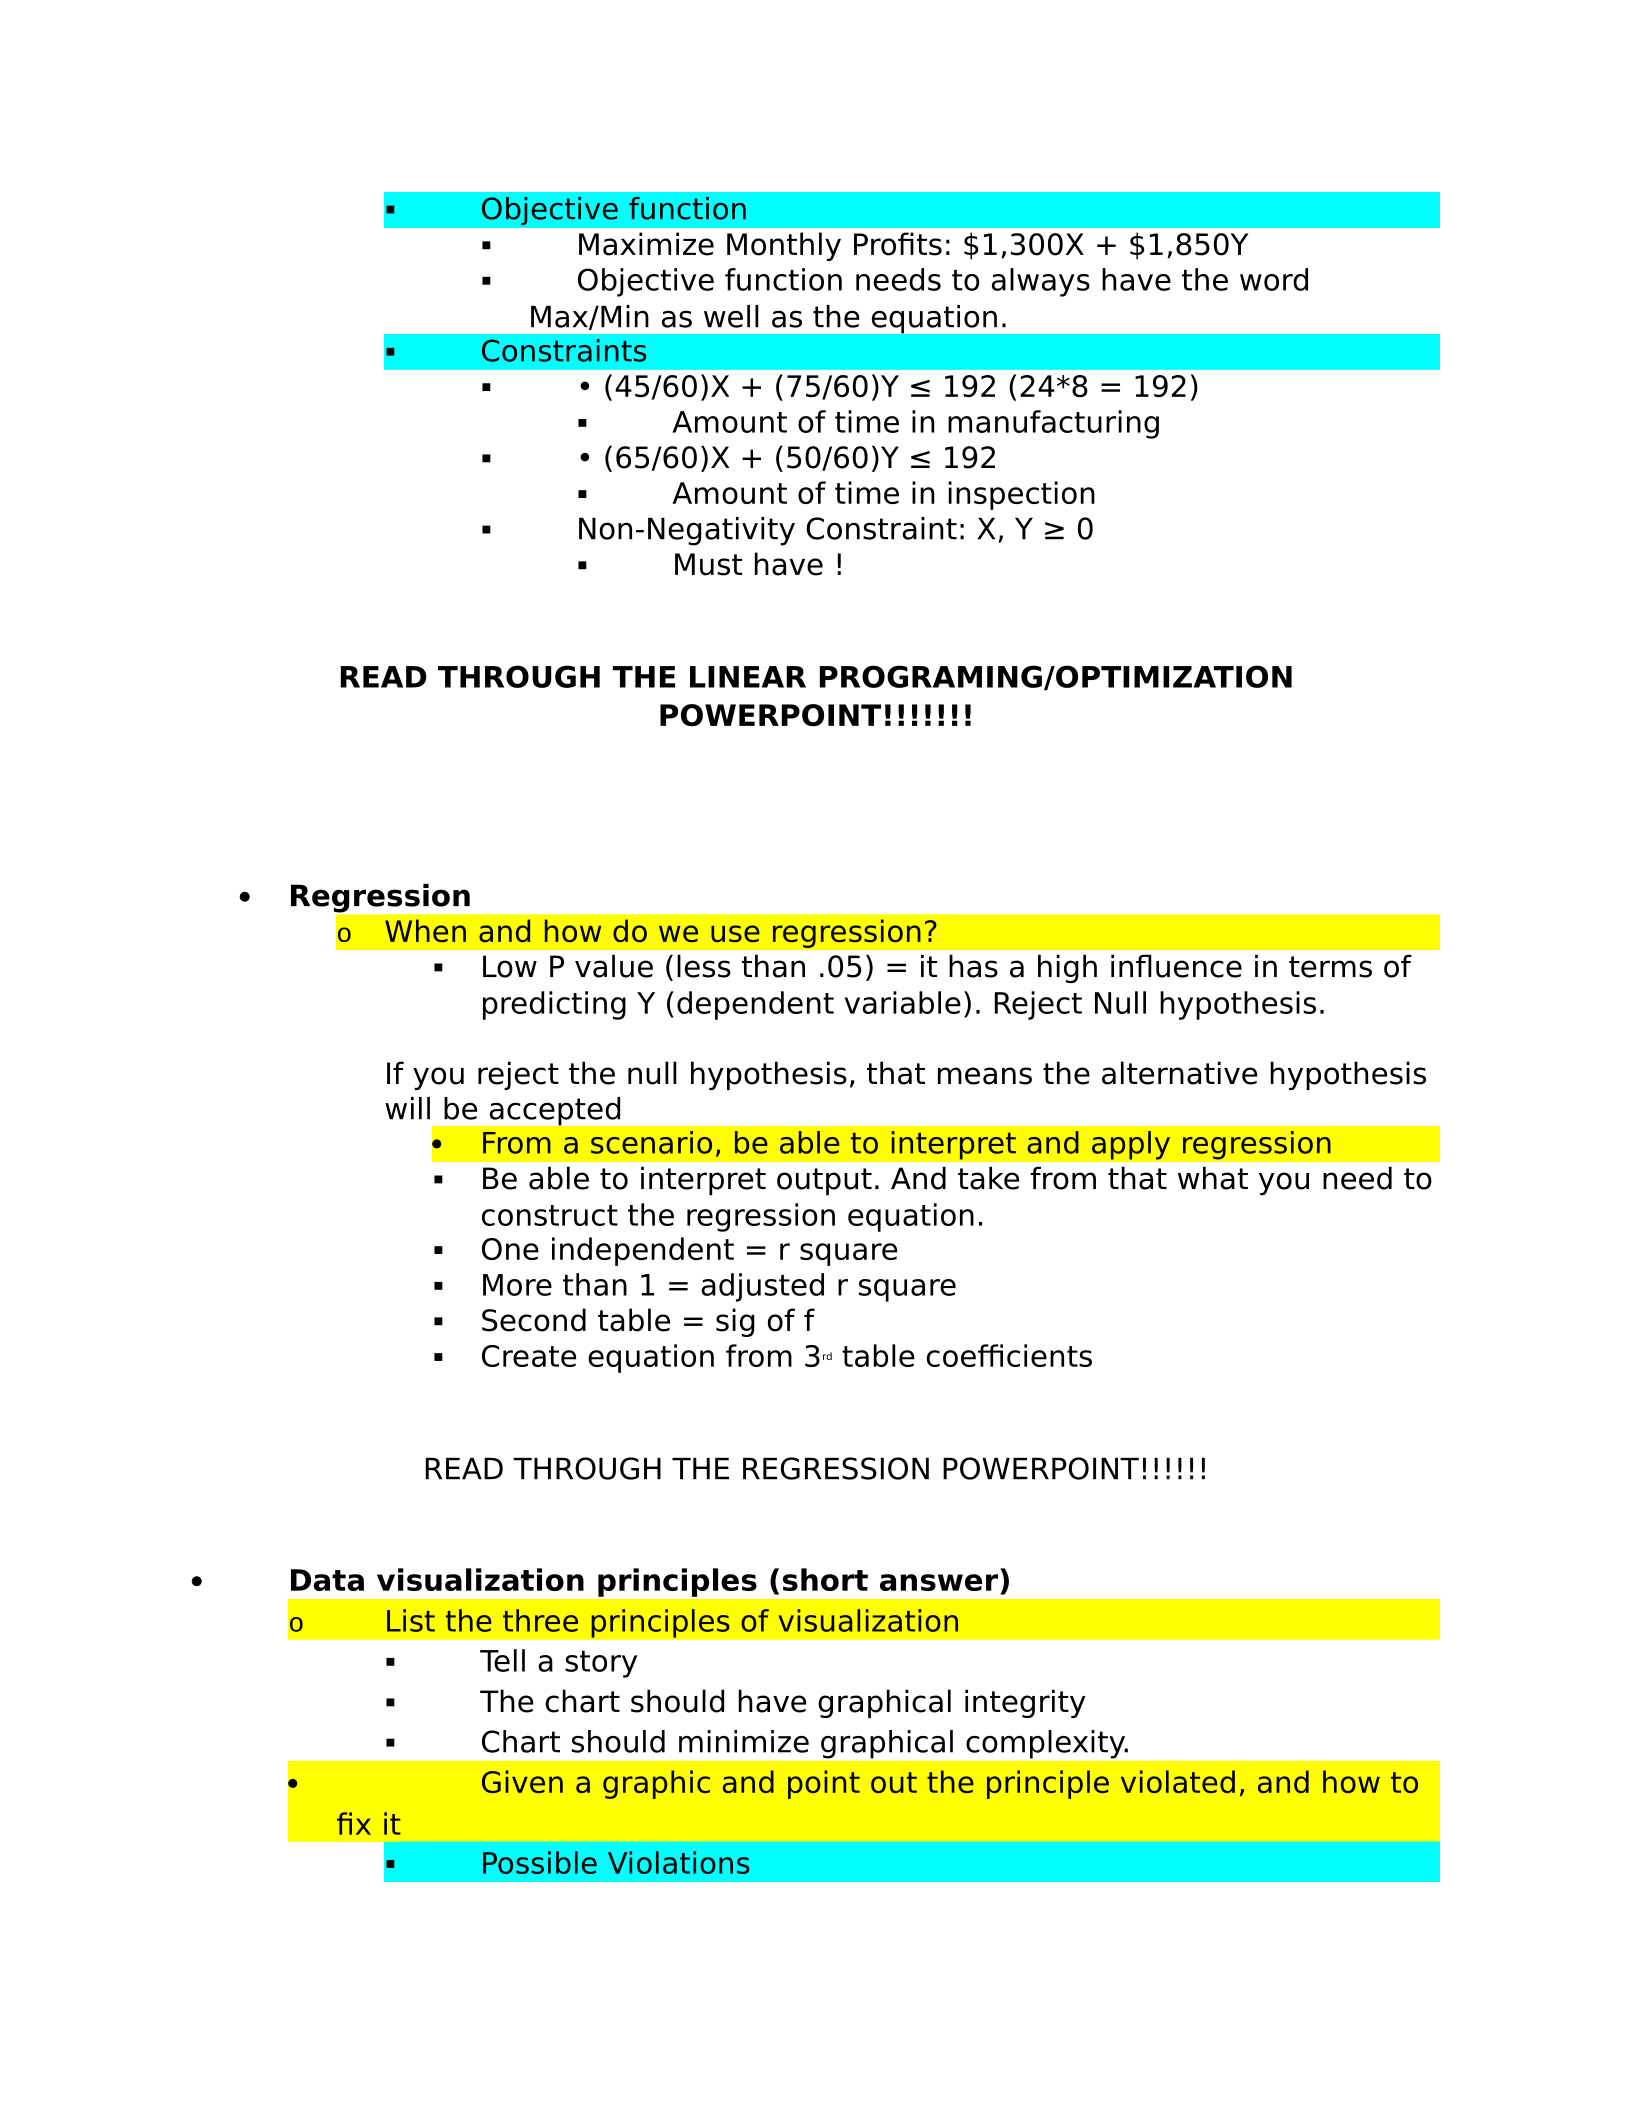
Objective function
Maximize Monthly Profits: $1,300X + $1,850Y
Objective function needs to always have the word
Max/Min as well as the equation.
Constraints
• (45/60)X + (75/60)Y ≤ 192 (24*8 = 192)
Amount of time in manufacturing
• (65/60)X + (50/60)Y ≤ 192
Amount of time in inspection
Non-Negativity Constraint: X, Y ≥ 0
Must have !
READ THROUGH THE LINEAR PROGRAMING/OPTIMIZATION
POWERPOINT!!!!!!!
Regression
oWhen and how do we use regression?
Low P value (less than .05) = it has a high influence in terms of
predicting Y (dependent variable). Reject Null hypothesis.
If you reject the null hypothesis, that means the alternative hypothesis
will be accepted
From a scenario, be able to interpret and apply regression
Be able to interpret output. And take from that what you need to
construct the regression equation.
One independent = r square
More than 1 = adjusted r square
Second table = sig of f
Create equation from 3rd table coefficients
READ THROUGH THE REGRESSION POWERPOINT!!!!!!
Data visualization principles (short answer)
oList the three principles of visualization
Tell a story
The chart should have graphical integrity
Chart should minimize graphical complexity.
Given a graphic and point out the principle violated, and how to
fix it
Possible Violations
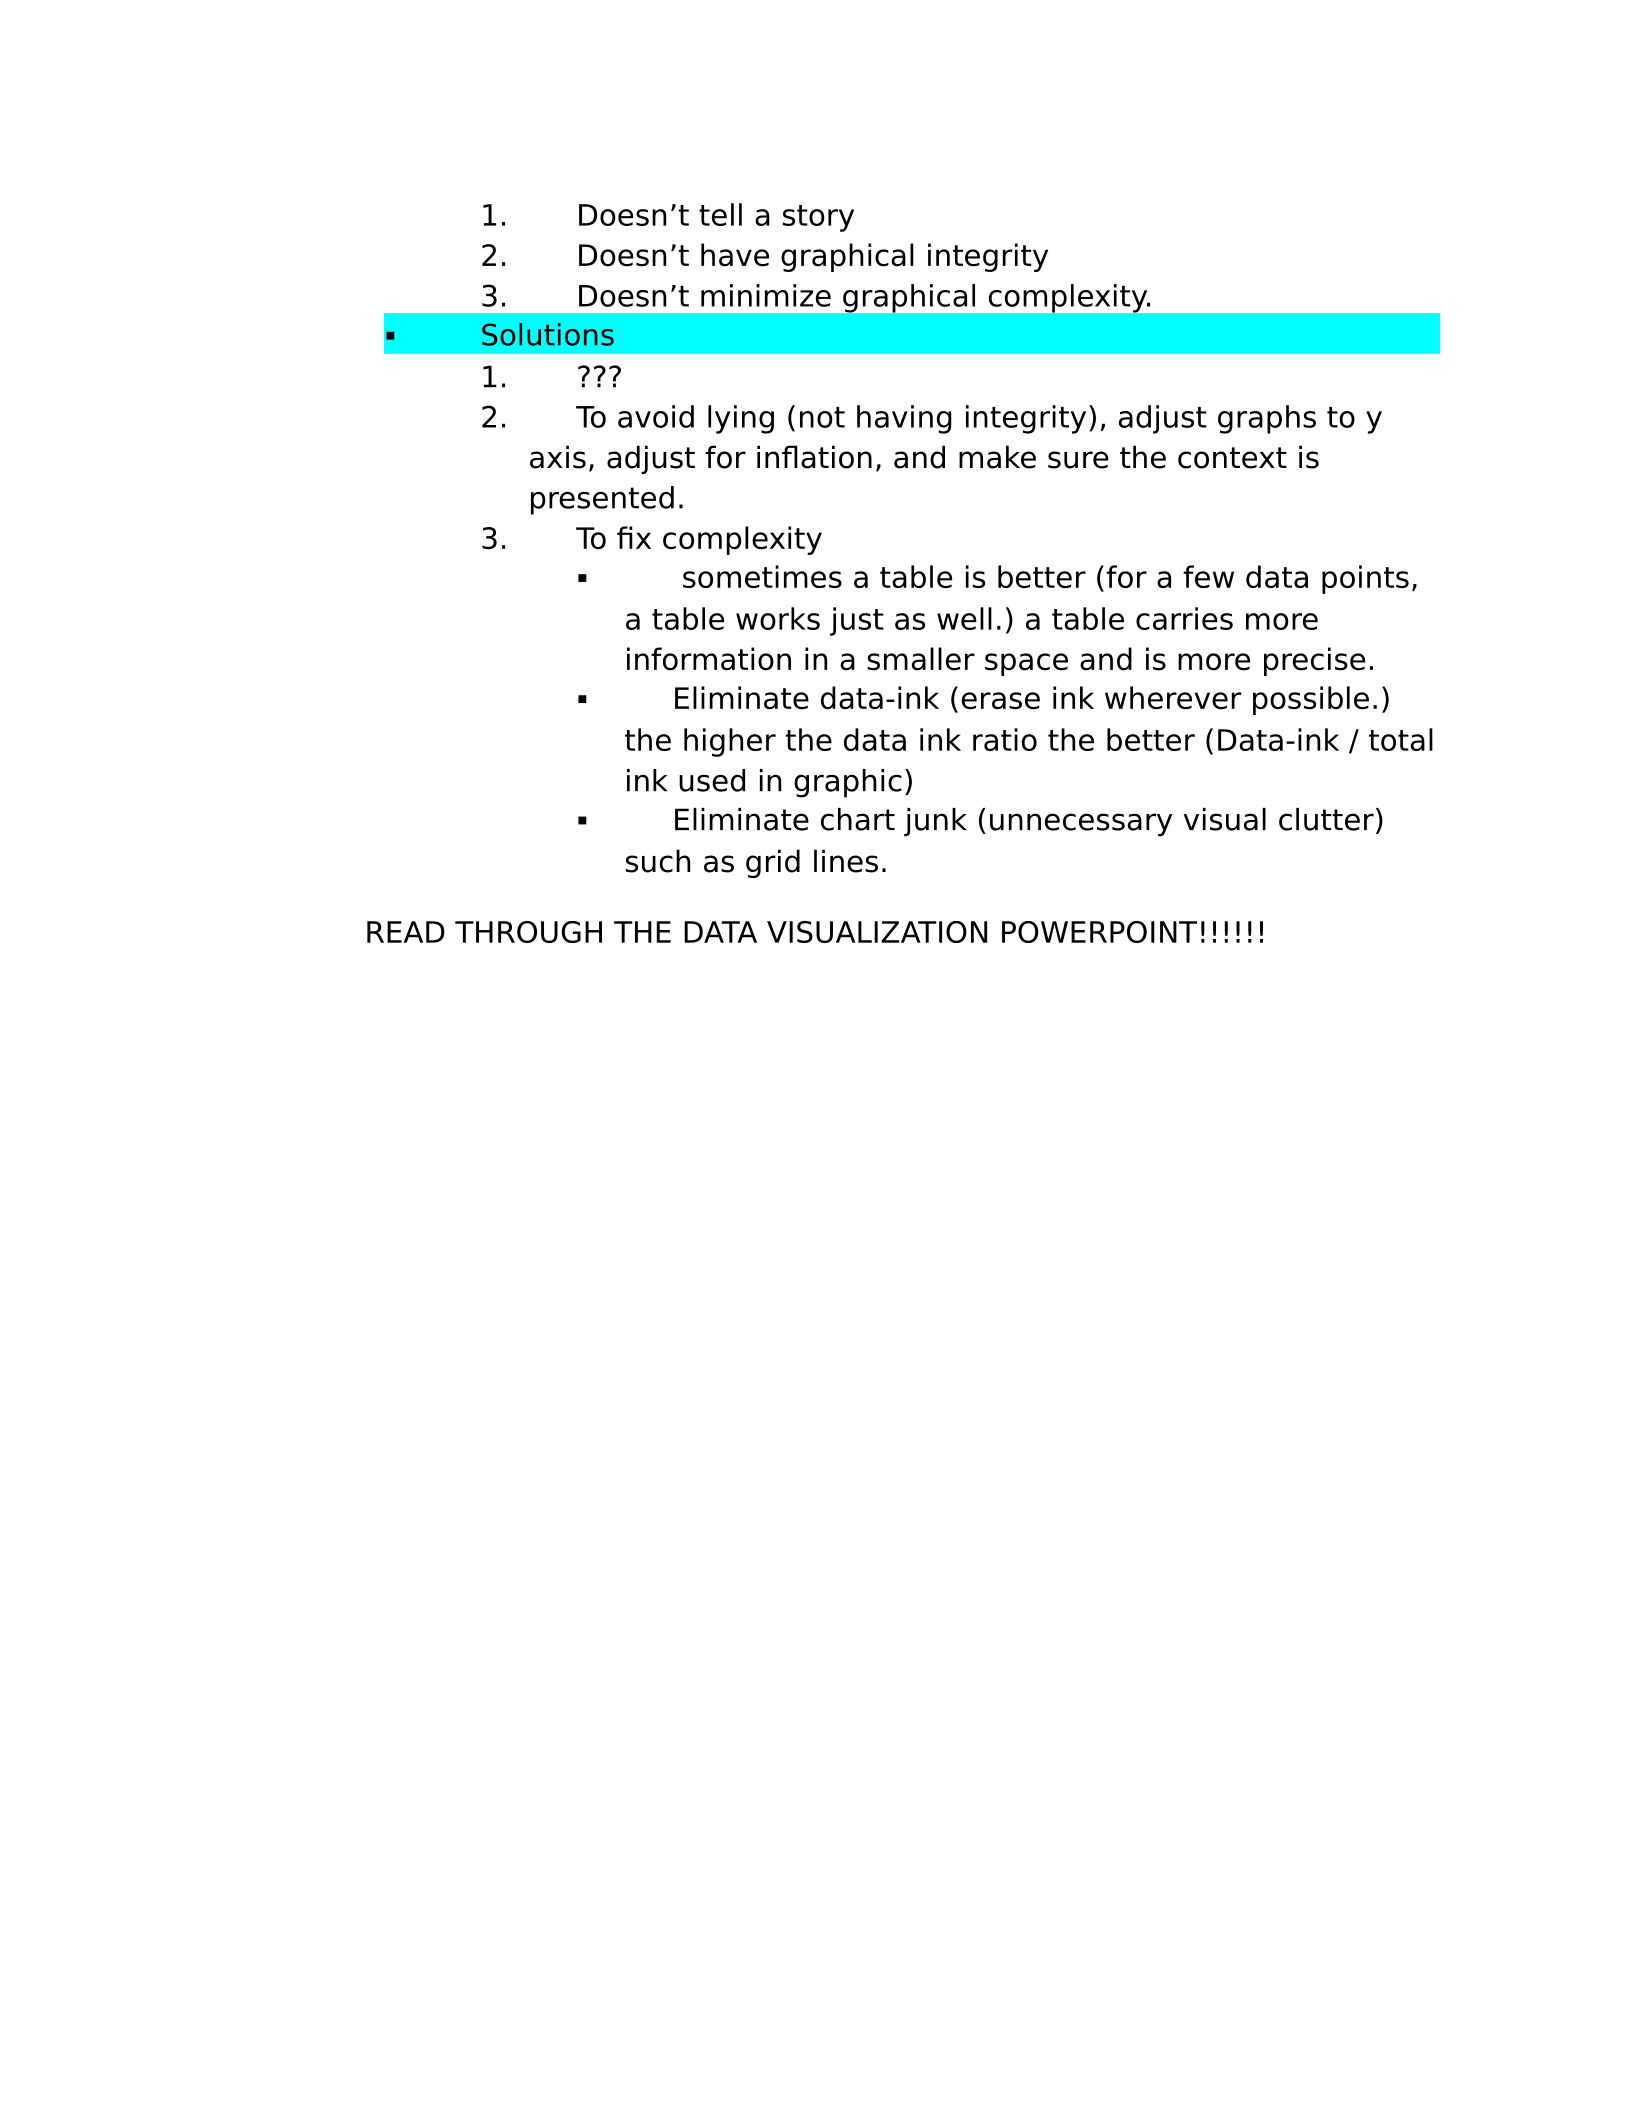
1. Doesn’t tell a story
2. Doesn’t have graphical integrity
3. Doesn’t minimize graphical complexity.
Solutions
1. ???
2. To avoid lying (not having integrity), adjust graphs to y
axis, adjust for inflation, and make sure the context is
presented.
3. To fix complexity
sometimes a table is better (for a few data points,
a table works just as well.) a table carries more
information in a smaller space and is more precise.
Eliminate data-ink (erase ink wherever possible.)
the higher the data ink ratio the better (Data-ink / total
ink used in graphic)
Eliminate chart junk (unnecessary visual clutter)
such as grid lines.
READ THROUGH THE DATA VISUALIZATION POWERPOINT!!!!!!
Powered by TCPDF (www.tcpdf.org)

