



SCM MOD 2 Study Guide
1. Inventory
a. Definition: the items that are owned by a company for the purpose of present or
future sales or for use in day-to-day operations
b. Stock of any ITEM or RESOURCE used in an organization
c. Not just what you sell and/or issue
d. Also includes what you need to run the business on a day-to-day business
e. Types of Inventory
i. Raw Materials/Components, Work-in-Process, Finished Goods
ii. Spare and/or replacement parts
iii. Capital Equipment & MRO (Maintenance, repair & operations)
iv. Long-term Inventory
v. Seasonal Inventory
vi. Perishable
vii. Safety Stock
1. Protects against uncertainty in demand, lead time, supply…
2. Not intended to be used. Cushion, Insurance
viii. Anticipation Inventory
1. Used to absorb uneven rates of demand or supply perhaps caused by
seasonal demand, holidays, quantity discounts…
ix. Pipeline Inventory
1. Orders that have been placed but not yet received nor paid for by the
customer
2. Inventory “on its way” to the customer
3. ***Formula: dL (Periodic demand * Lead Time)***
f. Issues to Consider
i. Storage – Space, Hot/Cool Environment, Energy Requirements, Labor,
Handling, Buy/Lease, Cost
ii. Transport – Vehicle, Cool/Heat, Fuel, Labor, Packaging, Cost

iii. Shrinkage – Pilferage, Security, Lost Items, Damaged, Obsolescence
iv. Money – Cash, Financing Terms, Taxes, Insurance
v. Legal Considerations – Licenses, Certifications, Other Laws
vi. Other Inventory Needs – Additional inventory needs or options. Limits on
space, money, security, quotas…
2. Lead Time
a. Time elapsed between customer placing order and order being received by customer
b. Definition: The period of time between when an order is placed and when the order
is received by customer
3. Lot Size
a. Definition: An accepted order size. This sometimes also refers to a possible order size
increment
i. Example: Lot size of 100 units. Ordering 100, 200, 300, etc. would be possible
order sizes
b. Typically refers to the order size
c. CONSIDER: Holding Cost, Materials handling, Shrinkage & Obsolescence, Liquidity,
Transportation, Consumer service levels, Purchasing costs, Cost to purchase/quantity
discounts
4. SKU
a. Stock Keeping Unit: A specific product or service’s identification code used to track
inventory or catalog sales
5. Why carry inventory? Inv Strategies
a. Carrying inventory can come at a hefty price, thus there is a risk. Not carrying
inventory also comes at a risk: the risk of not having inventory and the risk of not
being able to satisfy the needs of the customer
b. Insurance – Manage Risk/Uncertainty
i. Protect yourself against everyone’s problems
ii. BUY IT – Theft, damage, poor quality, late shipment, labor…
iii. MAKE IT – Labor, machine breakdowns, high demand…
iv. MOVE IT – Theft, late shipments, logistics problems associated with distance
v. SELL IT – Theft, high demand, damaged items…
vi. SERVICE IT – Defects, repair, warranties, maintenance…
c. Market Needs/Expectations
2

i. Prepared to meet consumer needs quickly
ii. Market expects that when need arises, needs can be met
d. Managing Costs
i. Economies of Scale
ii. Quantity Discounts
iii. Manufacturing efficiencies
6. Risk’s relationship to inventory
a. Supply Chain Risk
i. Loss, Damage, Theft
ii. Machine Breakdowns, Transportation accidents
iii. Human Resource issues
iv. Fluctuating Demand
v. Market Changes – Innovation, Growth, Preferences
vi. Environmental – Earthquakes, Hurricanes, Famine…
vii. Political – Trade sanctions, War/Conflict
viii. Epidemics, Crime/law enforcement, poverty, technology
b. Company Risks: theft or damage to inventory, late shipments from supplier,
employee sickness, employee strike, machine malfunctions, harsh weather
c. Supplier Risks: employee sickness or strikes, sudden increases in demand for your
company’s supplies, the risks posed by their suppliers
d. Customer Risks: sudden increase in demand, damage to customer’s inventory
7. Seasonal, safety, anticipation inventory
8. Calculate pipeline inventory
9. Qualitative and Quantitative forecasting
a. Qualitative
i. Query executives, experts, salespeople, consumers
ii. Irrelevant current data, lack of current data, incomplete date
iii. New products, new markets
iv. When is the group “smarter” than the expert?
b. Quantitative
i. Value of numbers? Limitation of numbers?
3

ii. How much do companies value statistics?
iii. Casual Methods – Linear regressions
iv. Time Series – Average, Trends, Seasonal
10. Demand Forecasting
a. Definition: A predictive analysis and/or estimation of consumer demand in a future
period
11. Simple moving average
a. JUST AN AVERAGE: Average demand over a certain number of prior periods
b. STABLE DEMAND: Works well in industries where demand is fairly stable
c. Forecast Demand for Week 13
i. The 4-period simple moving average forecast for week 13 would be the
average of the 4 period prior to week 13
12. Weighted moving average
a. HELPFUL in the midst of a TREND
NOT ALL PERIOD ARE CREATED EQUAL – Typically, more recent periods carry more
weight. They seem to be more relevant
b. Each period has different WEIGHT – The sum of the weights should be qual 1.00.
Example: (20%, 30%, 50%)
c. EXAMPLE: 3-period weighted moving average for Period 4 (P4)
i. Weight for the oldest (P1) was 0.20
ii. Weight for middle period (P2) was 0.30
iii. Weight for most recent period (P3) was 0.50
iv. How to calculate weighted moving average for this example:
1. Oldest period “sales” Data * 0.20
2. Middle Period “sales” Data * 0.30
3. Most Recent Period “sales” Data * 0.50
13. High vs. Low Inventory
a. PROS for High Inventory
i. BUYING the inventory – Cost to purchase (consider quantity discounts)
ii. STOCKING OUT – Poor customer service levels
iii. PAYING the Purchasing People – Costs to order inventory
iv. TRANSPORTATION: Ease, Cost
4

v. Higher levels of customer service – having inventory will help a company
address their immediate demand for a product
vi. Quantity discounts may be possible lower per unit costs
vii. Fewer order will need to be placed – possibly lower ordering costs and
transportation costs
viii. Greater security against unexpected demand variability
b. PROS for Low Inventory
i. Less storage space required – costs of holding inventory may he lower
ii. Lower chance of inventory obsolescence and shrinkage
iii. Less inventory typically means less materials handling requirements
iv. Less money invested in inventory means more money available for other
investment opportunities
c. CONS for High Inventory
i. Cost of HOLDING Inventory
ii. Materials handling – Cost to HANDLE inventory
iii. LOSS of Inventory – Shrinkage/Obsolescence
iv. TIES UP YOUR CASH – Capital investment options
14. All 4 Costs of Inventory
a. COST OF THE ITEM/PURCHASE COST
b. HOLDING or CARRYING COST
i. Warehouse Rent, Security Systems, Depreciation
ii. Obsolescence/Shrinkage, Materials Handling
iii. Insurance, Opportunity Costs
c. ORDERING COSTS
i. Order Clerk Salary, E-Procurement System, Delivery Fees
ii. Negotiation, Legal fees, Analysis
d. STOCKOUT COST (or Customer Service Cost)
i. Stock-outs, Backorders, Lost Profits, Late Fees
ii. Consumer’s “ill-will” (Difficult to Calculate)
e. Cost to Purchase
i. The cost to purchase the inventory
5

f. Holding Cost
i. The cost of holding the inventory
1. include: rent for the storage facility, energy and equipment required
to keep inventory in an acceptable environment, insurance, security
personnel, employees that handle inventory, etc.
g. Ordering Cost
i. The costs associated with placing an order for inventory
1. include: cost to research suppliers, negotiate purchase, the cost to
have items shipped and the upkeep of any electronic ordering system
h. Stockout Cost
i. The costs associated with not having enough inventory on hand to meet
customer demand
1. include loss of the unmet sale in the present, the loss of any future
sales from customers, cost od expedited shipment and the cost of
altering operational plans to expedite production
15. Inventory Calculations
a. Key variables
i. Q – Lot size
ii. D – Annual demand
iii. C – Cost to purchase one unit of inventory
iv. H – Cost to hold one unit of inventory for one year
v. S – Cost to place a single order
b. Using these variables, you can now calculate Average Amount of Inventory = Q/2
i. Assume a company starts a period with 0 units of inventory. The company
receives an order of 100 units (Q). It sells all 100 units of inventory during
that period. The ending inventory for the period is 0 units.
c. Number of orders per year = D/Q
i. If 12,000 units is the expected demand for the year (D), and a company
orders 1,000 units per order (Q), then the number of orders per year would
be 12
d. Time between orders (in weeks) = (Q/D) * 52
i. Using the example from the number of orders per year (above), D = 12,000
and Q = 1,000 units. Time between orders would be 4.33 weeks or about the
length of an average month
6

16. TC Formula
a. TC = DC + (Q/2) H + (D/Q) * S
i. TC = Total Annual Cost of Inventory
ii. D = Annual Demand for Item
iii. C = Cost per Unit (for company keeping inventory)
iv. H = Annual holding cost per unit
1. Cost to hold unit of inventory for one year
v. S = Cost to place a single order
vi. DC = Annual cost to purchase inventory – Buy It
vii. (Q/2) H = Annual holding cost (AHC) – Hold it
1. (Average inventory) * Annual per unit holding cost
viii. (D/Q) S = Annual ordering cost (AOC) – Order It
1. (Orders placed per year) * Cost to place each order
17. EOQ
a. Examining the Inputs
i. Demand (D)
ii. Cost of the Item (C)
iii. Cost of Placing an Order (S)
iv. Holding Cost (H)
b. Limitations
i. Exact Lot Size may not be possible/allowed
ii. Time Between Orders (TBO) may NOT be feasible/allowed
iii. Size of EOQ may be too large – Not enough Storage Space
iv. Quantity Discounts are not considered – If offered one would have to
calculate an EOQ for every price level
c. EOQ = √[(2DS)/H]
d. If a manager wanted to minimize total inventory cost, they could calculate EOQ and
find the optimal order size
e. EOQ is actually useful in many other situations as well; it can be helpful in
manufacturing, transportation and beyond
7
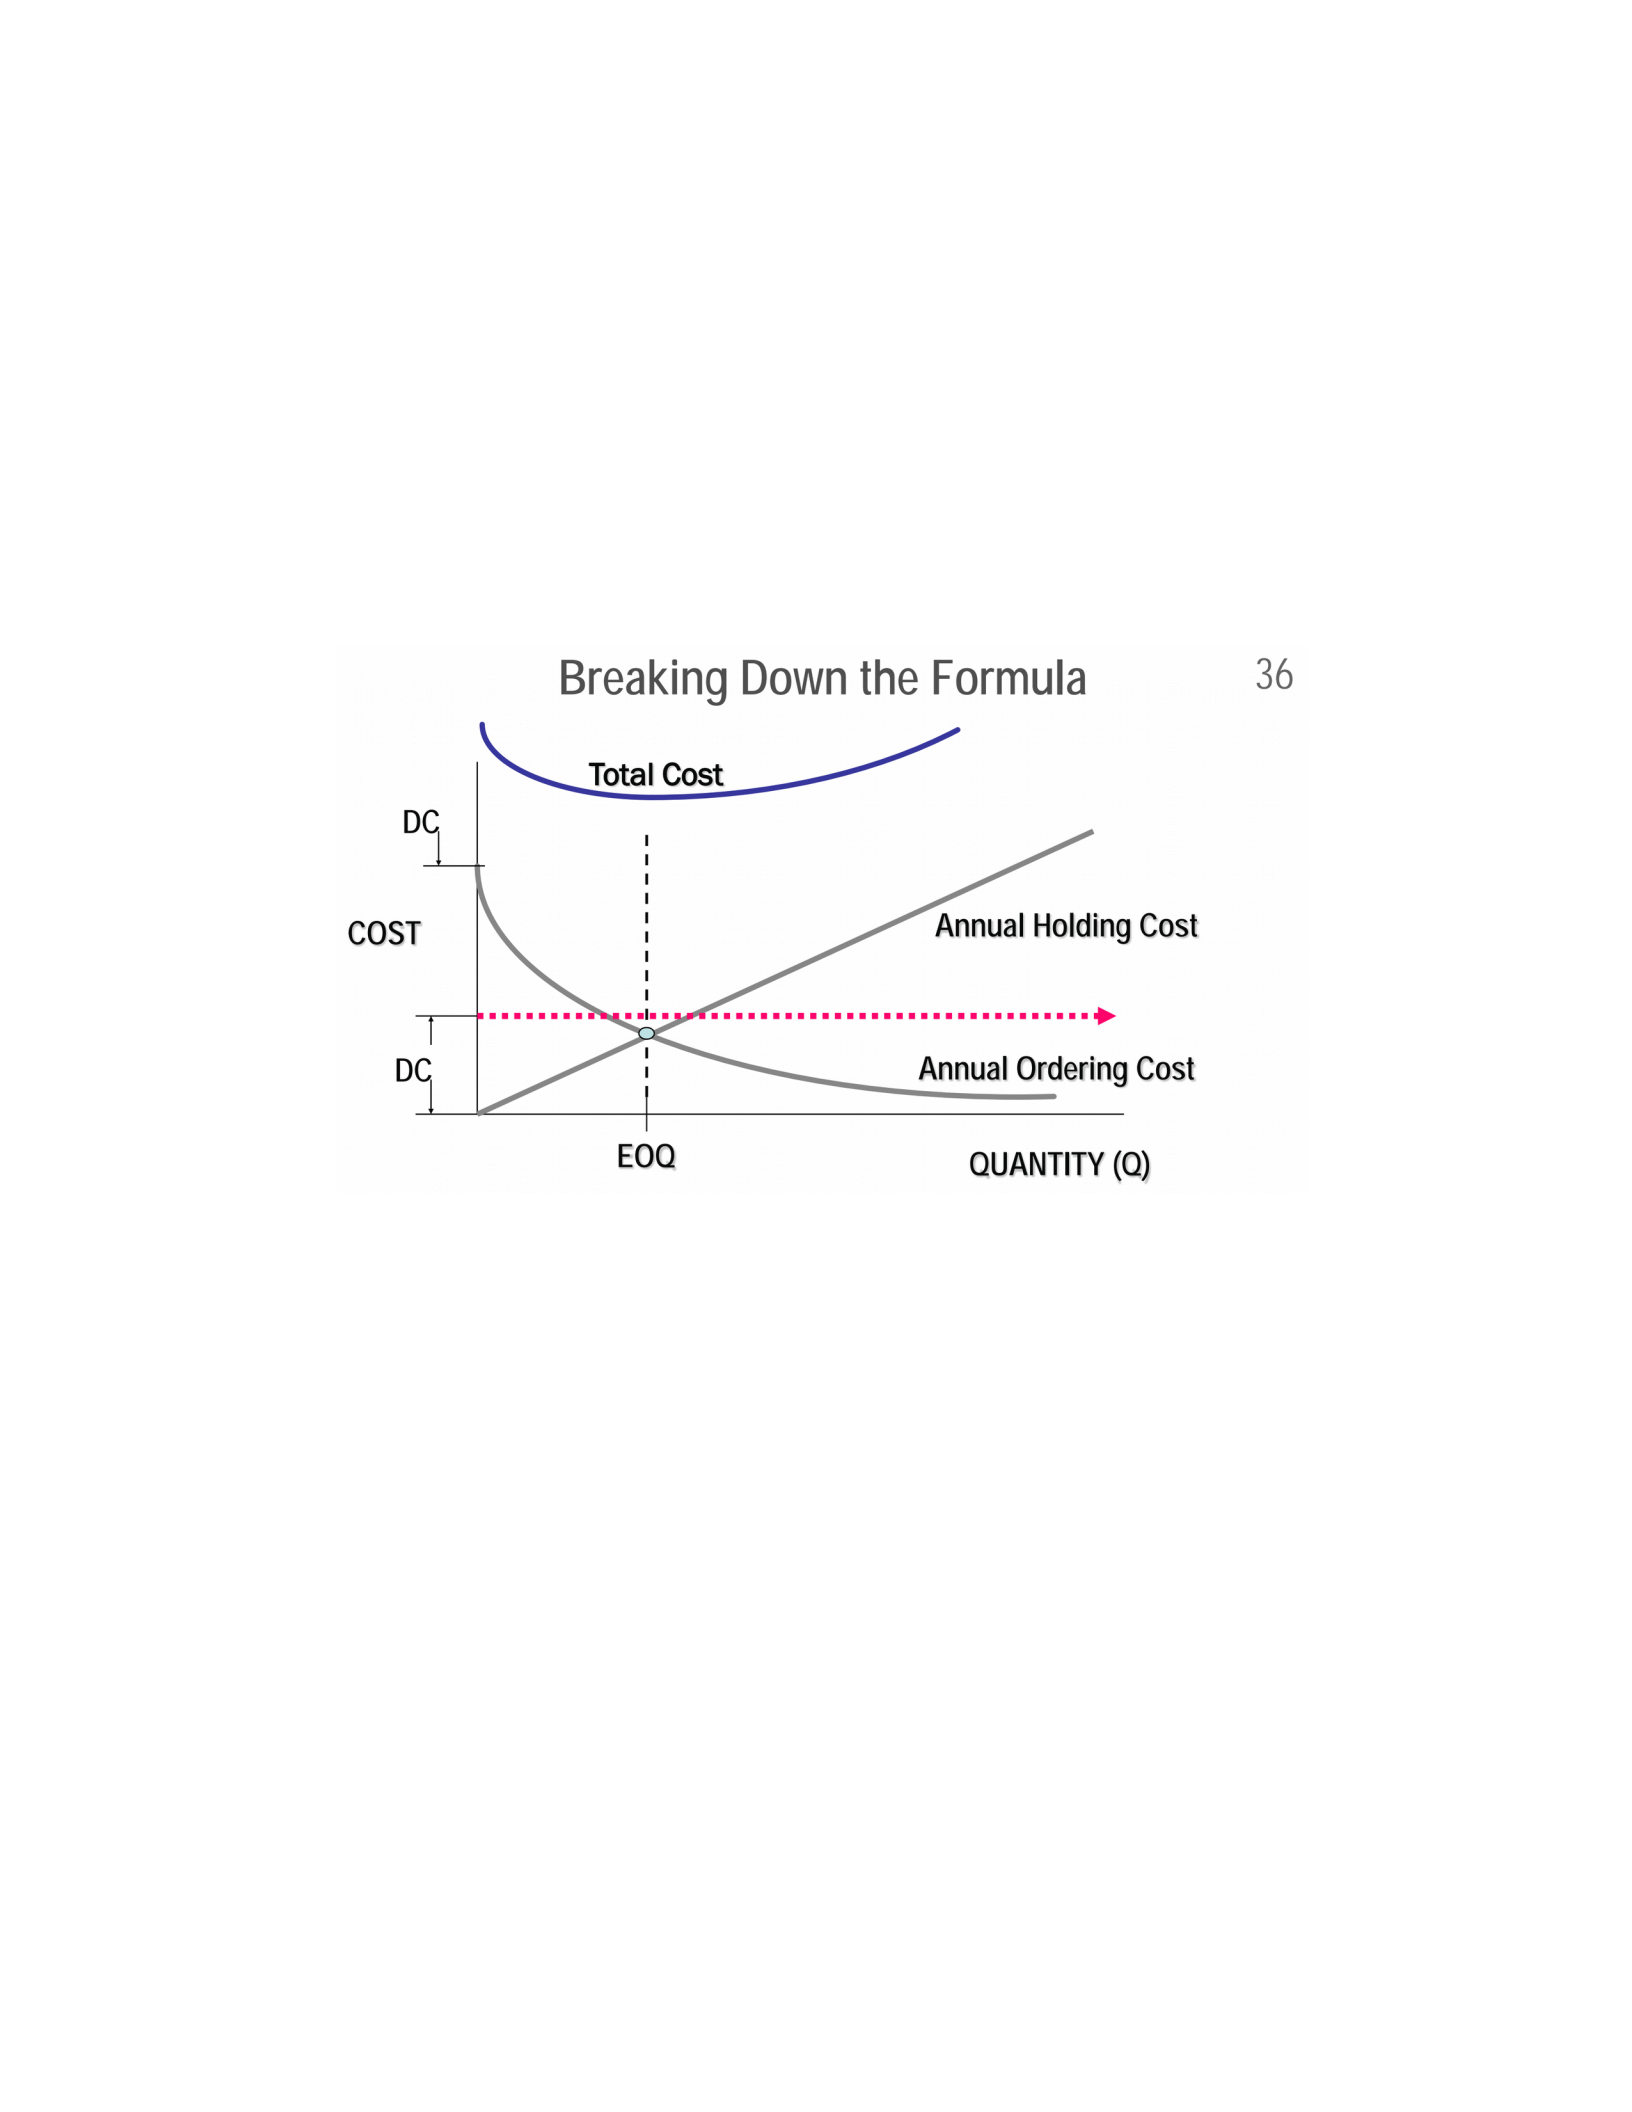
f. EOQ can also be described as the lot-size where annual holding cost is equal to
annual ordering cost
18. Relationship between AHC, AOC, and EOQ
a. Annual Holding Cost (AHC) = Annual Ordering Cost (AOC)
i. (Q/2) H = (D/Q) S
1. Q = EOQ = √2DS/H
b. The EOQ is the optimal order size
c. Using EOQ you will get the lowest TC for the given cost structure and demand
forecast
19. Graph with cost curves and EOQ
a.
20. Steps in purchasing process
a. Requisition (using a material Requisition)
i. Communicate a specific need to purchasing)
ii. Someone discovers they need something (Item A). A materials requisition
(MR) is issued by the person in need of Item A to inform procurement to get
Item A.
b. Supplier Selection (May submit a Request for Quotation)
i. In stock, Used to be in stock, Never in-stock
ii. Present supplier, New supplier
iii. Procurement searches their supplier base to see if one of their present
suppliers sells Item A. If no one does, they must find a suppler. If more than
one company sells the item, they will need to choose a supplier. In either
8

case, procurement may send out a Request for Quotation (RFQ) to get a price
for Item A. A negotiation may ensue.
c. Place order (using a Purchase Order)
i. Simple or Complex process
ii. Analysis, Negotiation, Contracts, Establish re-order system
iii. Once a supplier is chosen and a price for Item A is agreed upon, a Purchase
Order (PO) may be issued by procurement to formally order the item
d. Track Order – Communicate with supplier. Early/Late/On-time? Shelf space?
i. In an effort to inform the eventual user of Item A as to when Item A will be
available, procurement will likely track the order to see if it is due to arrive
when promised
e. Receive order – Inspect, Record, Shelve
i. Once Item A arrives it will likely be inspected, scanned into inventory, and
moved either to where it will be used or onto a shelf for storage
21. MR, RFQ, PO
a. Material Requisition (MR) – The document used to initiate the purchasing process. It
is filled out by the intended user and then sent to their procurement office to
communicate that need. It will not only signal that a product or service is needed it
may also list quantity needed, product/service description and/or specifications
b. Request for Quotation (RFQ) – if the product or service requested is not in stock, the
RFQ can be issued to one or more potential suppliers. This document simply asks the
potential supplier to provide a detailed quote that might include more than just a
per unit price; it may also include delivery date, and payment terms. Be aware the
quote provided may only be the first step in negotiation with a supplier
c. Purchase Order (PO) – If a supplier is chosen and a quote is deemed acceptable, then
an order can be formally requested through the use of a Purchase Order (PO). A PO
is a contract that states the terms and conditions of the order. Once the PO is
accepted by the supplier, a signed copy returned to the buyer represents a binding
contract
22. Making vs Buying
a. Make
i. Proprietary technology
1. Not only can others not make it, but our company does not want to
tell anyone else how to make it
ii. No competent supplier
9

1. Others can make it, but not as good as we can
iii. Better quality control
1. We like it made a certain way and are concerned others will not be as
detail oriented
iv. Idle Capacity
1. We have the machines and people to make it. Why not take
advantage of the idle capacity?
v. Control – lead time, costs, etc.
1. We want it faster, cheaper, better… that others are willing to make it.
b. Buy
i. Insufficient capacity
1. We could make it (we have the know-how), but we just don’t have the
time and resources to make it
ii. Lack of expertise
1. We don’t know how to make it
iii. No competent supplier
1. We know how to make it, but not up to the standards we’d like. Our
suppliers could definitely make it better
iv. Better use of resources
1. We know how to make it, but outside suppliers can produce it to
acceptable standards faster and/or at a lower cost
v. Quality
1.
23. Centralized vs Decentralized purchasing
a. Centralized Purchasing: A purchasing system where all corporate employees send
material requisitions to a single purchasing department. The centralized purchasing
department is then responsible for all purchasing decisions, including supplier
choice, order size, and payment terms
i. Advantages
1. Avoid Duplication – Centralized purchasing departments know the
company’s total inventory. If a request is made, the purchasing
department would be aware if someone else in the company already
has the needed item and is not using it.
10

2. Volume Discounts – By pooling together common orders from
different departments, large orders can be used to take advantage of
quantity discounts
3. Supply Specialization – In a centralized purchasing system certain
purchasing employees can develop expertise in buying certain
categories of products or services
4. Consolidated Shipping – Perhaps different departments in one
company need pens, paper, and tape. These are all items that might
come from a single supplier. Multiple orders from a single supplier all
being shipped in a single shipment
5. Established (Common) Supply Base – A centralized purchasing system
allows a purchasing department to have a core group of suppliers that
it knows and trusts. It also allows for a deep supplier relationship to
form
b. Decentralized Purchasing: A purchasing system where material requisitions are sent
to a department. Thus, a company purchasing system have a purchasing department
in each department, or perhaps each office might have the ability to make purchases
on their own
i. Advantages
1. Closer Knowledge of Requirements – In certain cases the employee
requesting the material has a better understanding of the items
required and the suppliers. Decentralized purchasing may allow user
to buy the best item for the intended
2. Closer Knowledge of the Suppliers – Especially when departments are
spread across the country or around the world, there are certain
items and services where local buyers would be able to make better
purchasing decisions than a faraway central purchasing department
3. Speed of Purchasing – In a decentralized system when a need arises a
product can be bought immediately. In a centralized system multiple
documents and approvals, as well as a dawn-out purchasing process,
may slow the purchasing of a product or service
4. Local sourcing – Relationships, lead times, flexibility
5. Less bureaucracy
c. All Items? Some Items? Services?
24. Choosing a supplier
a. Stakeholder consideration
11

i. The end-user is the focus – Consider their needs and desires
ii. Cost, Quality, Speed, and Flexibility across the supply chain
b. Plant/Warehouse Location
i. Cost and Speed Trade-offs – Inventory needs, Lead times
ii. Shrinkage, End-user expectations
c. Technology Accommodations
i. Tracking, Accuracy, Compatibility, Innovation, Overall service
d. Commitment to Product Improvement
i. Continuous improvement culture
ii. Investment in R&D
e. Commitment to Service improvement
i. Delivery, packaging, inventory monitoring, data analysis…
f. Growth management, Capacity potential
g. Quality of 2nd and 3rd Tier Suppliers
i. Assessing risk, Supply chain visibility
25. Supplier scorecards: A report card that can be used to communicate desires before a sales
presentation. It can then also communicate performance outcomes after the sales
presentation or shipment. The results can then be used to discuss changes that might be
required in future interactions
a. Supplier Scorecards help you make better decisions
b. Company is forced to quantify your desires
c. Supplier scorecards can aid in clear communication of company’s actual
desires/needs
d. Allow for meaningful discussions on present and future
e. Supplier (and entire supplier base) can grow to better serve your supply chain
26. Supplier certifications: Assessments that help ensure that a buyer’s suppliers all meet the
minimum supplier standards
a. Why?
i. A supplier’s efforts to get certified prove that they are committed to proving
their true worth and open to evaluation.
ii. Allows procurement to concentrate on a smaller circle of suppliers in each
category.
12

iii. Establishes present and future expectations
iv. Fair/Equitable evaluation benefits buyers and suppliers
b. How?
i. International standards/certification
ii. Organizational standards/certification
iii. How will companies maintain certification? Recertification process?
27. Inventory Classifications (List of Eight)
a. Raw Materials: Refers to materials, parts or components that will be used to create
an end item or service. These materials have not yet begun their
manufacturing/transformation into a finished good or service
i. Examples: unassembled handles, shafts, and shovel blades
b. Work-in-Process (WIP): Items that have begun the manufacturing process but are not
yet completed
i. Example: partially assembled shovels
c. Finished Goods (FG): Items that are completed and ready for shipment at a
manufacturing facility or assembly plant
i. Example: fully assembled shovels
d. Maintenance, Repair and Operations (MRO): Items that are not intended as part of
the finished goods but are important to the daily operations of the company
i. Examples: desks, computers, cleaning supplies, oil/lubricants, and factory
equipment
e. Market Inventory: Inventory that is readily available on the shelf
i. Example: shovels on the shelf at Home Depot
f. Safety Stock (Buffer Stock): Inventory kept to account for variation/uncertainty of
demand
i. Example: 100 shovels are sold per week Sunday to Saturday, with shipments
arriving on Sunday morning. Stores always want to start Sunday with 125
units of inventory. In this case, the additional 25 units are safety stock
g. Anticipation Inventory: Inventory that is created and stored for future use. This is
typically used to absorb uneven rates of demand that may be related to seasonal
demand or planned price reductions
i. Example: Shovels that are assembled in the summer and stored through the
fall, in anticipation of large winter demand, would be classified as
anticipation inventory
13

h. Pipeline Inventory: Inventory in transit between two points in which the two points
establish the beginning and the end of the pipeline. The inventory does not
necessarily need to be on a truck or train. The pipeline should have enough
inventory to account for the demand for the period of time it takes a product to
move from point A to point B – this is lead-time. The required pipeline inventory is
typically calculated as:
i. Pipeline Inventory = Period Demand • Lead-Time
ii. Pipeline Inventory = dL
iii. Example: Let’s define the pipeline from the time raw materials arrive until the
time they are available for sale at the store. If it takes raw material seven days
to end up on a store shelf as shovels, then the lead-time is seven days. If 100
shovels are sold per day, then the required pipeline inventory would be 700
units. If there are not 700 or more units properly distributed in the pipeline,
there will likely be a shortage within the next seven days
28. Independent vs Dependent Demand
a. Independent Demand Item: An item for which demand levels are not directly
impacted by the demand of another related item
b. Dependent Demand Item: An item for which demand levels are directly impacted by
the demand of another related item
c. Examples: Independent items (bold) along with their related Dependent items
i. Car – tires, windshield wipers, brake pads, motor oil
ii. New Home Builds – wood flooring, doors, kitchen countertops, garage door
openers
iii. iPhone X – phone chargers, Bluetooth headsets, screen protectors, protective
phone case
29. TCO
a. Total Cost of Ownership: the cost of owning an item over the entire lifetime of the
item
i. Includes: costs to acquire the item, storage, usage, handling, transportation,
maintenance, disposal, recycling, refurbishing, etc.
30. Vertical Integration
a. The act of a company taking on additional supply chain responsibilities that were
formerly don’t by outside parties. There are two classes of vertical integration
i. Forward and Backward
31. Forward Integration
14

a. Taking over supply chain responsibilities formerly performed by downstream supply
chain partners
i. Example: a bakery decided to open up a sandwich shop. Rather than just
selling bread to sandwich shops, they now forward integrate and use their
own bread for their sandwich shop
32. Backward Integration
a. Taking over supply chain responsibilities formerly performed by upstream supply
chain partners
i. Example: A bakery decides to purchase a flour company. Rather than
purchase flour from a flour supplier they now use their new flour branch to
both sell flour to other companies (including competitors) and they also use
the flour in their own bakery
33. Supplier base
a. An established group of suppliers from which a company makes most of its
purchases
i. Example: In this section the value of supplier relationships will be discussed.
Having a supplier base helps an organization build relationships with
suppliers. Also, when buyers work with a group of suppliers over a long
period of time buyers begin to understand the strengths and weaknesses of
each supplier. Buyers will know who to call when the need a rush order, who
to call when they need a high-quality part, and perhaps who to call when
staying under budget becomes vital
34. Single vs Multiple suppliers
a. Single Supplier
i. Quantity Discount Opportunities
1. When buying in large quantities a buyer may have negotiating
leverage and economies of scale may be easier to achieve. This goes
for both the purchase price of the tires and the transportation costs
2. Lowest Total Cost – Perhaps this supplier’s product and service
package cannot be matched by any other supplier. Good product,
reliable supplier, fast delivery
3. Intellectual Property Advantages – Perhaps no other company can
make a tire like the one offered by this company
4. Quality Control – With a single tire supplier a buyer can be fairly
similar in design and quality and that all business interactions will be
similar
15

5. Relationship Management is Easier – Sharing and communicating with
a single supplier can be easier than trying to maintain multiple
relationships simultaneously
6. Easier Collaboration – Sharing information about future needs and
working to help develop tires for the future is much easier with one
dedicated supplier
b. Multiple Supplier
i. Competition Breeds Innovation – Multiple tire suppliers fighting for a larger
percentage of our tire purchases will work harder to set themselves apart in
both product and service dimensions
ii. Risk Among Multiple Suppliers – If one tire supplier encounters difficulties,
the other tire suppliers are ready to step in and carry the additional load
iii. Capacity Flexibility – If more tires are needed immediately a buyer can call
upon their large tire supplier base to increase supply quickly
iv. Location Advantage – For car companies that have multiple plants around the
country or even around the world, having multiple suppliers may help ensure
that a tire supplier is always relatively close by. This can reduce
transportation costs and also reduce lead times. This can help reduce
inventory requirements
16

