



WEEK ONE
What are Analytics?
Principles of Problem Framing
Tell interesting & complete story
oProblem should be meaningful, solution could be reused for related problems,
assumptions/boundaries
Find an appropriate solution framework
oBreak down the problem into pieces, iterative process (agile vs waterfall), identify
appropriate analytical/modeling techniques
Routinize the procedure
oDocumentation, next similar questions can be solved quickly, build a system
(macros, codes, programs)
Analytics
Process of developing actionable decisions or recommendations for action based on
insight generated from historical data
Represents the combination of computer technology, management science techniques,
& statistics to solve real problems according to the Institute for Operations Research &
Management Science (INFORMS)
Agile approach: perform business discovery perform data discovery prepare data
model data score & deploy evaluate & improve
Data Collection & Methods
Primary data: survey, interviews, used a lot in marketing research
Secondary data: firm’s proprietary database, internet data, stock/capital market data,
accounting disclosure data
Simulated data: data based on assumption & simulation, used a lot in
scheduling/routing/queuing
Data Preparation
Data extraction – extract data from primary/secondary source
Data transformation – transform/clean data into proper format or structure for the
purpose of querying & analysis
Data load – load data into final target database, more specifically an operation data
store, data mart or data warehouse
ETL
Models in Business Analytics
Data Analytics Model
Preliminary stage of data processing that creates a summary of historical data to yield
useful information & possible prepare the data for further analysis
Questions : what happened? What is happening? What are our sales since last year?
Which customer is frequenting our store more often and what are they buying?

Methods : standard reporting, dashboards, visual analytics
Outcome : well defined business problems & opportunities
Diagnostic/Explanatory Analytics
This is about looking into the past & determining why a certain thing happened, usually
revolves around working on a dashboard
Questions : why did it happen? How did it happen? Why did our sales surge in the month
of November? Why are our customers not buying certain products?
Methods : inferential statistics, visual analytics
Outcome : Discover/understand causal relationships of an outcome
Predictive Analytics
The use of data, statistical algorithms & machine learning techniques to identify the
likelihood of future outcomes based on historical data. Goal is to go beyond knowing
what has happened to provide a best assessment of what will happen in the future
Question : what will happen next? Why will it happen next? What will be our likely
revenue in the next five years? Who will respond to our advertisement?
Methods : data mining, text mining, forecasting
Outcome : accurate projections of future outcomes & events
Applications : predict water leakage in city water pipe network, predict when person will
go into depression, predict crime activities in LA by LAPD, predict performance for
certain stock portfolios, forecast demands for sales, predict if customer is likely to buy
certain product/service
Prescriptive Analytics
Answers the question of what to do by providing information on optimal decisions based
on the predicted future scenarios; key is being able to use big data, contextual data &
lots of computing power to produce answers in real time; combination of data,
mathematical models and various business rules
Question : what should be done about it? Why should you do it? What should we do if a
certain product is not shelling good? How do we manage inventory when the product
demand is low?
Methods : optimization, simulation, expert systems
Outcome : best possible business decision & outcome
Applications : used in producing credit score, asset management in utility companies,
optimized operating conditions to maximize productions & minimize risks, better utilize
capital, personnel, equipment, vehicles, & facilities
Decision-Making Biases
Heuristics vs Analytics
Heuristics: learns by acting, uses trial & error, values experience/effort reduction, relies
on common sense, seeks satisficing solution, fast & frugal, may lead to decision biases
Analytics: learns by analyzing, uses step-by-step procedure, values quantitative
information & models, builds mathematical models & algorithms, seeks optimal solution

Decision-Making Biases
Tend to believe or seek out information to preserve our own opinions/beliefs
Can cause a gap in how we reason & how we should reason, causing us to make bad
decisions
We make better decisions using critical thinking & being a bit analytical
Cognitive Bias
Anchoring bias – over-reliant on the first piece of information you hear
oMost of buying decisions are affected by anchoring effect
oWonder why retail price tends to be 39.99 instead of 40?
Bandwagon effect – group thinking, adopting a decision based on the number of people
who hold a certain belief
oMost famous example is how the US Navy treated the threat of a Japanese attack
on Pearl Harbor in HI
Clustering illusion – tendency to see patterns in random events
oGambler’s fallacy
Zero risk bias – because we love certainty & hence ignore risk entity while making
decision
Availability heuristics – overestimate the importance of information that is available
oExample: after seeing movie about nuclear disaster, you may be convinced that
nuclear war or accident is highly likely
Overconfidence – too confident about your ability, especially when you are considered
an expert in your field
Endowment effect bias/status quo bias – phenomenon in which most people would
demand a considerably higher price for a product that they own than they would be
prepared to pay for it
oHypothesis that people value a good more once their property right to it has
been established
Framing effect – people react to a particular choice in different ways depending on how
it is presented
oAdvertisers use this to present information in a manner that influences how
viewers interpret that information
Sunk-cost fallacy – individuals commit this when they continue a behavior or endeavor
as a result of previously invested resources
oLonger you have been together with fallacy, harder it is to break up
oConsider the opportunity cost of operating with sunk cost bias driving your
decision-making process, instead of logic
Decoy effect bias – we make decisions based on what will have the most utility to us
oConsumers will tend to have a specific change in preference between two
options when presented with a third option that is asymmetrically dominated
Negatives of Analytical Decision Making

Analytical decision-making – approach where leader or manager only makes important
business decisions with solid data or information at hand
Drawbacks: delayed action, lack of flexibility, frustrations in teams
WEEK TWO
Data Variables

Data Variables
Qualitative – descriptive & conceptual & cannot be measured
Quantitative – can be counted, measured, & expressed using numbers
Numerical – interval & ratio
oInterval – distances between consecutive integers are equal
Relative magnitude of numbers is meaningful
Differences between numbers are comparable
Location of origin, “zero,” is arbitrary
Data are always numerical
oRatio – similar to interval but has a true zero point; commonly used for values
that are measured in numbers
Relative magnitude of numbers is meaningful
Differences between numbers are comparable
Location of origin, zero, is absolute (natural)
Categorical – nominal & ordinal
oNominal – numerical values just “name” the attribute uniquely; numbers used to
classify (male or female) or categorize (color) – can be stored as “word”; “text”;
or “nominal code”
oOrdinal – numbers used to indicate rank or order
Relative magnitude of numbers is meaningful
Differences between numbers not comparable
Descriptive Statistics
What is Statistics?
Science concerned with developing & studying methods for collecting, analyzing,
interpreting and presenting empirical data to assist in making effective decision
Principles of describing data: center, spread, shape
Inferential statistics – estimate uncertainty (using probability) some member of the data
to infer about population data
Population vs Sample
Population – the whole
oCollection of persons, objects, or items under study
oCensus – gathering data from the entire population
Sample – portion of the whole/population
oSubset of the population; must be large enough to represent the whole
Measuring Data Centrality
Yield information about the center, or middle part, of a group of numbers
oMean – average of a group of numbers
Not applicable for nominal (categorical) or ordinal data
Affected by each value in the data set, including extreme values

Computed by summing all values in the data set & dividing the sum by
the number of values in the data set
oMedian – middle value in an ordered array of numbers
Applicable for ordinal, interval (quantitative), ratio data
Not applicable for nominal data
Unaffected by extremely large/small values
oMode – most frequently occurring value in a data set
Applicable to all levels of data measurement
oPercentiles
oQuartiles
Measuring Data Variability
Describe the spread or dispersion of a data set
oRange – difference between the largest & smallest values in set of data
Simple to compute
Ignores all data points except two extremes
oInterquartile range
oMean absolute deviation – average of the absolute deviations from the mean
oVariance – average of the squared deviations
oStandard deviation – square root of the variance
Data Shape
Describe the skewness of a set of data
Kurtosis – measure of whether the data are peaked or flat relative to a normal
distribution
oHigh kurtosis tend to have a distinct peak near the mean, decline rather rapidly,
& have heavy tails
oLow kurtosis tend to have a flat top near the mean rather than a sharp peak
Data Association
Two variables have strong statistical relationship with one another if they appear to
move together
When two variables appear to be related, you might suspect a cause-and-effect
relationship
Covariance – measure of the linear association between the two variables, X & Y;
different formulas used for populations & samples
oAverage of the product of the deviations of each pair of observations from their
respective means
oCorrelation coefficient is scaled between -1 and 1
Correlation – measure of the linear relationship between two variables, X & Y, which
does not depend on the units of measurement
oMeasured by the correlation coefficient, also known as the Pearson product
moment correlation coefficient

oCorrelation coefficient is scaled between -1 and 1
Observational & Experimental Study
Sample Study
Mostly done if you want to estimate the parameters of the population
Inferential statistics enables us to determine such parameters
You make sure the sample is representative of the population before analyzing it
Observational Study
How different parameters in the population behave together, if or not they move
together in the same direction
Draw conclusions on correlations
No outside intervention during the study
You use the data available to you
Why?
oCan examine long-term effects
oSometimes experiments are not ethical
oNew methods & technology for causal estimations
Experimental Study
Establish causality from observational study in a controlled environment
Design an experiment to study aa certain effect by intervention
You plan for the data before you collect it
Why?
oExperiments allow us to set up a direct comparison between the treatments of
interest
oWe can design experiments to minimize any bias in the comparison
oWe can design experiments so that the error in the comparison is small
A/B Testing
A/B Testing
Split testing/bucket testing
Method oof comparing two versions of a webpage or app against each other to
determine which one performs better
Two or more variants of a page are shown to users at random, & statistical analysis is
used to determine which variation performs better for a given conversion goal
Process of A/B Testing
Take a webpage or app screen & modify it to create a second version of the same page
Change you want to see should be controlled to a single change
Use a script to randomly show half of your visitors the original version of the page
(control) & the other half are exposed to modified version of the page (variation)

Tools
Optimizely
Visual web optimizer
Adobe target
Google content experiments
Experimental Design
Why Experimental Study?
Allow us to set up direct comparisons between the treatments of interest
We can design experiments to minimize any bias in the comparison
We can design experiments so that the error in the comparison is small
We are in control of experiments, allowing us to make stronger inferences about the
nature of differences that we see in the experiment
Why Design a Controlled Experiment?
Control – using an experiment is the only reliable way to measure response to changing
variables
Estimation – using an experiment guarantees that you learn something about what you
want to know
Efficiency – using an experiment learn the most from the experiment
Experimental Design
The process of planning a study to meet specified objectives
Planning experiment properly is important in order to ensure that the right type of data
and a sufficient sample size and power are available to answer the research questions of
interest as clearly & efficiently as possible
Planning of Experiments
Need to decide
oMeasurement to make (response)
oCondition to study (treatment)
oMaterials to use (units)
Terms & Concepts
Treatments – different procedures we want to compare
Experimental units – things to which we apply the treatment
Responses – outcomes that we observe after applying a treatment to an experimental
unit
Randomization – use of a known, understood probabilistic mechanism for the
assignment of treatments to units
Experimental error – random variation present in all experimental results
Measurement units – actual objects on which the response is measured
Blinding – occurs when the evaluator of response does not know which treatment was
given to which unit

Control – treatment is a “standard” treatment that is used as a baseline for the other
treatment
Placebo – null treatment that is used when the act of applying a treatment, any
treatment, has an effect
Factors – combine to form treatment; individual setting for each factor are called levels
of the factor
Block – arranging of experimental units in groups (blocks) that are similar to one another
Confounding – occurs when the effect of one factor or treatment cannot be
distinguished from that of another factor/treatment
WEEK THREE
Inferential Statistics
Inferential Statistics
Use random sample of data taken from population to describe & make inference about
the population
You can use information from sample to make the generalization
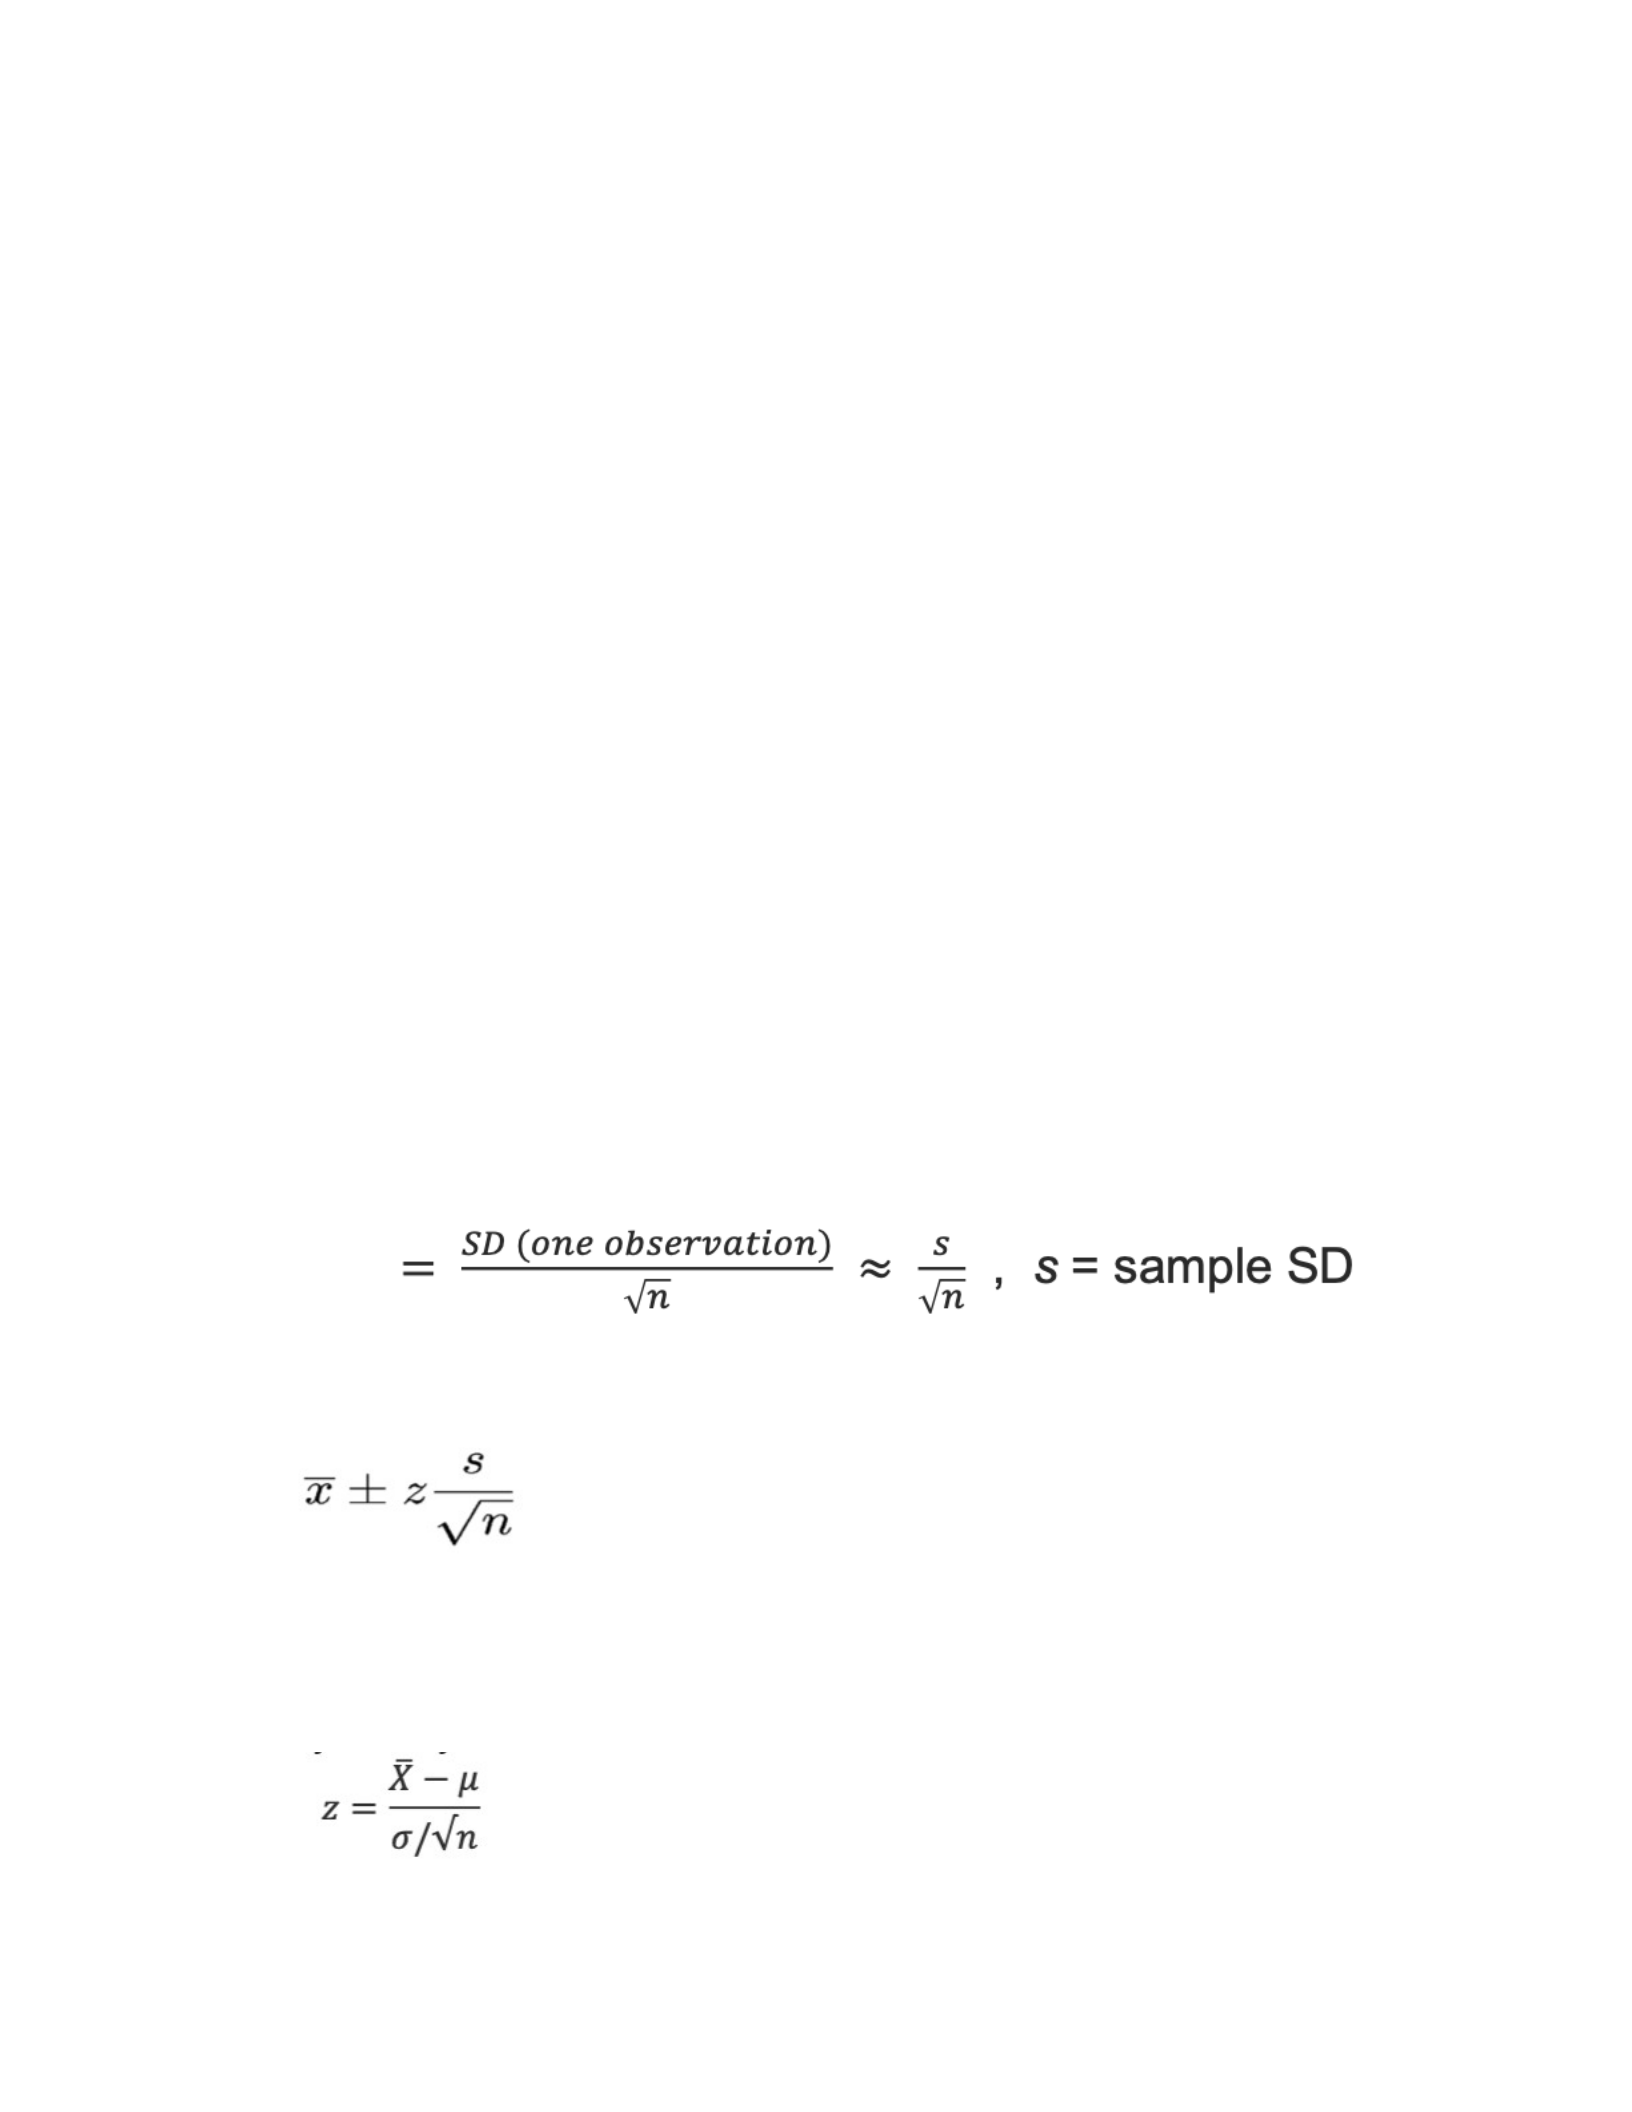
Margin of error – arises from sampling error which is the error we make for not being
able to represent our sample correctly
Randomization & Central Limit Theorem
Random Sampling
Each sample has an equal probability of being chosen
Meant to be unbiased representation of the total population
Important for drawing conclusions about the population
Selection Bias
Online survey
oPolls completed only by visitors to the site
oThose with an interest in the websites mission are the only ones who will
participate
Non-response
oSome individuals less likely to respond to a survey
Social Desirability
oWant to study what factors lead to academic dishonesty
oWho will be participating?
Central Limit Theorem
Observation
oExpected mean of the sample means is the true population mean
oStandard deviation of sample mean distribution (SE) decreases as the sample size
“n” increases
oIncreasing sample size “n” reduces the average sampling error
Confidence Interval & Confidence Level
Confidence interval – range of values that is likely to contain the population mean
Confidence level – proportion of samples that will yield a confidence interval that
actually contains the population mean
T-statistics vs Z-statistics
Z-statistics are good for larger samples (n>30) with underlying distribution of the
population may or not be normal
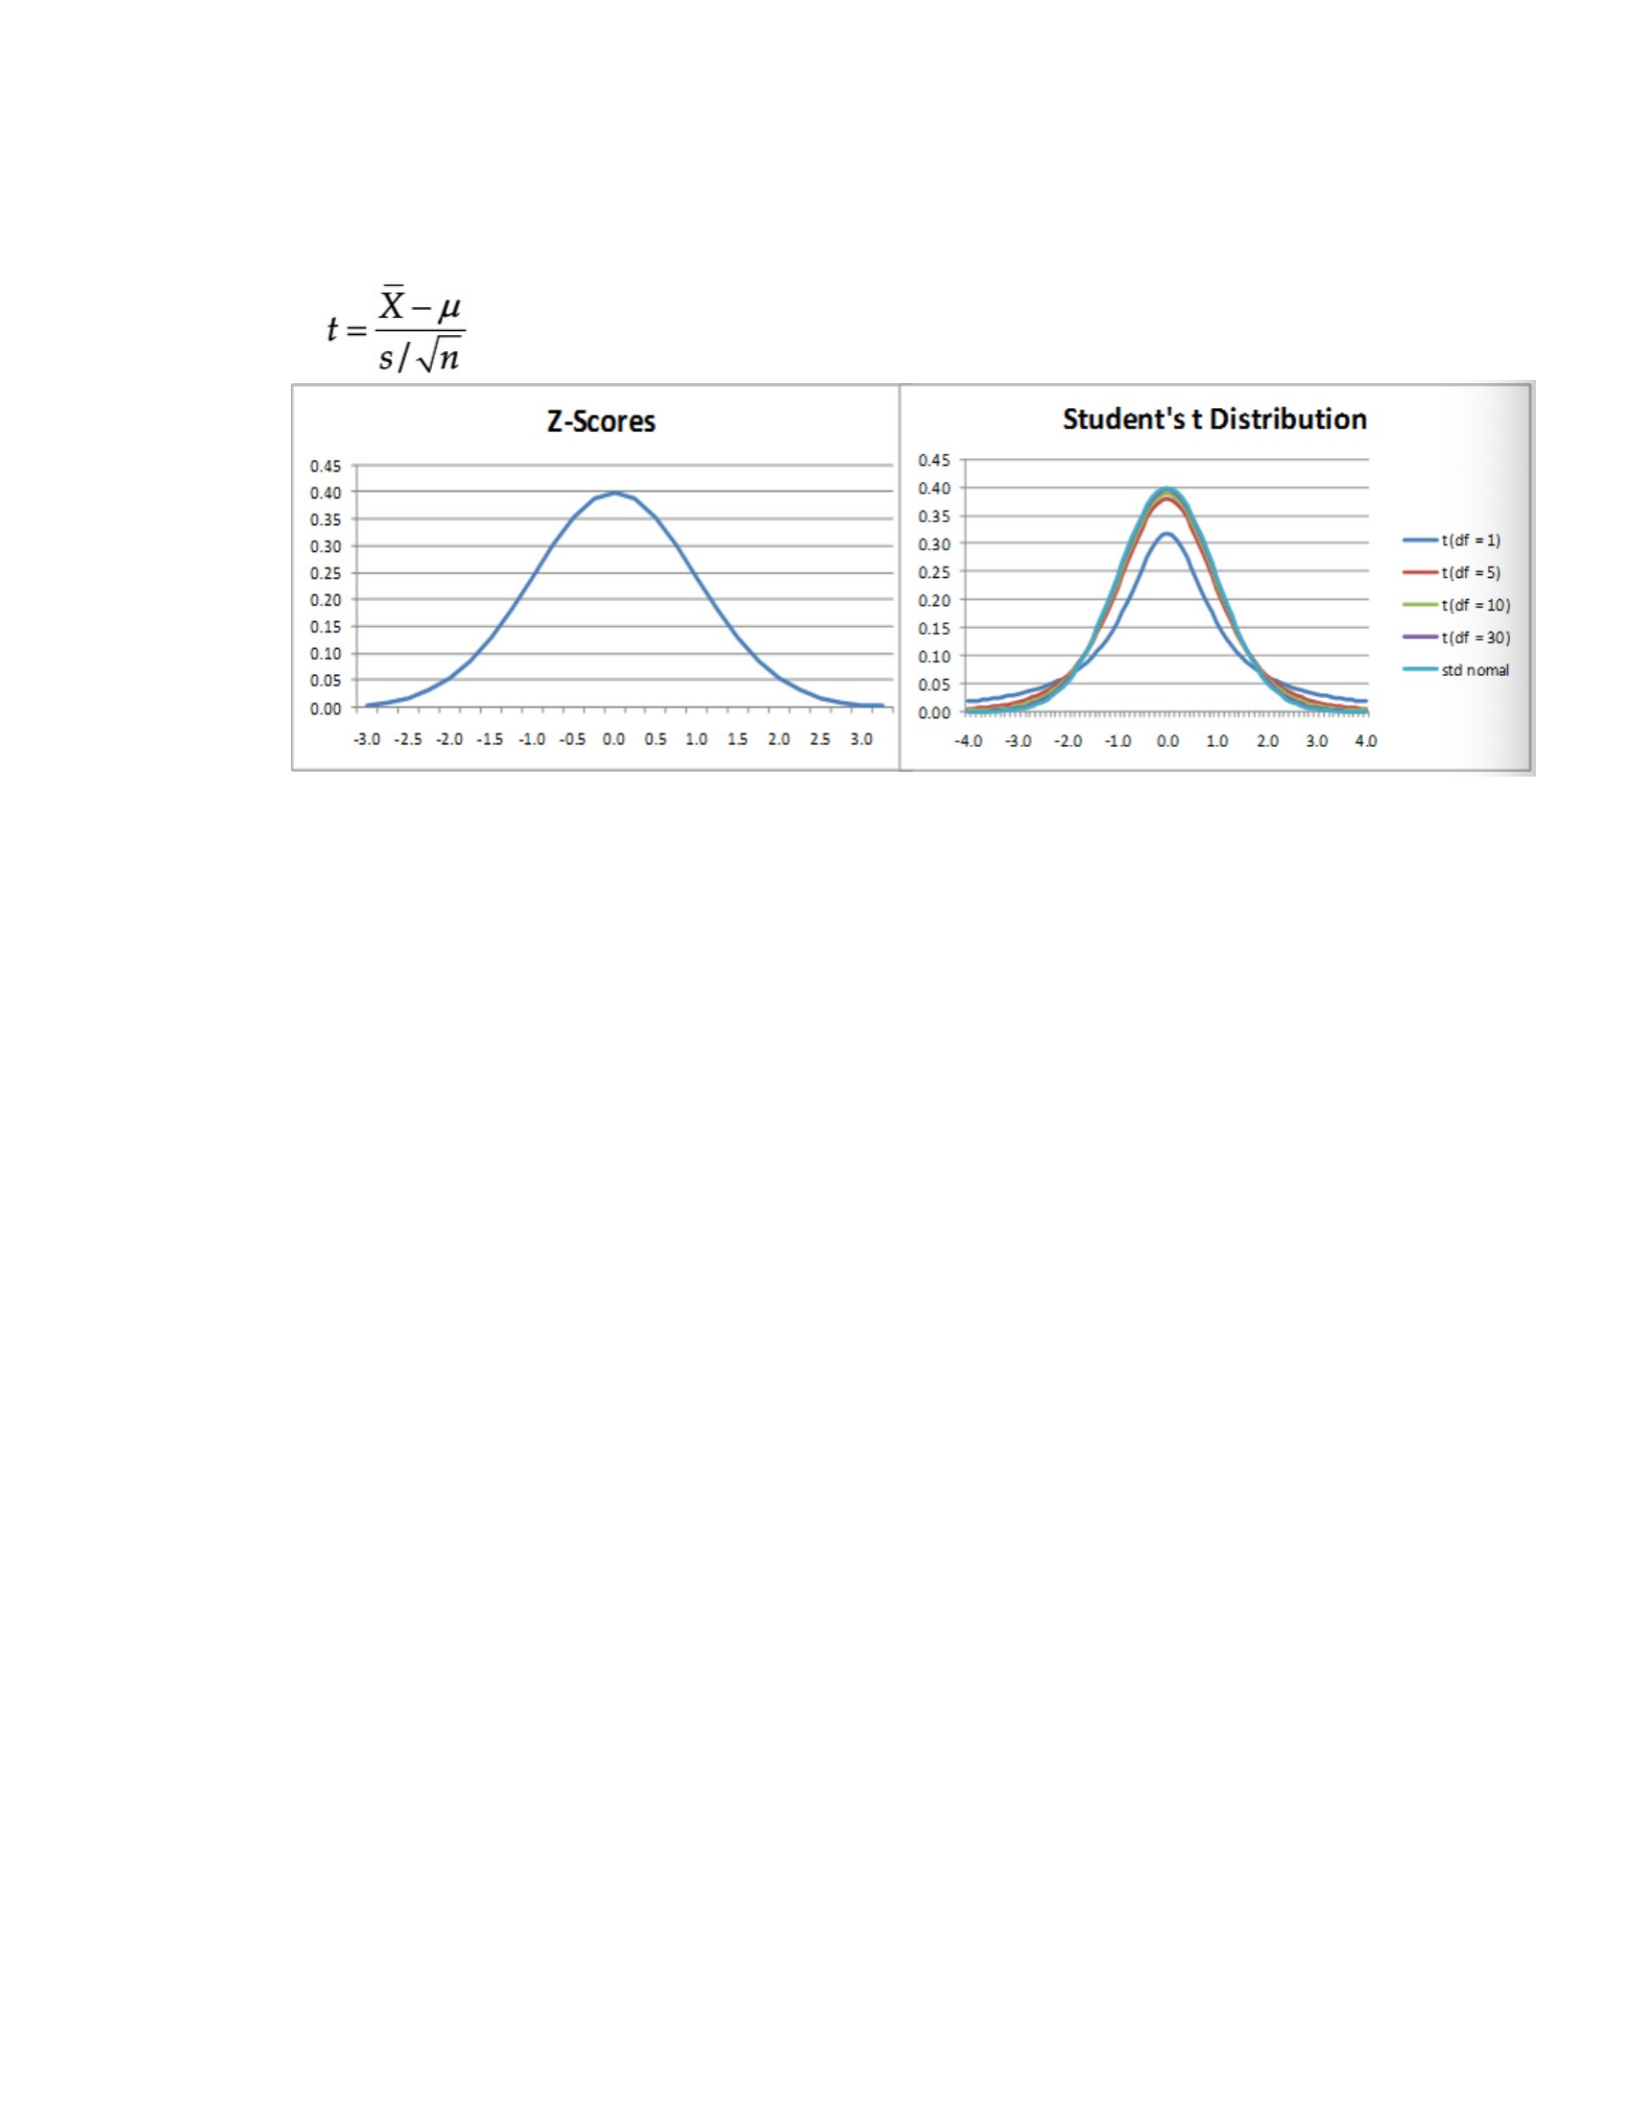
T-statistics are used when the population SD is unknown, good for sample n<30 with
underlying population that is normal
Hypothesis, Confidence Interval & p-value
Formulating Hypothesis
Null hypothesis (H0) – statement that generally assumes nothing has changed
Alternative hypothesis (Ha) – opposite of null, typically your claim
Testing the Hypothesis
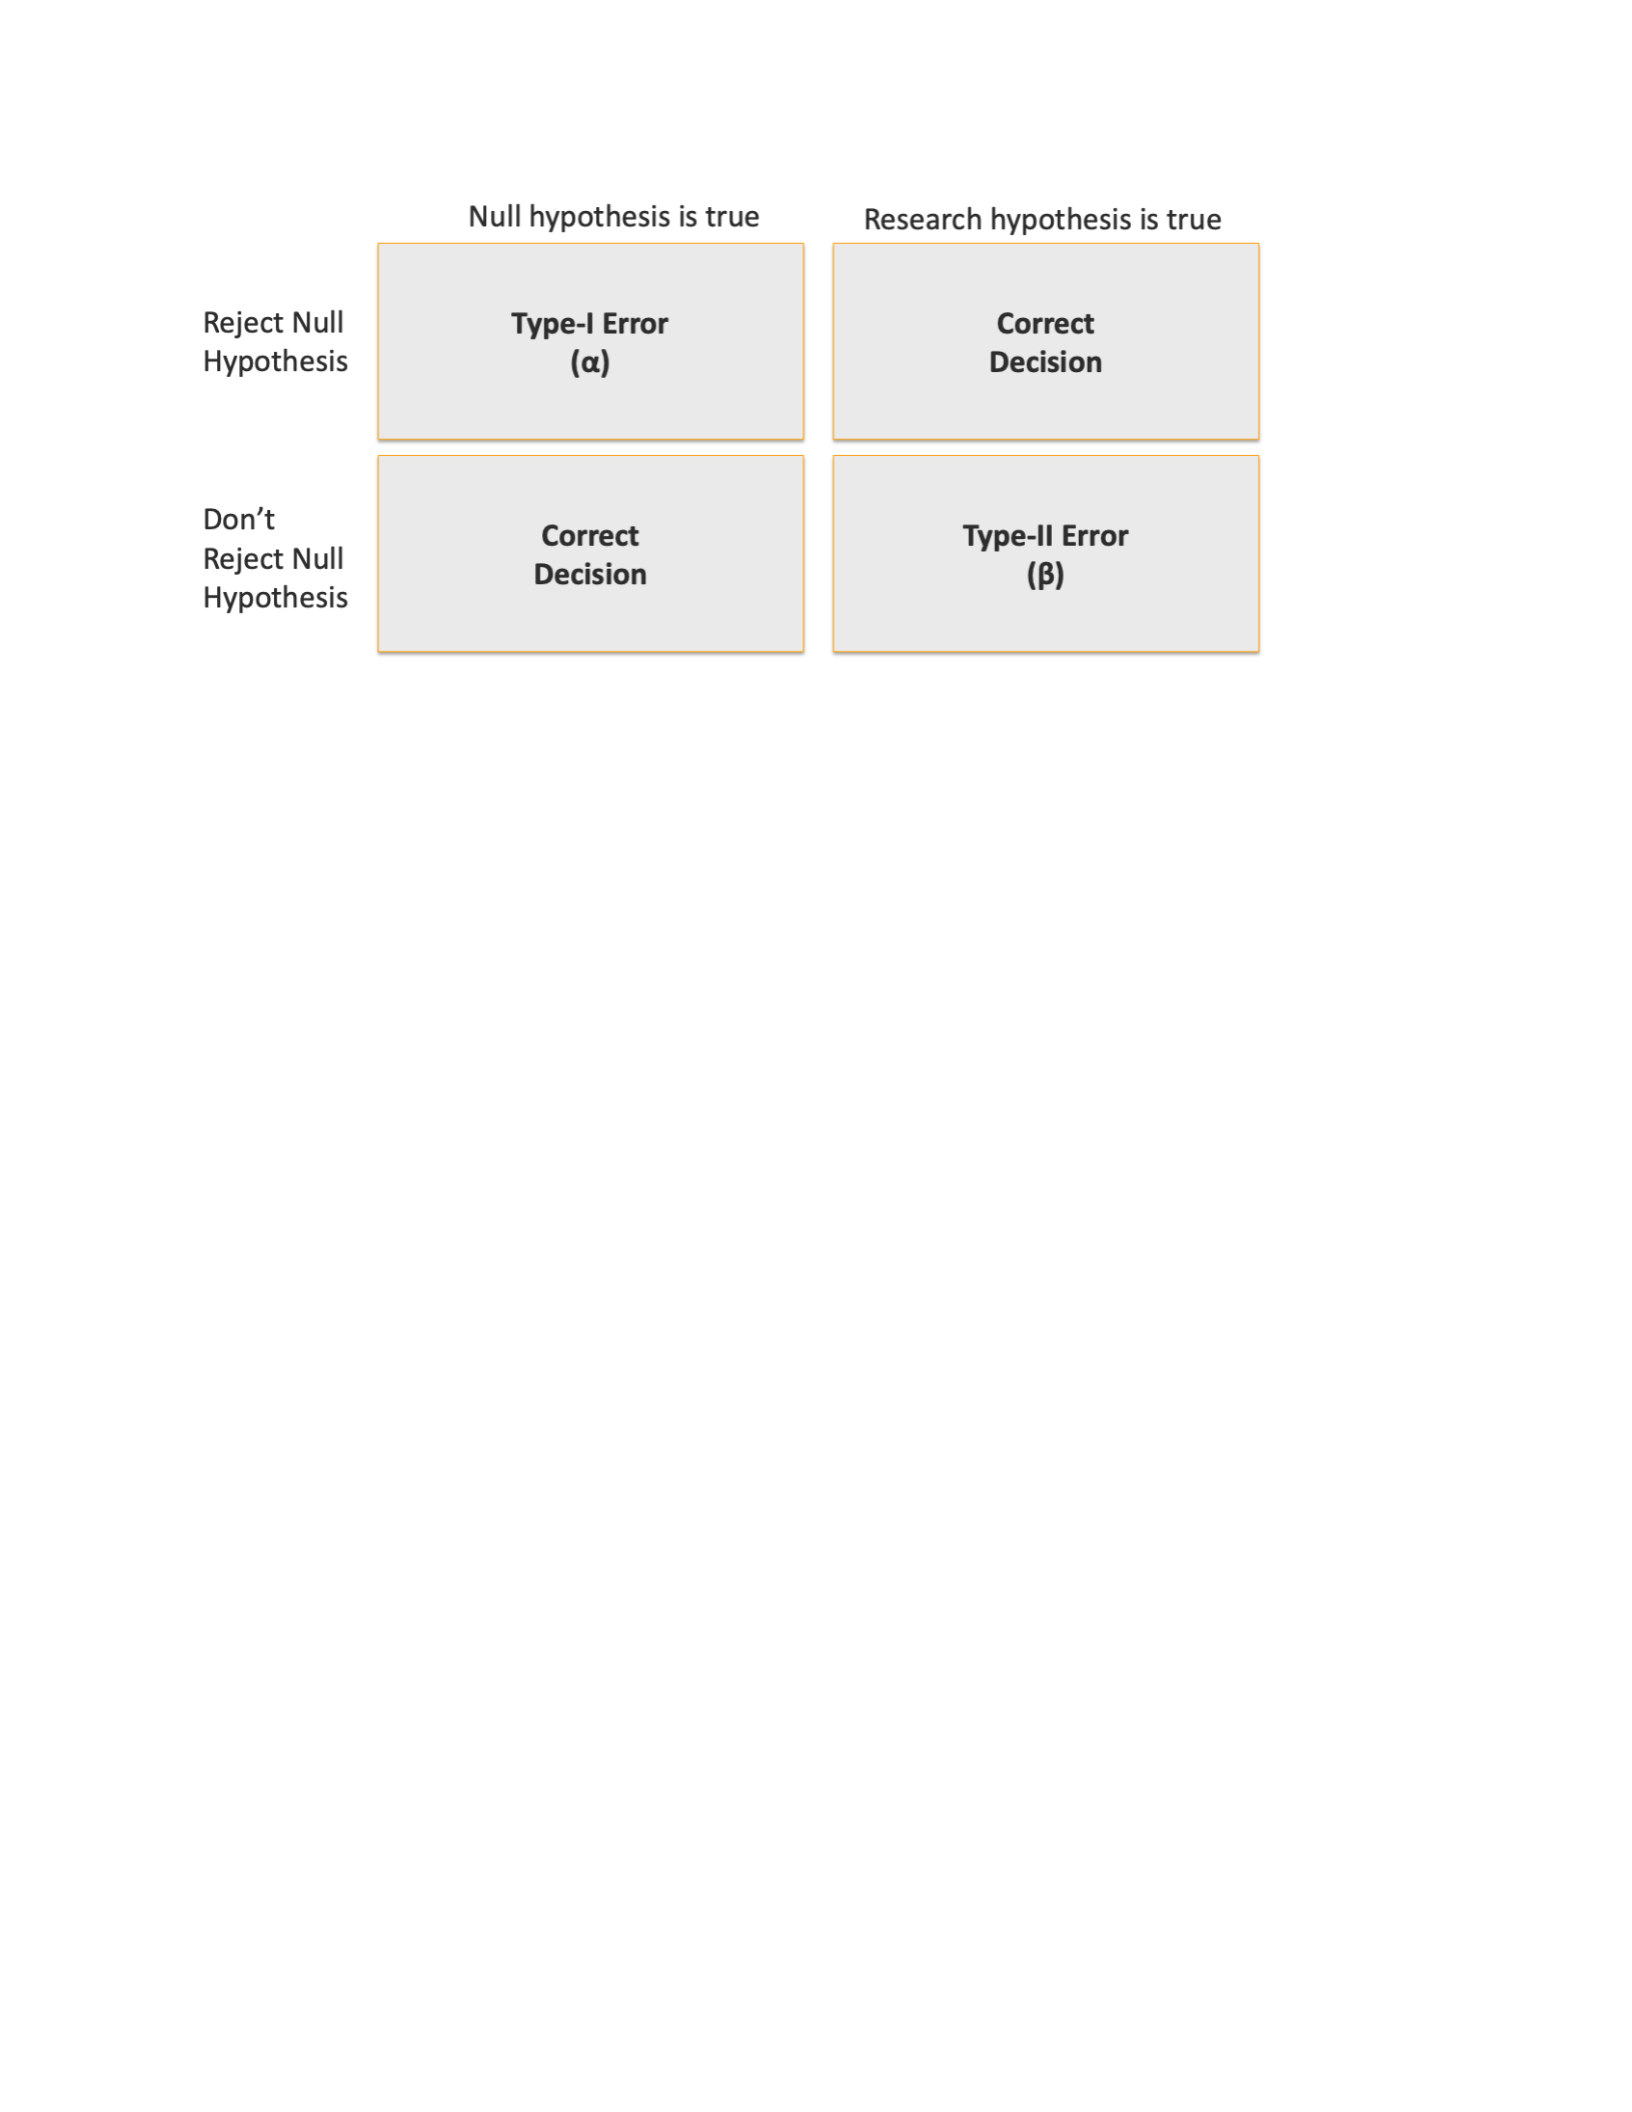
Only two outcomes for any hypothesis test: reject the null hypothesis or failed to reject
the null hypothesis (don’t have sufficient evidence to reject)
Never ever accept the null hypothesis
When. The. null is true, the probability of finding more extreme value is called p-value
oWhen p-value is lower than a, then reject the null hypothesis
Confidence Interval in Hypothesis Testing
Confidence level
oIf CL = 98%, the confidence interval gets wider than when CL = 95%
oYou do so to be more confident in your results
Sample size
oIf you increase the sample size, the CI becomes narrower
oYou get more precise measurement
Standard deviation
oIf you increase your SD, the confidence interval gets wider
oYou have more uncertainty & less precision in your measurement
Hypothesis Testing
T-test
Used to determine whether a sample comes from a population with a specific mean
Population is often unknown however we have a generalized idea about the population
Sometimes also called a single parameter test or single sample t-test
Assumptions:
oOne dependent variable that is measured continuously
oDatta are not correlated
oNo significant outliers
oData should be normally distributed
One-way Analysis of Variance (ANOVA)
Useful when you are comparing more than two sample means
Observations are independent
Equal variances for each population
Process investigates variances to establish if the means are significantly different
One way ANOVA can’t tell you which groups are different from one another, just that at
least one of the means of the three groups is different
Can do some follow-up test to figure out which groups are actually different
Methods of Multiple Mean Comparison
Bonferroni: extremely general & simple, but not powerful
Turkey’s: the best for all-possible pairwise comparisons when sample sizes are unequal,
or confidence intervals are needed; very good even with equal sample sizes without
confidence intervals
Stepdown: most powerful for all possible pairwise comparisons when sample sizes are
equal
Dunnett’s: for comparing one sample to each of the others, but not comparing the
others to each other

WEEK FOUR
Extract, Transform, & Load
ETL
Data from business organizations may be scattered in different locations & in different
format
Allows us to:
oConvert various data formats & types to adhere to one consistent system
oMigrate data into data warehouse
Predefined process for accessing & manipulating the source data in loading it into a
target database
Requirements for ETL Architecture
Specific business requirements
Data compliance
Data security
Data integration
End user delivery interface
Data archiving
Alignment with overall enterprise architecture
Extract
Gather data
oRaw data that is written directly into the disk
oPrimarily from legacy, operational systems
oData written to relational tables from structured source
oExternal data such as social media often purchased from third party
Cleansing data
oEliminate duplicates or fragmented data
oExclude unwanted information
Cleansing Data
Reasons: dummy variables, missing data, multipurpose fields, cryptic data, personally
identifiable information of customers, dirty data due to data entry error
Steps in data cleansing:
oParsing
oCorrecting
oStandardizing
oMatching
oConsolidating
Data Transformation
Transforms the data in accordance with the business ruled & standards that have been
established

Load
Data physically moved to the data warehouse
Loading takes place within a “load window”
Trend is to near real time updated of the data warehouse as it is increasingly used for
business decisions
At this point, data is ready for in-depth analysis depending on your business questions
What is Data Mining?
Data Mining
The nontrivial process of identifying valid, novel, potentially useful, & ultimately.
Understandable patterns in data stored in structured databases
Using a broad range of techniques, you can use this information to increase revenues,
cut costs, improve customer relationships, reduce risks & more
Confluence of Multiple Disciplines
Statistics – quantify the data
MIS – provides & receives feedback to data mining process for better management of
information
Artificial intelligence – offers data driven knowledge/solution
Data base – make the data available in right format for data mining
Mathematical modeling – implementation of theory better understanding of data
Pattern recognition – find structure in data by using machine learning algorithms
Data Classification Analysis
Unlabeled/unsupervised
oData is not labeled with outcome category
oGoal is to find cases that are similar to each other based on provided data
oClustering is helpful – important applications such as market segmentation etc
Labeled/supervised
oObservations are labeled with outcome
oPredict outcome category with other variables
oApply that model to new data
oAccuracy is important
oLimited to variables and categories in original data
oLabels may be subjective
Usages/Applications
Insurance & banking: fraud detection & risk assessment
Retail industry: effectiveness of product placement, coupon offers, churn analysis
Federal govt: IRS, justice department, homeland security
Medicine: predict effectiveness of medicine/procedure
Pharmaceutical firms: discover new treatments/optimal drugs for certain diseases and
conditions by mining genetic materials

Challenges:
Data visualization of discovered knowledge could sometime be hard to interpret
Handing data outliers & missing data are often not very straight forward processes
Patterns found in the knowledge discovery process may be uninteresting to the given
user and may have subjective interpretation
Data extraction process from a huge database could be a challenge sometimes
Clustering Analysis
What is Clustering?
Grouping is based on information found only in the data that describes the objects &
their relationship
Greater the similarity within a group & greater the difference between groups, most
distinct the clustering
K-Means Clustering
Steps:
oStep 1: randomly generate k-random points as initial cluster center
oStep 2: the distance from each data point to the nearest cluster centroid is
computed
oStep 3: re-compute the new cluster centroid (take avg). repeat steps 1 & 2 until
assignment of points to the centroid is stable
Cluster Evaluation using sum of square error
oLower individual cluster SSE = a better cluster; it increases cluster cohesion
oLower total SSE = a better set of clusters
oMore clusters will reduce SSE
Pros
oGood at segmenting large number of dataset
oFast & efficient in terms of computational cost
oResults are relatively easy to interpret
Cons
oMust decide the value of k prior to the analysis which can be a bit difficult to
predict without domain expertise
oGives unreliable results when: clusters vary widely in size/density, are. Not
rounded in shapes, & have a lot of outliers
Hierarchical Clustering
Agglomerative
oBegin with n-clusters (each record its own cluster)
oMerge two closest records in distance into one cluster, so that now, you have one
fewer cluster
oKeep joining records into clusters until one cluster is left
oDendrogram, from left to right, illustrates the process

Divisive Methods
oStart with one all-inclusive cluster
oRepeatedly divide into smaller clusters
oMore efficient when compared with agglomerative method
oUse a threshold to determine the termination criterion
Limitations
oOnce a decision is made to combine two clusters, it cannot be undone
oNo objective function is directly minimized
oDifferent schemes have problems. With one or more of the following
Sensitivity to noise/outliers
Difficulty handling different sized clusters & convex shape
Measuring Distance Between Clusters
Single linkage – distance between two clusters is the distance between the pair of
records Ai and Bj
Complete linkage – distance between two clusters is the distance between the pair of
records Ai and Bj that are the farthest from each other
Average linkage – distance between two clusters is the average. Of all possible pair-wise
distances
Desirable Cluster Features
Stability
oAre clusters & cluster assignments sensitive to slight changes in inputs?
oAre cluster assignments in partition B similar to partition A?
Separation
oCheck the ratio of between-cluster variation to within-cluster variation
oHigher this ratio, the better
Application of Clustering Analysis
Customer Segmentation
Can be performed using a variety of different customer characteristics
Helps reduce the. cost of marketing
Customer reach is more effective & efficient
Upselling customers across the customer journey
Attract additional customers that match a certain group criteria
Target communication
Stimulating innovation
Collaborative Filtering
Making recommendations only based on how user rated products in the past, not based
on anything about the product themselves
When you want to guess a rate for user (u) for an item (i), you find which cluster the user
belongs to then assign the rate based on the cluster characteristics

Dynamic Trend Detection
Involves the clustering stream data & detecting trends & patterns
Examples of stream data: network traffic, web clickstreams, video surveillance, & sensor
networks
Useful when data quality is not important to answer a question
Document Classification
Cluster documents in multiple categories based on tags, topics, & the content of the
document
Very standard classification problem & k-means is highly suitable algorithm for this
purpose
Insurance Fraud Detection
Utilizing past historical data on fraudulent claims, it is possible to isolate new claims
based on its proximity to clusters that indicate fraudulent patterns
Since insurance fraud can potentially have multi-million-dollar impact on a company, the
ability to detect frauds is crucial
IT Alerts
Because alert messages potentially point to operation issues, they must be manually
screened for prioritization for downstream processes
Clustering of data can provide insight into categories of alerts & mean time to repair, &
help in failure predictions
Earthquake Studies
Clustering observed earthquake epicenters to identify dangerous zones

