


AL CS 1: X-linked Agammaglobulinemia
Group:
Members name and jobs
Manager:
Recorder:
Presenter:
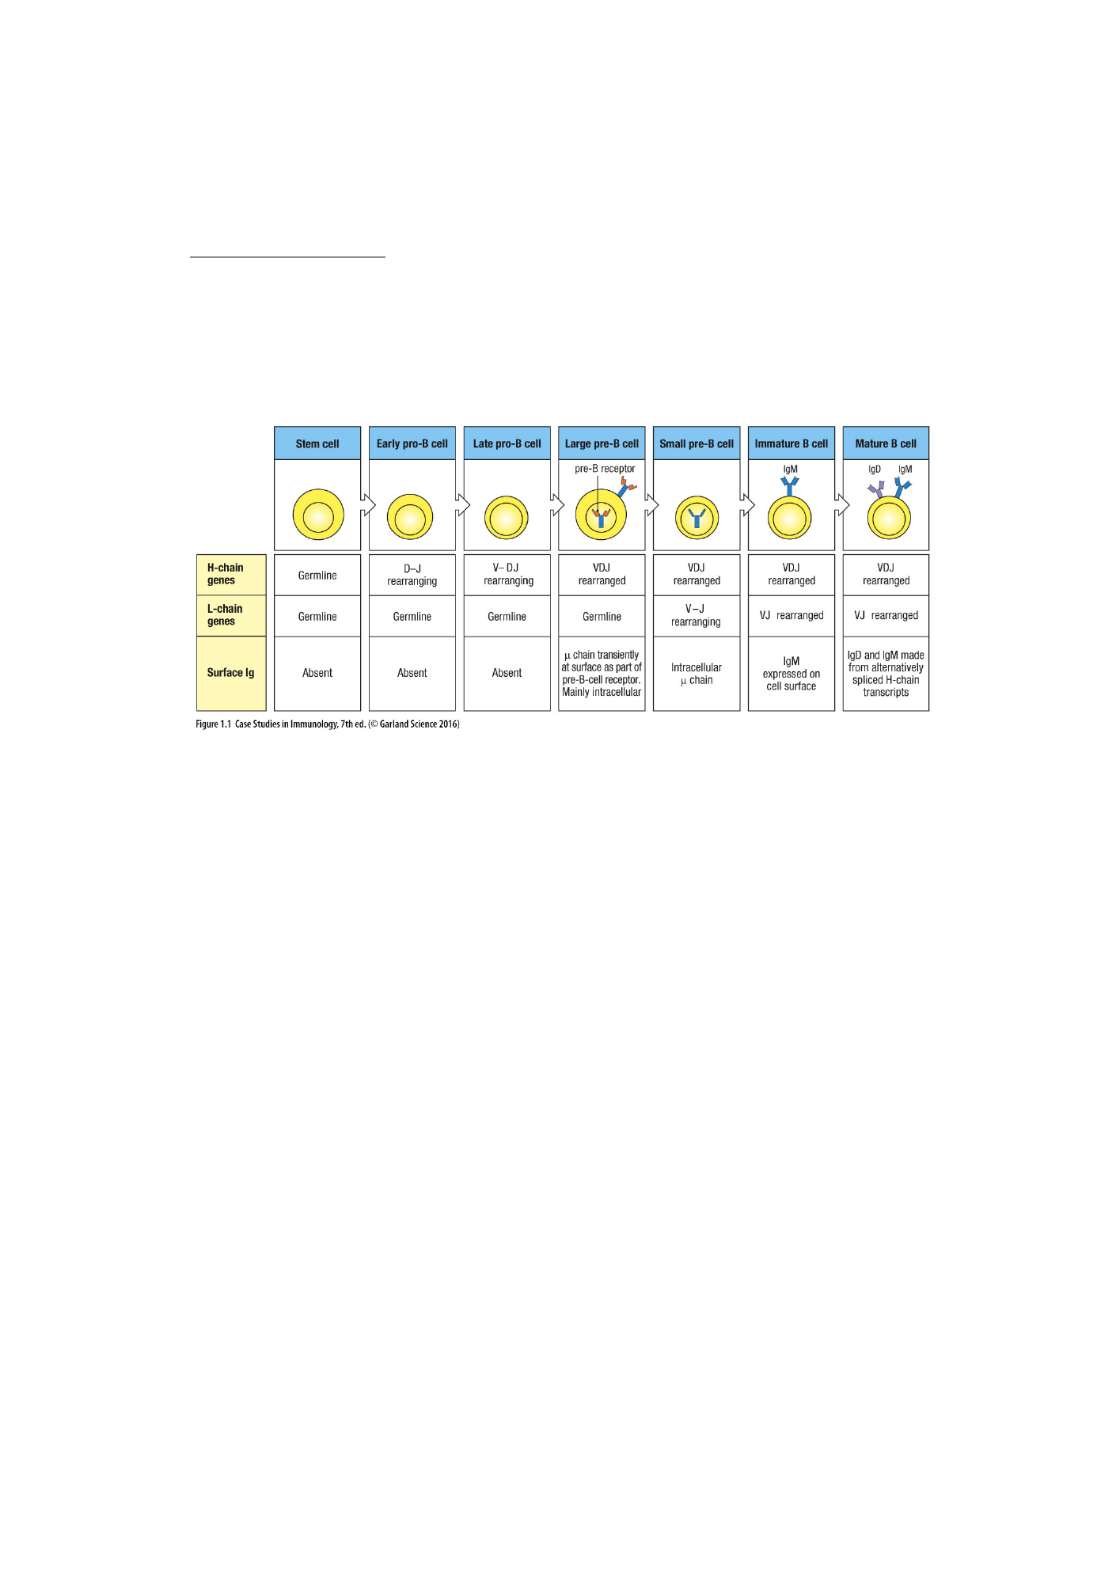
Figure 1: B cell development. This figure shows B cell development broken into 7 stages
depending on V(D)J rearrangements of the heavy and light chain loci and surface expression of
immunoglobulins.
1) Early pro-B cells are the first step in B cell maturation. What V(D)J rearrangement
happens in this cell?
2) What two stages of B cell development have heavy chain D-J and V-DJ rearrangements?
3) What constant region is transcribed with the developing heavy chain in the first
functional check point of B cell development (Large pre-B cell)? This check point
presents the newly rearranged heavy chain on the surface to make sure the randomly
rearranged VDJ segments do not contain a stop codon and are able to fold into a
functional immunoglobulin fold.
3/1/25, 11:51 AM
AL CS 1 B cell development
about:blank
1/7

4) If the developing Large pre-B cell is able to signal through Ig , the cell internalize the aa
heavy chain, and proliferates. The resulting stage of development is called small pre-B
cell. What locus/loci is/are rearranged in the small pre-B cell?
5) Negative selection happens after both heavy and light chains have rearranged but before
the mature B cell expresses and constant regions (via alternately spliced mRNA). a a
This stage is called immature B cell. If the immature B cell receptor (surface antibody)
binds strongly to self-antigen the cell will undergo additional rounds of light chain VJ
recombination or die via apoptosis. Using only surface antigens (think FACS analysis),
how would you differentiate immature B cells from all other stages of B cell
development?
6) Mature B cells (also called naïve) express two isoforms of antibody constant regions: a
and constant regions. This means they have both IgM and IgD on their surface. What a
is the mechanism within the cell that allows these two isoforms to be expressed on the
surface at the same time with the exact same antigen binding sites.
3/1/25, 11:51 AM
AL CS 1 B cell development
about:blank
2/7
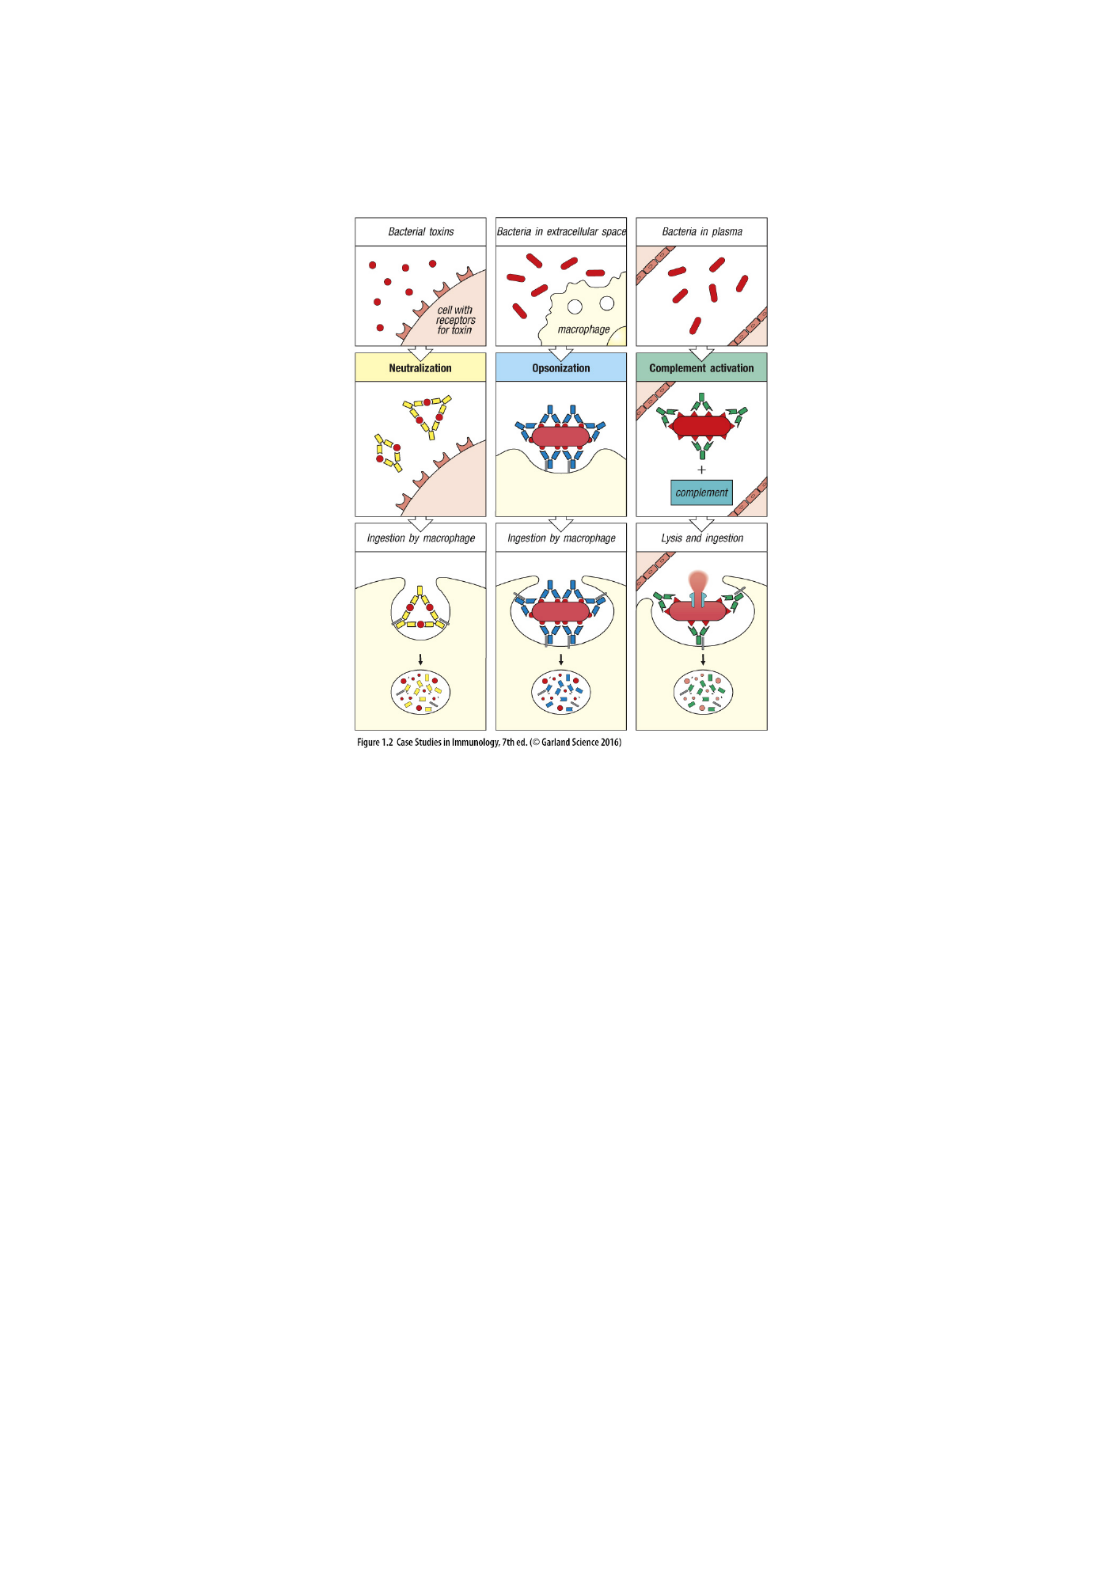
Figure 2: Antibody activities that protect hosts from disease.
7) Case Study 1 is about a patient who is unable to make normal levels of serum
antibodies. What type of infections did he suffer from? Describe one in moderate
detail.
8) Figure 2 show three ways antibodies fight bacterial infections. List then briefly describe
the mechanism behind each.
3/1/25, 11:51 AM
AL CS 1 B cell development
about:blank
3/7
9) Which innate cell plays a central role in antibody mediated clearance of bacteria.
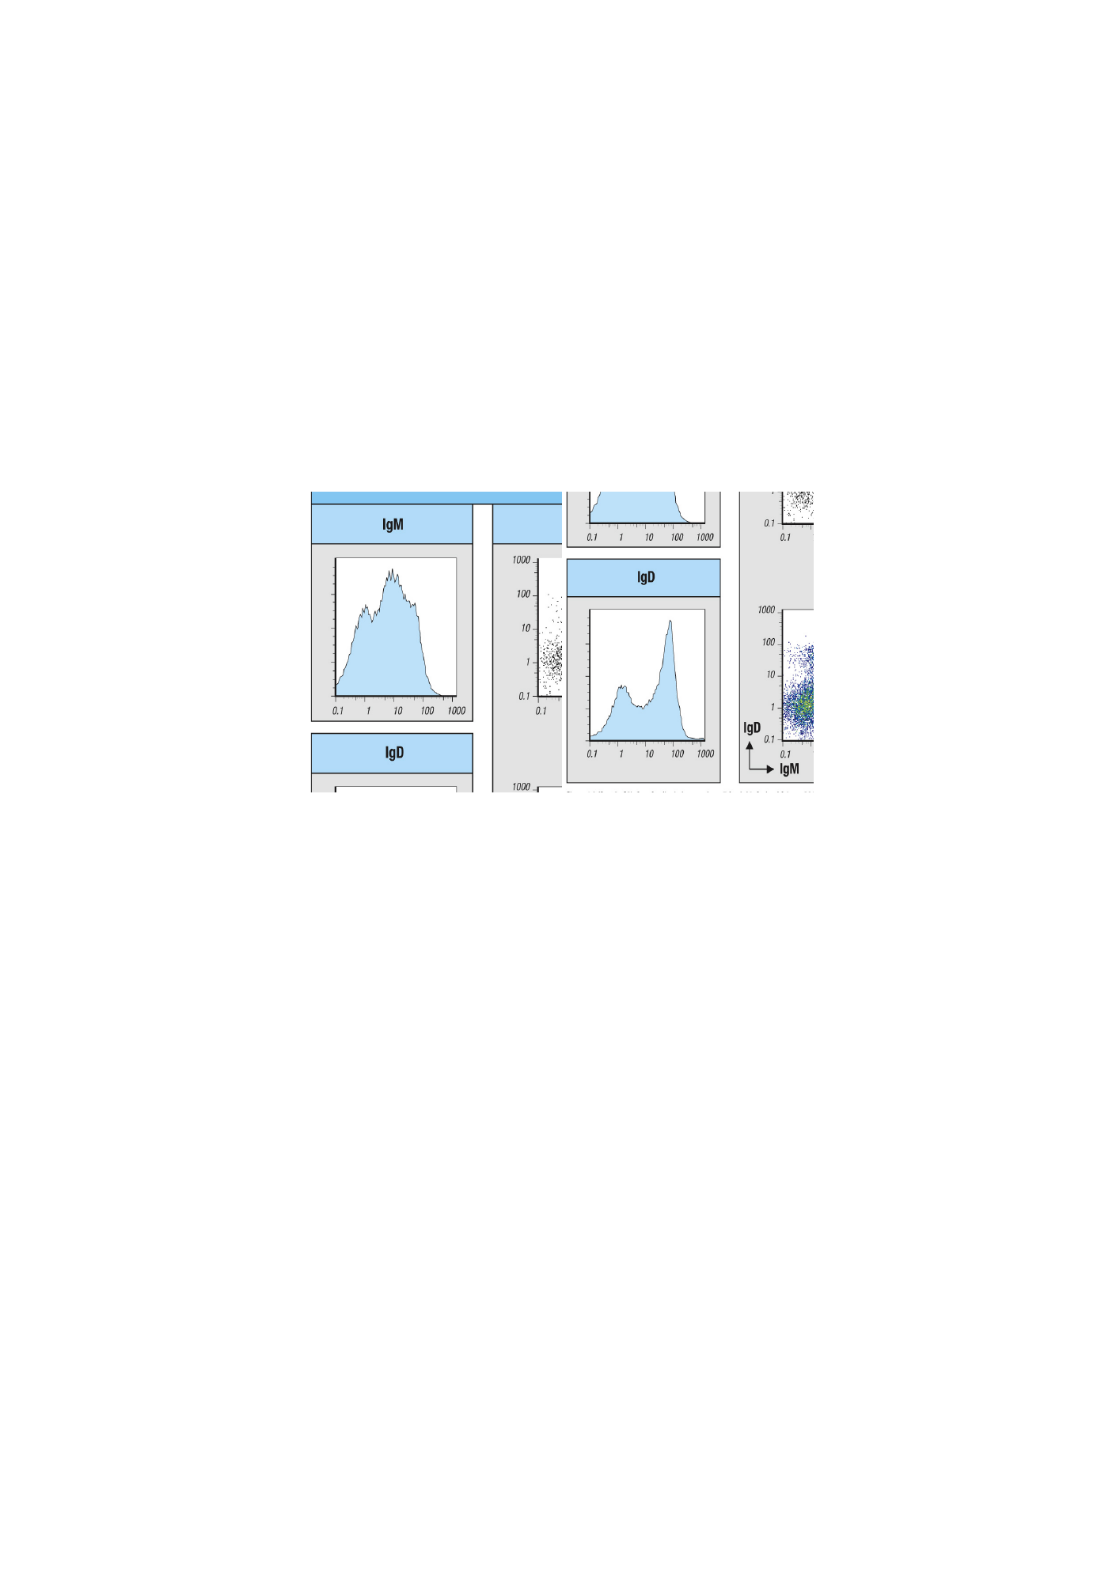
Figure 3: FACS analysis of B cells. This figure shows FACS analysis of B cells that have been
stained with antibodies that bind to IgM or IgG. The X-axis shows a log scale of fluorescence
intensity. The Y-axis shows number of cells. The B cells stain with anti-IgM antibodies show a
bimodal distribution: one peaks at 1 unit, the other at 10 units. A third peak is also possibly
showing at about 80 units. The B cells stain with IgD show a much cleaner bimodal distribution:
one peak at 1 unit and the second peak at 90 units.
10) In both of the graphs in Figure 3 we see a bi-modal distribution of intensity. We should
interpret this as two pools of cells. The first pool of cells would be “negative” for surface
expression the second poll of cells have significant surface expression. Circle the two
“negative” peaks and label them “negative.”
3/1/25, 11:51 AM
AL CS 1 B cell development
about:blank
4/7
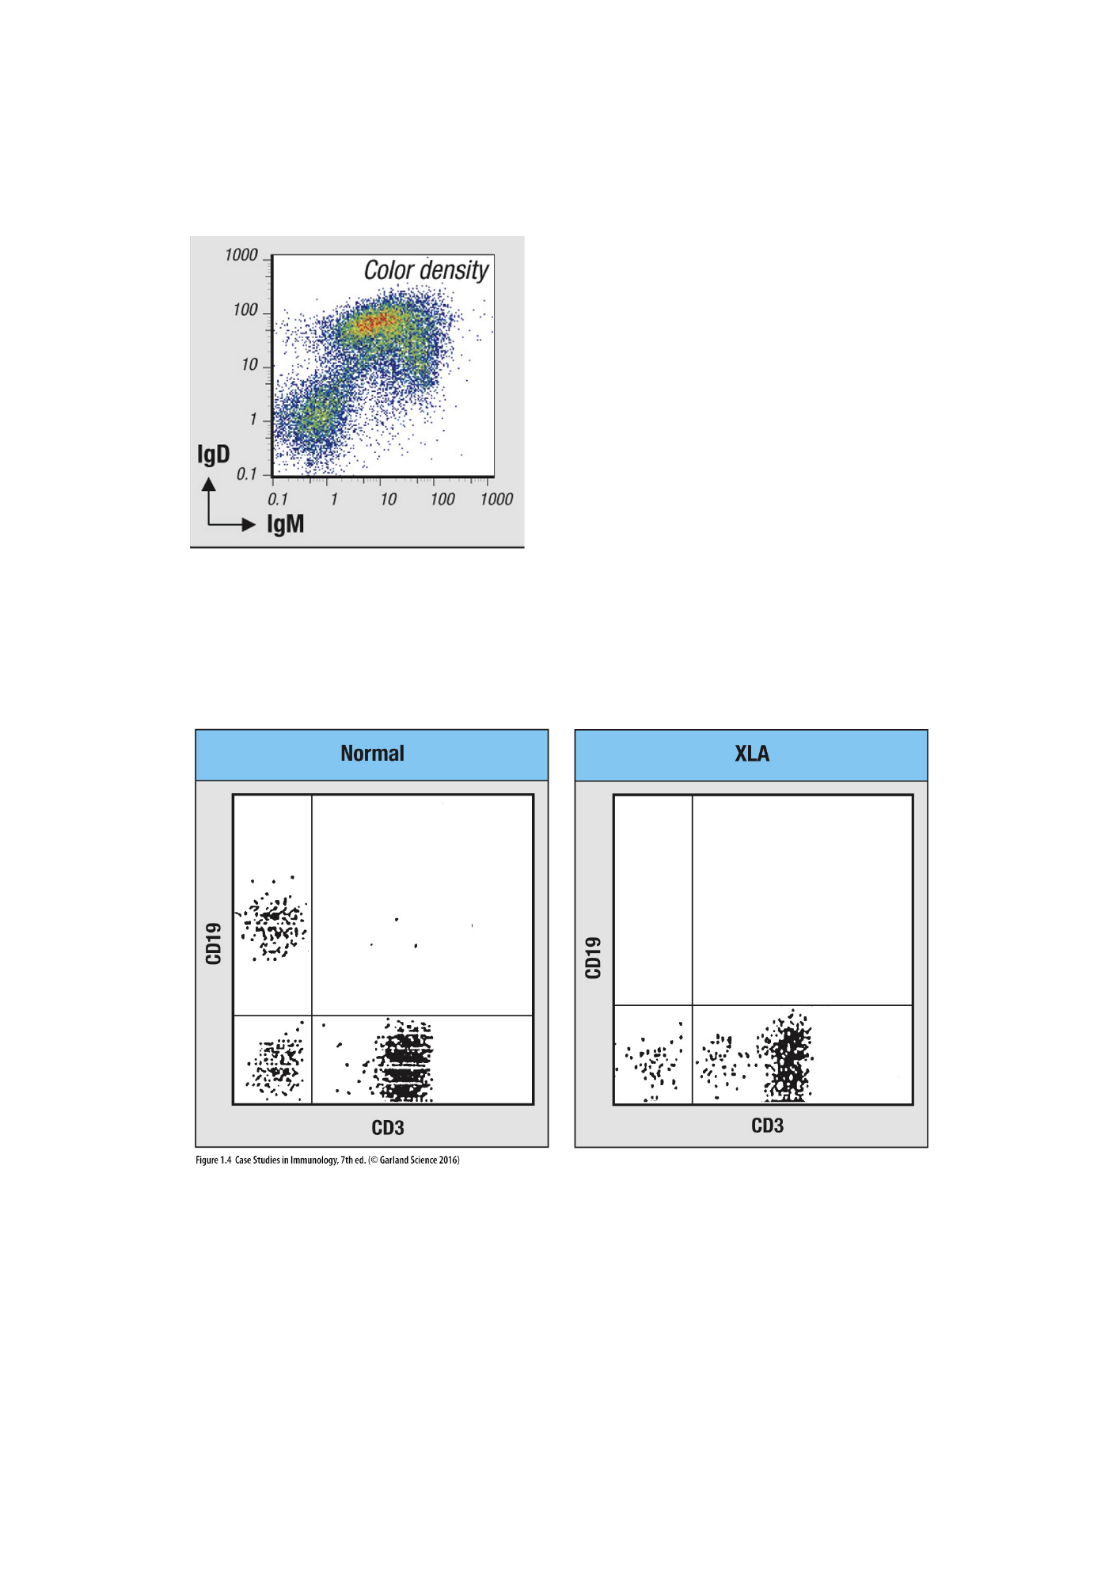
11) This graph shows the same cells but now they are plotted intensity of IgD (y-axis) vs
intensity of IgM (x-axis). Each dot is a single cell.
11a. Naïve B cells express both IgD and IgM. Circle
and label that pool of cells in this graph.
11b. Activated B cells will express only IgM on
their surface. Circle and label that pool of cells in
this graph.
11c. Plasma cells develop after T cell help. Plasma
cells secrete their antibodies and often have
undergone isotype switching. They would be
found in this graph as double negative cells. Circle
and label the plasma cells in this graph.
Figure 4: FACS analysis of normal and XLA peripheral blood leukocytes. The blood of two
patients has been analyzed in these graphs: normal on the left and an XLA patient (X-linked
agammaglogulinemia like Bill) on the right. Leukocytes were analyzed with anti-CD19 (B cell
antigen) and anti-CD3 (T cell antigen) antibodies. The graph data has been divided into three
pools of cells: CD19 , CD19 , CD19 and CD19 .
+CD3- +CD3+ -CD3+ -CD3-
3/1/25, 11:51 AM
AL CS 1 B cell development
about:blank
5/7

12) Label both graphs with the quadrant you would expect to find the following cells: B cells
(CD19+,CD3-), T cells (CD19-,CD3+) and NK cells (CD19-,CD3-).
13) Which pool of cells are found in XLA patients?not
14) What did Bill’s bloodwork show? What was present, what was missing?
15) How was Bills’ XLA treated? Explain his treatment, what did it provide.
16) What was the outcome of Bills treatment? Explain.
3/1/25, 11:51 AM
AL CS 1 B cell development
about:blank
6/7
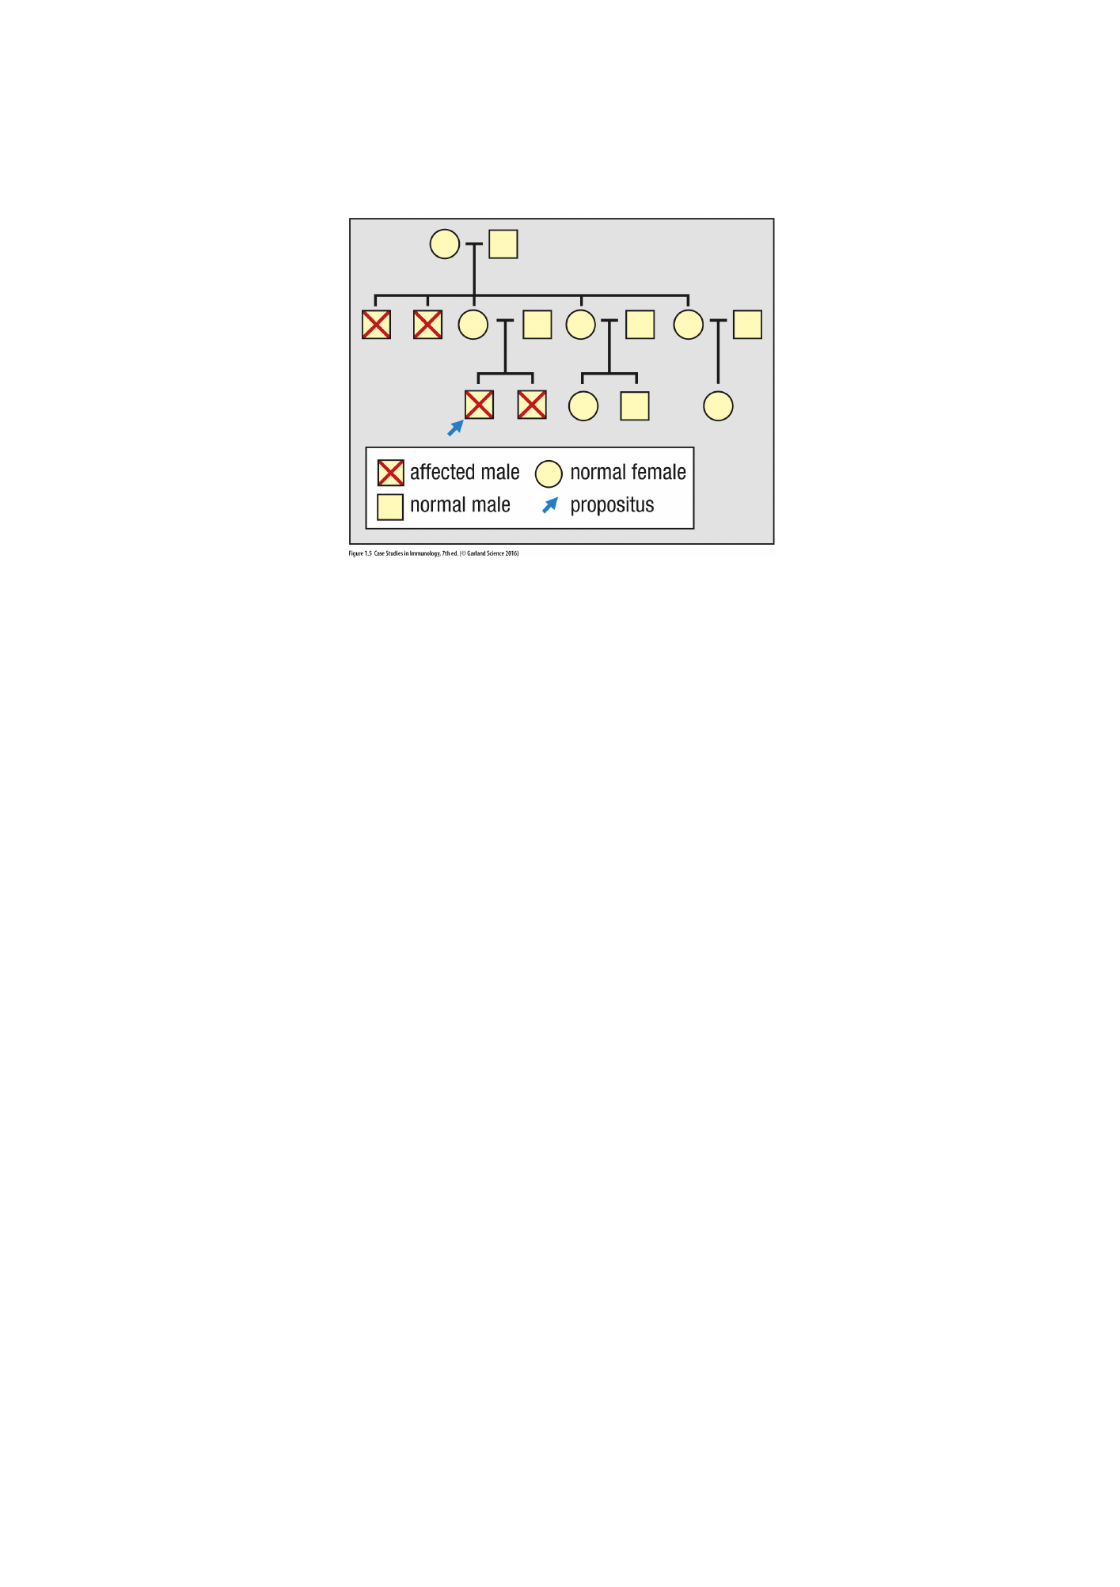
Figure 5: Family tree of Bill’s (propositus). Red “X” indicates XLA patients.
17) What do all of the affected patients in this family have in common?
18) Given this pattern, where in the human genome would you start to look to identify
mutant genes?
19) Female XLA patients are rare, but possible. Explain how they can happen? Why do you
think they would be so rare before the advent of gamma globulin injections?
3/1/25, 11:51 AM
AL CS 1 B cell development
about:blank
7/7

