%% Lab 1 - Zhonghao Li - MAT 275
%% Exercise 1
% Define input variable theta as discretized row vector (i.e., array).
theta = [0;pi/3;pi/2;2*pi/3;pi;4*pi/3];
% Define radius.
r = 3
% Define x and y in terms of theta and r.
x = r*cos(theta)
y = r*sin(theta)
sqrt(x.^2+y.^2)
% Check that x and y satisfy the equation of a circle.
%%
% Explain results here. Do x and y satisfy the equation of a circle? Why or
% why not? How does the vector output at the end confirm your answer?
% Notice I did not include text in the same line where the double-comment
% is. What this accomplishes is it does not add a title or create a new
% section in the table of contents when you publish. Using single %
% starting in the line after the %% turns the comments black as opposed to
% green.
%% Exercise 2
% Define t-vector.
t = linspace(1,10);
% Define y-vector.
(exp((t./20)).*cos(t))./(t.^2+4);
% Part (a)
t = linspace(1:0.2:10);
y = (exp((t./20)).*cos(t))./(t.^2+4);
% Plot results (should have 3 plots total).
figure;
plot((y,'k'));
title('y=[(e^(t/20))(cos(t))/(t^2+4)']
(figure 1)

%%
% Part (b)
t=linspace(1,10,46);
y=(exp((t./20)).*cos(t))./(t.^2+4)
plot(t,y,'o')
title('y=[(e^(t/20))(cos(t))/(t^2+4)'])
t=linspace(1,10,46);
y=(exp((t./20)).*cos(t))./(t.^2+4)
plot(t,y,'o-')
title('y=[(e^(t/20))(cos(t))/(t^2+4)'])
(figure 2)
(figure 3)
%% Exercise 3
% Create t-vector (choose enough elements so that plot is smooth!)
t=0:0.1:30;
x=sin(t);
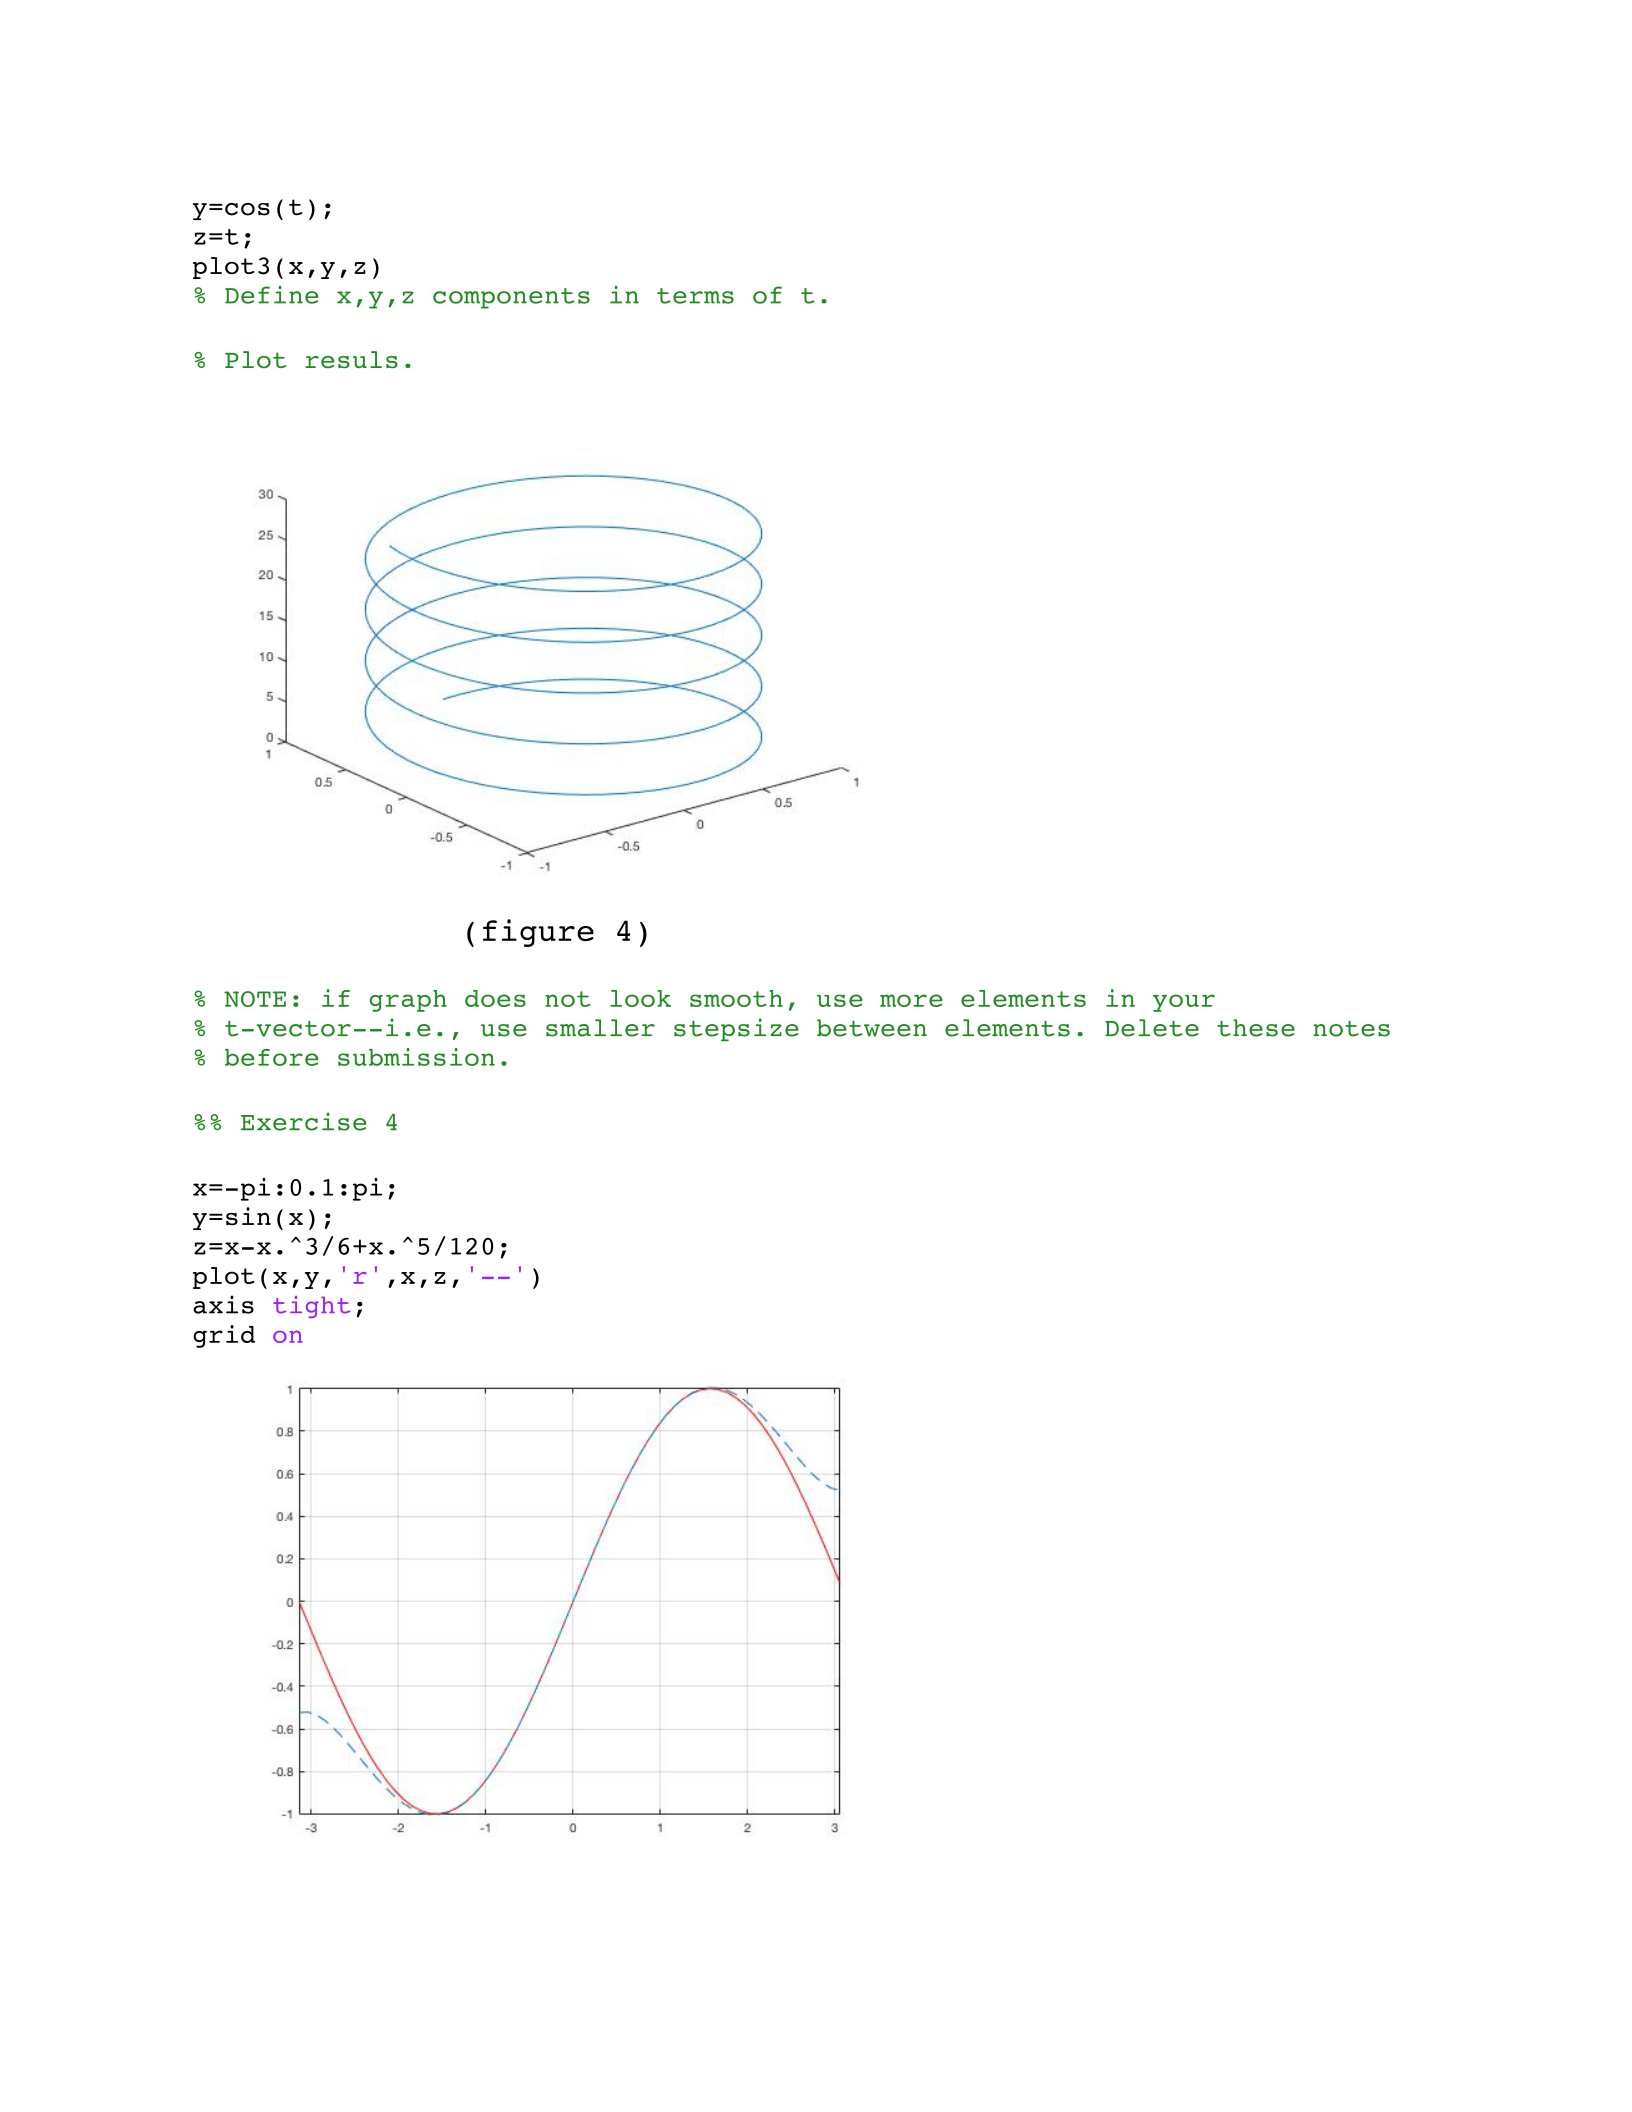
y=cos(t);
z=t;
plot3(x,y,z)
% Define x,y,z components in terms of t.
% Plot resuls.
(figure 4)
% NOTE: if graph does not look smooth, use more elements in your
% t-vector--i.e., use smaller stepsize between elements. Delete these notes
% before submission.
%% Exercise 4
x=-pi:0.1:pi;
y=sin(x);
z=x-x.^3/6+x.^5/120;
plot(x,y,'r',x,z,'--')
axis tight;
grid on

%% Exercise 5
% NOTE: you must create the M-file ex5.m separately and invoke it here in
% your main M-file (main file).
% Print out the code for your created M-file (do NOT submit M-file
% separately).
x=(0:0.1:5);
y1=f(x,-2);
y2=f(x,0);
y3=f(x,2);
plot(x,y1,'c',x,y2,'m',x,y3,'y');
title('Solutions to dy/dx=x.^2-2x');
legend('C=-2','C=0','C=2')
function y = f( x,C )
y=(x.^3)/3-x.^2+C;
end
% Run your M-file--i.e., execute the M-file.
%% Exercise 6
% For part (b), you need to create a separate M-file (f.m) and invoke it in
% the main file, here. Erase these notes upon submission.
%%
% Part (a)
% Define f as inline or anonymous function.
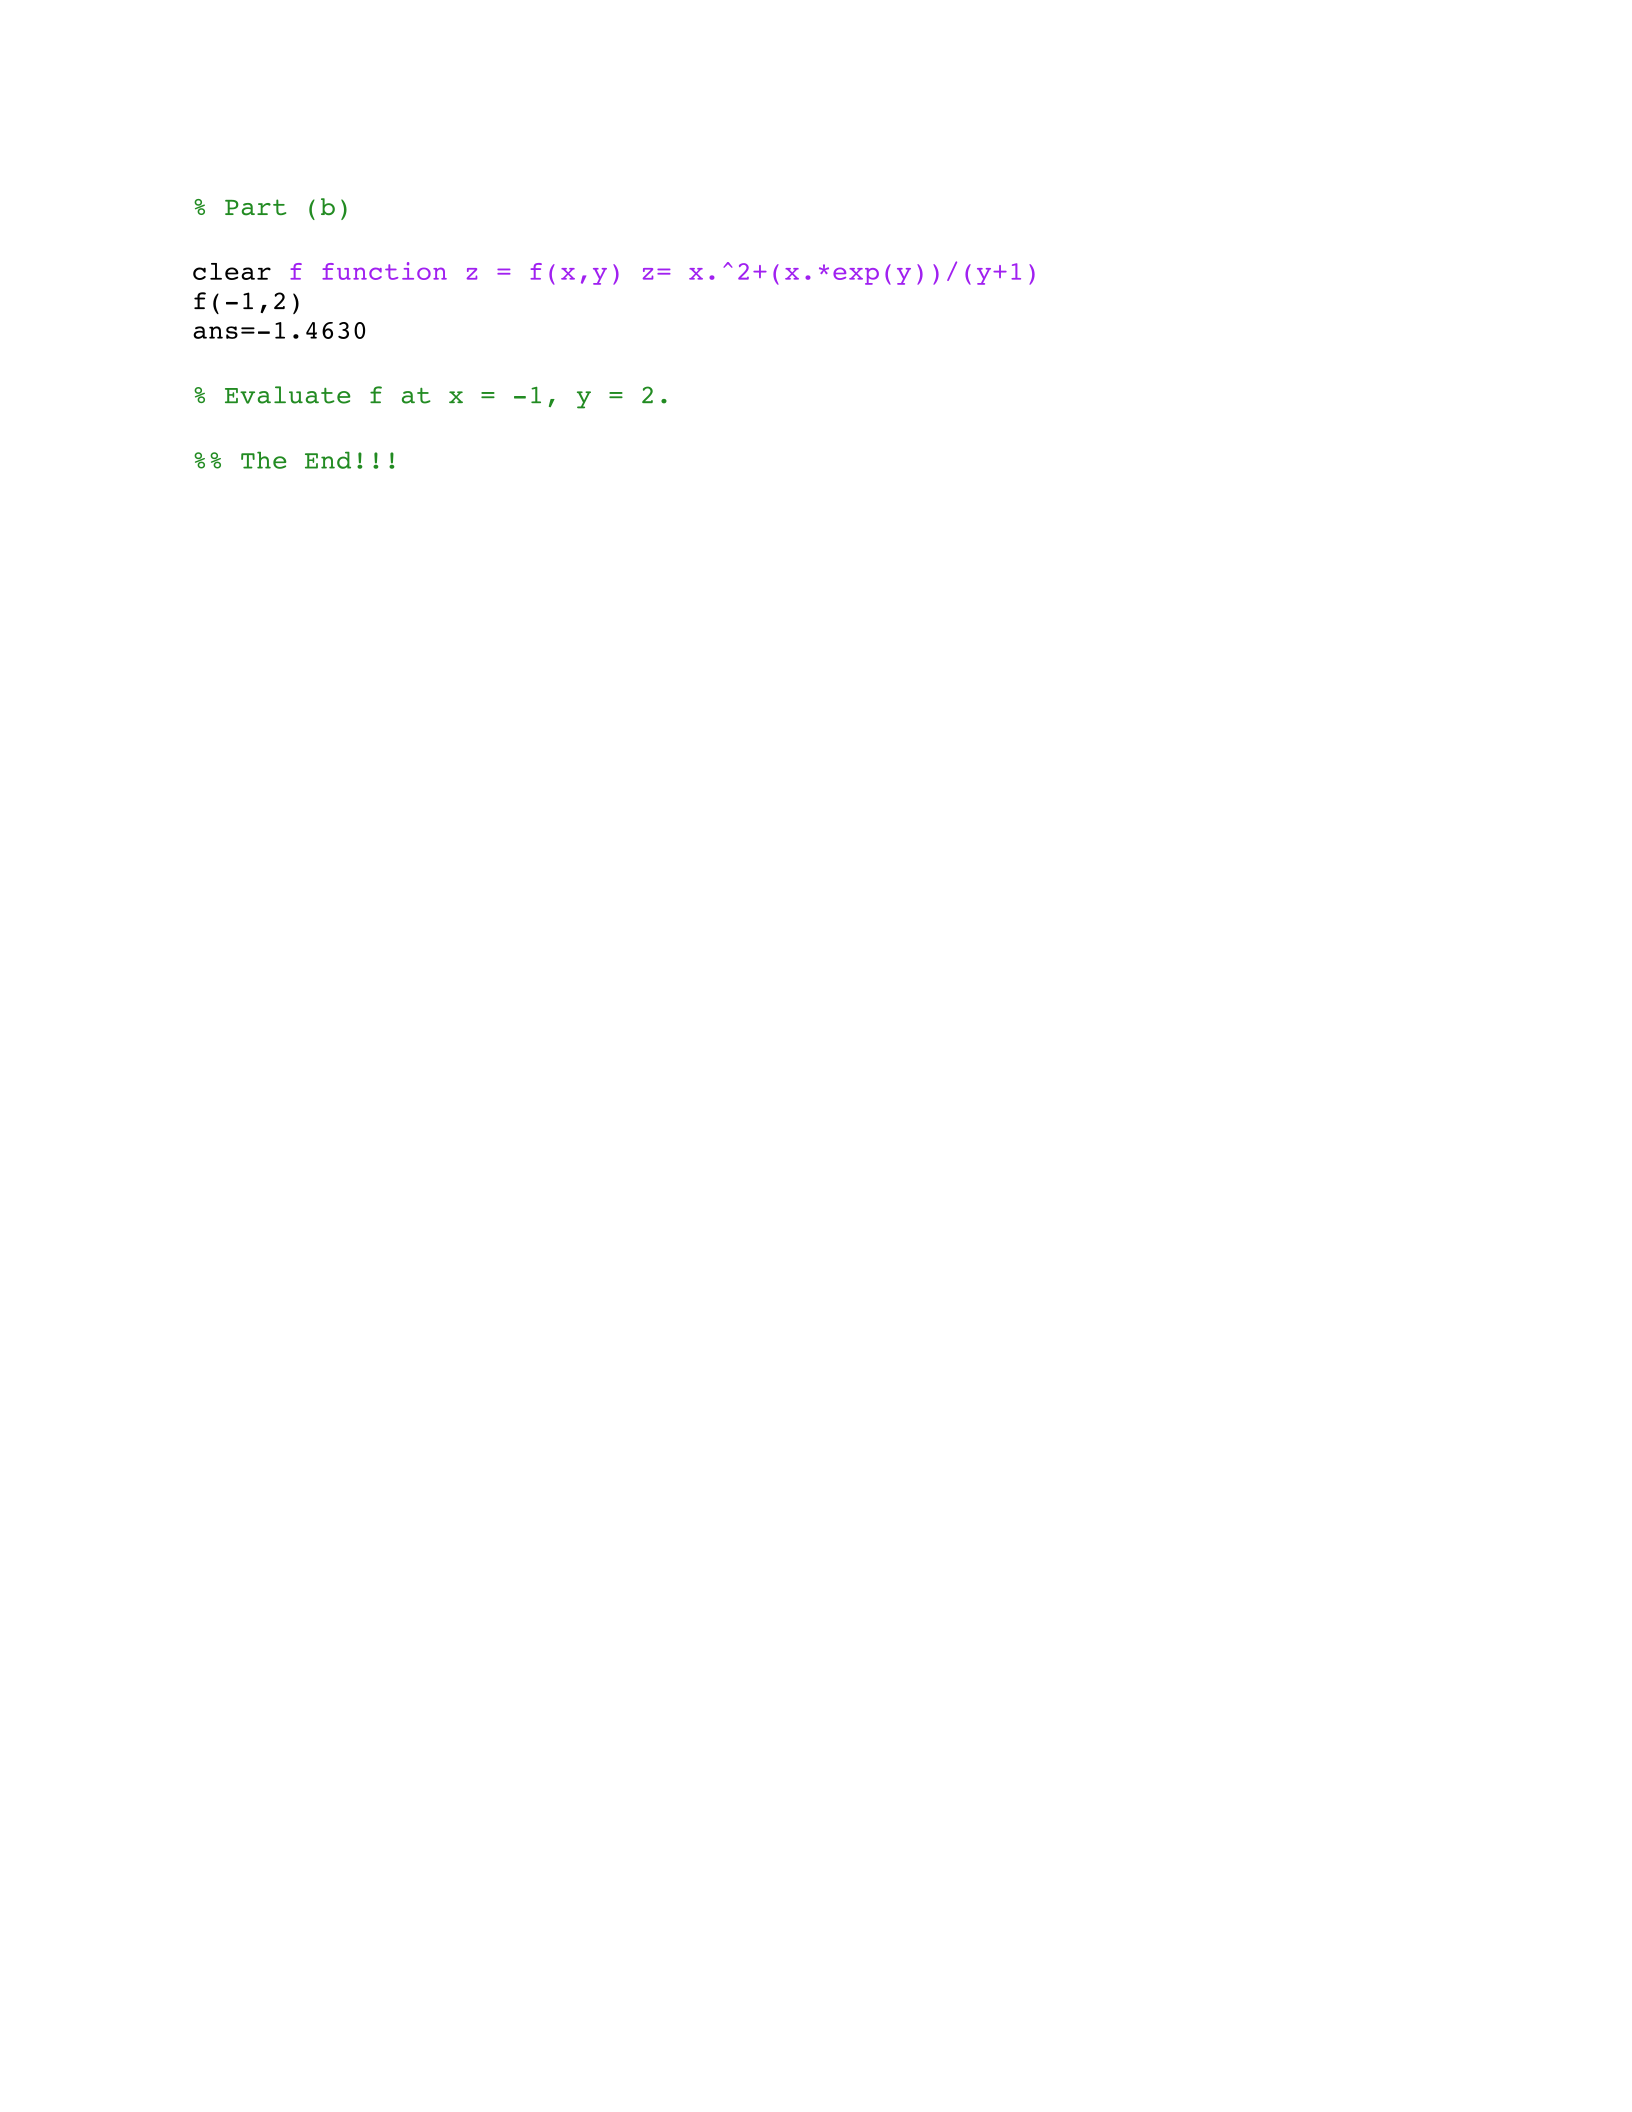
f=@(x,y)(x.^2+(x*exp(y))/(y+1))
f(-1,2)
ans = = -1.4630
% Evaluate f at x = -1 and y = 2
%%