


INTRODUCTION Within the last few decades
Within the last few decades, 3D digitization technologies have been successfully applied
within the discipline of physical anthropology, allowing researchers to non-destructively record,
visualize and replicate the delicate remains of our scarce ancestral heritage. At the most basic
level, 3D digitization allows three dimensional objects to be recorded by capturing a series of
points based on the volume or surface of an object. The first instance of 3-D digitization
technology being integrated into physical anthropology utilized volumetric computedtomography
scanning to investigate the internal structures of Egyptian mummies (HardwoodNash, 1979). The
investigators of the Tyrolean Ice Man expanded upon this use of CT scanning in mummy studies
by creating a physical replica of the cranium using stereolithography (Seidler et al., 1992). This
was the first instance of the integration of CT and rapid-prototyping technologies in an
anthropological investigation (zur Nedden et al., 1994).
In contrast to capturing volumetric data using computed tomography is surface scanning,
which is achieved through such technologies as laser and white light scanning and is regularly
used in the documentation and study of fossils as well (Aiello et al., 1998). Surface scanning is
useful to the researcher interested only in the outward morphological information of the
specimen, and it also allows the object to be viewed on the computer screen without any threat of
damage through physical handling (Tocheri, 2009). Digitizing bone can be a valuable alternative
to traditional, destructive mold-making procedures when creating copies of a specimen since the
3D model created from surface scans can be physically replicated using rapid-prototyping
technologies (D’Urso et al., 2000; Fantini et al., 2008; Pérès et al., 2004; Zhang et al., 2000).

In the subfield of physical anthropology known as forensic anthropology, the
anthropologist applies the knowledge of human osteology in a medico-legal setting. This often
results in collaborations with law enforcement and medical examiners in order to achieve a
positive identification of unknown persons. However, the implementation of 3D digitization
technologies within this subfield has been relatively slow in comparison to the rapidly expanding
applications in physical anthropology and archaeology. Much of the existing literature related to
forensic anthropology details the use of laser scanning for forensic facial reconstruction (Benazzi
et al., 2010), the virtual measurement of bone (Decker et al., 2011; Ramsthaler et al., 2010) and
trauma reconstruction (Thali, 2003). Although these applications make a useful argument, they
are not substantial enough to justify the incorporation of a 3D digitization unit in a forensic
anthropology lab. Because the technology can be expensive and requires training, a more robust
series of applications should be developed in order to persuade forensic anthropologists to more
readily implement these technologies in their investigative methodologies.
Research Questions and Objectives
The purpose of this thesis project is to investigate the use of a desk-top laser scanner in
documenting human skeletal remains that are associated with medico-legal investigations. It is
believed that the acquisition of 3D representations of human bone will provide a superior form of
documentation to traditional mediums such as photography. In addition to providing enhanced
documentation of materials, there are a multitude of further applications that can be achieved
with the use of the 3D file that results from the digitization process. The exploration of these

applications and the documentation of efficient scanning and data processing work flows will be
a focus of this research.
The research conducted in this project will be centered on the following question: What
are the applications of surface-digitization and visualization in forensic anthropology? In order to
address this question, this paper will compile the existing body of relevant literature, and use this
as a reference for adapting existing applications for use in forensic anthropology. The potential
applications surmised from the literature will then be demonstrated through the use of multiple
3D files created by using a laser-scanner and its proprietary software to scan and process surface
scan data of different bone types. The 3D models will then be processed using a variety of
affordable computer graphics programs in order to illustrate the applications for using the scan
data that can be useful to the forensic anthropologist.
The applications developed in this project will lay the groundwork for future exploration
of the possible applications for using scan data in forensic anthropology, and provide guidelines
on the many considerations involved in bone surface digitization projects. It is hoped that this
project will provide a practical framework for implementing this technology in a forensic
anthropology lab and encourage its use as a standard procedure in the data collection
methodologies of professional forensic anthropologists.
Thesis Outline
This thesis will be divided into six chapters. Chapter one will provide an introduction to
the research in this project. The second chapter will provide further background information
related to 3D digitization, and will present a brief literature review outlining other projects

relevant to this research. Chapter three will discuss the methods used in this project, highlighting
the technologies that will be implemented. The fourth chapter will discuss the results of the
scanning process, providing general recommendations for scanning bone and will also detail
specific problems and procedures related to particular bone types. Chapter five will focus on the
applications incorporating the 3D model that is produced from the scanning process. An outline
will be provided in the chapter, illustrating the steps necessary for processing the 3D model for
visual applications in forensic anthropology. The final chapter will serve as a discussion and
conclusion for the use of laser scanning in forensic anthropology based on the results of this
project.

CHAPTER TWO: BACKGROUND & LITERATURE REVIEW
This literature review will provide background information on previous research related
to the 3D digitization and visualization of bone. It will begin with background information on
3D-digitization, followed by a literature review organized by application. The most basic
application for using the scan data is its ability to be archived for future reference. From this file
simple measurements can be recorded. In addition, the object can be rendered in a virtual
environment allowing the user to rotate, zoom and manipulate lighting in order to highlight
specific areas of interest. Coupled with real-time visualization on the computer screen is the
ability to record screen shots for illustration purposes. Reconstruction of fragmented or missing
bone can be performed on the computer, avoiding the use of potentially destructive procedures
that use glue or modeling clay to rebuild incomplete bone. Several other applications, including
forensic facial reconstruction, trauma reconstruction and rapid-prototyping, are outlined within
this chapter for future development but will not be explored within this project
What is 3D-digitization?
3D-digitization is the acquisition of x, y, and z coordinates that represent an object in 3D
space (Bernardini & Rushmeier, 2002).There are two primary forms of 3D digitization: volume
digitization and surface digitization. Volume digitization is the acquisition of the entire structure
of an object, including outer surfaces and internal geometry. This is most commonly achieved
through the use of CT scanners. Surface digitization on the other hand, is the acquisition of only
the surfaces of the object being scanned (Bernardini & Rushmeier, 2002; Kappelman, 1998;
Tocheri, 2009; Zollikofer & Ponce de Leon, 2005). There are several technologies that can

achieve this, including laser scanning, photogrammetry and white-light scanning. This particular
project will implement the use of a laser scanner. Although this project will be focused on surface
digitization, a great deal of literature relevant to this project implements volume digitization. The
applications involved in volume digitization research of bone can often be easily adapted in the
processing of data that is the result of surface digitization. Because of this, some of the research
into the volume-digitization of bone will be included in this literature review. It would also be
useful for the forensic artist and anthropologist to be acquainted with volume digitization, should
they encounter a situation where case materials have been CTscanned.
Volume Digitization vs. Surface Digitization
There are several reasons why surface digitization using a laser scanner was chosen for
this research in lieu of volume digitization using a CT scanner. The primary reasons are in the
expense and expertise required in the operation of CT scanning equipment. CT scanning
equipment can cost millions of dollars and requires specialized training (Kuzminsky & Gardiner,
2012), whereas laser scanning equipment can cost only a few thousand dollars and requires only
minimal training (Komar et al., 2012). An additional reason for utilizing laser scanning in this
project has to do with the characteristics of the resulting data. Standard CT-scanning has a lower
resolution (Fantini et al., 2008) and decreased accuracy (Niven et al., 2009) when compared with
high-definition laser scanning equipment. This decreased level of accuracy in the 3D
representation of skeletal elements is not desirable in the documentation of case materials in
medico-legal investigations. The exception to this is Micro-CT scanning, which has vastly
superior resolution but is also significantly more expensive than standard CT-scanning equipment

(Slizewski et al., 2010). Volume data that results from CT-scanning also includes the complex
internal geometry of an object, and when working with complex anatomical structures it can
cause the file to become quite large. This can result in computer performance issues depending
on the processing power and amount of random-access-memory (RAM) afforded by the
computer’s hardware capabilities. The majority of 3D software programs are also not created to
handle highly dense 3D data, and thus importing CT-data into them can result in computer
performance issues. In general, surface scan data requires less advanced computer hardware and
can be less taxing on a system’s performance when imported into 3D software programs. A final
consideration is the fact that a laser scanner does not emit the harmful radiation of a CT scanner
(Park et al., 2006; Sholts et al., 2010).
Review of Applications
Once a 3D model has been obtained using the scanner and its processing software, there
are a number of ways in which it can be further processed for visualization by utilizing an
assortment of computer graphics programs. This review will document the relevant literature
based on visual applications that result from the post-processing of 3D scan data. Based on the
review of literature, the applications for laser scan data has been divided into the following
categories: documentation, measurement, visualization and illustration, virtual reconstruction,
trauma reconstruction, forensic facial reconstruction and rapid prototyping.
Documentation
The most basic application that can be completed with a 3D file once it has been
processed is to save it to the computer’s hard-drive (Komar et al., 2012; Kuzminsky & Gardiner,

2012). This is the basis of the 3D documentation of the scanned object, allowing it to be archived
and viewed at a later point in time (Park et al., 2006). All further applications using the 3D data
are contingent upon this feature. The representation of human remains in a 3D file format is
superior to traditional forms of 2D documentation such as digital photography, which are unable
to completely represent the complex morphology of skeletal elements such as the cranium
(Komar et al., 2012; Kuzminsky & Gardiner, 2012). Additionally, the 3D file allows the user to
rotate the object and view it from any angle (Niven et al., 2009; Tocheri, 2009) and save
screenshots using visualization software (Kuzminsky & Gardiner, 2012), without the potential
threat of damage to the original skeletal elements (D’Urso et al., 2000; Pérès et al., 2004;
Tocheri, 2009; Zhang et al., 2000). The ability to archive surface data insures that the original
state of the remains has been documented and can be reexamined at a later point in time, should
the original material be altered in any way (Tocheri, 2009). The digitization process can also be
used to circumvent distortions that result from photography which result in misrepresentations of
the original subject (Thali et al., 2003). The 3D data can also be digitally transferred to other
experts, allowing them to consult on cases without having to travel or transport the remains
(Davy-Jow et al., 2012). In addition, digital reference collections can be created and made
accessible on the internet, or stored and transported to the field on portable computers and digital
storage devices (Niven et al., 2009). Such collections can be useful for facilities and institutions
that face budgetary constraints or have limited storage space (Niven et al., 2009).

Measurement
One of the most useful advantages of having a 3D model of human bone is the ability to
take virtual measurements. Traditional point-to-point measurements can be taken, in addition to
volumetric measurements such as surface area and volume which are difficult to quantify on the
actual specimen (Tocheri, 2009). There have been several studies assessing the reliability of
taking measurements from a 3D model, but a comprehensive assessment using the standard
measurements used by forensic anthropologists has yet to be made. Park et al., (2006) compared
the intra- and inter-observer reliability between taking physical caliper measurements and virtual
measurements of the cranium. A total of thirty unidentified skulls were scanned using a handheld
laser scanner, which served as the sample for two examiners to obtain thirty-three measurements.
The conventional measurements were obtained by having one examiner conduct two sets of
measurements with traditional calipers within a one week interval, which also tested the intra-
observer reliability. The inter-observer reliability was tested by having each examiner collect the
virtual measurement sets twice, within a one week interval. The intra- and interobserver
reliabilities were tested using the intra-class correlation coefficient (ICC). The results showed
high ICC values, and the researchers concluded that the laser scanning and virtual measurement
technique would be able to replace the conventional measurement technique. However, the
measurements used in the study were arbitrary landmarks usually used for skull-tophoto
superimposition and facial reconstructions, in addition to seven random parameters used
frequently in craniometry. The lack of complete standard measurements used in this study
presents a serious flaw, despite the strength of the statistical methods employed. Tocheri (2009)
also contends that if traditional measurements can still be obtained from the cranium, then

digitization and virtual measurement are not justified. Nonetheless, the ability to take virtual
measurements using a 3D model of a cranium when the original is no longer available is highly
advantageous.
In contrast to performing the traditional point-to-point measurements on a 3D model is
the ability to take non-standard measurements such as surface-area and surface-curvatures, which
are difficult or impossible to quantify on the actual specimen (Tocheri, 2009; Sholts et al., 2010).
Sholts et al., (2010) suggest that volumetric measurements such as volume and surface area
which are afforded by the use of a 3D model can provide more precise determination of sex. This
can further aid in developing more accurate biological profiles, which can assist in making a
positive identification of unknown human remains. Sholts et al., (2010) performed a similar
study to Park et al., (2006) but assessed the accuracy and repeatability of measuring cranial
volume and surface area using 3D models that result from laser scan data. Testing the inter- and
intra-observer error of non-traditional measurements derived from laser scan data is necessary in
order to establish the reliability of this technique for use in forensic anthropology. In their study,
this was accomplished by having two operators perform three separate scans of five human
crania, using the NextEngine Desktop 3D scanner. The two operators utilized different protocols
for scanning and processing (see Sholts et al., 2010), and the resulting 3D models were compared
by measuring total volume and surface area using the RapidWorks 2.3.2 software by
NextEngine™ Inc. After the results were compared, the authors found that the differences
between the operator’s distinct protocols for scanning and processing did not result in a
significant statistical deviation in surface area or volume for the sample of skulls that were
scanned. The size of the mesh triangles however did affect the precision of the measurements.

The measurements were less accurate the greater the size of the mesh triangles, corresponding to
lower resolution 3D models.
In conclusion, the researchers found that the precision of the measurements recorded from
3D models which were created by two different protocols demonstrate the reliability of using
laser scanned models in acquiring metrical data such as volume and surface area. Considering
that at present there are no standard techniques for the measurement of cranial volume and
surface area, the authors recommend that scanning and processing protocols be documented
whenever such measurements are employed. Despite the positive conclusions of
Park et al., (2006) and Sholts et al., (2010), both studies are of questionable value in the field of
forensic anthropology because neither study was carried out using the standard set of cranial
measurements used by forensic anthropologists (Buikstra & Ubelaker, 1994). Because of this,
future research testing the reliability of taking measurements from laser scan data should
incorporate the standard measurements used in forensic anthropology.
Visualization and Illustration
After being processed and saved to hard-disk or other digital storage formats, the
proceeding application is the capability for visualizing the surfaces on the computer screen. This
includes the ability to rotate, zoom and pan around the digitized surface (Niven et al., 2009). A
practical way to view 3D models is through the use of 3D PDFs, which allow the user to rotate
the model, to zoom in and out for closer inspection, manipulate lighting, in addition to numerous
other functions. The use of 3D PDFs to visualize anatomical structures has been employed in the
visualization of molecular structures (Kumar et al., 2010) and for viewing faunal remains (Niven

et al., 2009), but could be easily adapted for the visualization of bone in forensic anthropology.
In addition to interactive PDFs, non-interactive video clips can also be generated for use in
court, academic presentations and education (Niven et al., 2009). A 3D model can be integrated
into
Microsoft® PowerPoint® presentations using 3D PDFs, and presented in a variety of situations.
In court, a model can be presented as evidence or as a visual aide when discussing identity and
trauma in lieu of potentially disturbing members of the court by presenting the actual remains
(Komar et al., 2012). The models can also be used in education (Davy-Jow et al., 2012), whether
in the classroom, anthropology teaching lab, or conference.
Virtual Reconstruction
Virtual reconstruction is the virtual reassembly of fragmented bone, which can then be
made physical again through rapid-prototyping (Zollikofer and Ponce de Leon, 2005). Although
this technique is typically used with CT scanning in paleoanthropological applications (Kalvin et
al., 1995; Zollikofer et al., 1995), it can also be implemented using laser scanned images in order
to reconstruct fragmented elements of the human skeleton (Benazzi et al., 2009; Fantini et al.,
2008; Kuzminsky & Gardiner 2012). As an alternative to the traditional practice of reassembling
bone fragments using adhesive materials such as glue, virtual reconstruction is advantageous
because it allows the evidence to remain in its original condition (Fantini et al., 2008). This
circumvents several complications that could incur with the traditional method of reassembly, for
instance, if a ‘missing piece’ was found at a later point in time or the remains needed to be
reexamined in a disarticulated state.

Trauma Reconstruction
Trauma induced by sharp or blunt weapons on the surface of bone can be documented
using 3D surface scanning and reconstructed in a virtual environment, as investigated by Thali et
al., (2003). This is done by digitizing both the weapon and location of injury, and then orienting
the 3D models within a computer graphics program to test the fit between injury and instrument
that may have caused it. From this, a basic animation can be created using software such as
Blender (open-source), Autodesk® Maya® or 3ds Max®. This animation can be used as a visual
aide in court. After being digitized, physical replicas of the wound area and injury-causing
instrument can also be created, and used similarly in court (Thali et al., 2003).
Forensic Facial Reconstruction
In tandem with virtual reconstruction is forensic facial reconstruction, a process which
results in a facial likeness of the unidentified individual. A photograph of the likeness is then
distributed through public media in hopes that someone will recognize the individual. This can
lead to a positive identification through fingerprints, dental records or DNA analysis. Intact skulls
can be prototyped for the forensic artist to perform a facial reconstruction, but fragmented skulls
should be reconstructed in a virtual environment before they are reproduced.
Unfortunately, many forensic anthropology labs and medical examiners offices cannot afford to
make 3D-prints of every unidentified victim, and facial reconstructions are sometimes performed
directly on the skull or on casts made through traditional mold-making and casting processes.
These techniques can alter the evidence, and can be potentially destructive.

An alternative method to the traditional techniques of forensic facial reconstruction in
clay is the possibility of performing the reconstruction on the computer utilizing 3D graphics
software. This includes two primary techniques: the use of automated facial approximation
software, or the utilization of 3D modeling and digital sculpting programs to perform manual
facial reconstructions. In reference to computerized facial reconstruction, Wilkinson (2005)
differentiates between two traditions, that of facial approximation and facial reconstruction.
Facial approximations deal with generalized facial ‘types’ developed from the basic
characteristics of the skull. These approximations can be performed automatically by specialized
computer techniques such as the first one developed by Vanezis et al., (1989) as part of the
Wolfson transputer-based workstation project at the University College of London. These
computer techniques often work by deforming a scan of a human face over the digitized skull,
and further refinements are made using parametric transformations and warping (Quatrehomme
et al., 1997; Jones, 2001). Interpolation of volumetric data is another technique utilized in
automated computerized facial approximations (Evison, 1996; Michael & Chen, 1996). The
primary limitation of these systems that Wilkinson (2005) describes is that the resulting
approximation will always have some resemblance to the original facial template. Additionally,
the database of facial templates used is not comprehensive, the method relies too heavily on
tissue depth data, and accuracy studies have yet to be performed (Wilkinson, 2005).
In contrast to facial approximation, more detailed facial reconstructions can be performed
using 3D modeling and animation programs, as well as digital sculpting software. Wilkinson
(2005) employs a virtual sculpting program called Freeform® from Sensable Technologies® that
uses haptic feedback which allows the user to ‘feel’ the surface of the skull, further enhancing the

analysis and reconstruction of the soft tissue. Unlike the automated systems, this method requires
3D modeling skills, anthropological and anatomical knowledge. A 3D model of the skull is also
required, and can be easily obtained through the use of a laser-scanner.
3D-printing & Rapid Prototyping
In conjunction with surface digitization, 3D printing is a powerful tool that allows for a
model of evidence to be created. In addition to its application in forensic cases, 3D printing can
also be used to develop teaching collections in an anthropology teaching lab, and for hands-on
museum exhibits for educating the public. Having a prototype model of the original specimen
also helps to prevent over handling of the original, and a mold can be made from the replica, with
further copies produced at a lower cost than 3D printing multiples (Fantini et al., 2008).
Summary
In summary, the literature was found to provide a considerable reference for exploring the
applications of laser scan data for use in forensic anthropology. Although there are numerous
applications to be examined, only a few have been chosen to be explored in this thesis due to
budgetary constraints, time and the limited expertise of the author. Moreover, the visual
applications of laser scan data in other fields such as cell biology (see Kumar et al., 2010) and
zoology (see Niven et al., 2009) can be adapted for use with human bone in forensic
anthropology. This includes the creation of 3D PDFs, which will be achieved in this thesis by
using Adobe® Photoshop® CS5 and Adobe® Acrobat® X Pro. Embedding a 3D model within a
PDF also enables the user to acquire digital measurements; the reliability of this technique will
be tested in Chapter Five. The 3D model that results from laser scan data can also be used to

create 2D illustrations, which will be created in this project through the use of Pixologic™’s
ZBrush® 4r4. At the suggestion of Steyer et al., (2010), this project will attempt to integrate the
use of laser scan data and ZBrush® 4r4, in order to reassemble and virtually reconstruct damaged
and missing bone fragments. In addition to the applications, one particular issue highlighted by
Sholts et al., (2010) is the lack of scanning and processing protocols which are necessary for
establishing laser scanning as a reliable and repeatable methodology for documenting case
materials in forensic anthropology. This challenge will be addressed through an exploratory effort
of documenting techniques for scanning different bone types. The procedures documented in this
project could potentially serve as a foundation for developing standard protocols for digitizing
human remains using a laser scanner. The documentation of scanning and processing protocols,
in addition to the exploration of the visual applications, will form the basis of the research in this
project.
CHAPTER THREE: METHODS
Introduction
The methods aspect of this research project encompass the laser scanning equipment and
scan data processing software, in addition to the 3D graphics programs which the resulting scan
data can be imported into. These methods can be divided into two primary workflows. The first
workflow is linear and involves scanning the object of interest, and then proceeding to process
the scan data to create a complete 3D model. The discussion of this workflow will include
strategies for positioning the bone using the part-gripper of the scanner, setting up scan settings

for particular bones, suggestions for automatic and manual alignment of scans and further
processing of the scans to create a complete model of the original object. The second workflow
is divided into several sets, each describing a specific application for the scan data that can be
achieved using different computer graphics programs.
Adobe® Photoshop® CS5, is a 2D graphics editing program popularly used for photo
editing and digital painting, although it has several features relevant to 3D. In this project it is
used in the production of 3D PDFs, allowing the 3D model in OBJ format to be converted to a
U3D file. Adobe® Acrobat® X Pro, which is utilized in the creation of professional quality PDF
files, allows the U3D file to be embedded into a PDF as an interactive 3D model. ZBrush® 4r4
by Pixologic™ is a powerful digital sculpting program used in the film and video game industry
for the creation of high-resolution 3D assets. Here it is employed in the creation of rendered still
images of the scan data, and in the virtual assembly and reconstruction of fragmented bone.
Sample
A primary consideration in digitizing skeletal anatomy is the type of bone being scanned.
The morphology of human bone varies significantly throughout the body, and the complex forms
of certain bones such as those of the cranium can pose a challenge when attempting to acquire a
complete representation of them within a 3D model. In order to address this issue, an assortment
of bones was scanned to provide a research sample. This allowed specific complications
regarding the digitization of skeletal anatomy to be discussed. The specific bones scanned
represent the breadth of morphological diversity in the human skeleton and include the vertebrae,
scapula, clavicle, os coxae, sternum, rib, femur, cranium and mandible. The samples used in this

project were commercially prepared teaching examples of actual human bone which were
provided by the Anthropology Teaching Laboratory at the University of Central Florida.
3D Scanner Hardware and Software
The laser scanner chosen for this research project is the NextEngine™ Desktop 3D
Scanner (Figure 1). It was chosen due to its relative affordability (Kuzminsky & Gardiner, 2012),
resolution and mobility (Slizewski & Semal, 2009). It is a laser triangulation type of 3D scanner,
which uses a built in digital camera to identify the distance and angle of the laser stripes
projected from the laser emitter. The scanner also includes an automated turntable known as the
AutoDrive, which can be manually and automatically rotated within the ScanStudio HD Pro™
software. Using the automatic rotation feature, the scans are automatically aligned within the
software. When a rotation scan does not result in complete coverage of the object, the manual
rotation settings allow precise positioning of the object in order to obtain missing data.
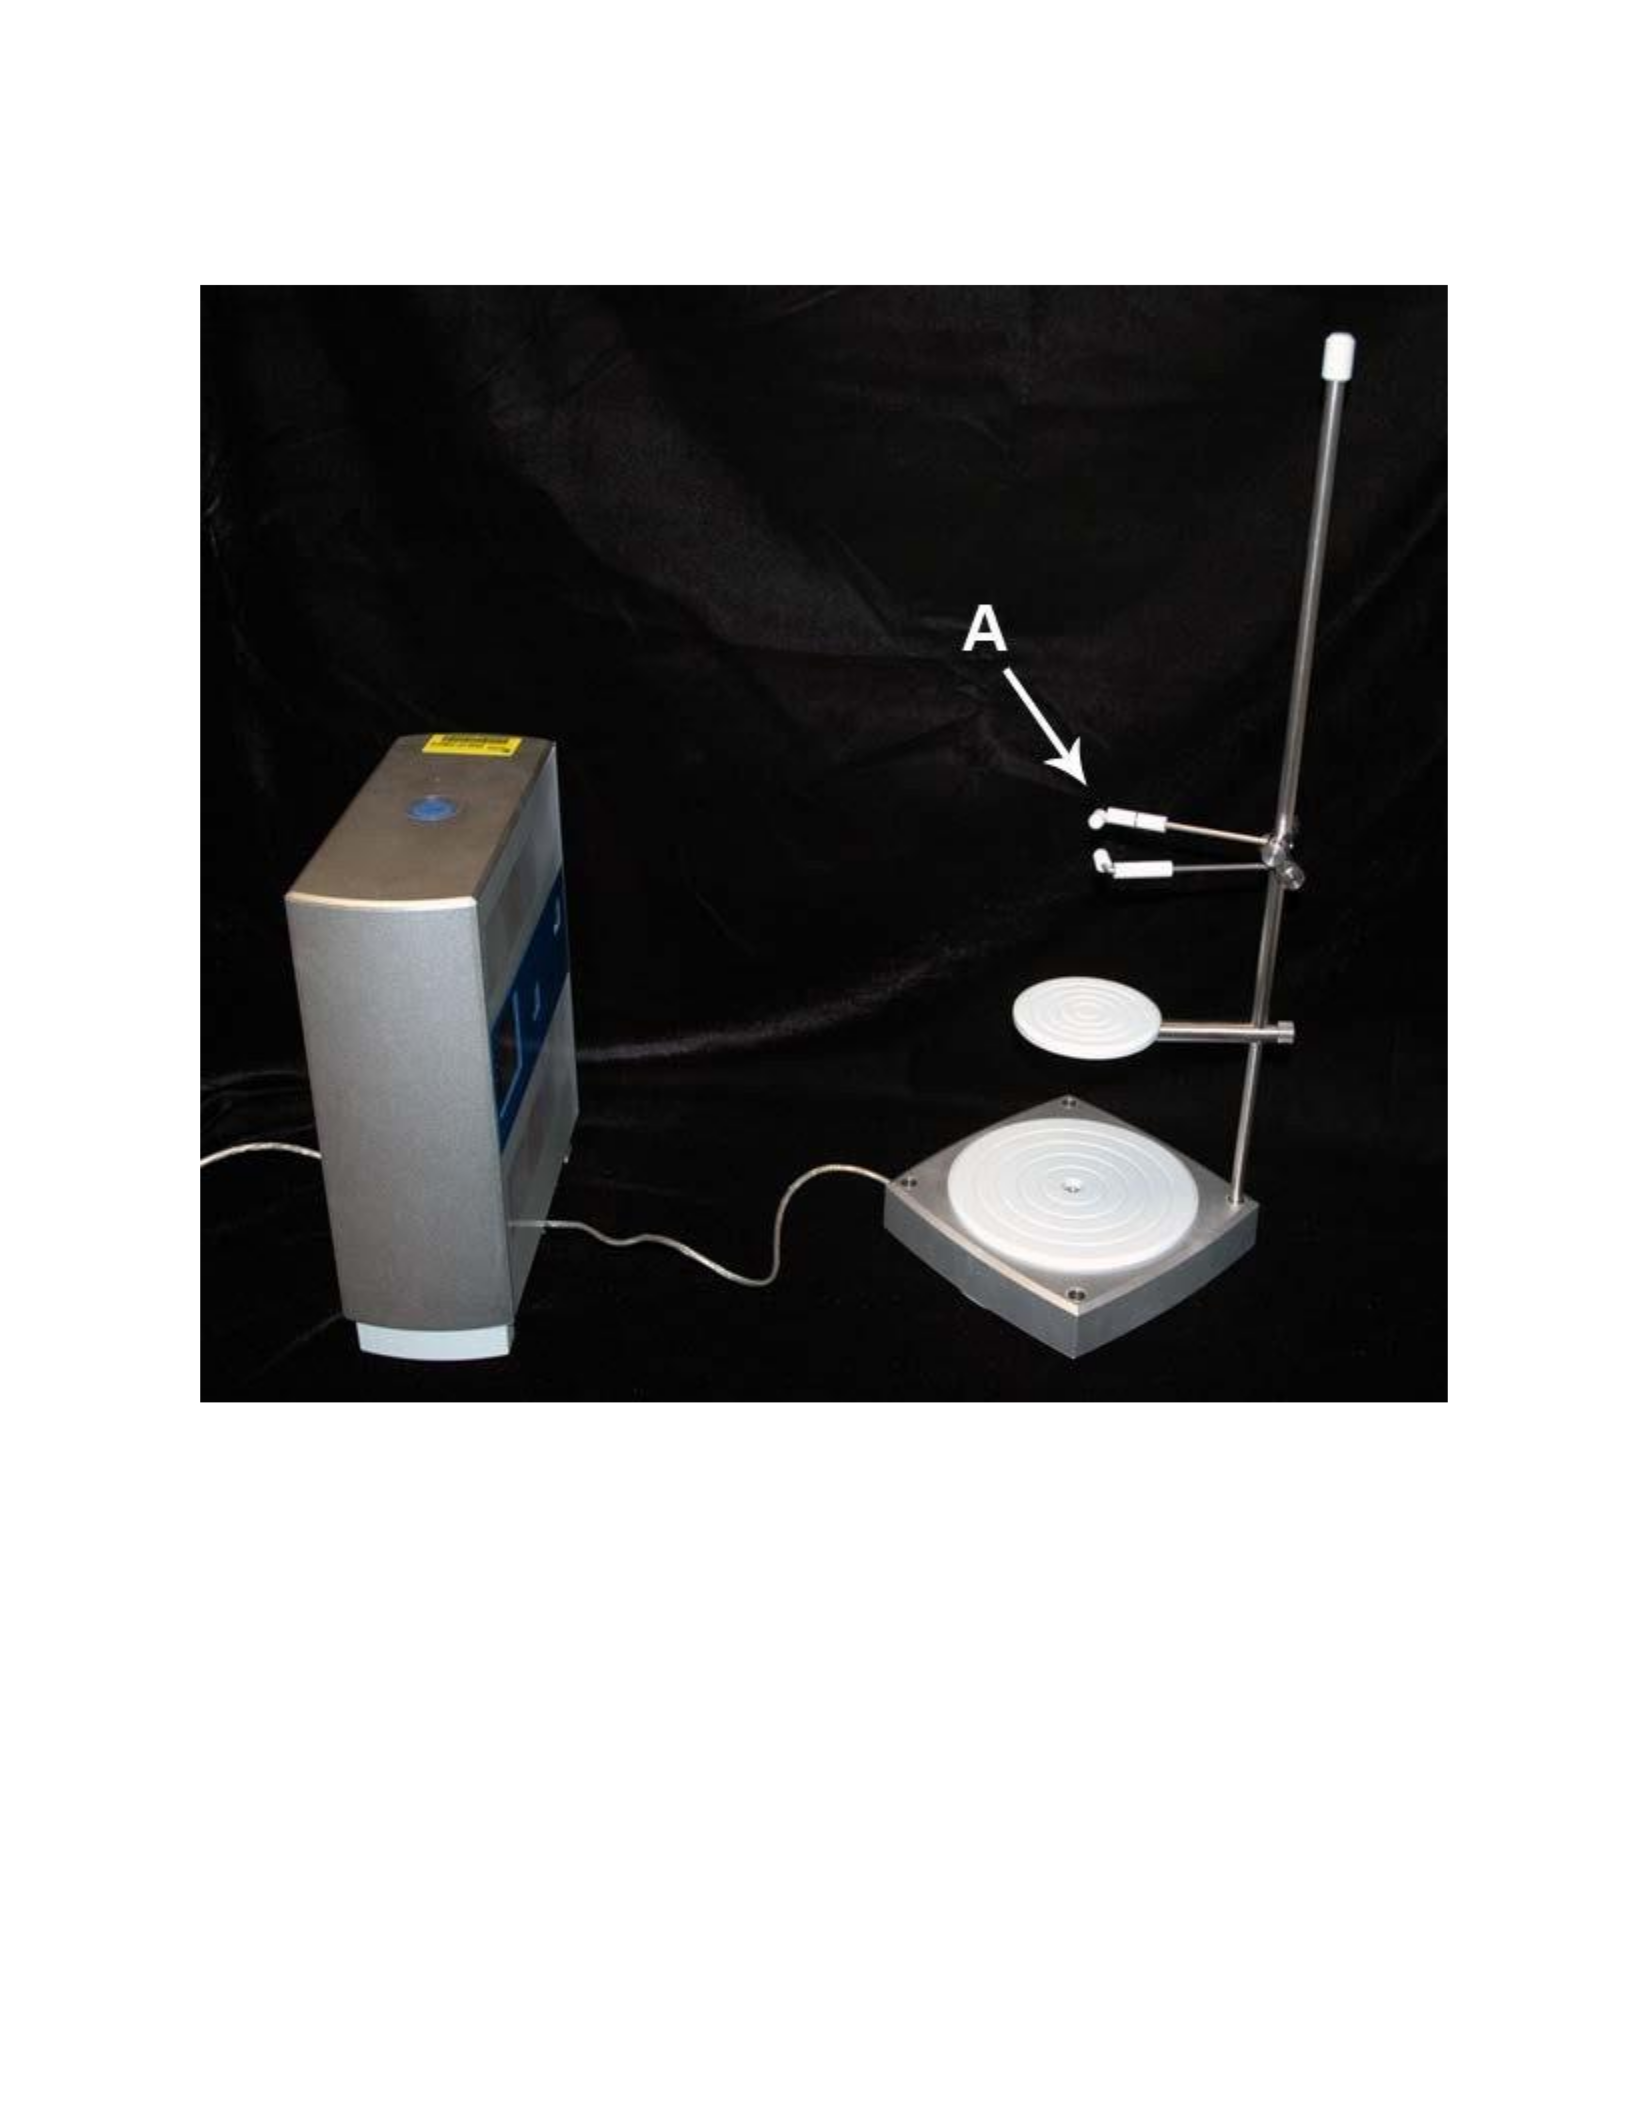
Figure 1: The NextEngine desktop laser scanner (left) with AutoDrive and part-gripper (right). The part gripper has
been modified with an additional supporting prong (A).
The NextEngine™ Desktop 3D Scanner comes with a proprietary software package
known as ScanStudio HD™ which is used with the scanner hardware to process the scan data.
An upgraded version of the software, ScanStudio HD Pro™ was purchased for this project and
has the benefits of doubled scan speed, four times the raw point output (resulting in more detailed
capture), and has an additional large area format scan mode that increases the range of the
scanner (http://www.nextengine.com/products). ScanStudio HD™ is necessary for operating the
NextEngine Desktop 3D Scanner, but once the initial scans have been acquired, the data can be
processed in other scan data processing software such as MeshLab or Geomagic Studio™.
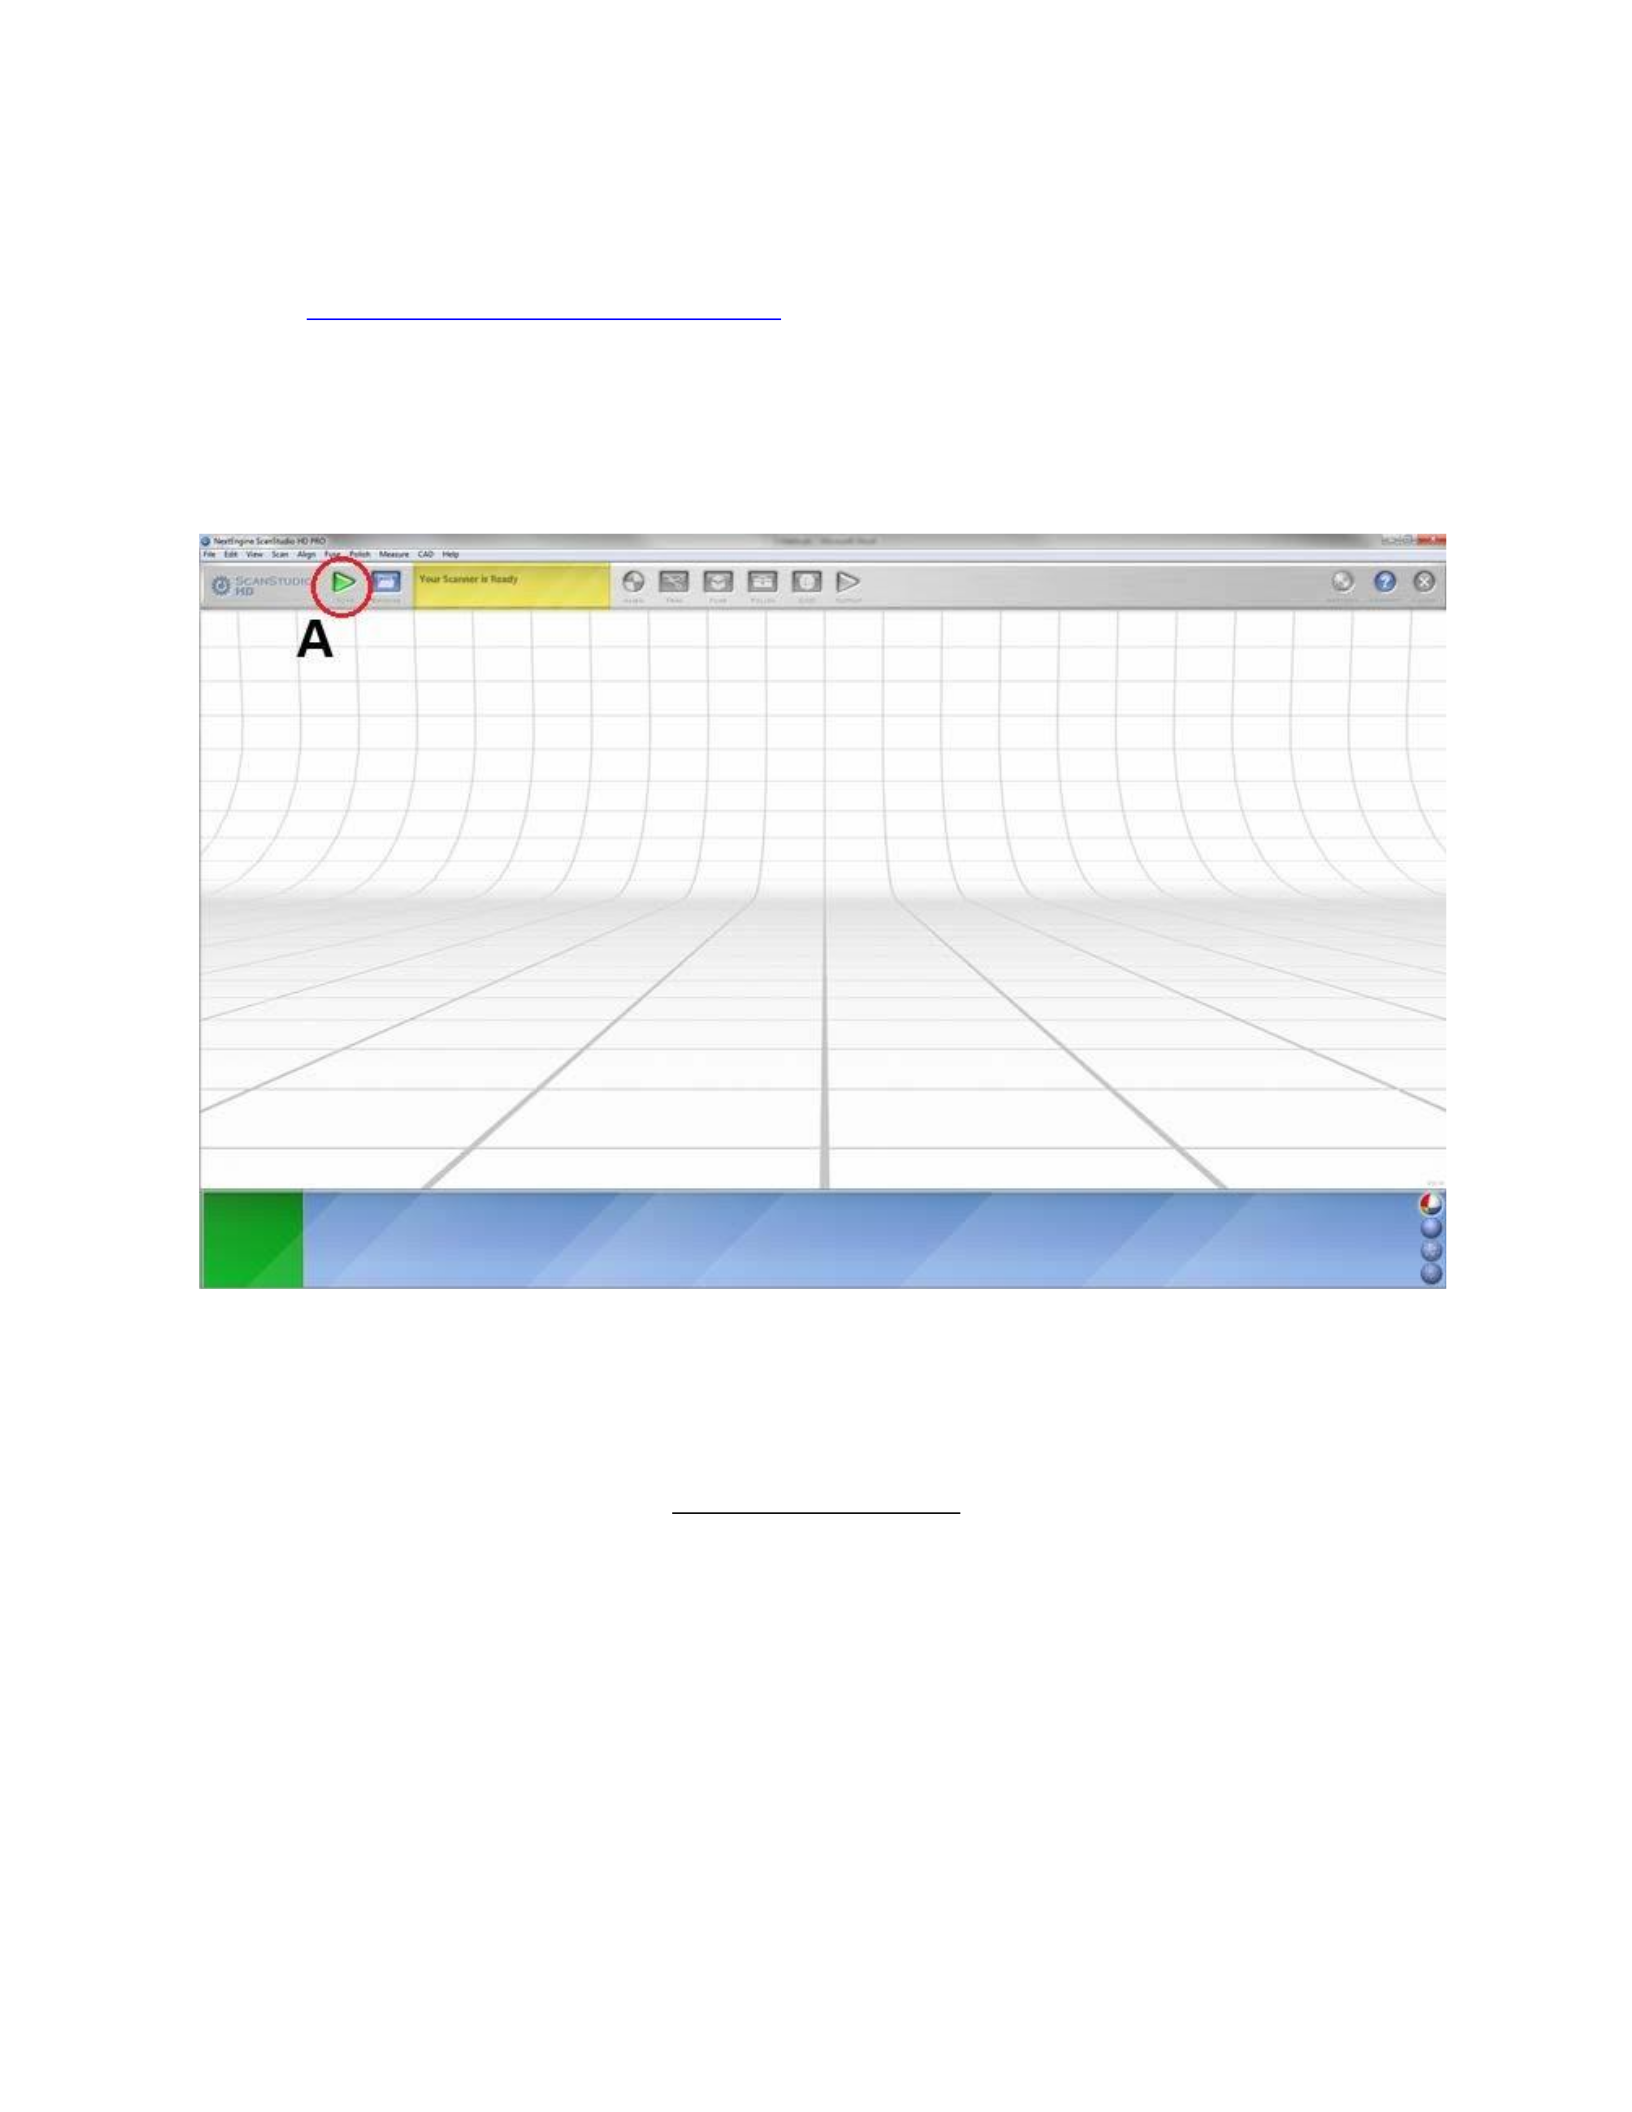
Figure 2: The ScanStudio HD Pro™ interface displayed after opening the program. The Scan button (A) used to
initiate the scanning process is circled in red.
Laser Scanner Process
Scanning the bones is the first step in exploring the applications of a laser scanner in
forensic anthropology. Unfortunately, it is not a simple task and there are many issues that need
to be considered in order to optimize the breadth and quality of the 3D data that is being
acquired. The general process for scanning and processing the scan data of human bone will be
outlined here in the methods chapter. The specific problems regarding the digitization of different

bone types will be elaborated in the results chapter. After the hardware and software has been
properly installed, the scanner hardware is activated by opening the ScanStudio HD Pro™
software. The scanning process is initiated by clicking the Scan button (Figure 2 A) in the top
menu, which opens a dialogue page where the scan settings can be specified. Displayed on this
page in addition to the scan settings is the viewport (Figure 3), where the object intended for
scanning is seen by the camera of the scanner. This window is used as a reference for manually
positioning the object for optimal scanning, in conjunction with changing the distance of the part
gripper from the scanner. A region of interest can also be selected by clicking and dragging
within this viewport, which will cause the scanner to scan and display the area that is selected.
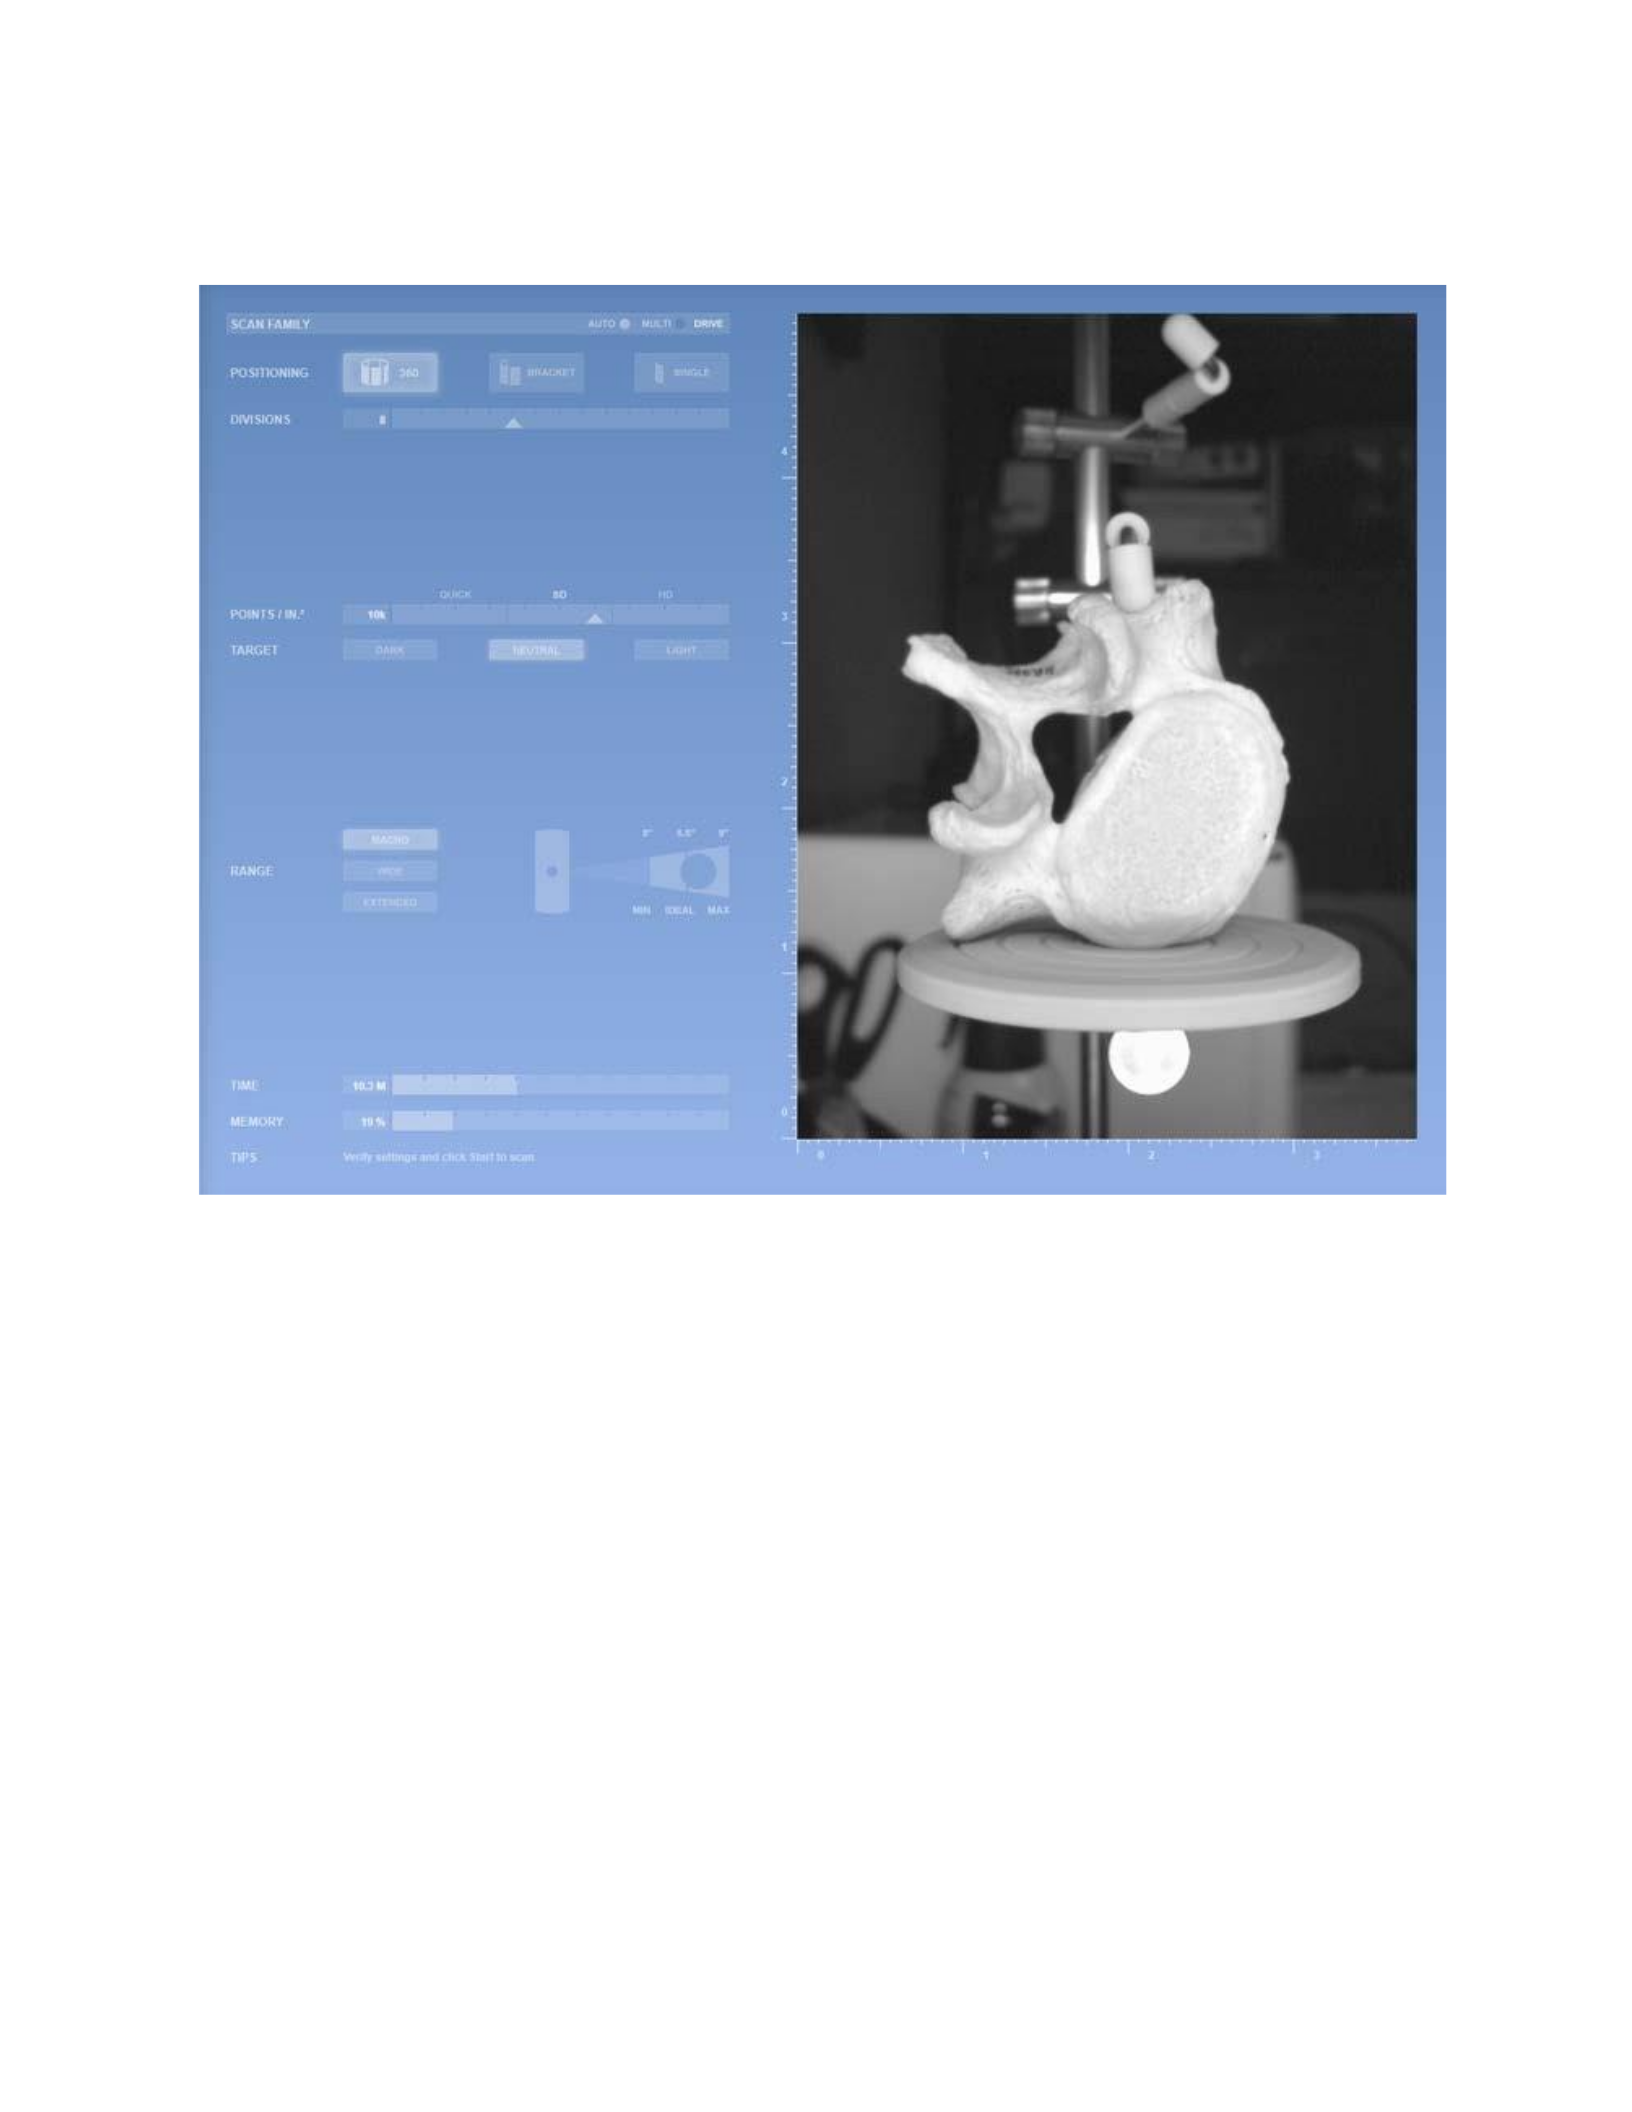
Figure 3: The scan settings dialogue page within ScanStudio HD Pro™. The settings are on the left, and the
scanner’s camera viewport is on the right.
Positioning
The first parameter of the scan settings that can be set is the positioning mode (Figure 4),
which can either be a 360 degree full rotation of the turntable, a three scan bracket mode, and a
single scan mode which does not result in movement of the turntable during scanning. The 360
scan mode utilizes the AutoDrive settings and should be used whenever possible in order to
streamline the scanning process by using the automatic alignment feature of the AutoDrive. This
setting results in an automatically aligned scan set based on the divisions input by the user. It

does not result in a complete model, since the part-gripper base and support prongs prevent the
laser stripes from reaching certain areas. Nevertheless it results in greater coverage and efficiency
than the other scan settings. A bracket scan is a series of three scans that can be used to capture a
wider range of missing data than the single scan setting. This is useful in providing a greater
range of anatomical features and can be used to align the bracket scan with other scan sets. The
bracket setting is also more efficient than the single scan setting because the three scans will be
automatically aligned by the ScanStudio HD Pro™ software. Single scans can be necessary when
trying to capture hard to reach areas or if the missing data does not require more than one scan.
Single scans require manual alignment, whether they are being aligned to 360 scan sets, bracket
sets or other single scans. Single scans can present problems if there are not enough anatomical
features to be used for manual alignment.
Figure 4: The positioning and divisions section of the scan settings dialogue page within ScanStudio HD Pro™.
Divisions
In order to change the degree increments at which the turntable rotates during the 360 and
bracket position settings, it is necessary to change the ‘Divisions’ section of the scan dialogue
page. The amount of divisions equals the amount of times the turntable rotates within 360

degrees. To calculate the incremental degrees of rotation, divide 360 by the amount of divisions.
The maximum number of divisions is 16, which allows the minimum degree of incremental
rotation: 22.5 degrees. A division of 8, at 45 degree incremental rotations was found to provide
sufficient coverage and overlap between scans which proved useful in aligning the scans of bone.
It was also performed in a reasonable amount of time, and without an excess of overlapping and
redundant data.
Resolution (Points / In.²)
The resolution of the scans is determined by manipulating the Points / In² slider (Figure
5). The slider is divided into three sections: Quick, SD and HD. Each of these sections has three
tick marks which increase the amount of surface points acquired by the scanner, from left to
right. Moving from left to right under each of the sections will result in the Time slider at the
bottom of the screen to increase, and moving from each tick mark results in an increasing
percentage of memory (RAM) to be used. In order to scan the sample of this research within a
reasonable amount of time, the highest points per square inch of the SD setting (10,000) was
chosen as a compromise between scan acquisition time and resolution. Because of the many
issues encountered during the scanning of different bone types, the SD settings were utilized for
efficient time-management in troubleshooting and establishing protocols for scanning. With the
HD settings, the scanning process would have taken three times longer, therefore increasing the
amount of time it would have taken to resolve the issues that were encountered. Once these
scanning protocols have been established and implemented, the HD settings should be utilized in
order to obtain the most accurate representations of the objects being scanned. An 8 division 360
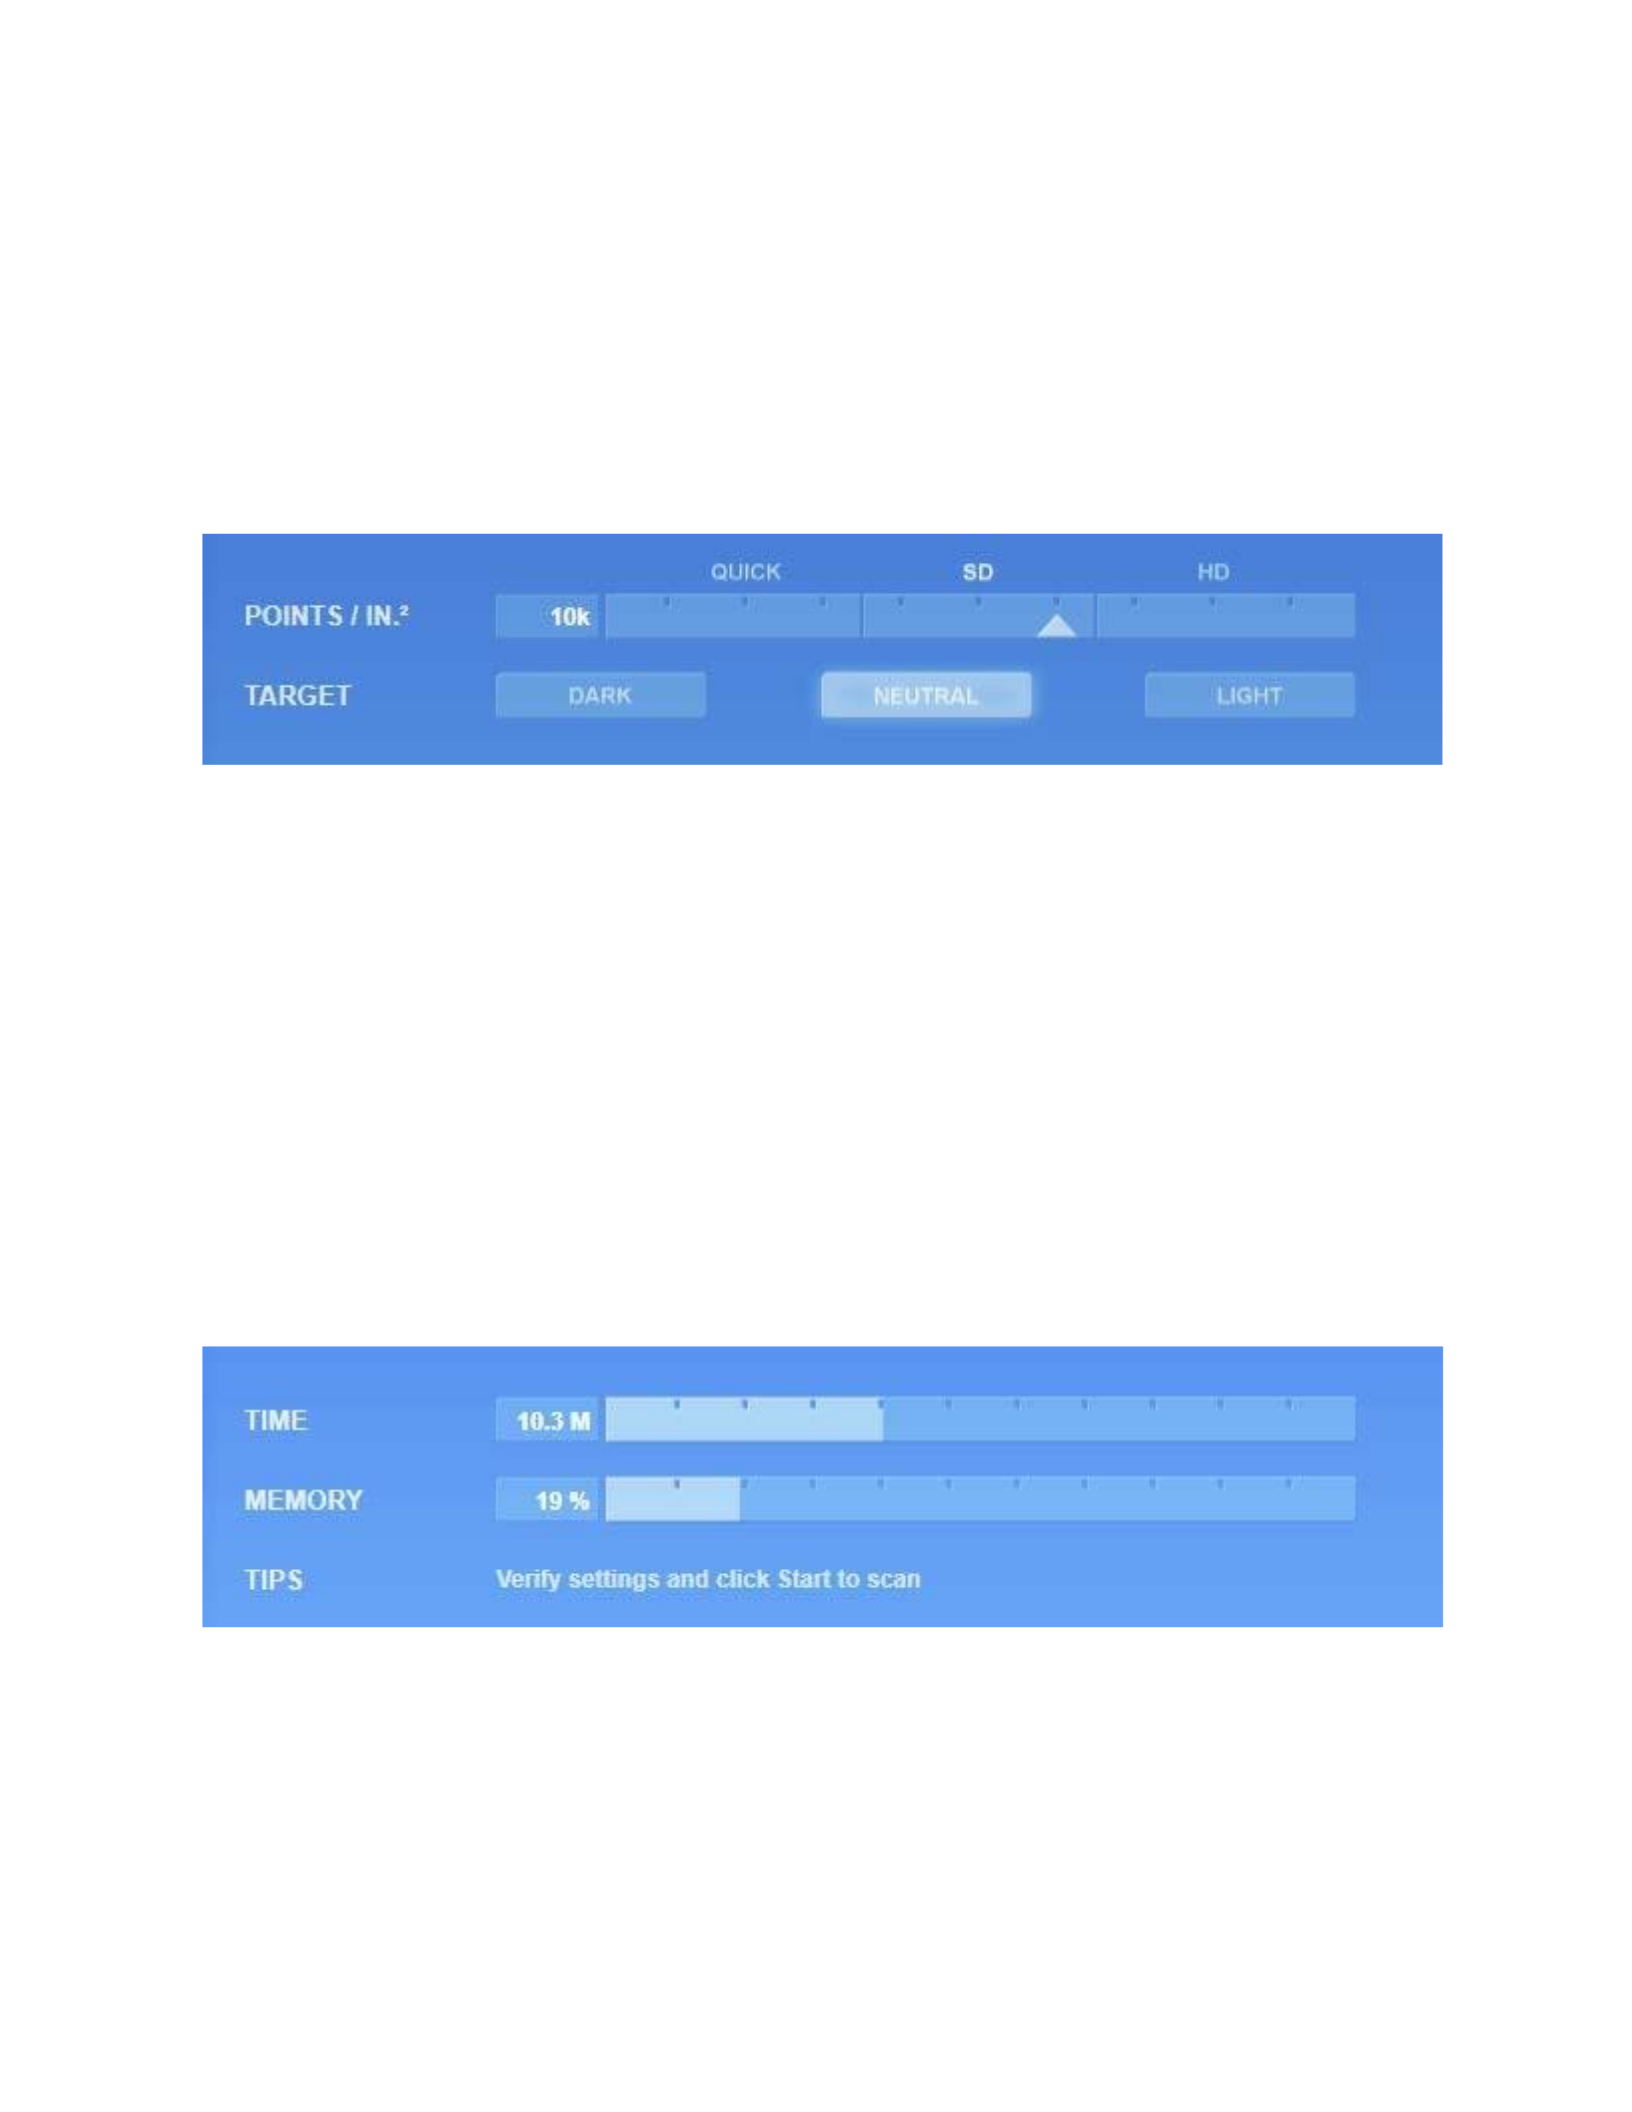
scan took 10.3 minutes with this setting, as opposed to the 27 minutes it would take to scan using
the HD settings. The amount of time required for a particular type of scan is displayed on the
Time slider at the bottom of the scan settings page.
Figure 5: The Points / In.² and Target section of the scan settings dialogue page within ScanStudio HD Pro™.
Target
This section relates to the lightness of the object being scanned. The default neutral
setting was maintained throughout the scanning process of this thesis (Figure 6). The
NextEngine™ user manual does not discuss this feature in depth, but it is assumed that it
modifies the laser intensity for scanning light and dark objects.
Figure 6: The Time and Memory section of the scan settings dialogue page within ScanStudio HD Pro™. It is found
at the bottom of the screen, and has a direct relationship to the Points / In.² slider.
Range
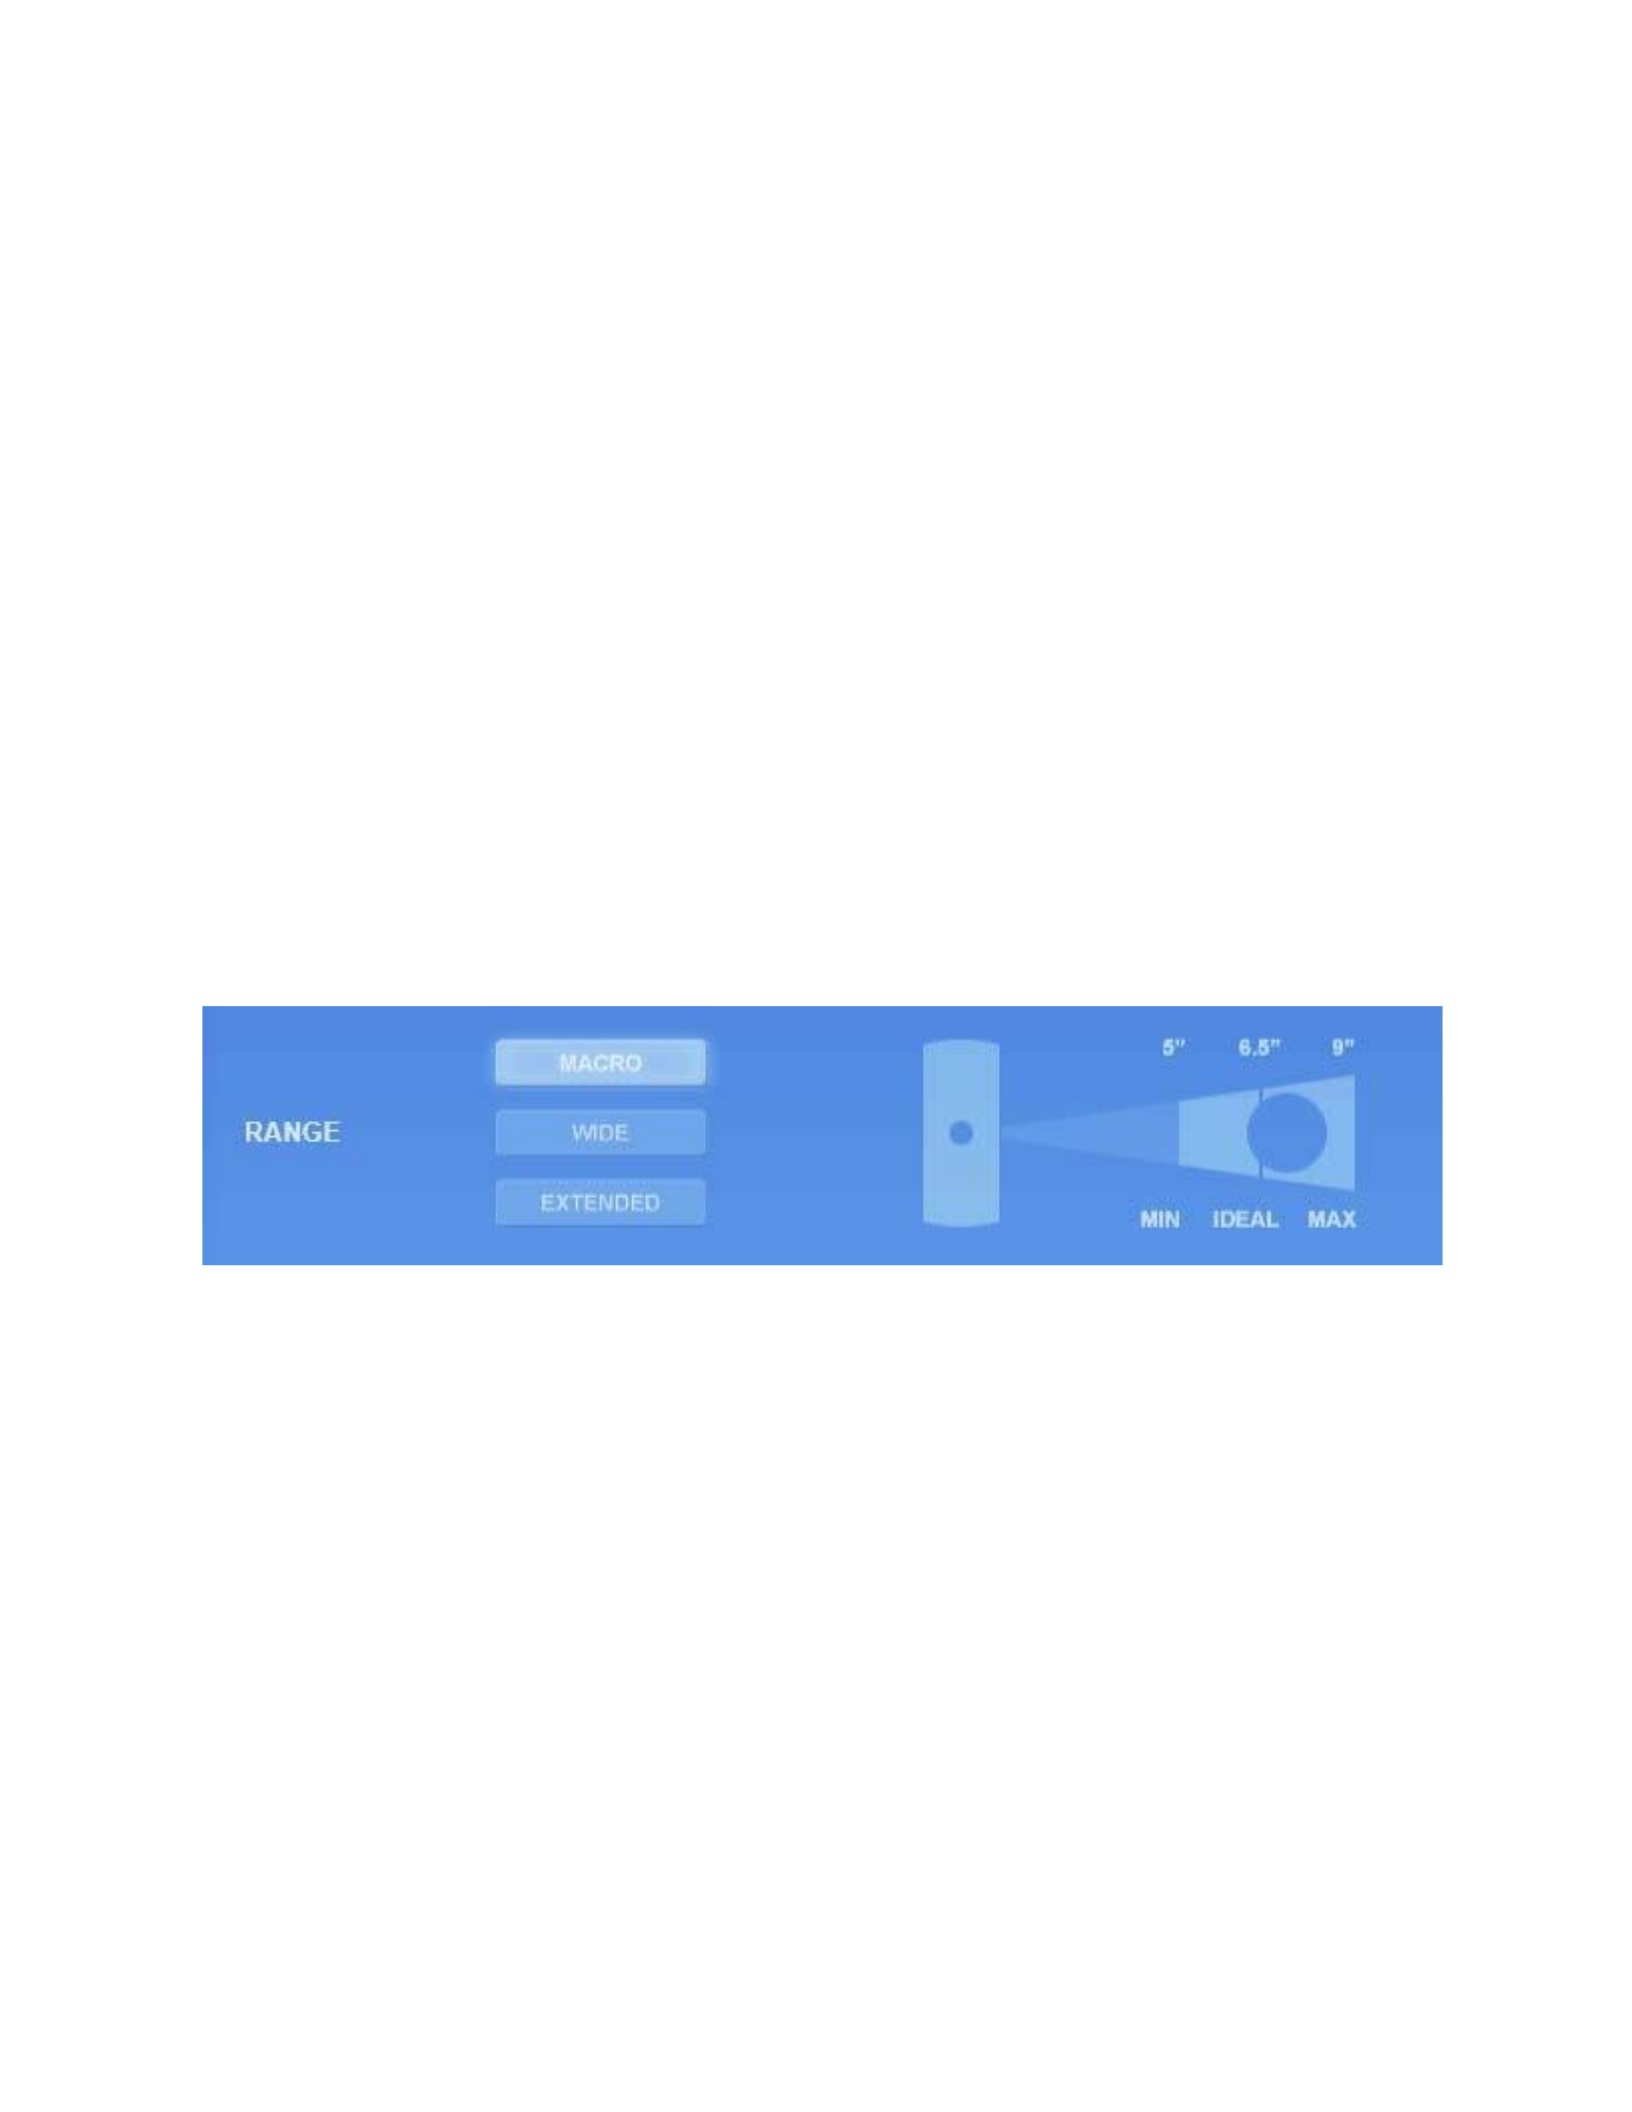
There are three range settings which determine the field of view of the scanner (Figure 7):
Macro, Wide and Extended. The macro setting results in the highest resolution scans, but has a
smaller range which requires the object to be moved closer to the scanner, between 12.7 cm and
22.86 cm (5” and 9”). This in turn can require several more scans if the entire object does not fit
entirely in the scan preview window. The wide setting extends the range between 38.1 cm and
55.88 cm (15” and 22”), but results in an overall lower resolution scan. The extended setting
further increases the range of the scanner between 38.1 cm and 76.2 cm (15” and 30”) and results
in a considerably lower resolution that is not practical for digitizing bone.
Figure 7: The Range section of the scan settings dialogue page within ScanStudio HD Pro™.
Texture
The NextEngine™ scanner captures texture information, which is data that contains the
color of an object in computer graphics terminology. Texture information may be of only
secondary importance if the surface of the object is the focus of the scanning project, but it can
aid in highlighting small anatomical features (Slizewski et al., 2010; Niven et al., 2009). The
texture settings are not determined in the scan settings dialogue box but should be considered
prior to scanning. The visualization of textures can be temporarily disabled by clicking the
‘Shaded’ button in the bottom right corner of the interface. Textures can be prevented from
loading whenever a project is opened by going to the Edit tab, to Preferences and clicking on the
No Textures bubble (Figure 9). This does not disable the scanner from acquiring textures, but
merely prevents them from being displayed in the program and is a way of increasing computer
performance when working with large scan data sets. The visualization of textures can be
reenabled by going back to the Preferences and clicking on the 2D texture display bubbles. The
scanning in this project was performed without the visualization of texture within the program to
increase computer performance for faster scanning and processing. The texture information
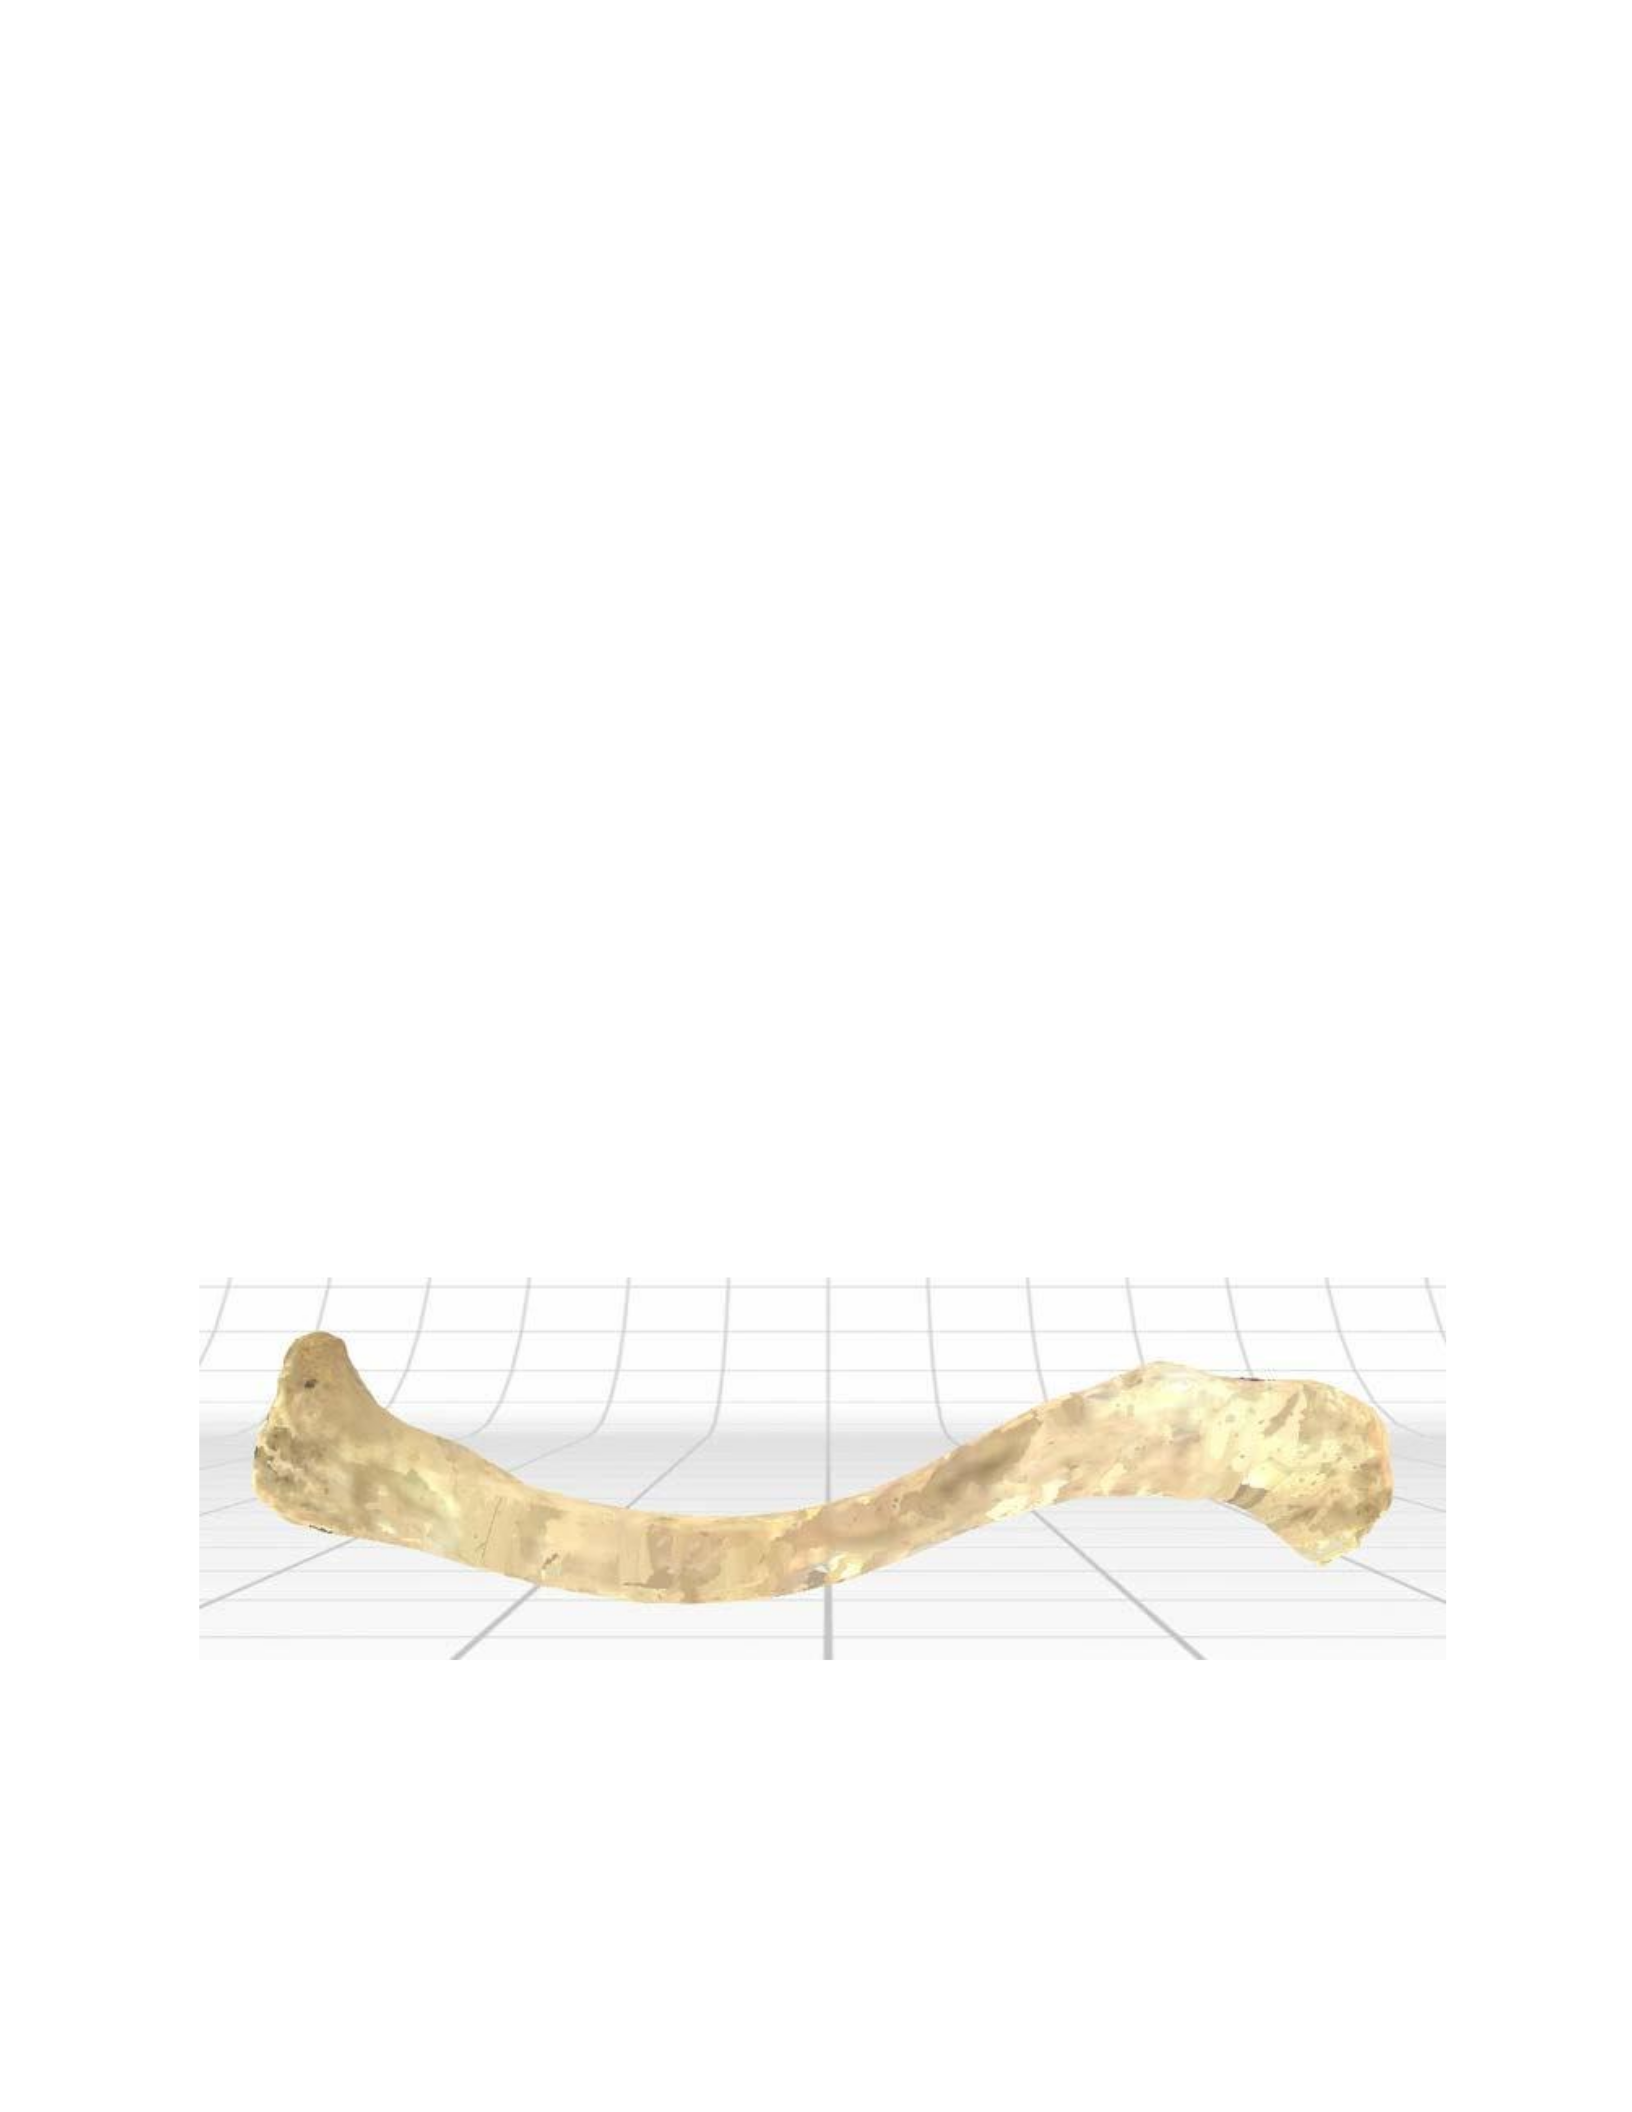
captured by the NextEngine™ scanner does not always yield quality results (Figure 8). If
highquality textures are desired it is recommend that they are acquired through other means, such
as through photo-texturing using a 3D modeling program like Autodesk® Mudbox® or ZBrush
4r4 by Pixologic™.
Figure 8: A final model of the clavicle created using the NextEngine™ desktop laser scanner and ScanStudio HD
Pro™ with textures enabled.
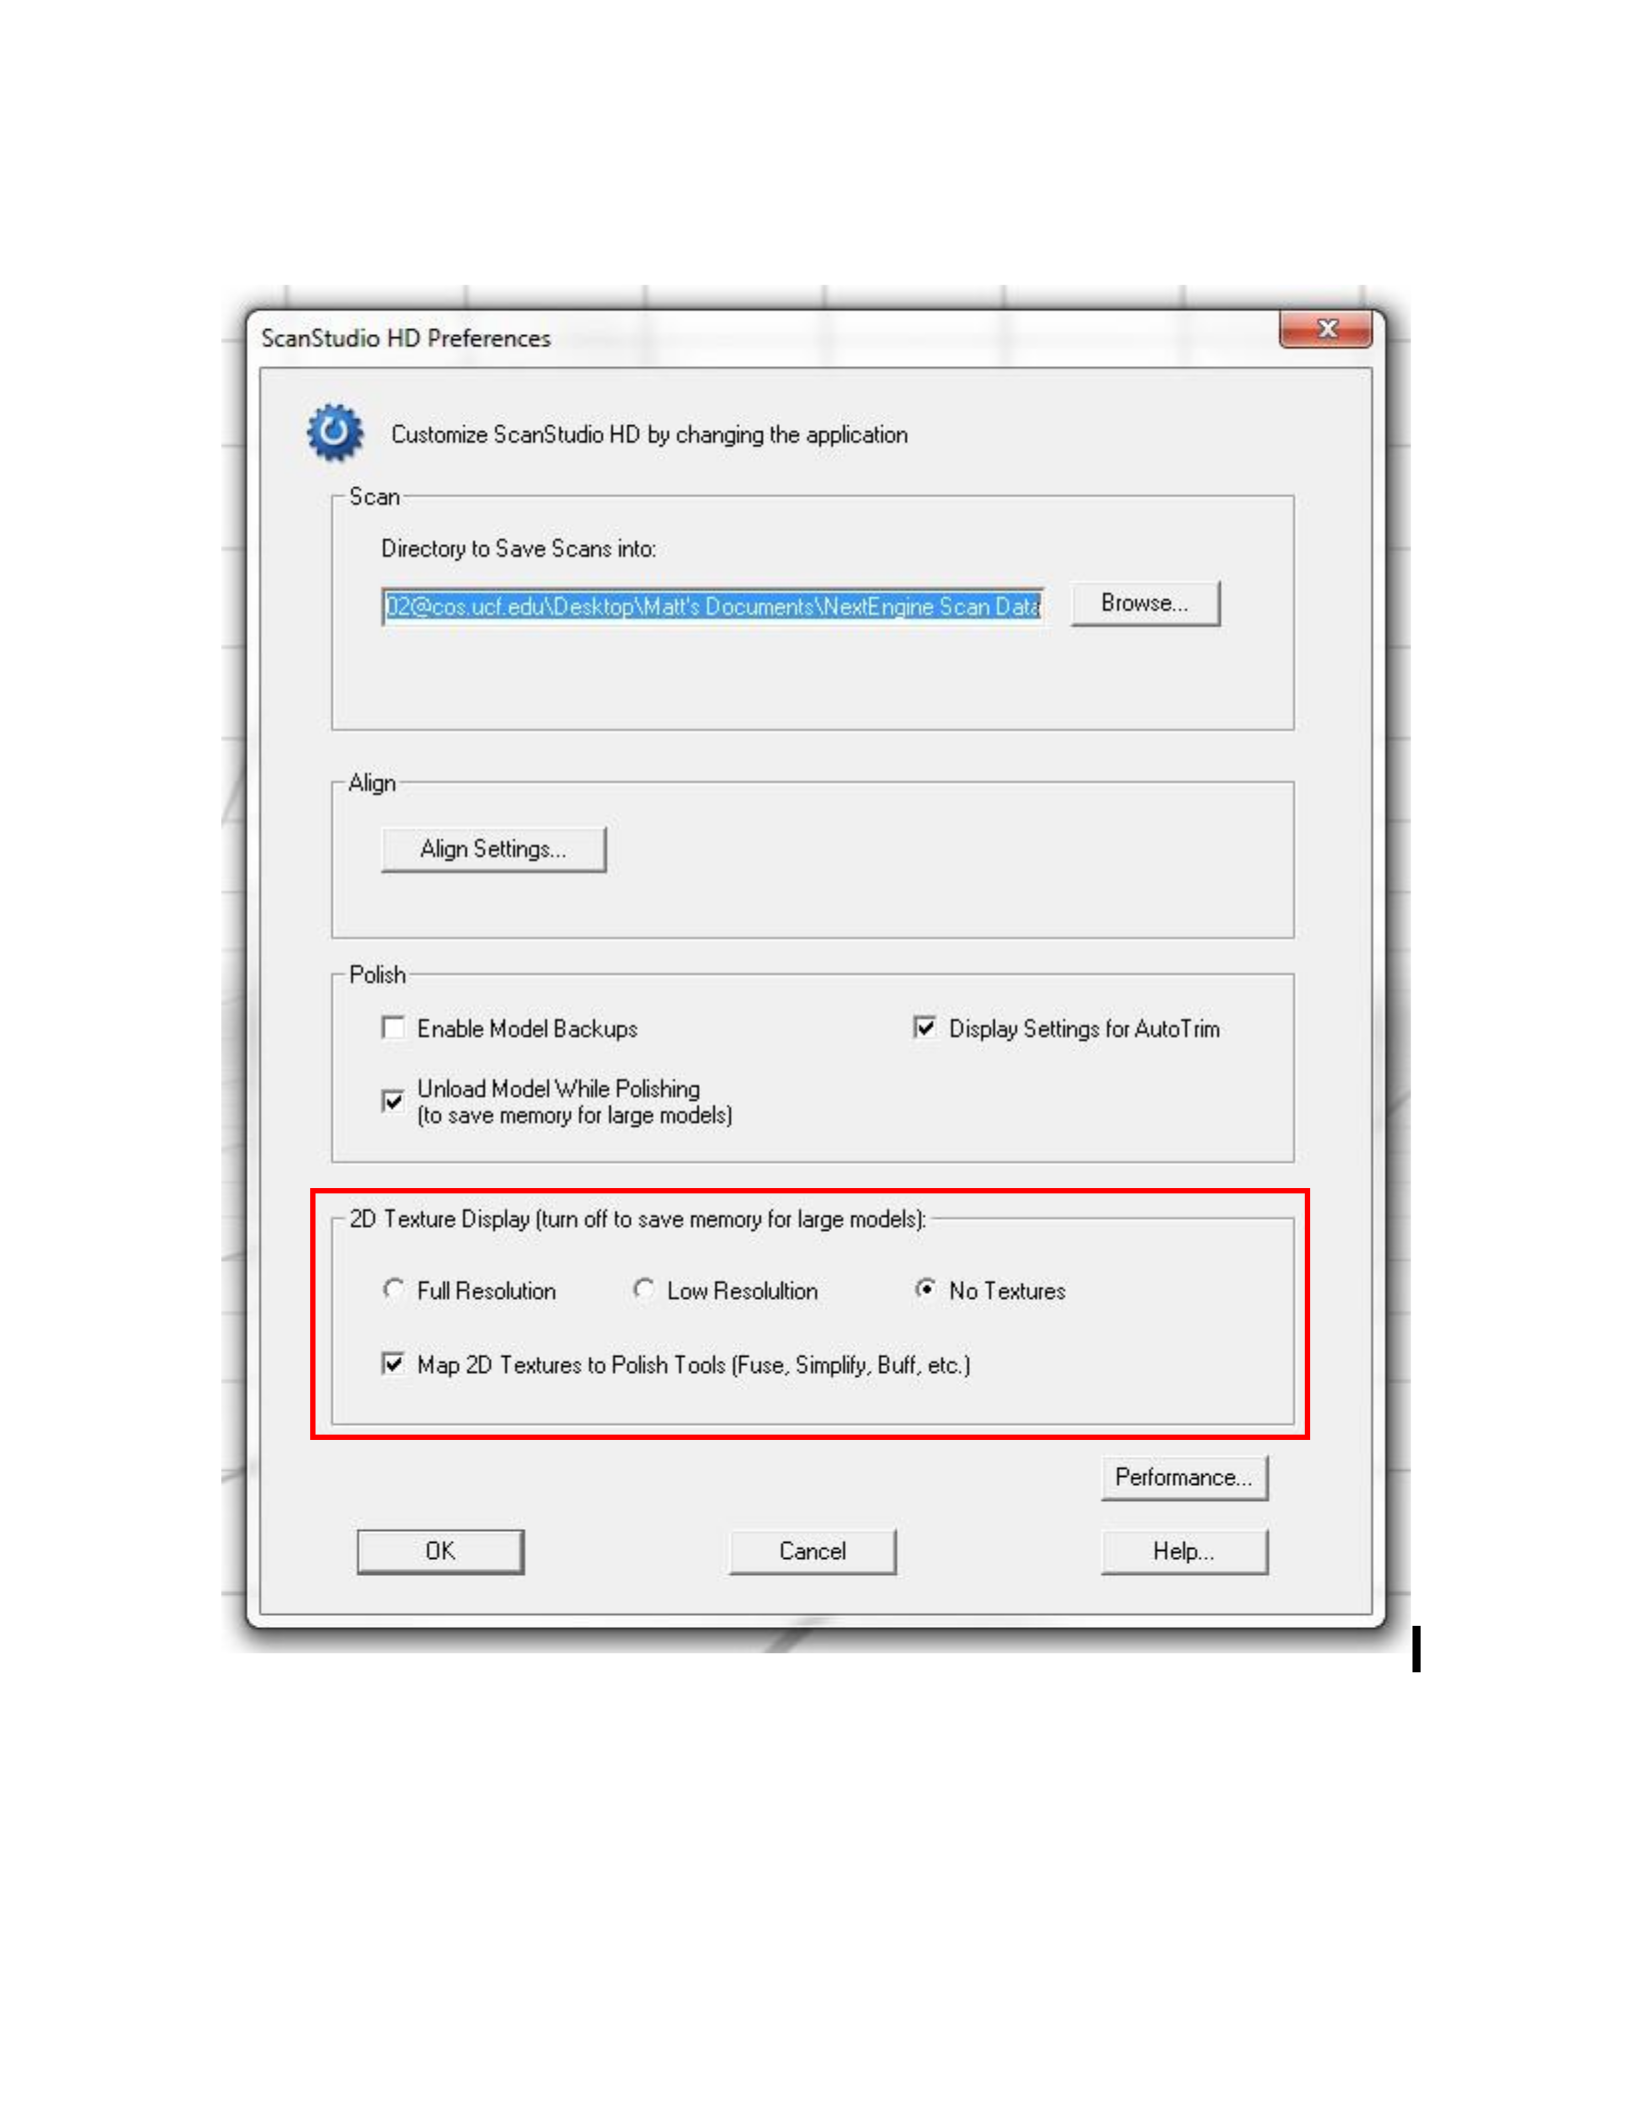
Figure 9: The ScanStudio HD Pro™ preferences dialogue box, which can be accessed at the bottom of the Edit
drop-down menu of the main toolbar. The options for displaying textures are seen at the bottom of the window.
Scan Data Processing
Once the object has been scanned it is necessary to process the scan data effectively so
that the finished 3D model is as complete and accurate as possible. This process is outlined in the
Next Engine™ user manual, but there are different techniques that can be implemented
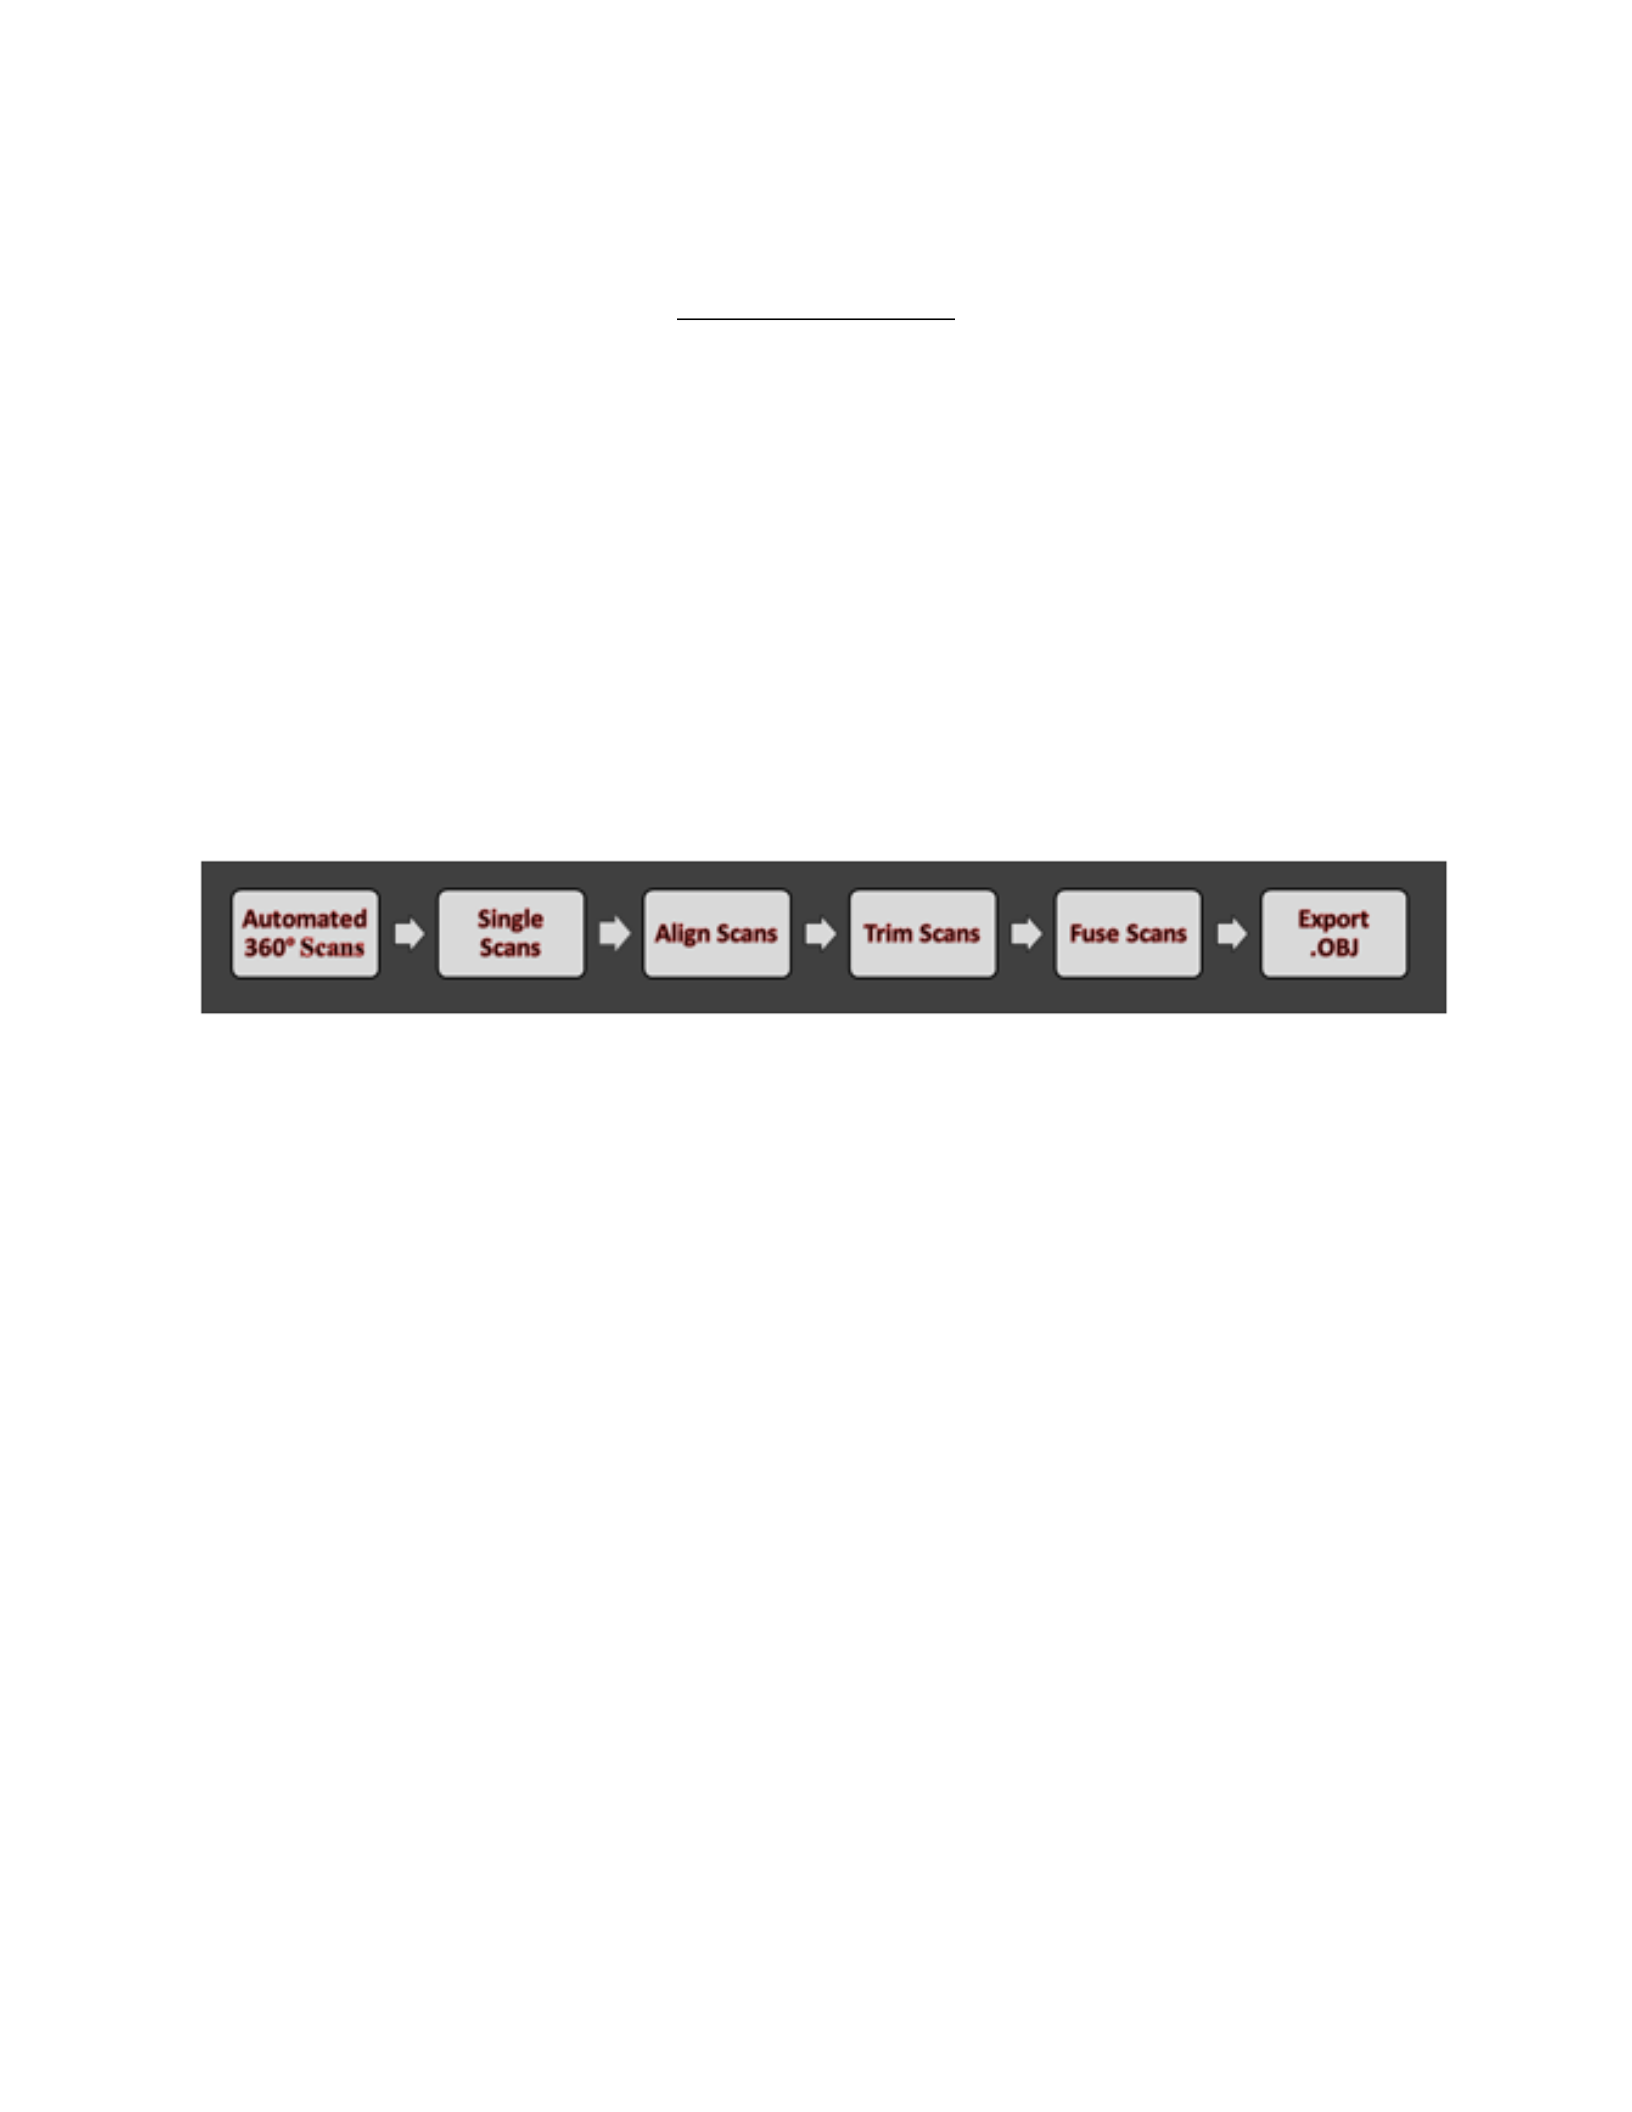
depending on the intended use of the scan data. The specific procedures developed for processing
scan data of different types of bone will be documented and outlined within this project (Figure
10).
Figure 10: A flow-chart illustrating the basic work-flow for scanning and processing the scan data.
Trimming
Once the scans have been obtained it is important to trim and remove the turntable,
partgripper components and any other irrelevant data from the scan data sets before alignment
(Figure 11 A). This should be performed with all scan data sets prior to alignment. This is done
by clicking on the Trim button on the toolbar of the ScanStudio HD Pro™ software. It is then
possible to utilize different selection tools to highlight the unwanted data (Figure 11 B), which
will be displayed in red (Figure 11 C). Once the unwanted data has been selected, the user simply
clicks the Trim button and the software will remove the data from the scans (Figure 11

D). Further removal of overlapping data can be performed, but should only be done after
alignment in order to maintain a sufficient amount of anatomical features which can be used as
reference points during alignment.
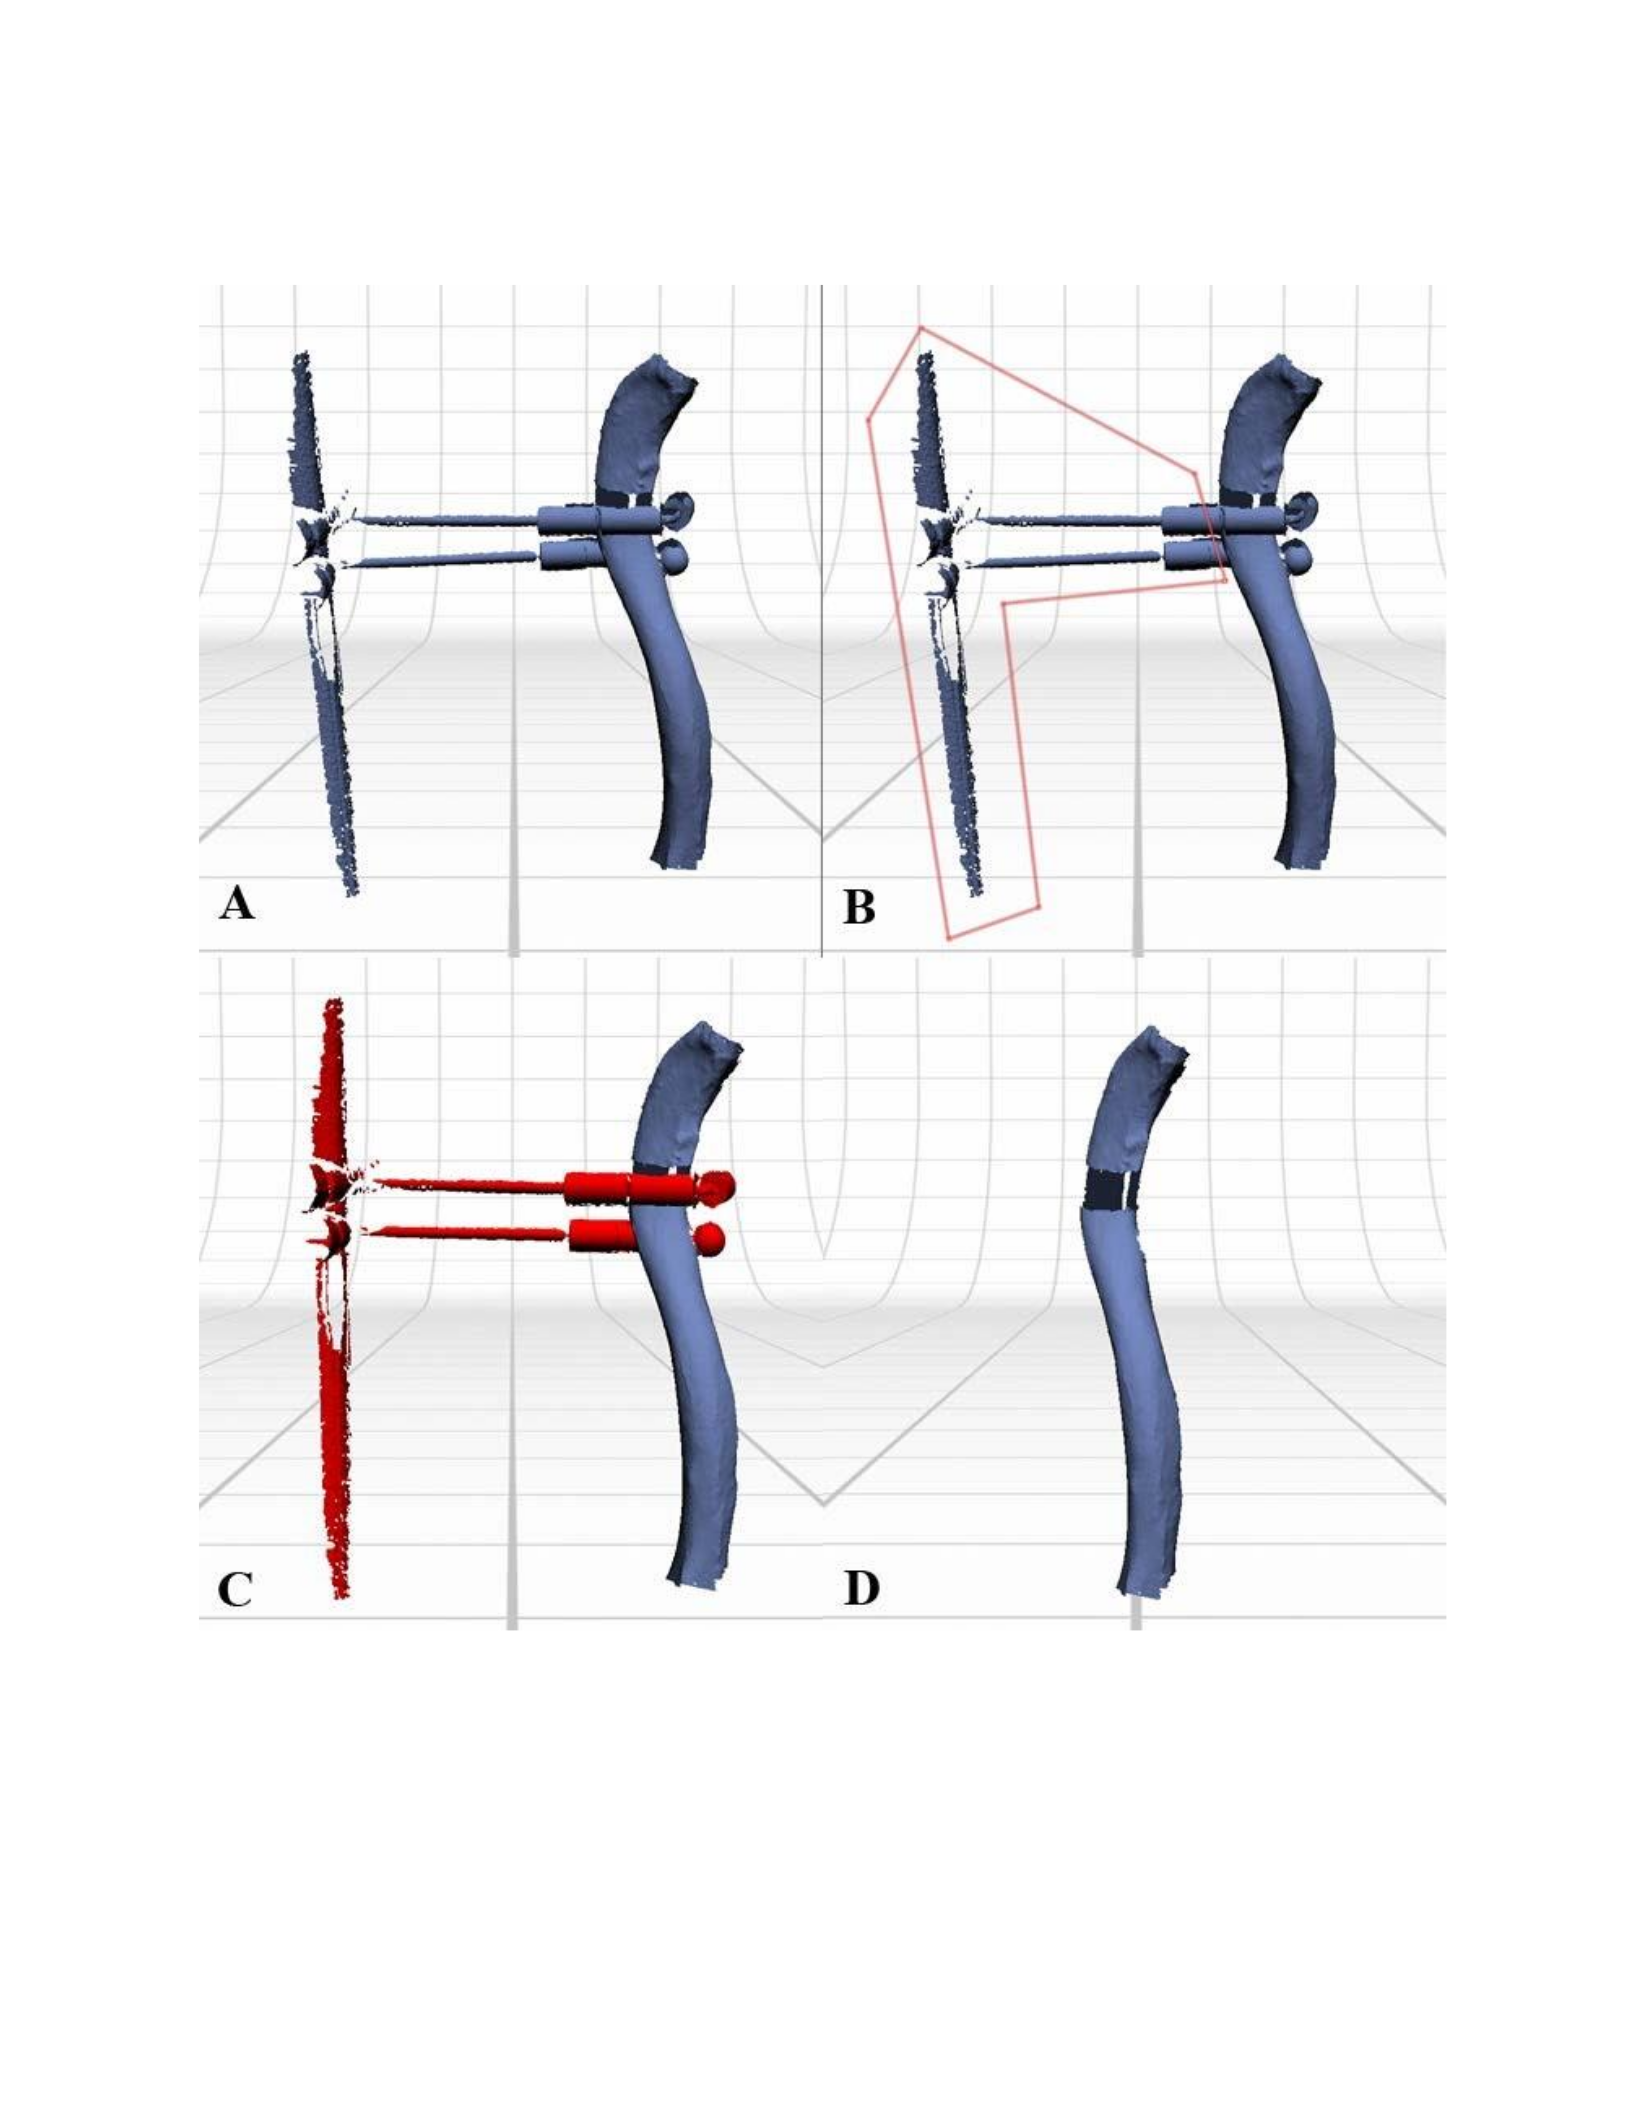
Figure 11: This image illustrates the process of trimming excess data from a 360 scan set of a clavicle. The part
gripper (A) should be trimmed from the scan data prior to alignment. Precise selections can be made using the
polygon selection tool (B). Selected areas are displayed in red (C), and are removed after clicking on the trim button
(D).

Alignment
Aligning scans is a necessary step when acquiring a complete model of the original
object. The automatic alignment features are efficient, but since all the surface data of an object
cannot be completed with a single 360 scan set, manual alignment is still necessary. Manual
alignment is performed by clicking on the Align button on the main toolbar, which opens up the
split-view alignment screen (Figure 12). The software then prompts the user to place three or
more pins to align the scans. This is done by dragging three different colored alignment pins onto
different areas of the two scan data sets that are displayed. The same colored dots should be
placed onto the same areas between the scan sets, so it is necessary for there to be some amount
of overlapping data between the scans. At least three matching points are required in order to
align the scans together (Figure 12 a, b, and c) but more than three can be placed in order to
increase the accuracy of the alignment. Anatomical features and unique patterns on the bone
serve as a great reference for aligning scan data together. Occasionally, the align button will not
respond even after placing the three alignment pins. This is because the pins were not placed
accurately enough between the scan data sets. When this happens, the user can either reorient the
pins into a more accurate position or click the refine button, which will automatically refine the
placement of the pins. After clicking align, the scan sets should appear aligned without any
visible errors (Figure 13).

Figure 12 A scan of the clavicle is used to illustrate how the alignment pins are placed on analogous anatomical
features between the scan data sets. The first set of necessary alignment pins are red (a), blue (b) and yellow (c).
Figure 13: After placing the alignment pins and clicking the Align button, the two scan sets of the clavicle will be
aligned together.

Fuse
Once all the necessary data has been obtained, trimmed and aligned, the scans can be
combined to create a complete model using the fuse function, which is accessed in the main
toolbar. The resulting model can be simplified, which decreases file size and resolution, by
adjusting the tolerance of the simplify slider found on the fuse mode toolbar. Further attributes of
the fuse mode can be modified by clicking on the settings dial, which opens up a new window
(Figure 14). In this window it is possible to adjust the hole-filling settings, the texture blending
and resolution ratio. Under the hole-filling settings it is possible to create a water-tight model,
which is a solid model without any holes in the surface. A water-tight model (Figure 15) is
necessary for outputting the model for 3D printing and rapid-prototyping, and is also desirable
when working with 3D modeling and animation software. Alternatively, the user can modify the
hole filling settings manually, or choose the setting for no hole-filling. Unlike traditional 3D
models which are created by a designer on the computer, scan data generally contains open areas
in the surface (holes) which can complicate advanced post-processing of the data for
visualization and rapid-prototyping. Texture blending modifies the blending of the textures to
account for brightness variations, and the resolution ratio determines the size of the vertices of
the resulting mesh in relation to the model prior to fusing scans. Once all the settings have been
determined, the function is completed by clicking on the fuse button.
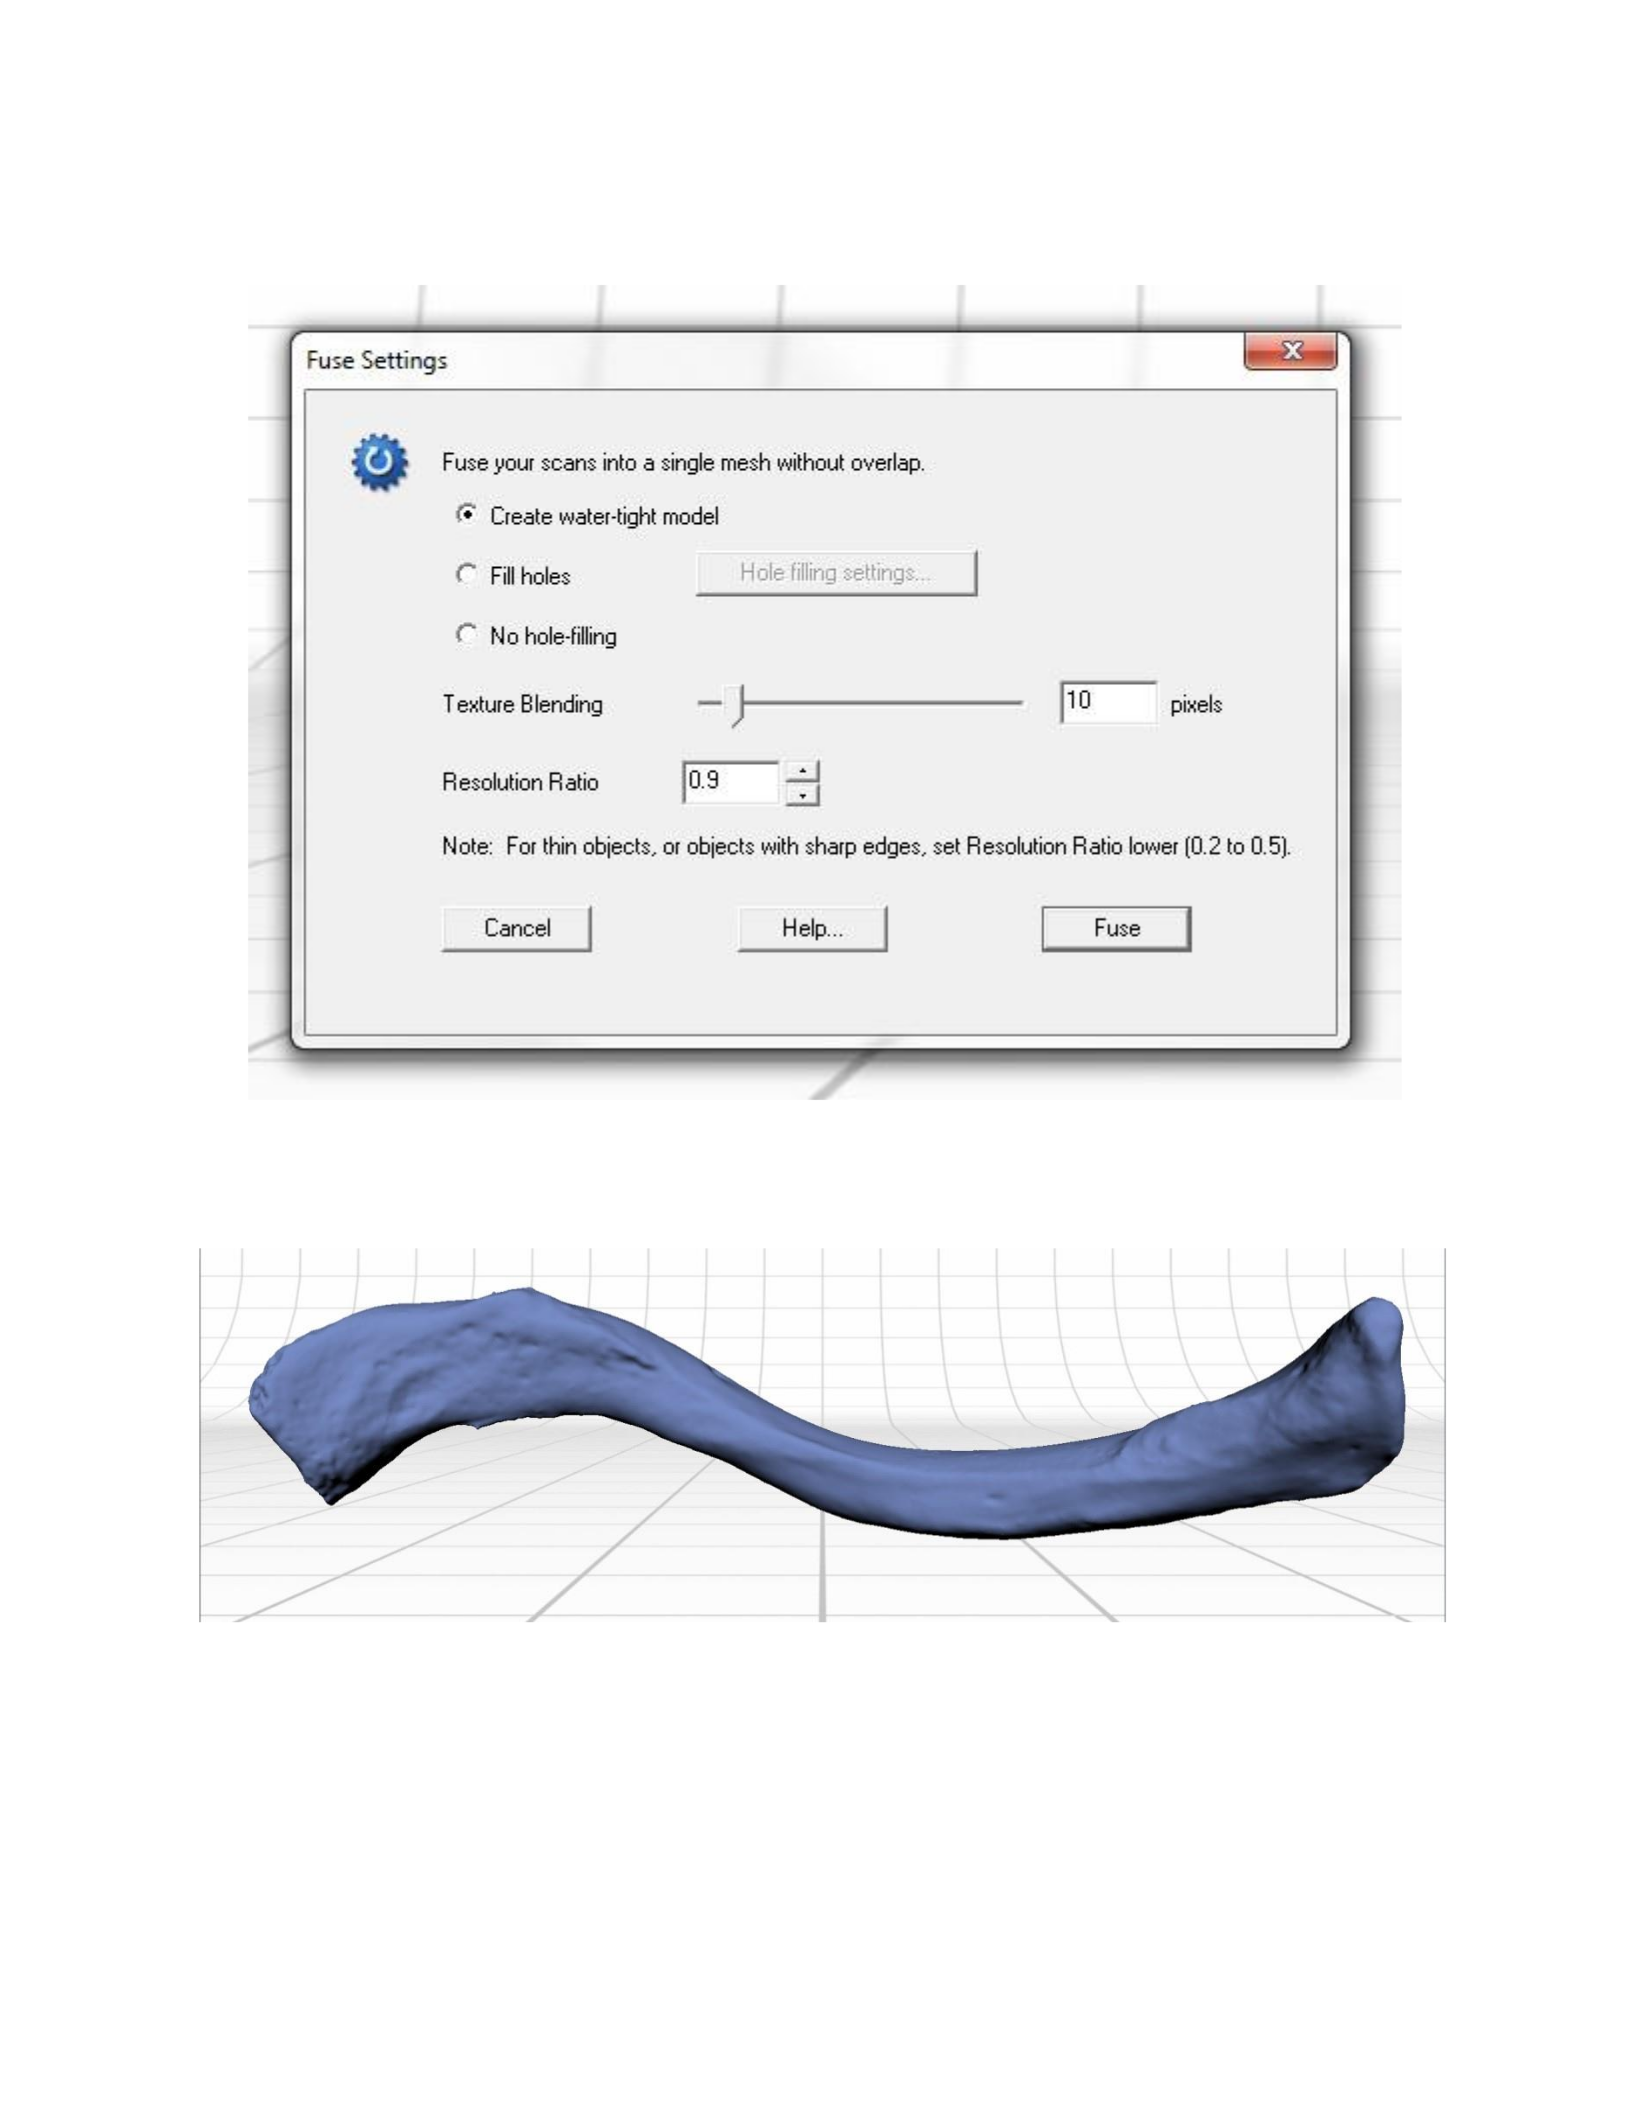
Figure 14: The fuse settings dialog box within ScanStudio HD Pro™.
Figure 15: After fusing the scans of the clavicle together, any overlapping data is removed. A water-tight model
without any holes can be created, which is ideal for advanced post-processing for visualization and
rapidprototyping.

Export
Once the scan data has been processed in the ScanStudio HD Pro™ software, the
resulting 3D model should be exported by going to the main toolbar, clicking File, Save As and
changing the Save as type to the OBJ file (*.obj) format (Figure 16), which is a standard 3D
model file format that can be imported into most 3D graphics software. Along with the OBJ file
which contains the 3D information, an MTL file and a series of JPG images are also saved,
which contain the material and texture information created by the scanner.
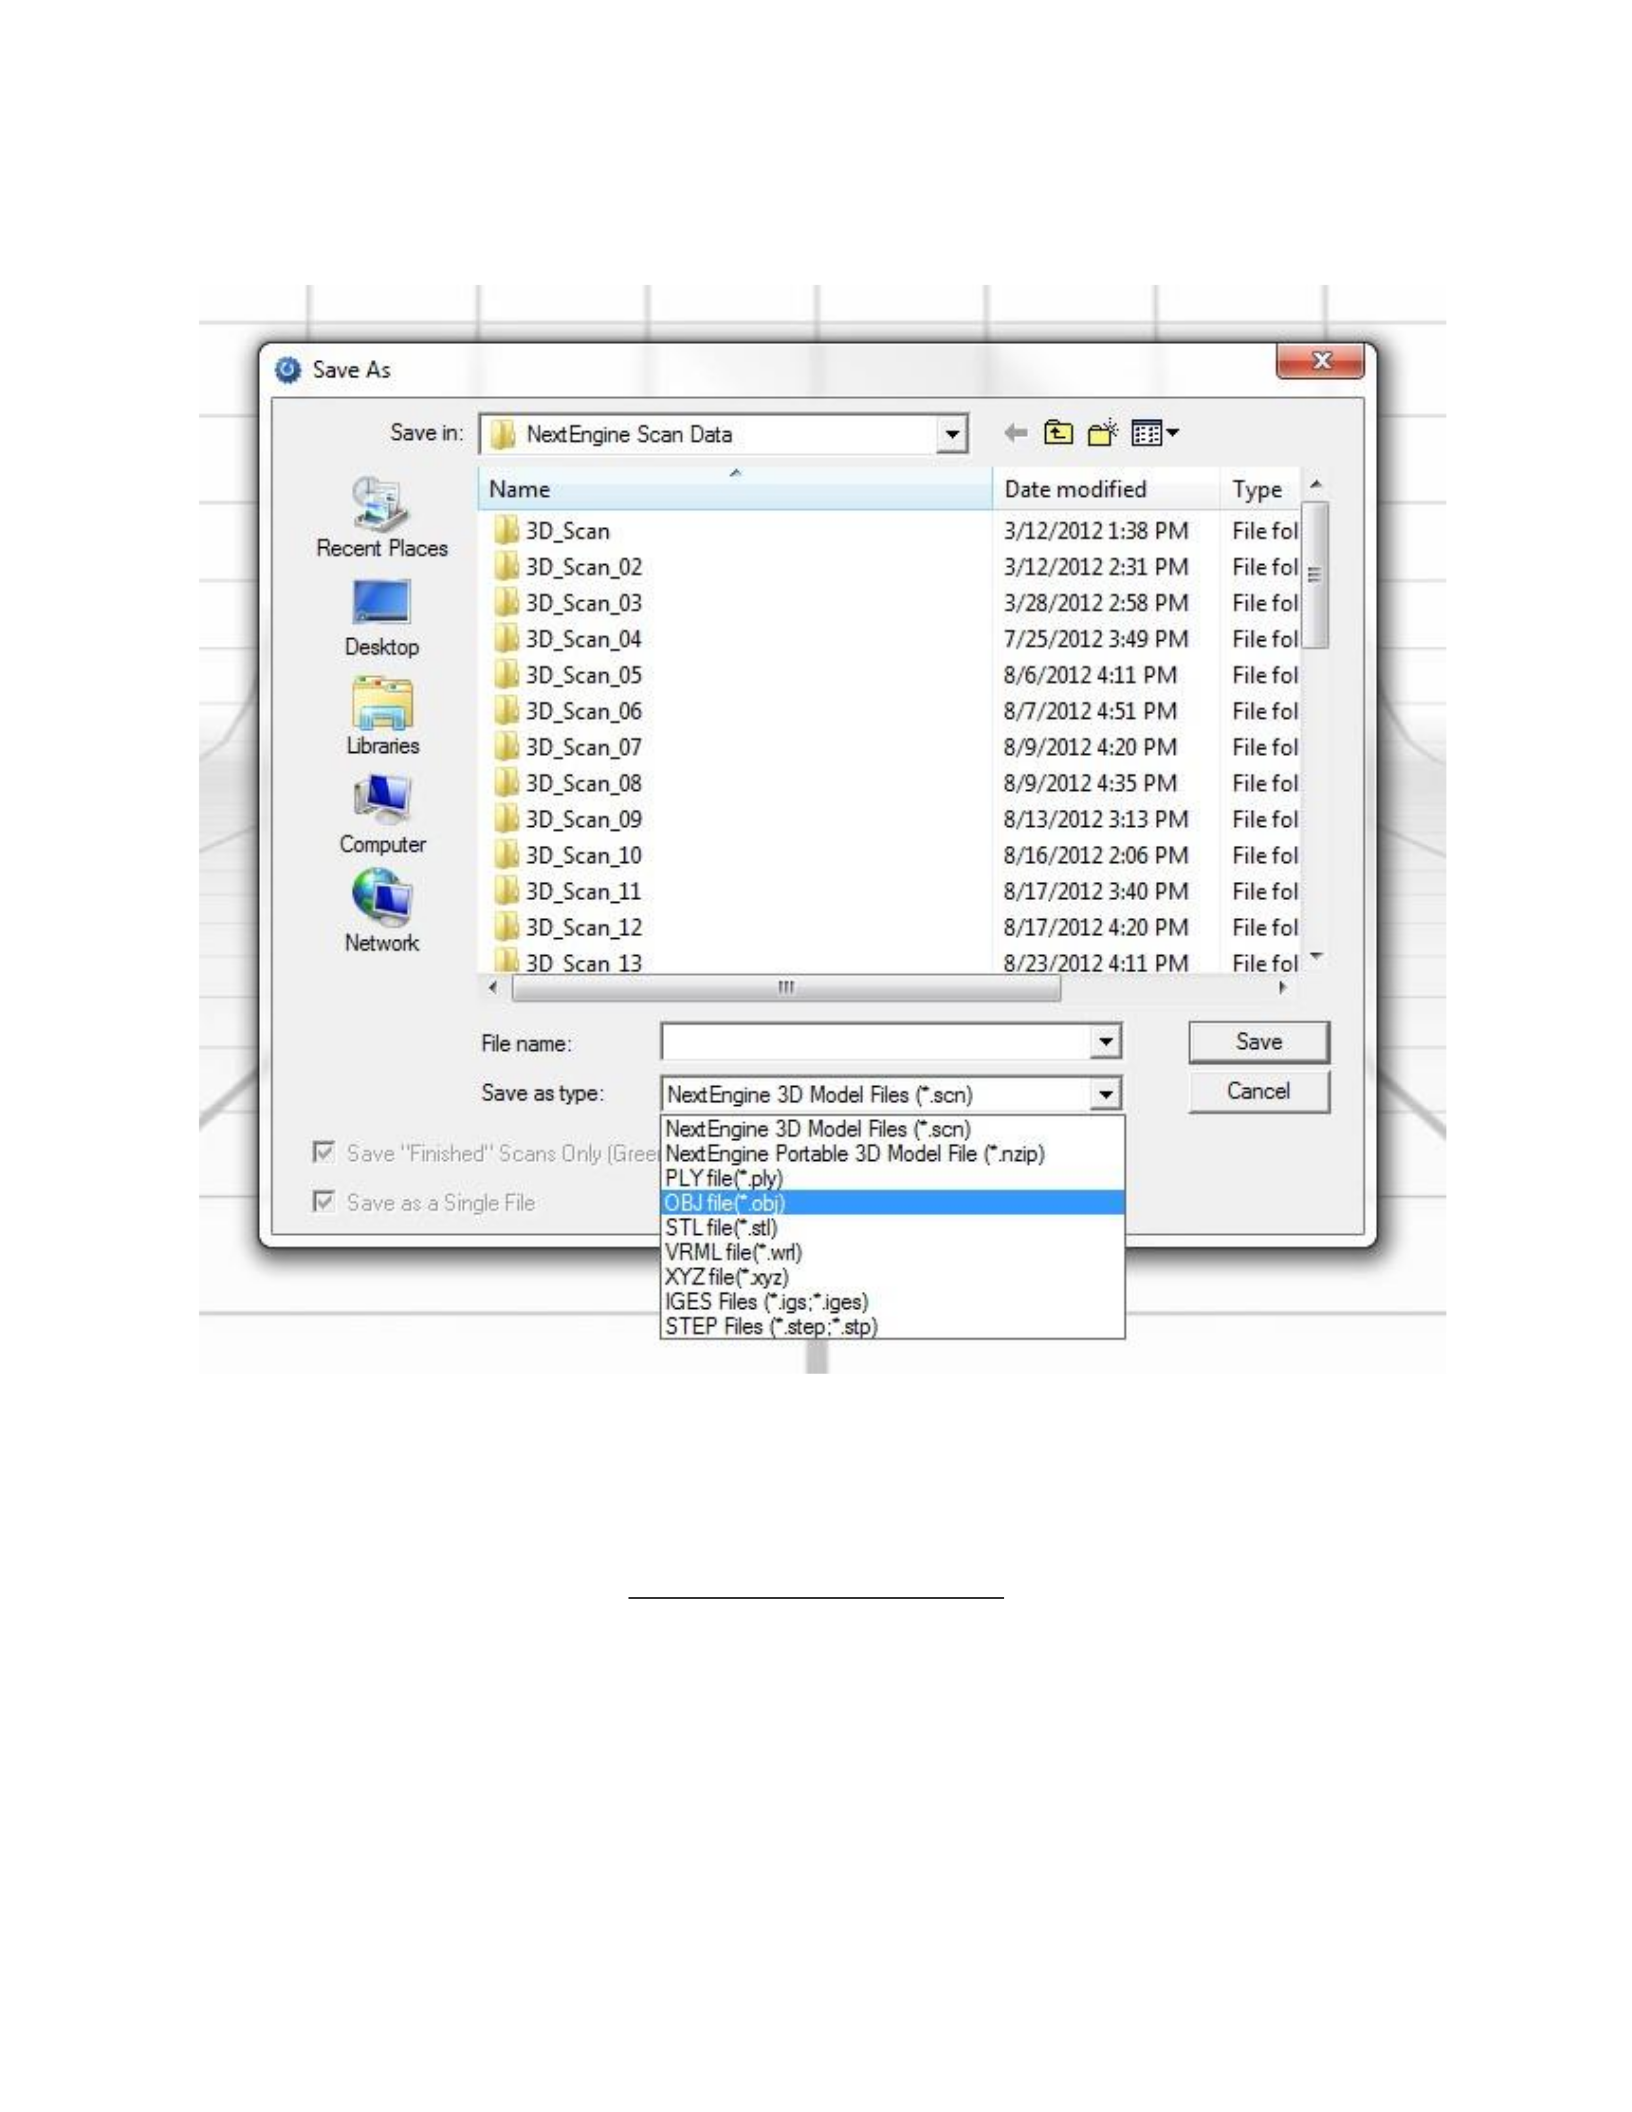
Figure 16: The Save As dialog box within ScanStudio HD Pro™ is used for exporting 3D files, which can then be
imported into other 3D modeling programs.
Computer Graphics Software
Once a 3D model has been exported from the ScanStudio HD Pro™ software, it can be
imported into a variety of 3D graphics programs and used to create visual tools that can aide in
forensic investigations. Three computer graphics programs will be used to explore the

applications for using the laser scanned data in this project: Adobe® Photoshop® CS5, Adobe®
Acrobat® X Pro and ZBrush™ 4r4 by Pixologic™. Adobe® Photoshop® CS5 is a standard 2D
photo editing and painting program that has limited 3D capabilities. It is used in conjunction with
Adobe® Acrobat® X Pro to create 3D PDFs, and can be used to edit and annotate rendered
images from ZBrush 4r4. Adobe® Acrobat® X Pro is used for creating professional-level PDF
files that have audio, video and 3D visualization capabilities. In this project it will be used
specifically for its ability to embed interactive 3D models into a PDF. Pixologic’s ZBrush 4r4 is a
powerful digital sculpting program used in the professional art production workflows in the
gaming, toy and movie industry. It is particularly appealing in this project due to its ability to
handle millions of polygons, allowing it to handle high-resolution scan data with ease. In
conjunction with this ability, it will be used to explore virtual reassembly and reconstruction
techniques.
CHAPTER FOUR: RESULTS - SCANNING
Introduction
The unique morphology of different bones types within the human skeleton requires
diverse strategies to be implemented for efficient scan data collection. This includes positioning
the bones with the part gripper in a variety of ways that will enable all of the surfaces to be
documented, modifying the position of the scanner to enable it to scan larger bones that are
beyond the ideal object placement range of the Macro setting, in addition to other methods
exclusive to particular bone types. Due to a lack of protocols in forensic anthropology for laser

scanning human bone, it is necessary to document scanning techniques for different bone types in
hopes of establishing the reliability of this technique. This chapter will provide the protocols that
were developed in this project, and may be used as a reference for future research and
improvement.
Laser Scanning Different Bone Types
Vertebrae
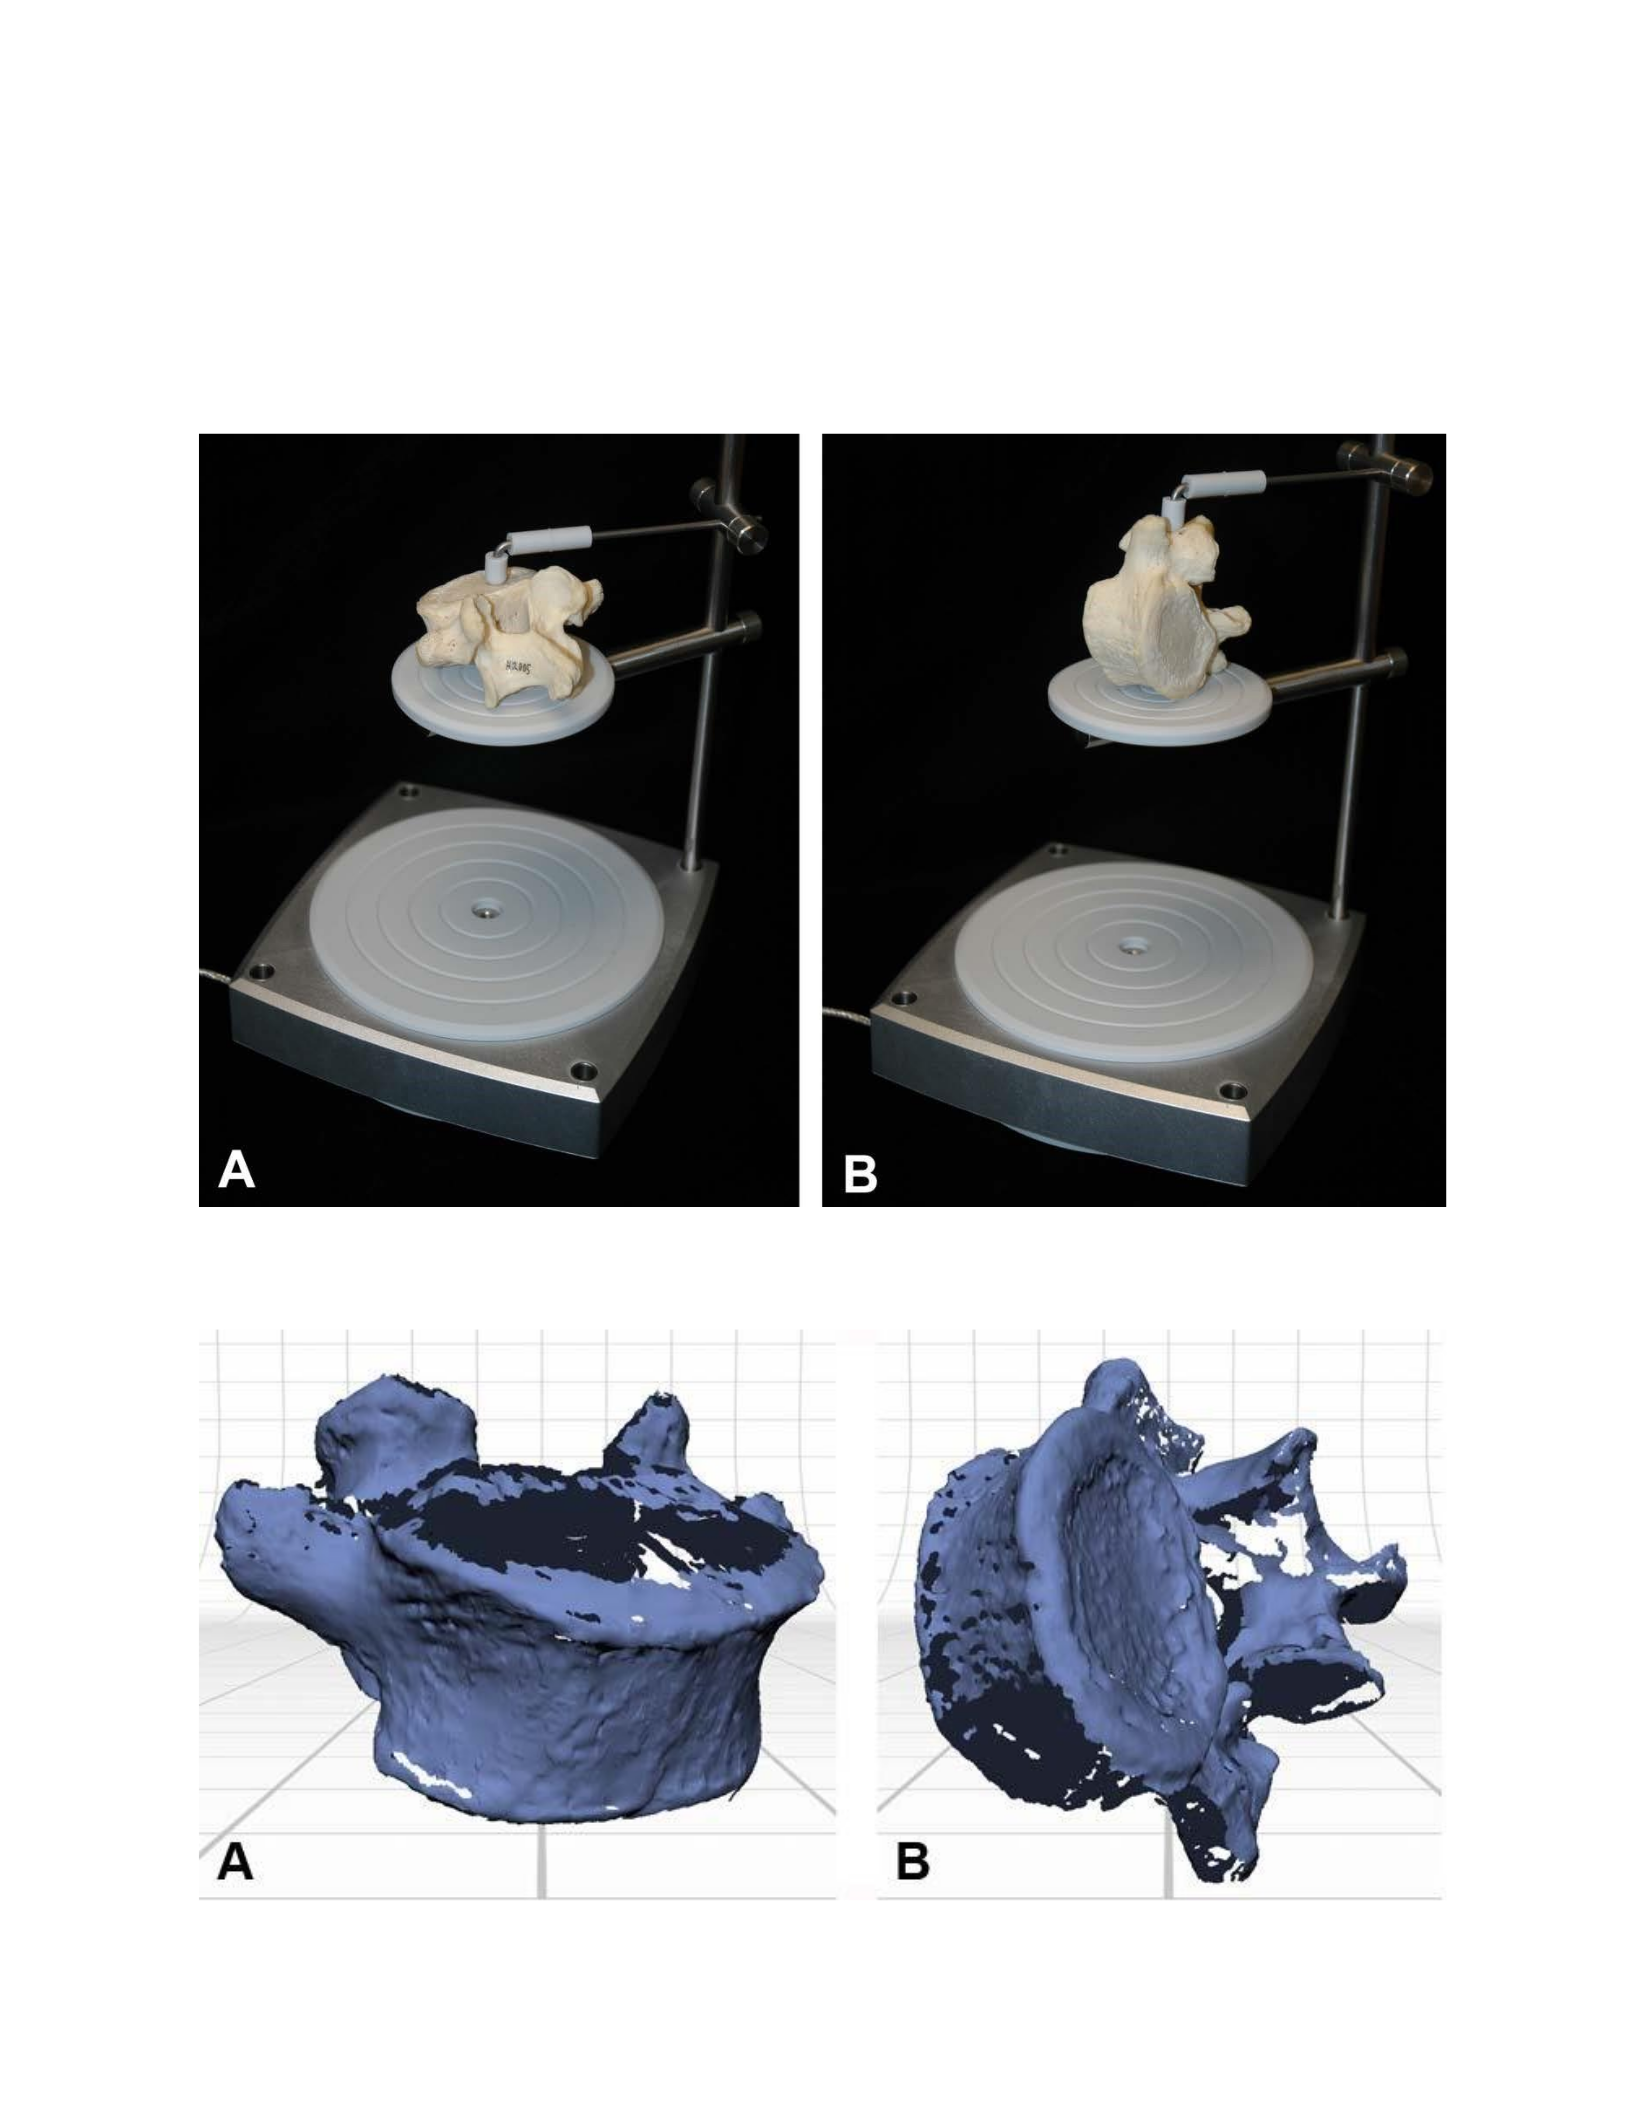
The majority of the surfaces of the vertebra can be obtained by employing two 360° scan
sets with eight divisions each, one scan set made with the vertebral body placed horizontally
(Figure 17 A), and the other with the vertebral body placed vertically (Figure 17 B) on the part
gripper base. Figure 18 A & B show the results of these scans. These scans were then aligned
using the superior articular facets (Figure 19 a & b) and spinous process (Figure 19 c) as
references for alignment. The most challenging aspect of scanning the vertebra is in obtaining the
surfaces which border the interior of the vertebral foramen, the inferior articular facets and the
posterior surface of the vertebral body (Figure 20). In an attempt to acquire these surfaces,
several single scans were collected with the vertebra oriented with these areas facing the scanner.
Some of the missing areas were obtained, including the posterior surface of the vertebral body
(Figure 20 a; Figure 21 a). Although several attempts were made, the surface contralateral to the
posterior surface of the vertebral body was not obtained (Figure 21 a). The Fuse function was
attempted despite the missing data (Fig. 21 a), which caused the software to completely fill in the
vertebral foramen (Fig. 21b). The ScanStudio HD Pro™ hole-filling feature of the Fuse function
is a global operation and does not allow the holes to be manually selected and filled. In this
instance, it would be useful to utilize additional software to overcome the limitations of
ScanStudio HD Pro™.
Figure 17: The initial scans of the L5 vertebra consisted of two 360° scan sets, one with the long-axis of the bone
oriented horizontally (A) and one with the long-axis of the bone oriented vertically (B).
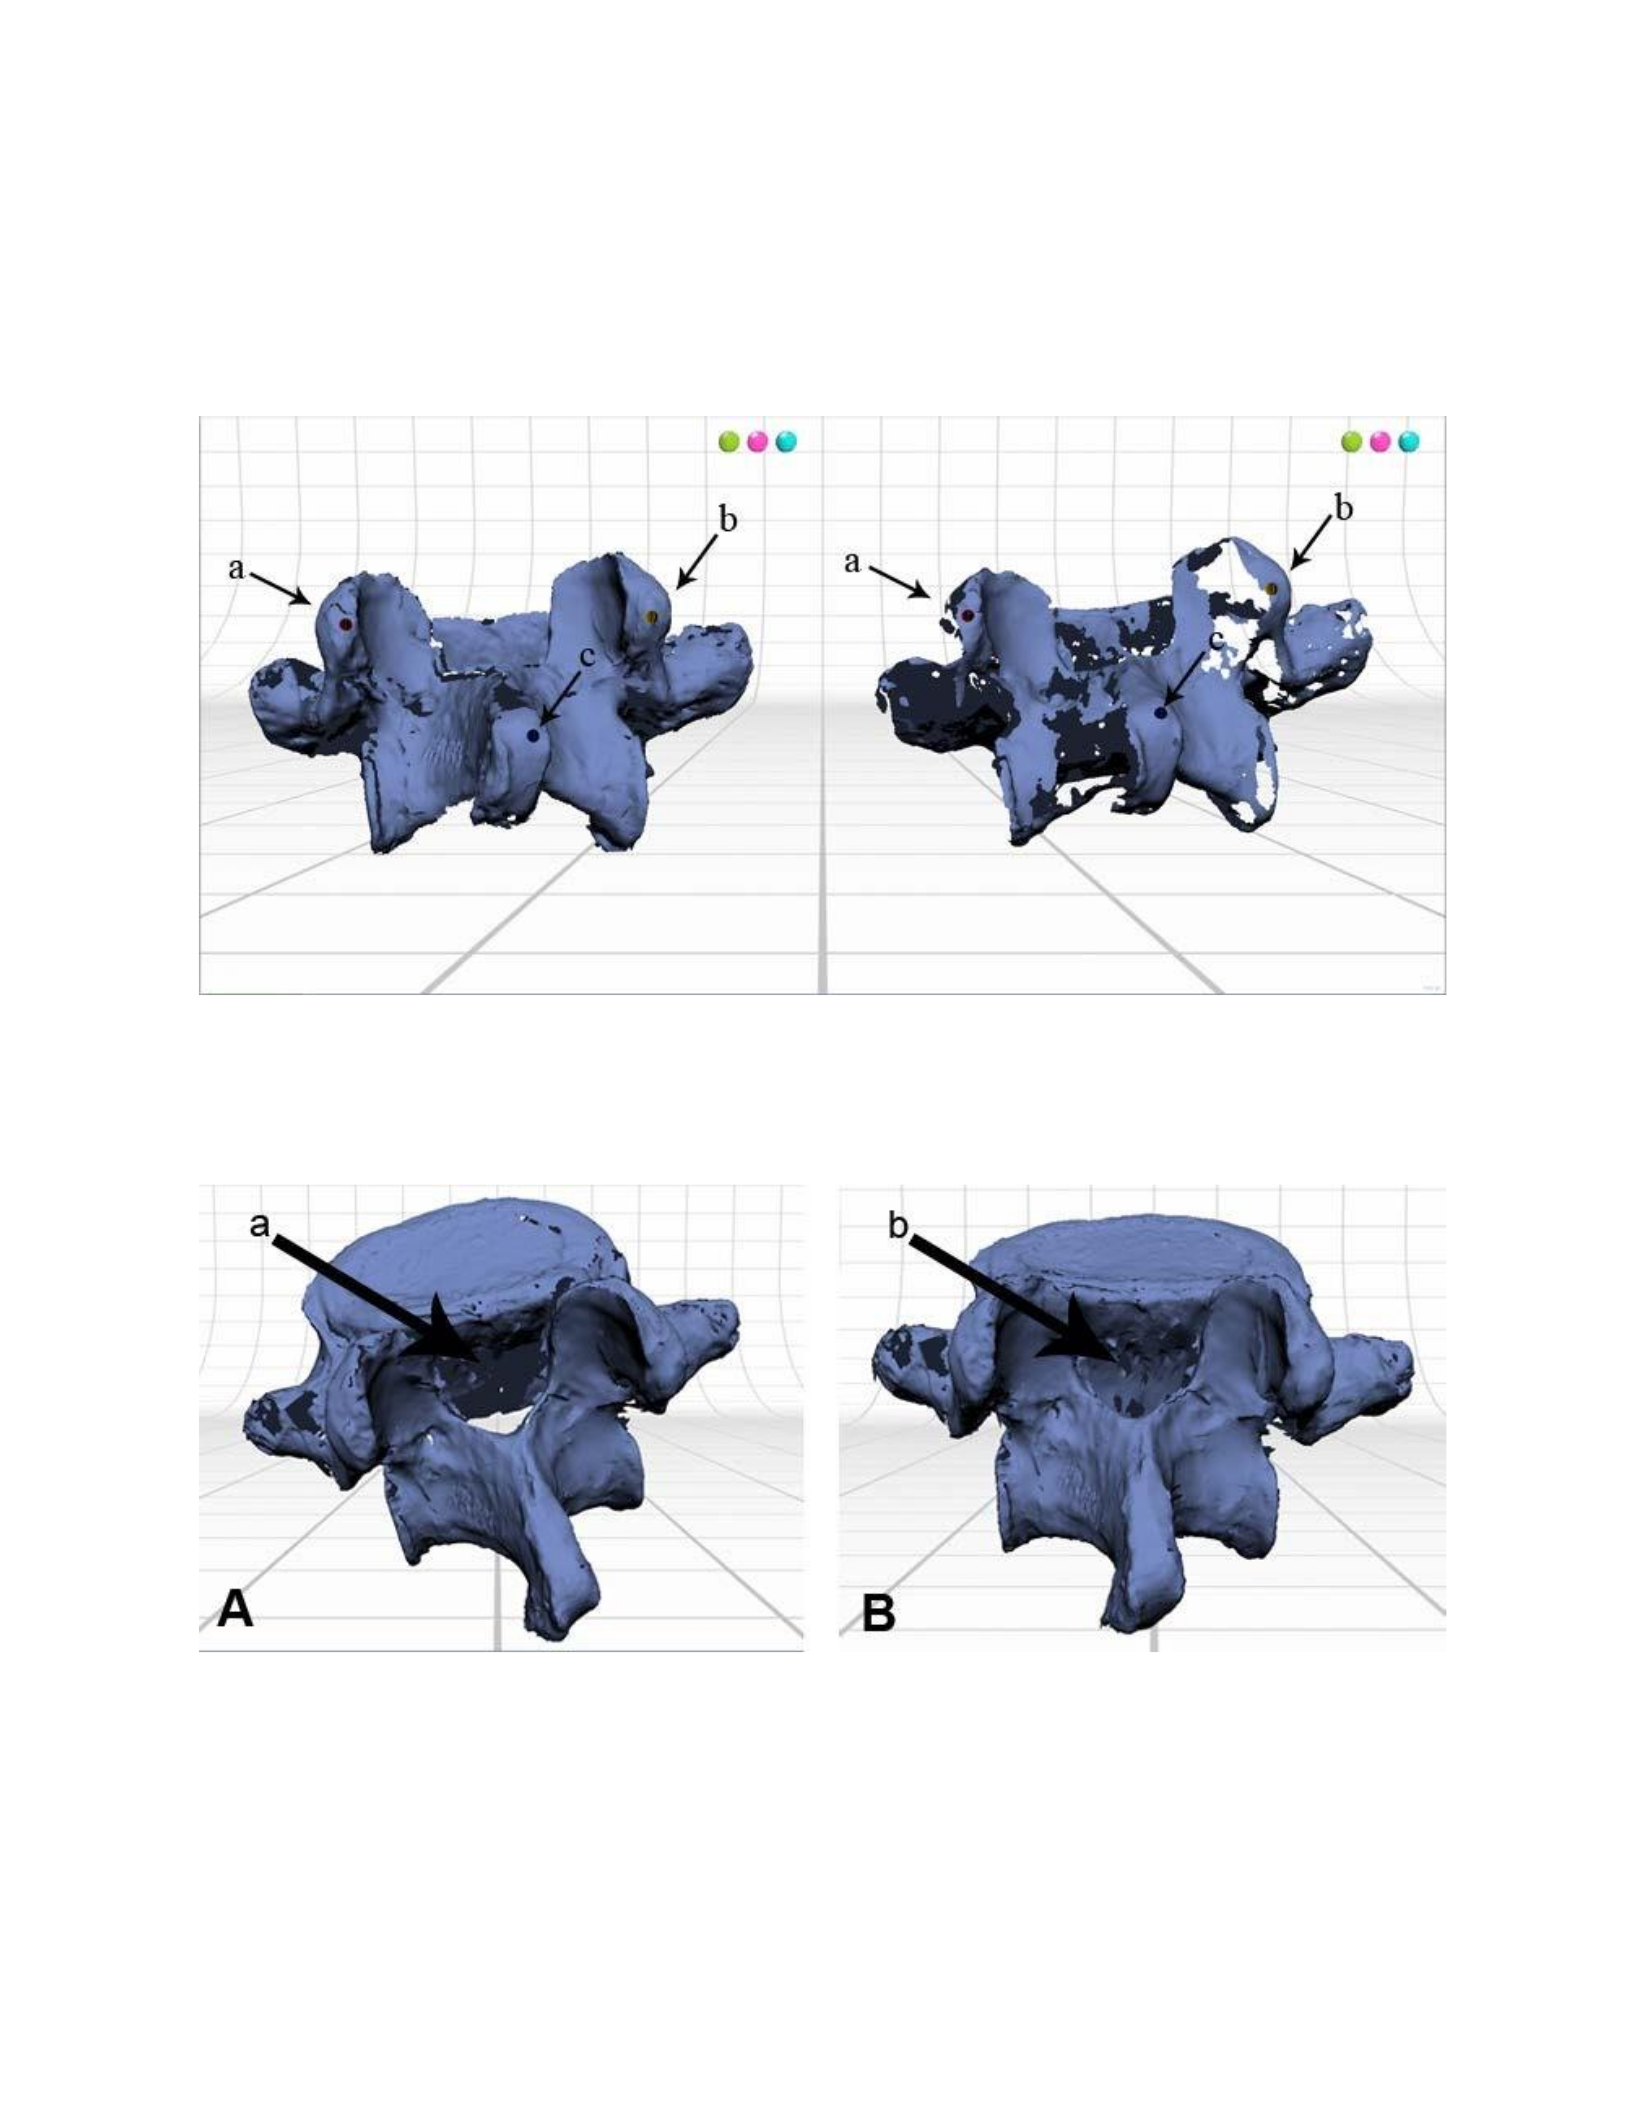
Figure 18: The horizontal (A) and vertical (B) 360° scan sets of the L5 vertebra within the ScanStudio HD Pro™
software, prior to alignment.
Figure 19: The superior articular facets (a, c) and spinous processes (b) of the L5 vertebra were used for aligning the
360° scan sets.
Figure 20: The horizontal and vertical 360° scan sets of the L5 vertebra are aligned (A), but the interior borders of
the vertebral foramen are still missing (a). Several more scans were collected (B), and the posterior border of the
vertebral body was obtained (b).
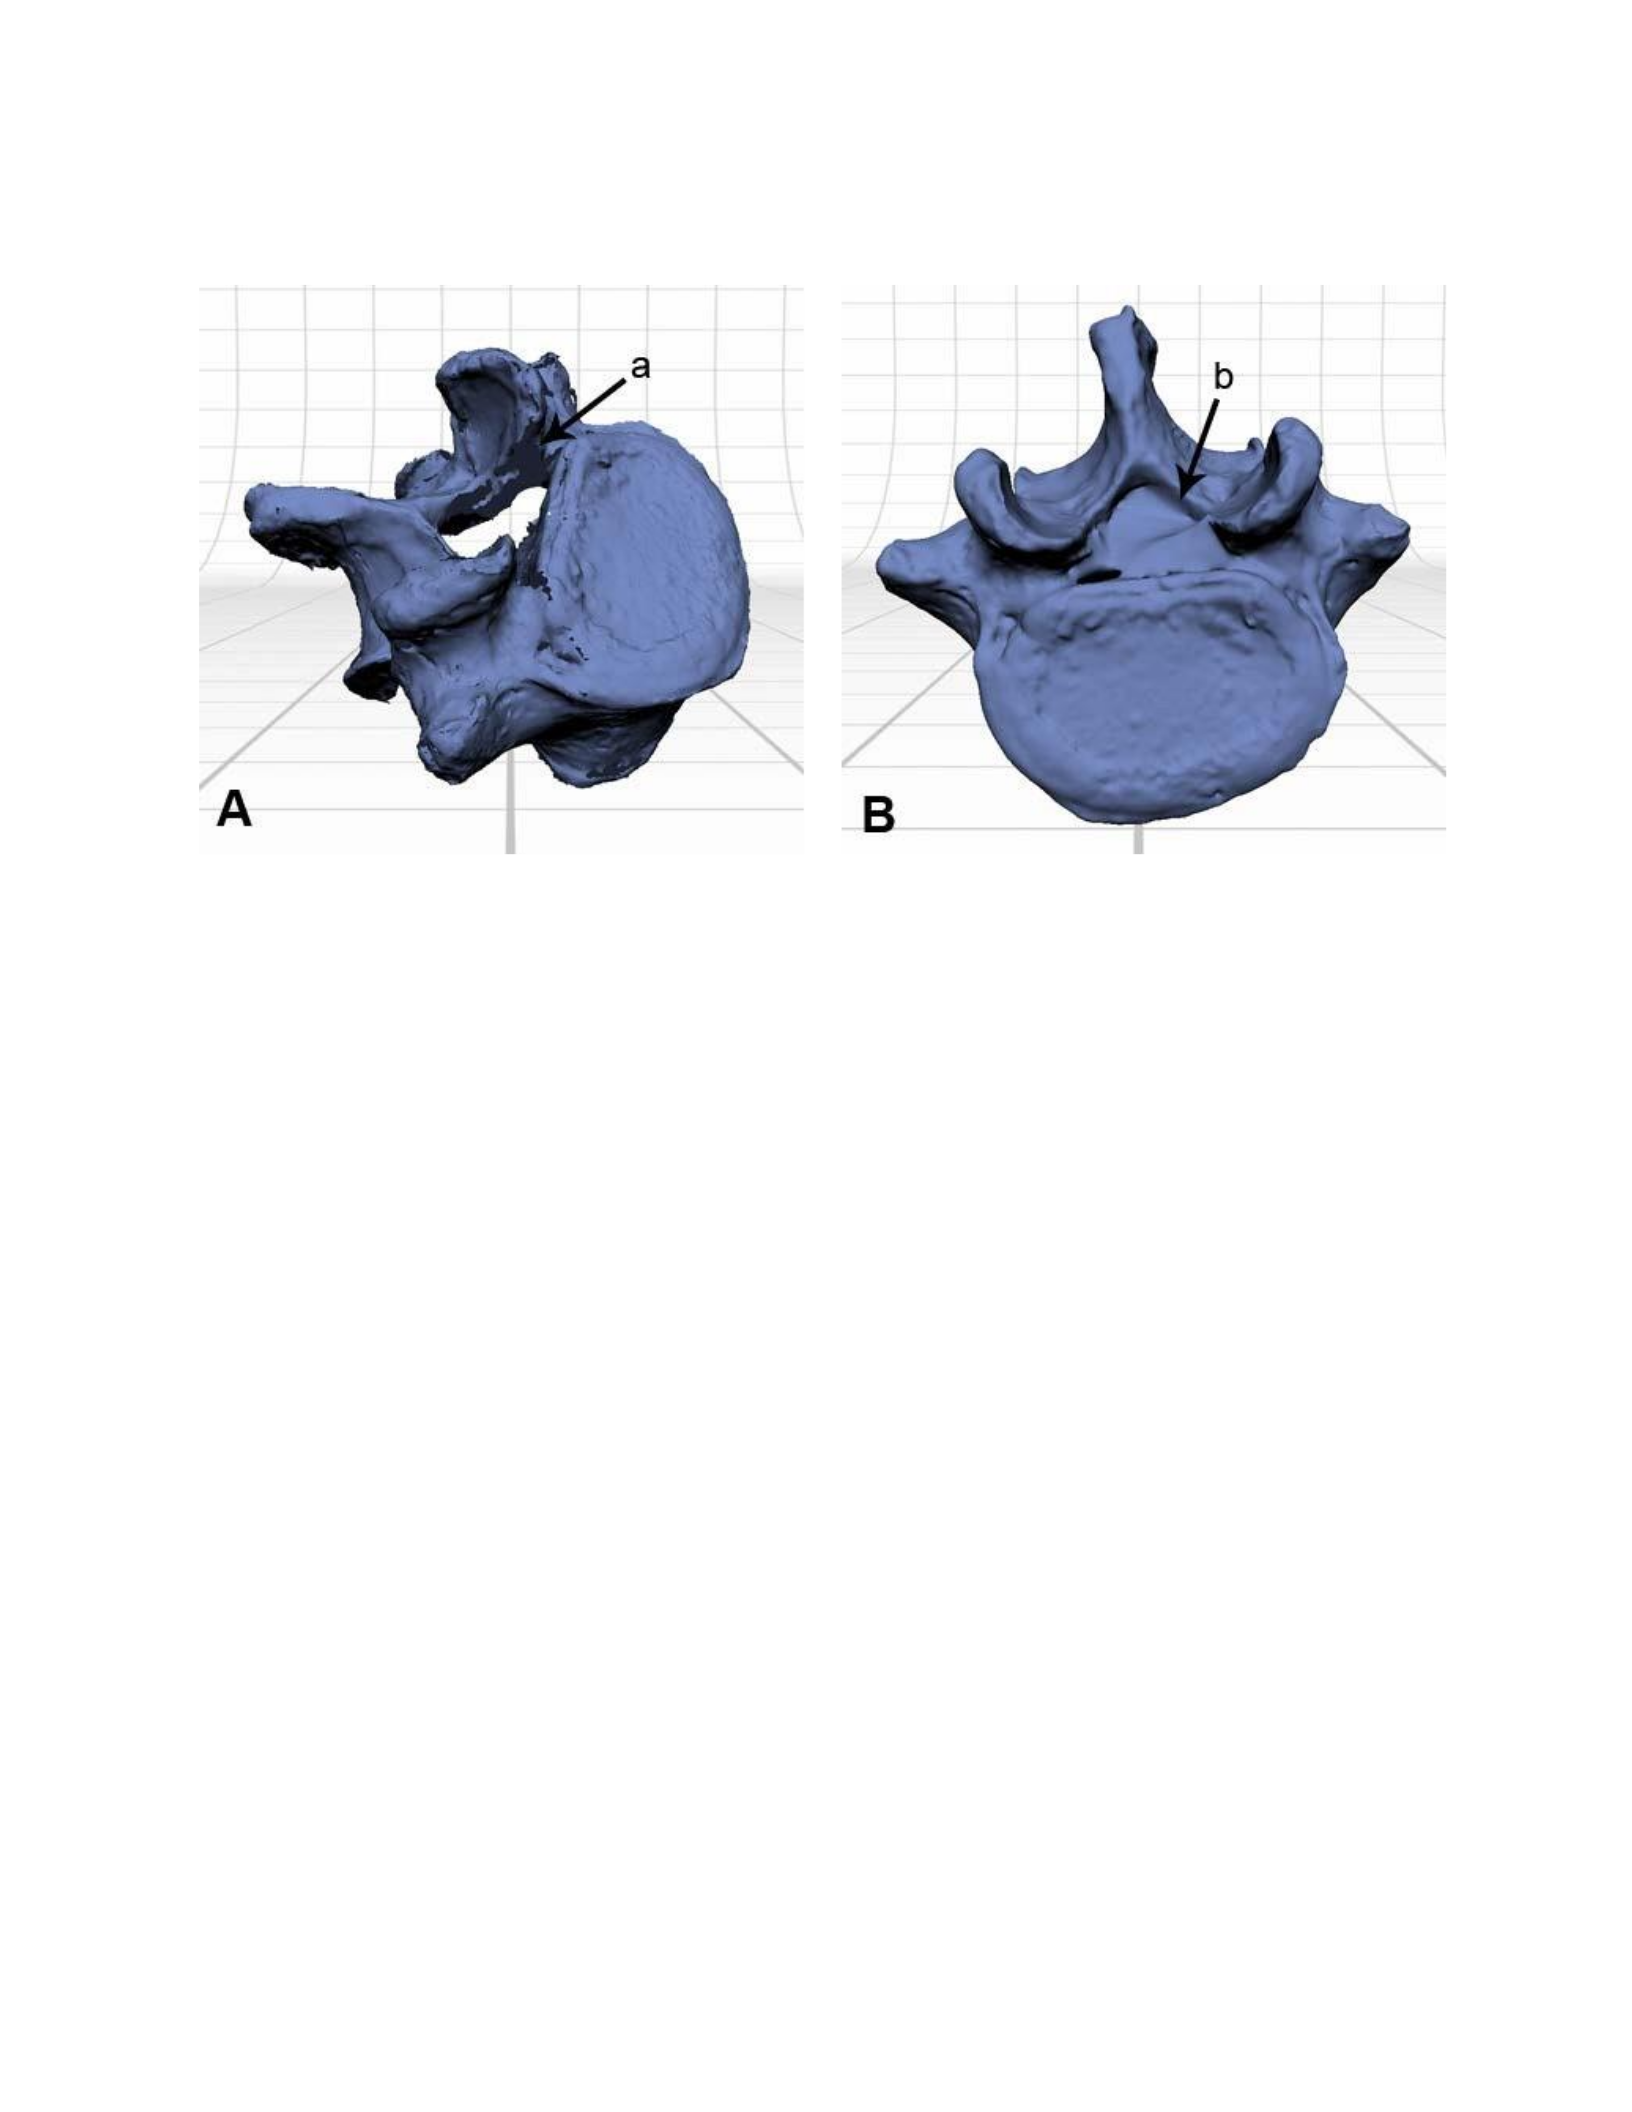
Figure 21: The posterior border of the vertebral foramen, intermediate to the superior and inferior articular facets
was not obtainable (A, a). Despite this, the scan data of the L5 vertebra was processed with the Fuse function. The
missing data caused the software to bridge the empty spaces, filling the vertebral foramen (B, b).
Scapula
First, a 360° scan set was collected with the superior border and acromion process placed
on the surface of the supporting stand of the turntable (Figure 22 A). A second 360° scan set was
created with the breadth of the scapula placed horizontally was created in order to obtain the
anatomical borders of the bone (Figure 22 B& Figure 23). This secured the bone from moving
during the scanning process, and allowed the flat surfaces of the subscapular and infraspinous
fossa to be obtained. Once these scan sets were completed and examined in ScanStudio HD
Pro™, the thin surfaces of the fossae caused an issue with the 360° scan set. In observing the
scan data, the fossae did not have the same shading as the other surfaces, which have a lighter
blue color (Figure 24). This difference in color is how the software illustrates different surface
normals. In computer graphics, surface normals govern a surfaces orientation in relation to a light
source during shading. The ScanStudio HD Pro™ displays outer surfaces as a lighter blue color,

which represents the outer surface of the object within the viewport. The darker blue shading
represents the inner surface of the object and is useful for identifying missing data where a
surface still needs to be acquired. The surfaces of the fossae presented a dark blue color,
indicating that an internal surface was protruding through the external border of another surface.
After expanding the 360° scan family and detaching individual scans, it was found that the
inversion of the surface normals occurred when scans of the two different fossae were aligned
together. The inversion of the surface normals was caused by an intersection of the thin surfaces
of the fossae, which may not have been distinguishable by the laser triangulation system. After
deleting the problem scans, the 360° scan sets were aligned together, and resulted in the same
problem.
A second scapula that appeared to be slightly thicker than the first (Figure 25 A& B) was
scanned using the same protocols. The first 360° scan set exhibited similar surface intersections
as the first scapula, but appeared unevenly on the surface of the fossae (Figure 26 A). A second
360° scan set did not appear to have any surface intersections (Figure 26 B). A third 360° scan set
was collected with the scapula lying flat on the part-gripper base (Figure 26 C). Several attempts
were made to align these scan sets together (Figure 27), but the attempts resulted in errors each
time (Figure 28). This occurred despite attempting to align the sets in different orders, or using
different anatomical features as a reference for setting the alignment pins. Because of the
problem with the translucency, a complete model of the scapula was unable to be obtained.
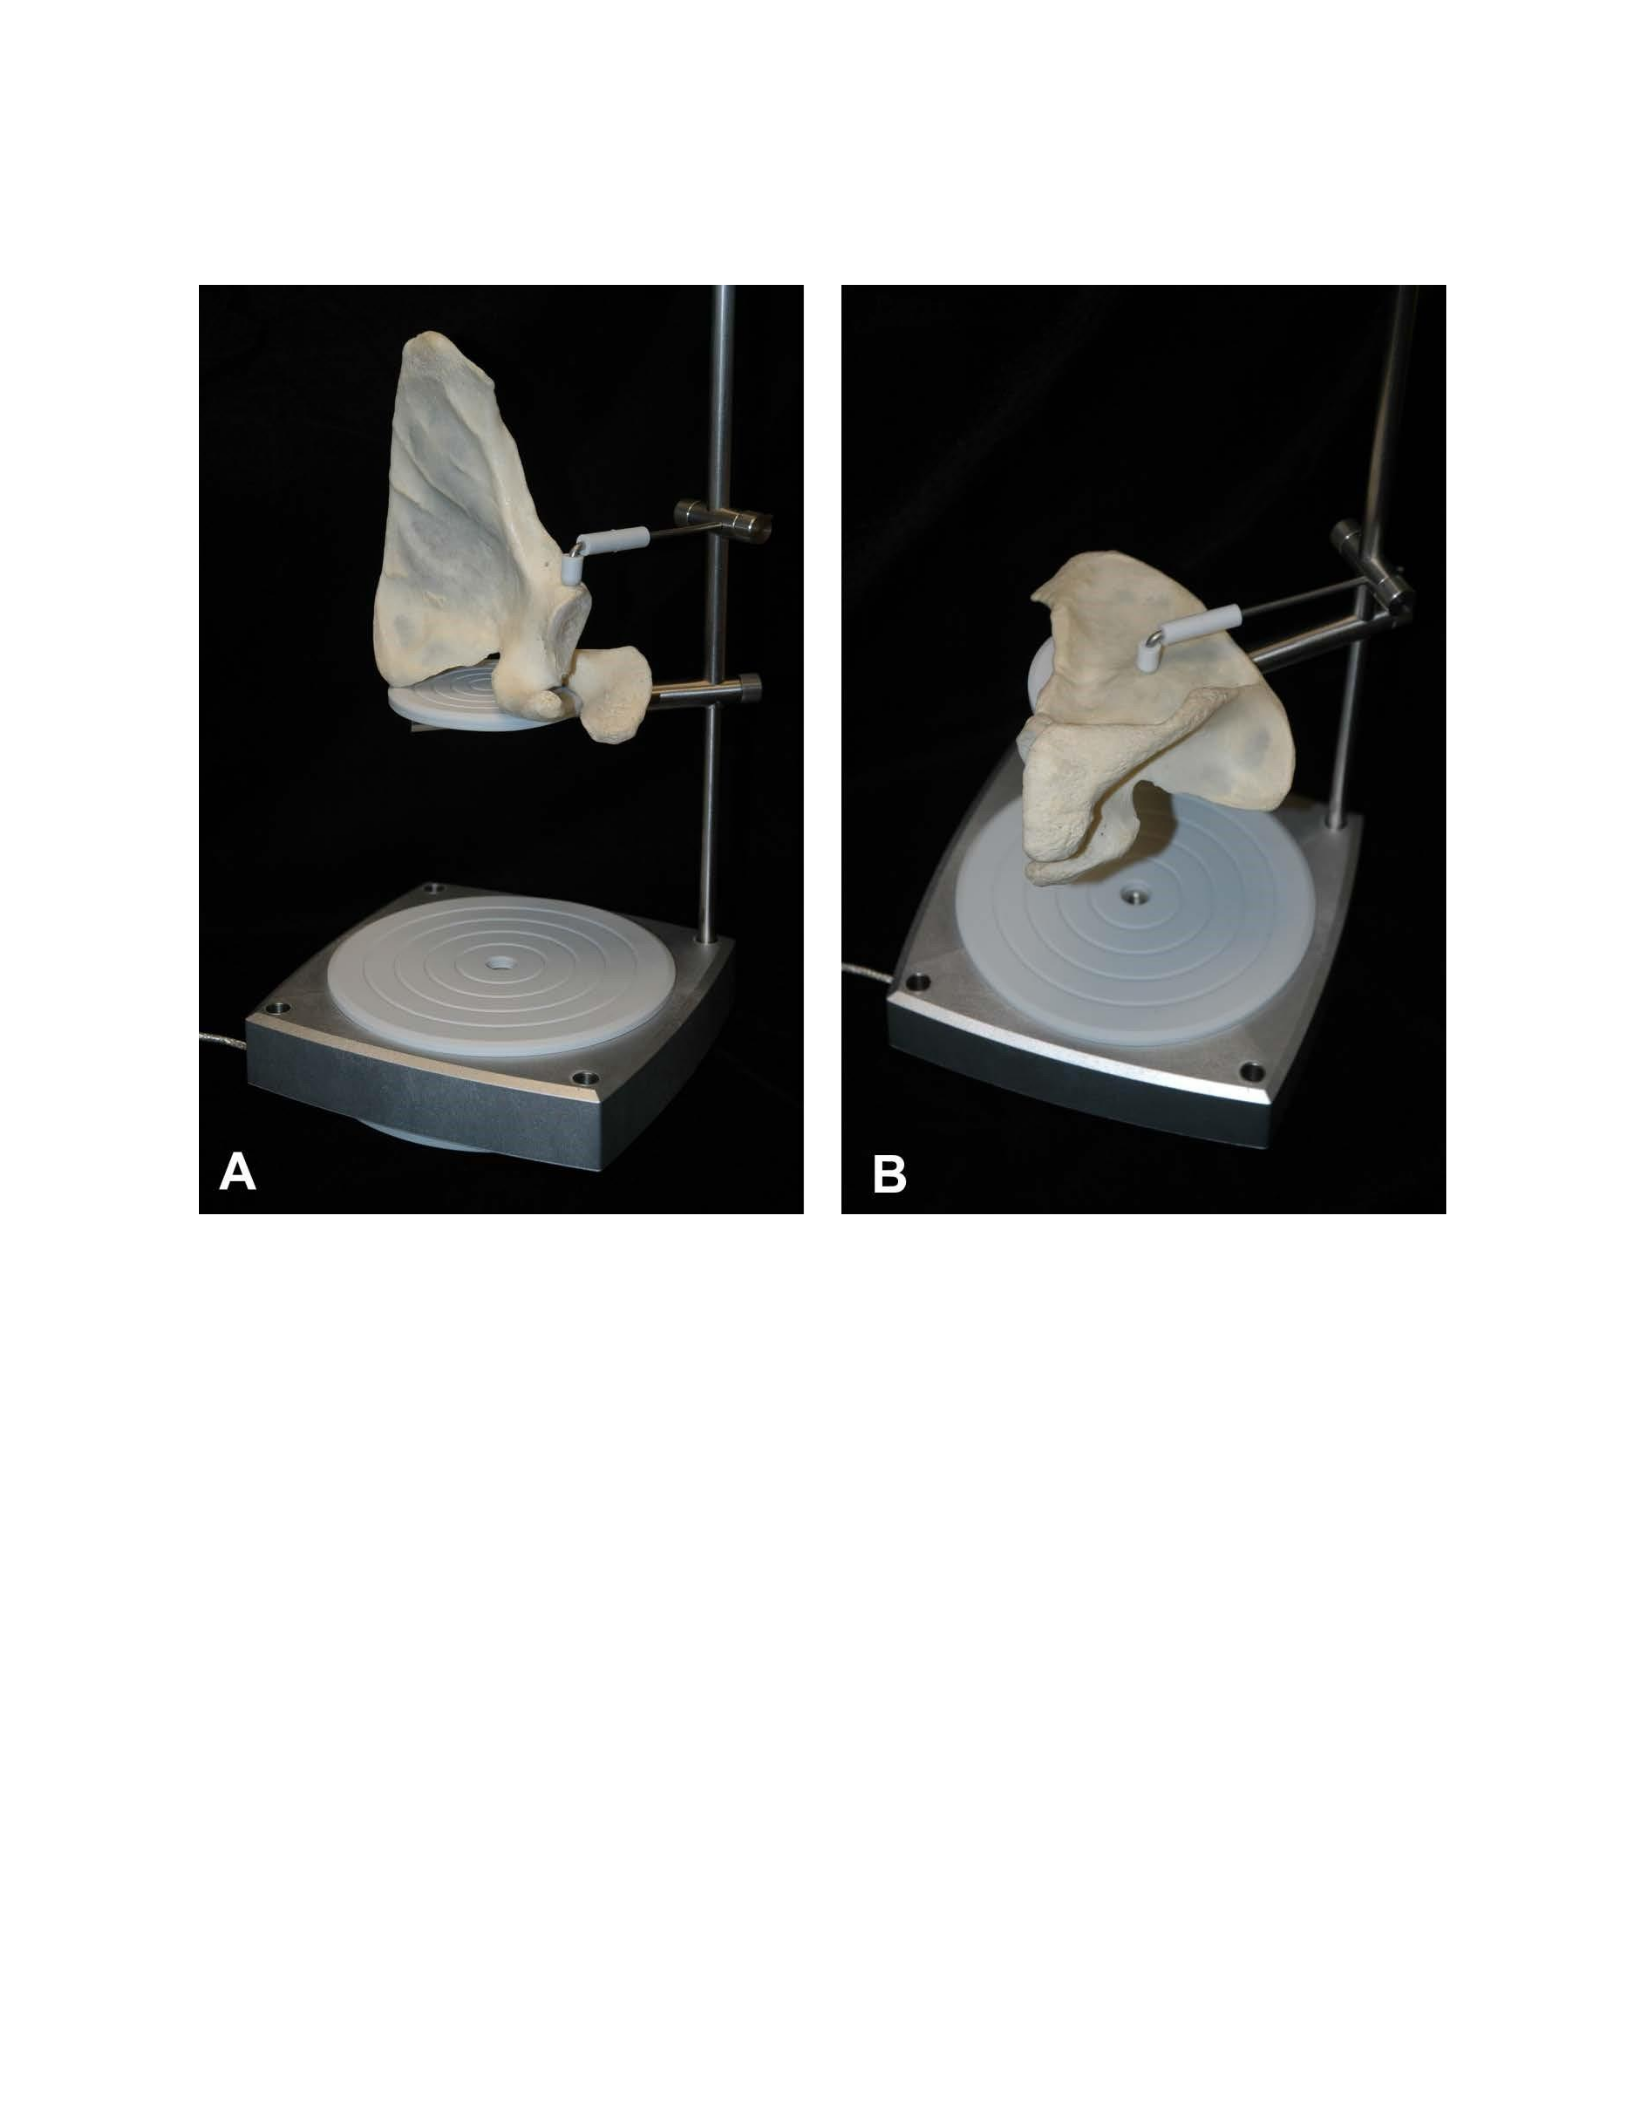
Figure 22: For the initial 360° scan set the scapula was placed with the long-axis oriented vertically with the
superior aspect placed on the base of the part-gripper (A). The supporting prong was placed against the infraglenoid
tubercle to prevent the bone from moving during the rotation of the turntable. An additional 360° scan was collected
with the scapula placed flat on the base (B) in order to scan the anatomical borders of the bone.
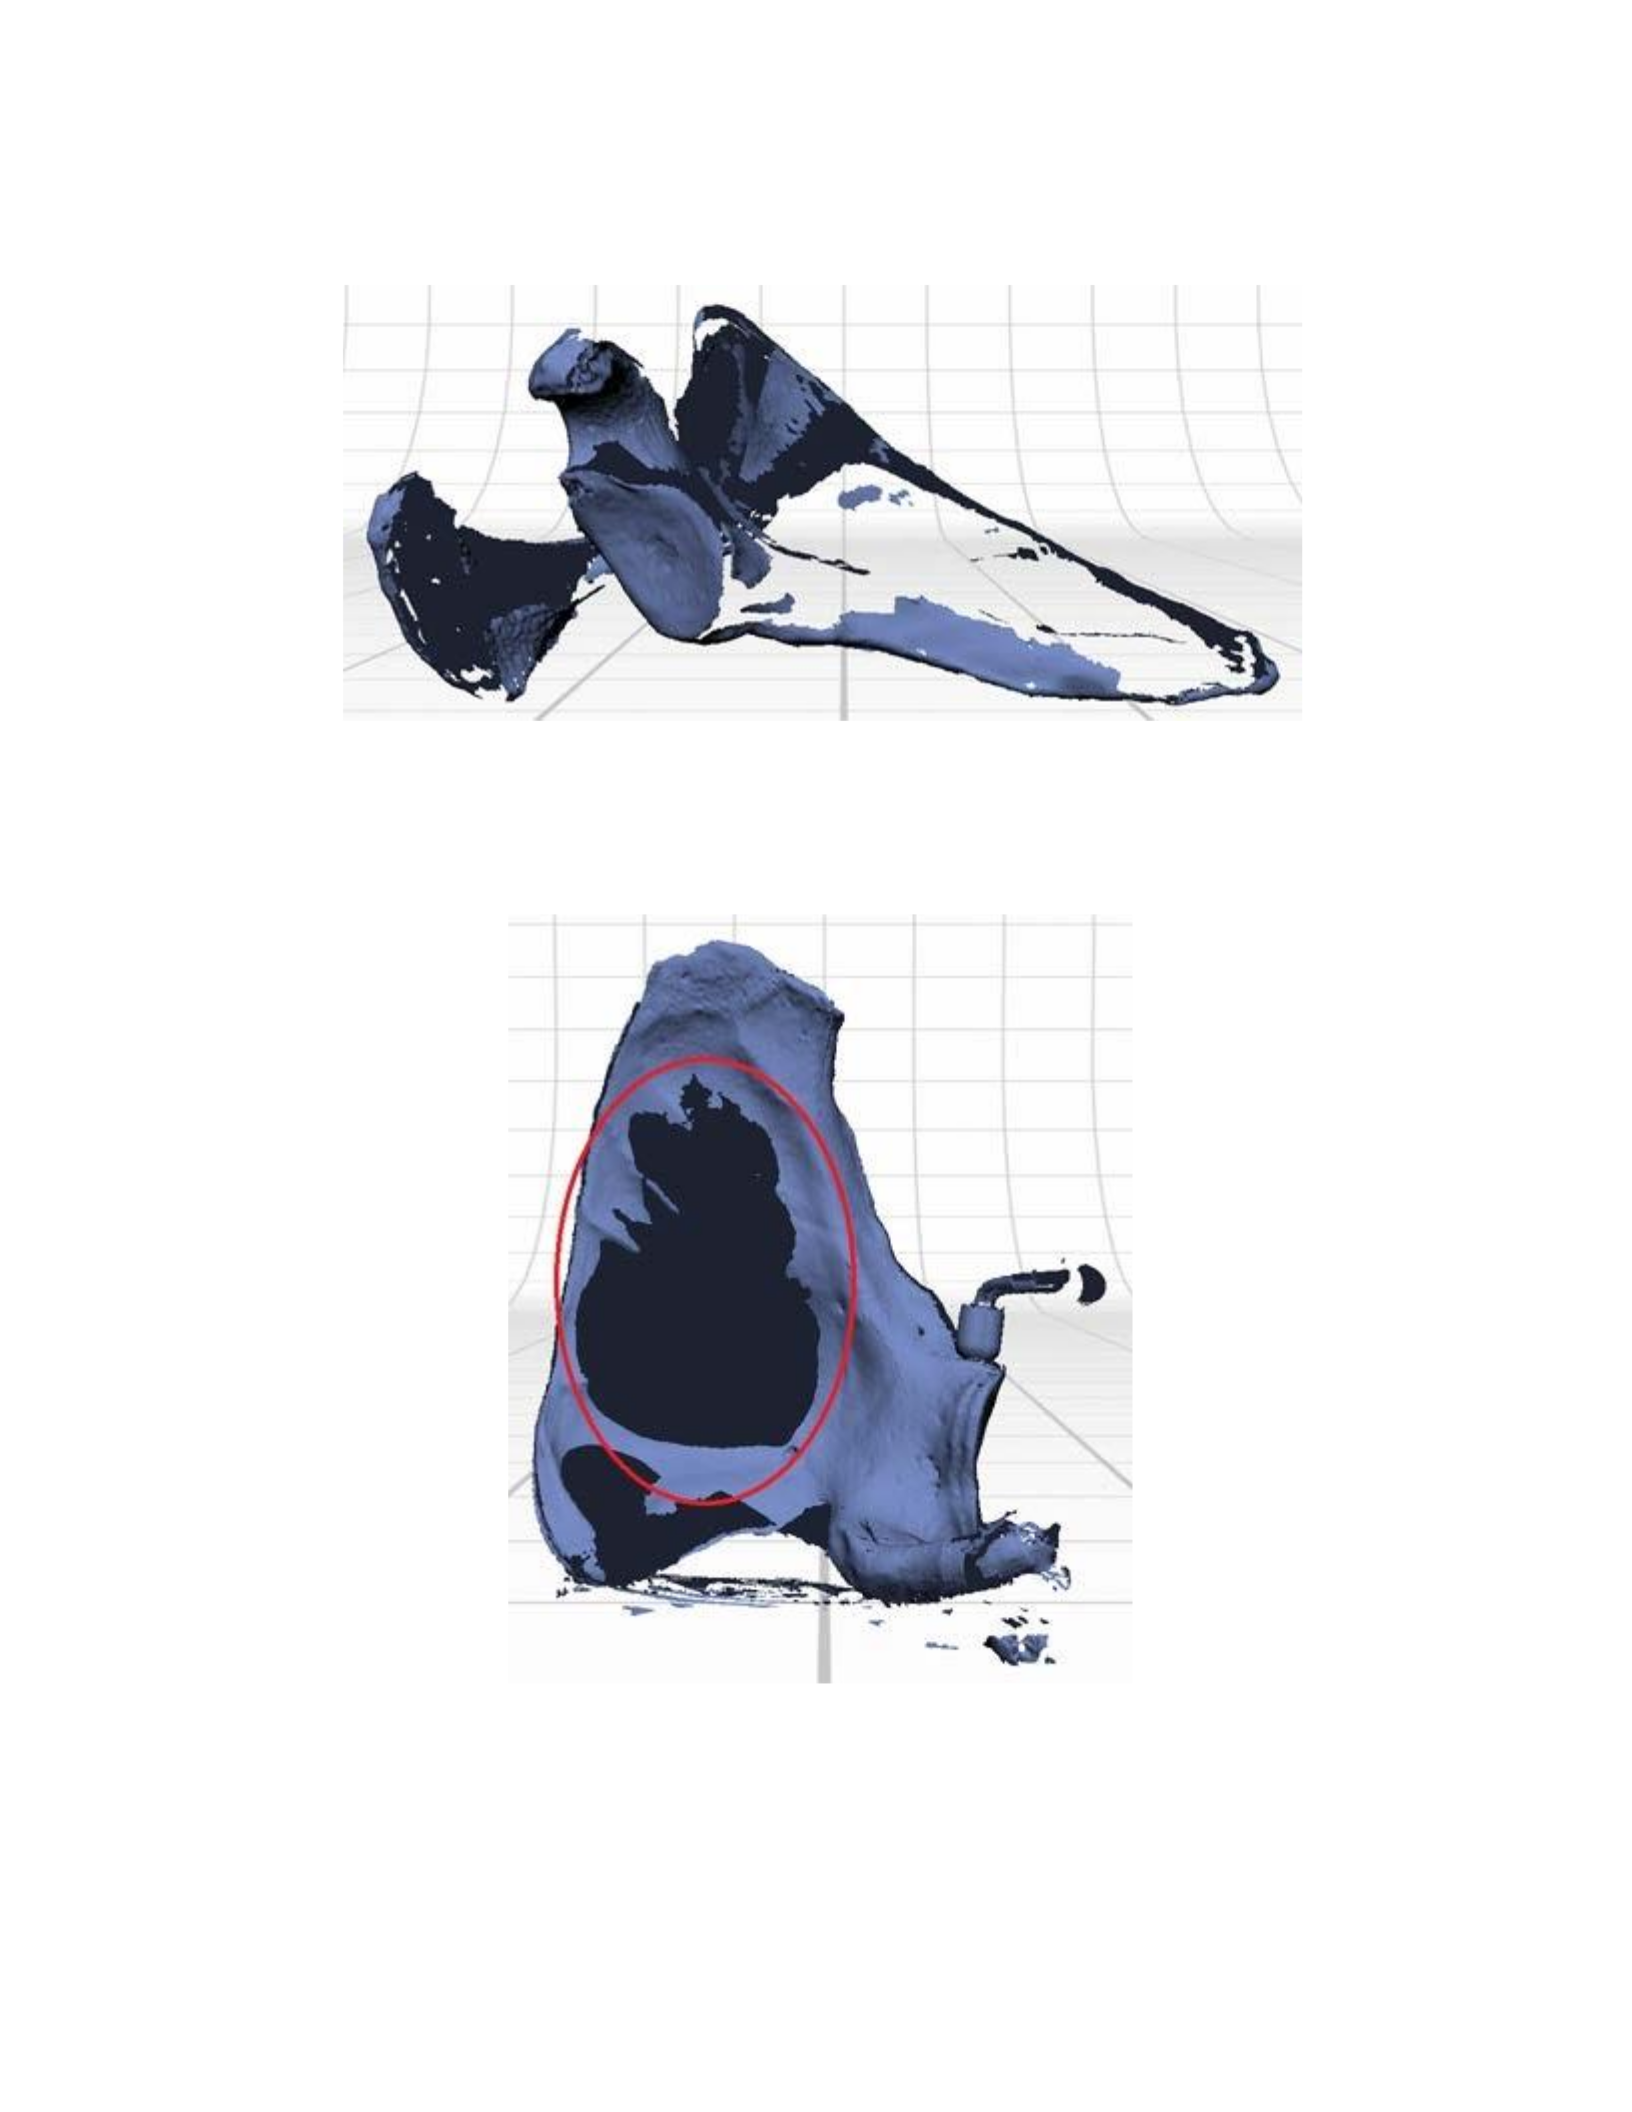
Figure 23: A 360° scan set with the scapula placed horizontally on the part-gripper base was completed in order to
acquire the surfaces of the anatomical borders.
Figure 24: The 360° scan set with the scapula oriented vertically on the part-gripper base presented a problem. The
thin surfaces of the subscapular and infraspinous fossae were penetrated by the lasers of the scanner. This caused the
scanned surfaces to intersect, creating the dark-blue inverted surface normals in the section outlined by the red
ellipse.
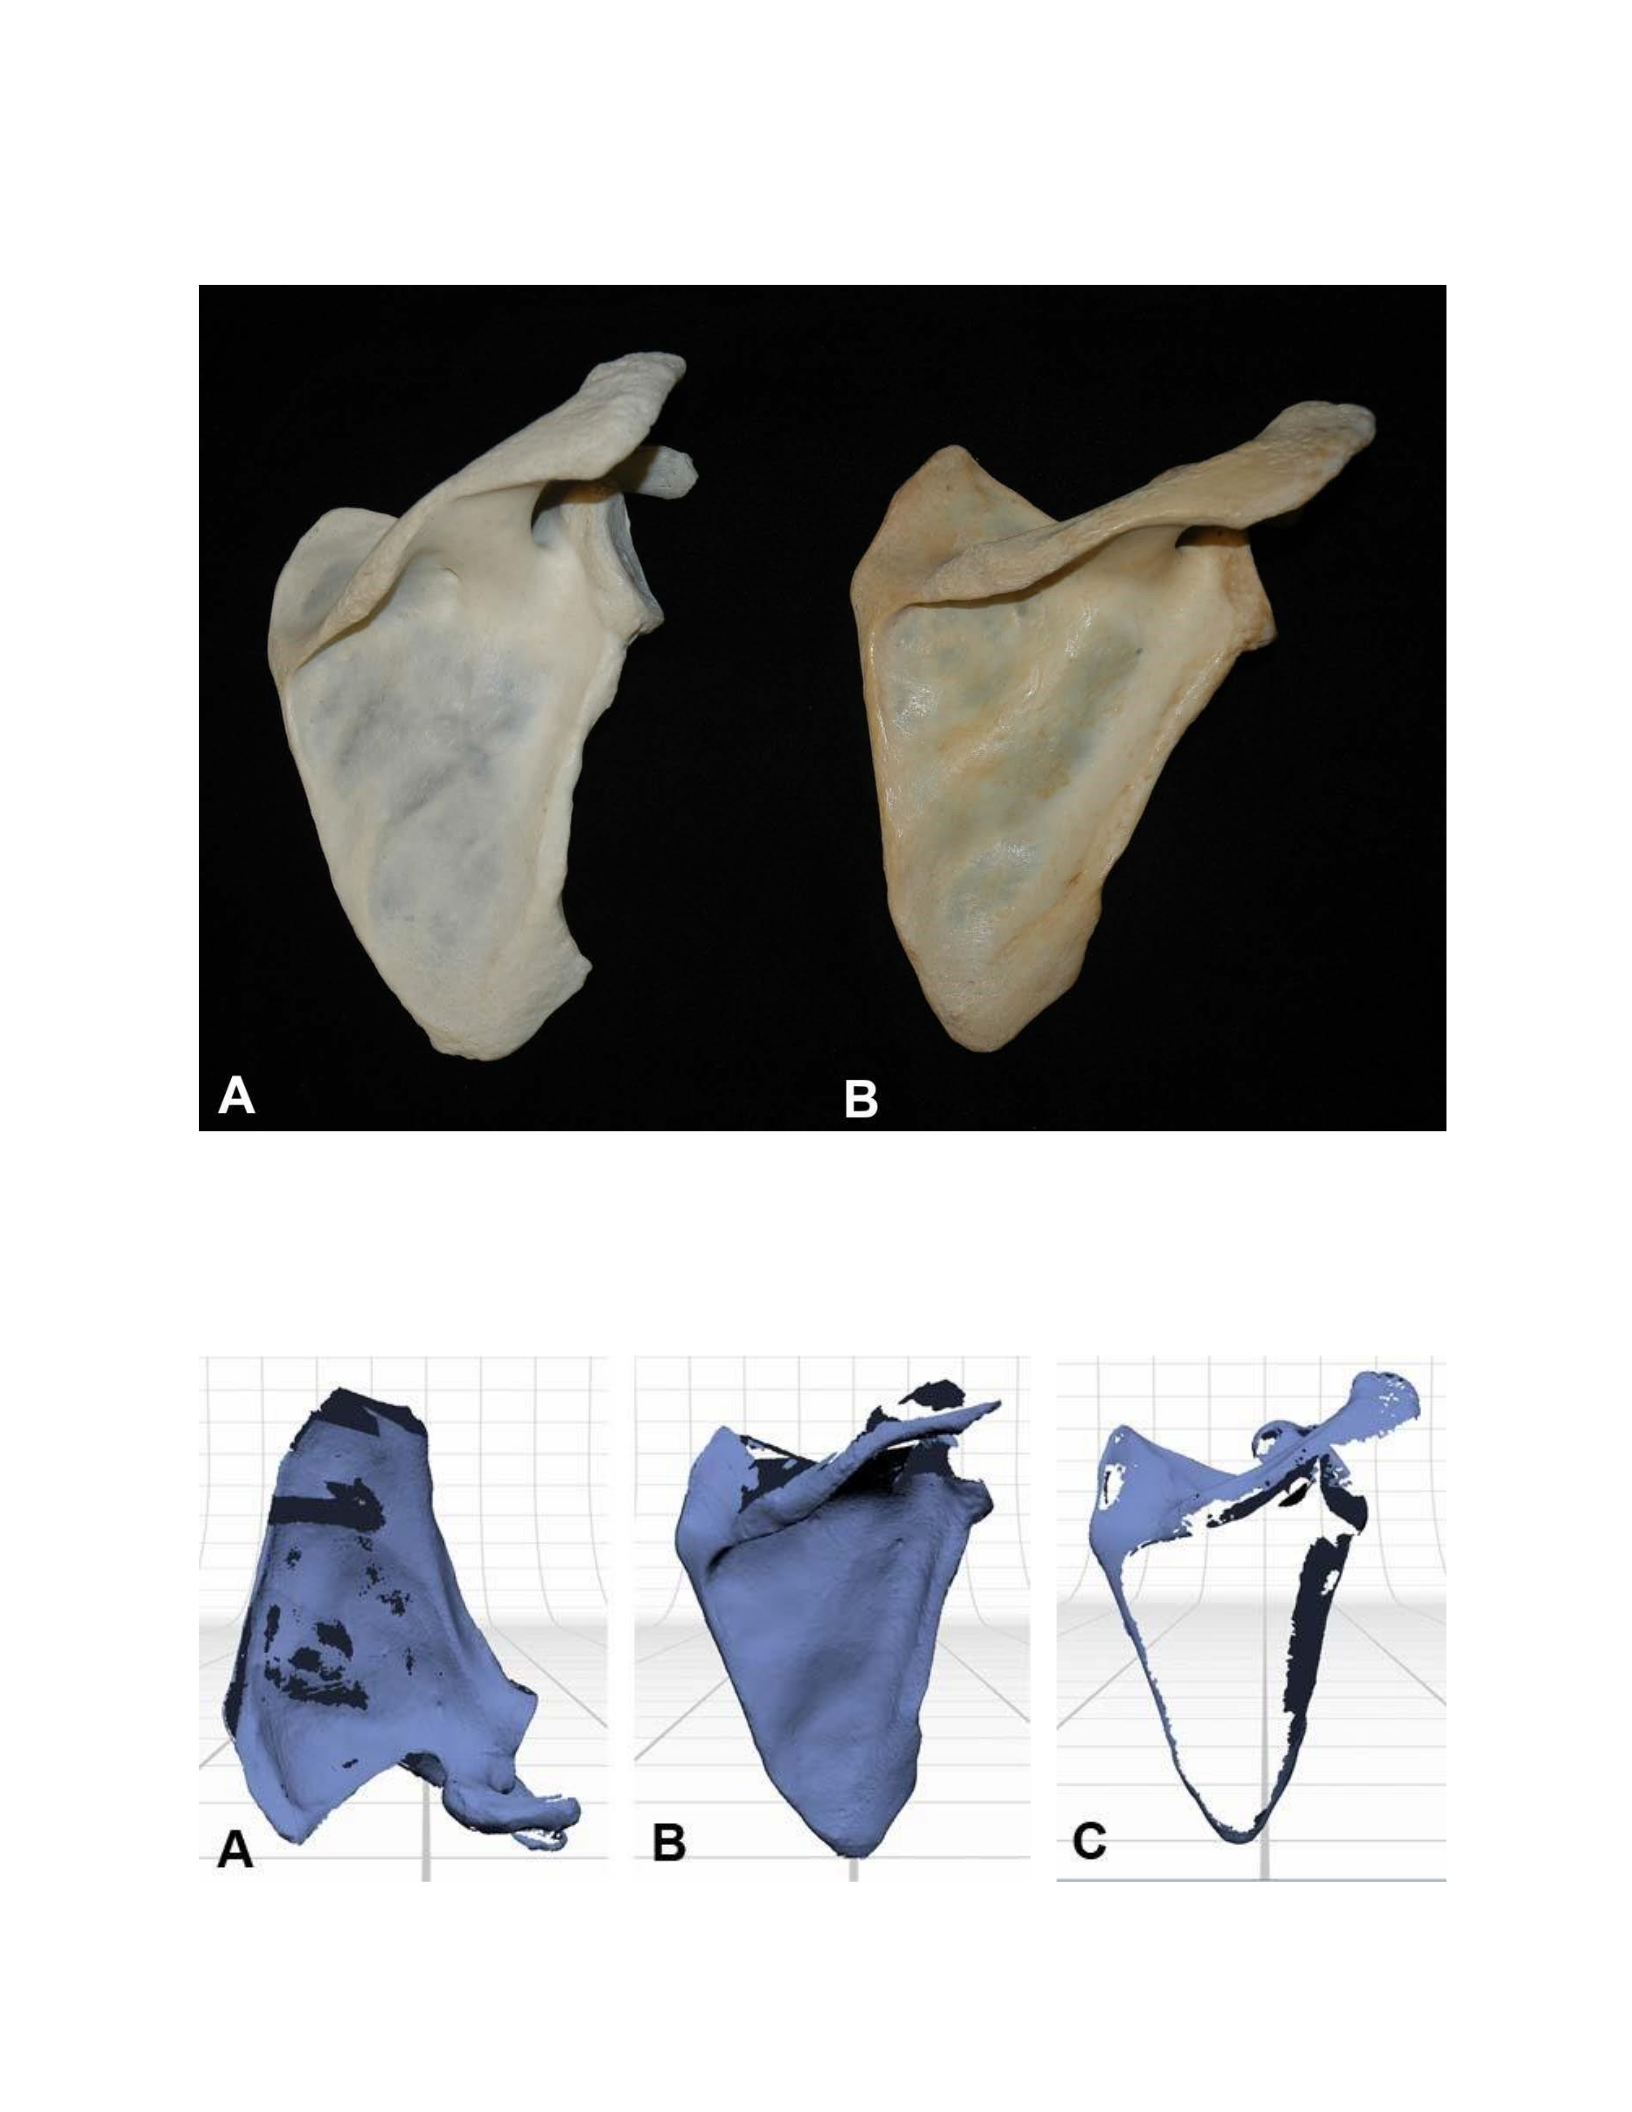
Figure 25: A side by side comparison of the first (A) and second (B) scapulae that were scanned. The fossae of the
second scapula appear to be slightly thicker and the bone is also of a darker color.
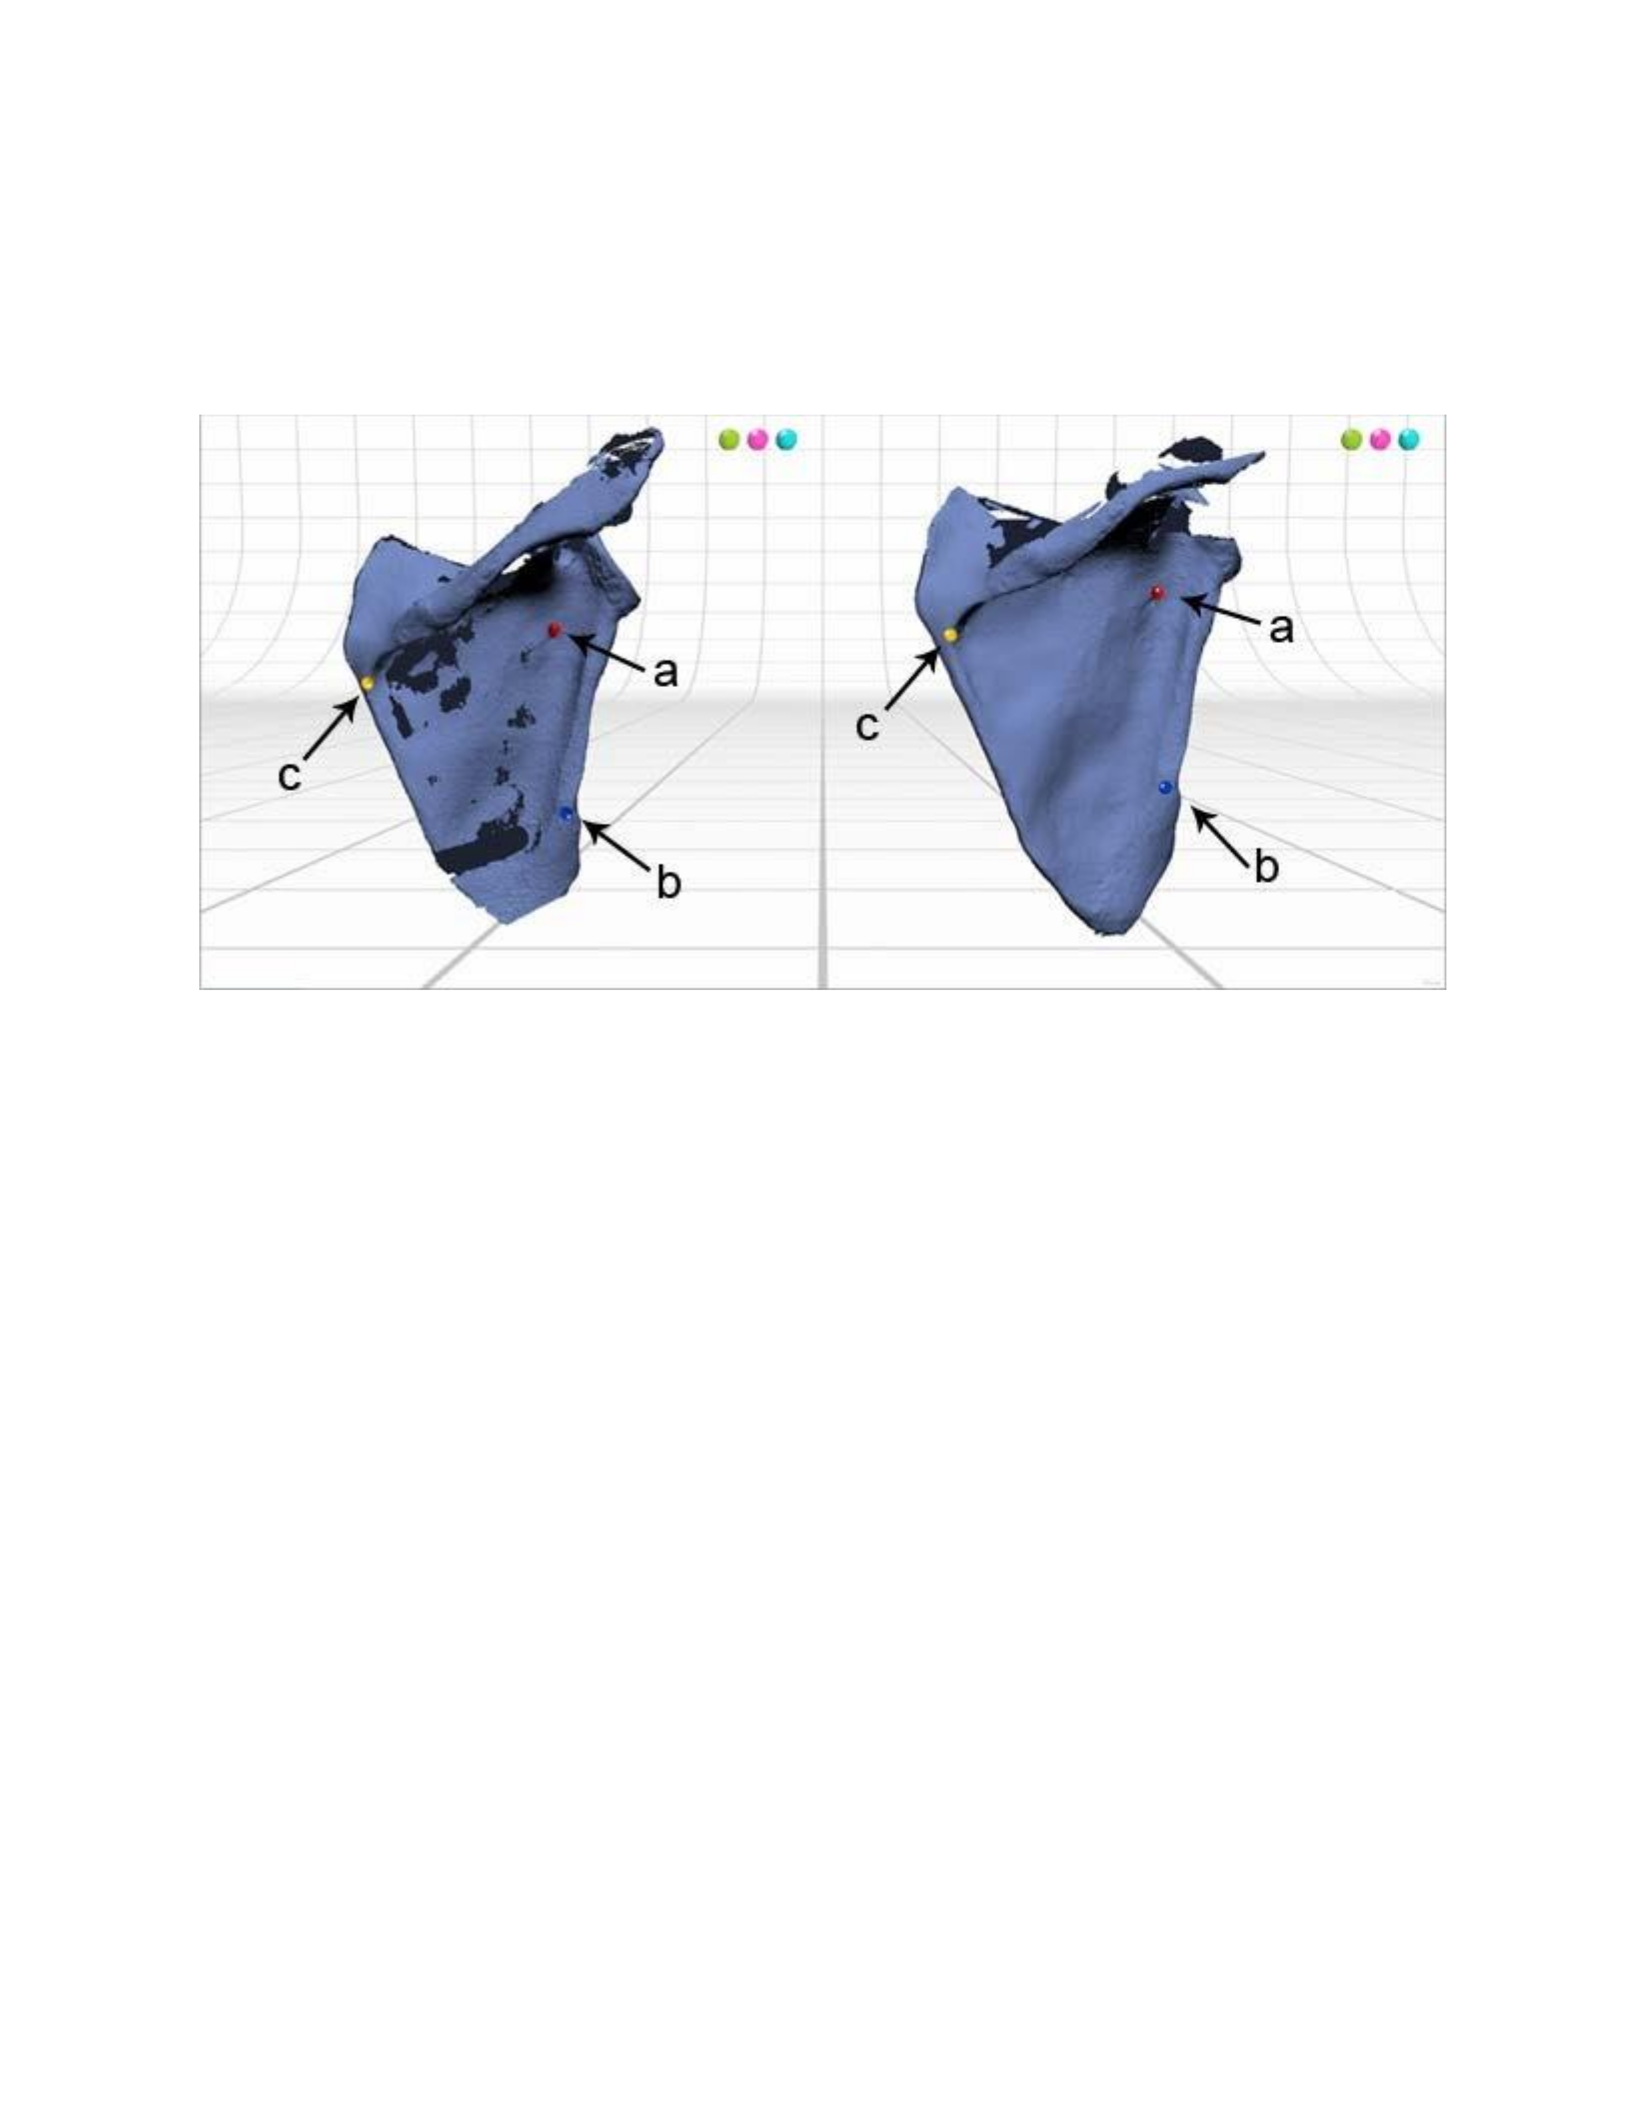
Figure 26: The second scapula was scanned using the same protocols as the first. The first 360° scan set (A)
exhibited similar intersections to the first scapula, whereas the second (B) and third (C) 360° scan sets did not.
Figure 27: Analogous regions of the scapula (a, b & c) were chosen between the scans for the placement of the
alignment pins.
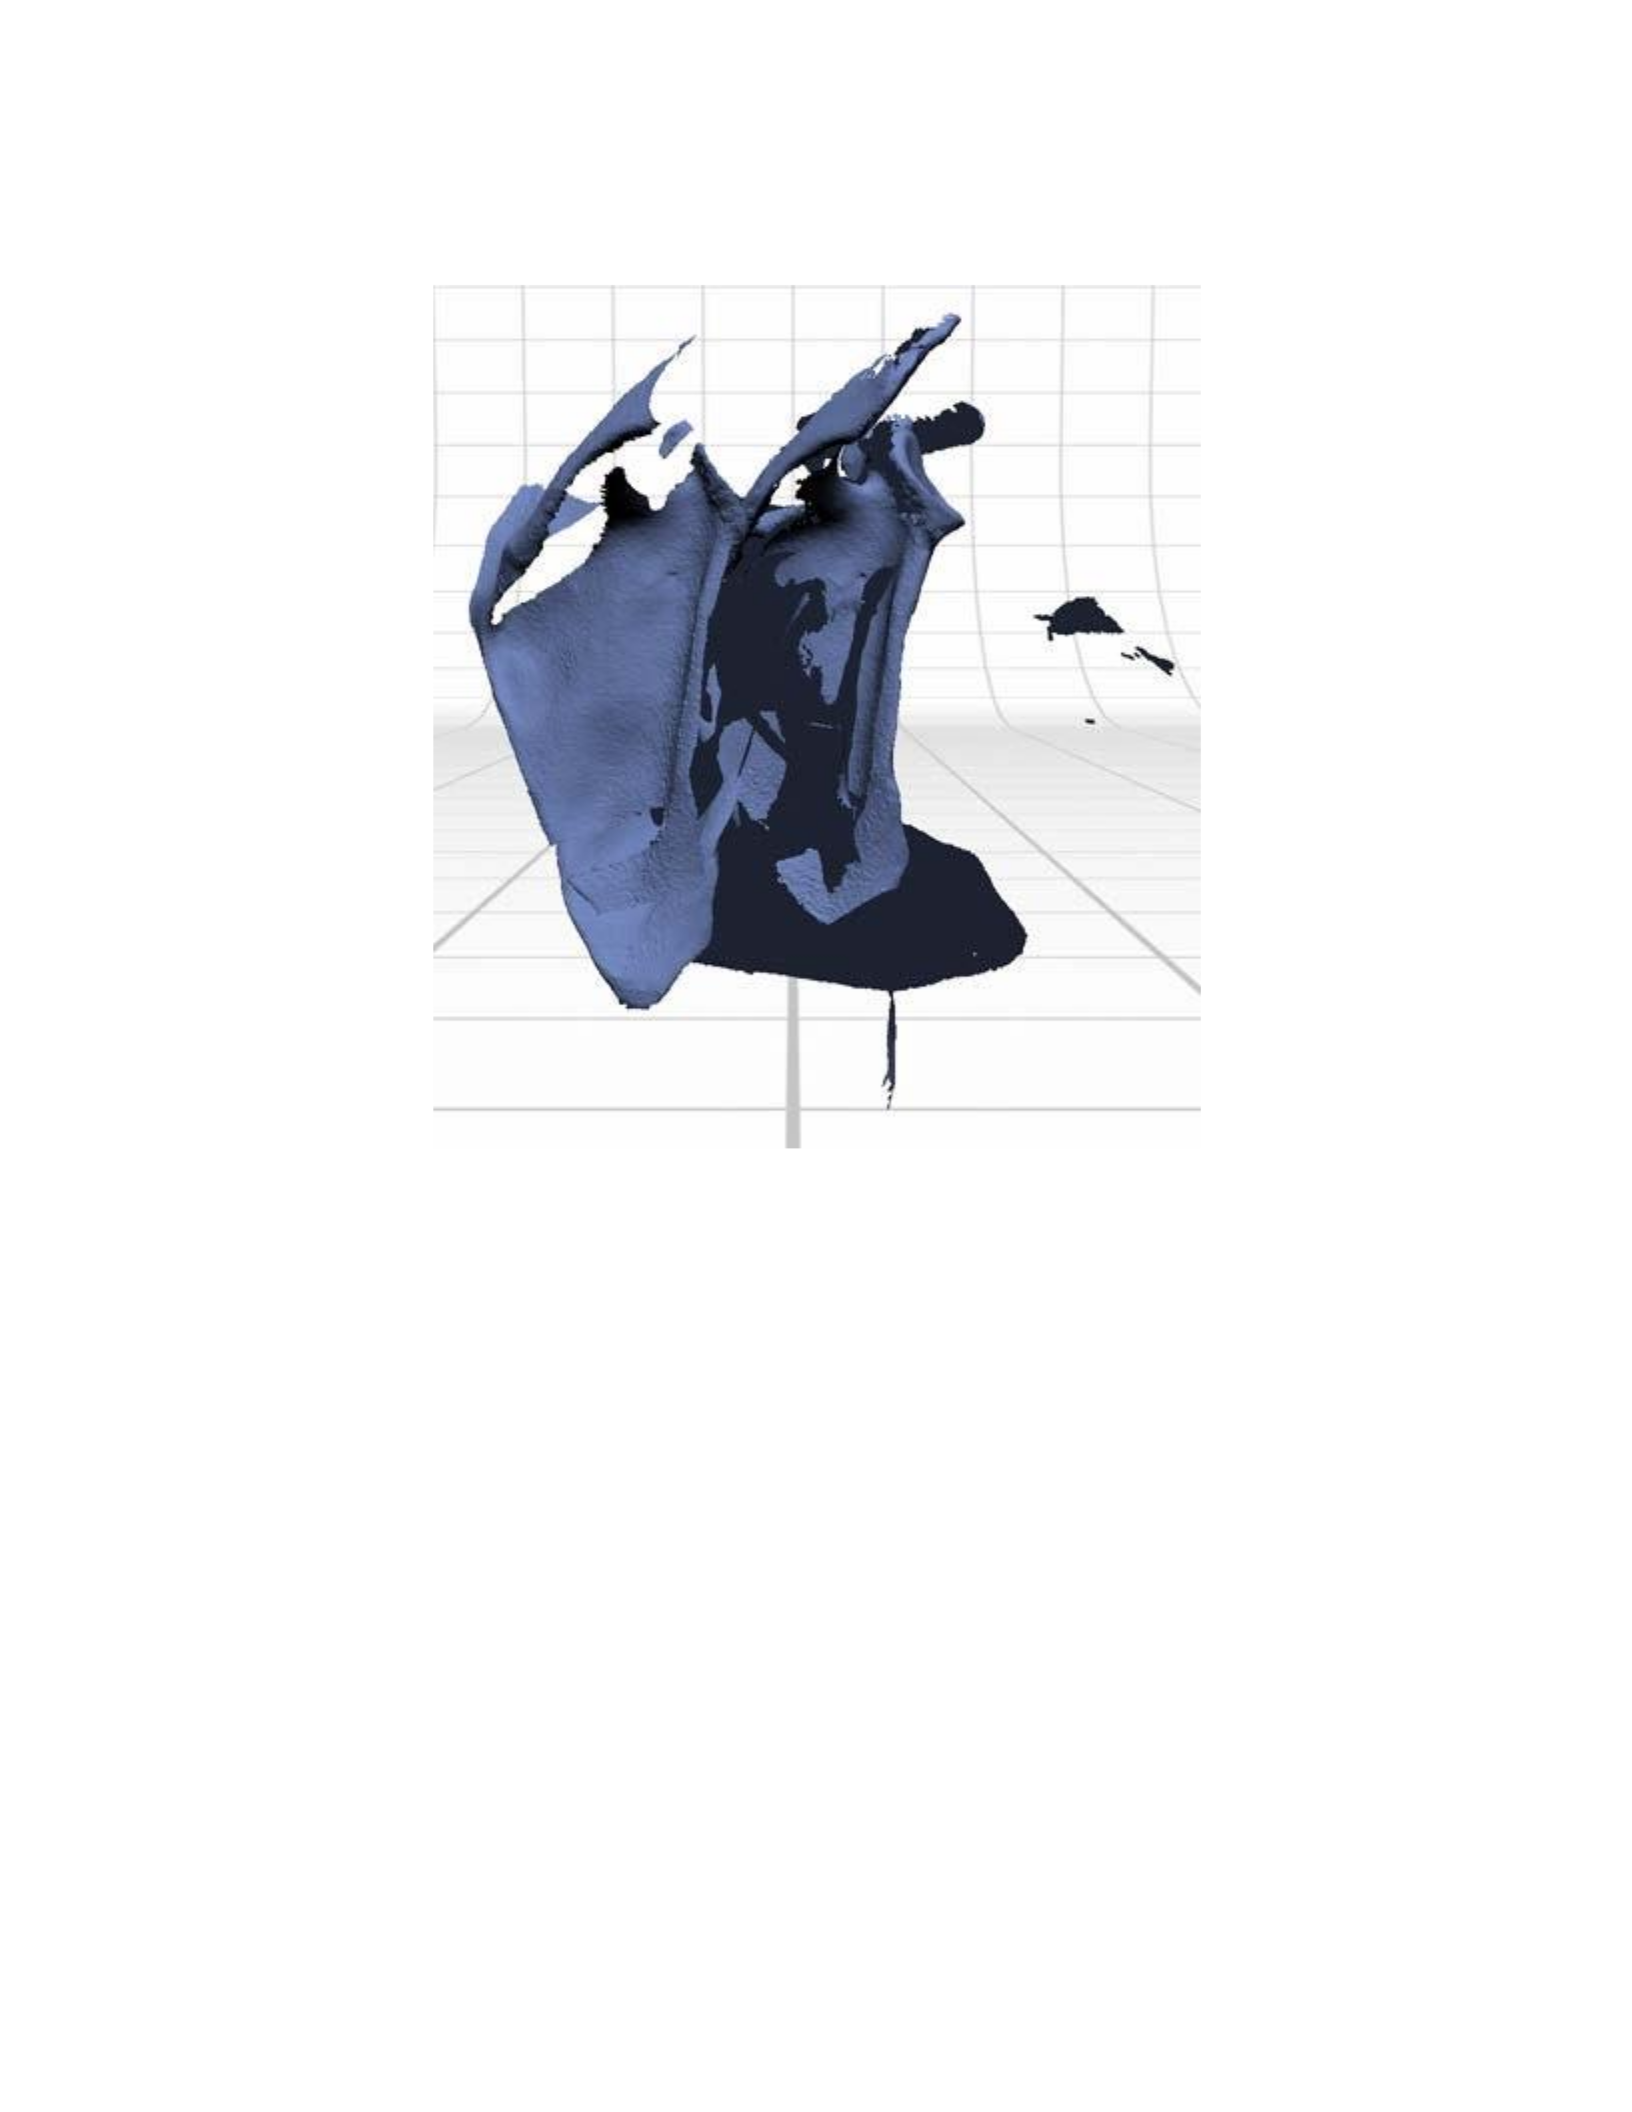
Figure 28: Despite several attempts at aligning the scan sets of the scapula by using different regions as a reference
for the alignment pins, the alignment process consistently resulted in errors.
Clavicle
The first 360° scan set was performed with the sternal end of the clavicle placed on the
part gripper base, and the supporting prongs of the part-gripper positioned in order to pinch the
acromial end and conoid tubercle, supporting the top (Figure 29 A). The height of the base was
oriented in order to scan as much surface area as possible, but the full length of the clavicle was
not obtainable in a single scan with the recommended distance of 6.5” for the Macro settings
(Figure 30 A). The base was lowered in order to scan the acromial end of the clavicle in a
separate 360° scan set (Figure 30 B). The vertical scans captured much of the surfaces, but did
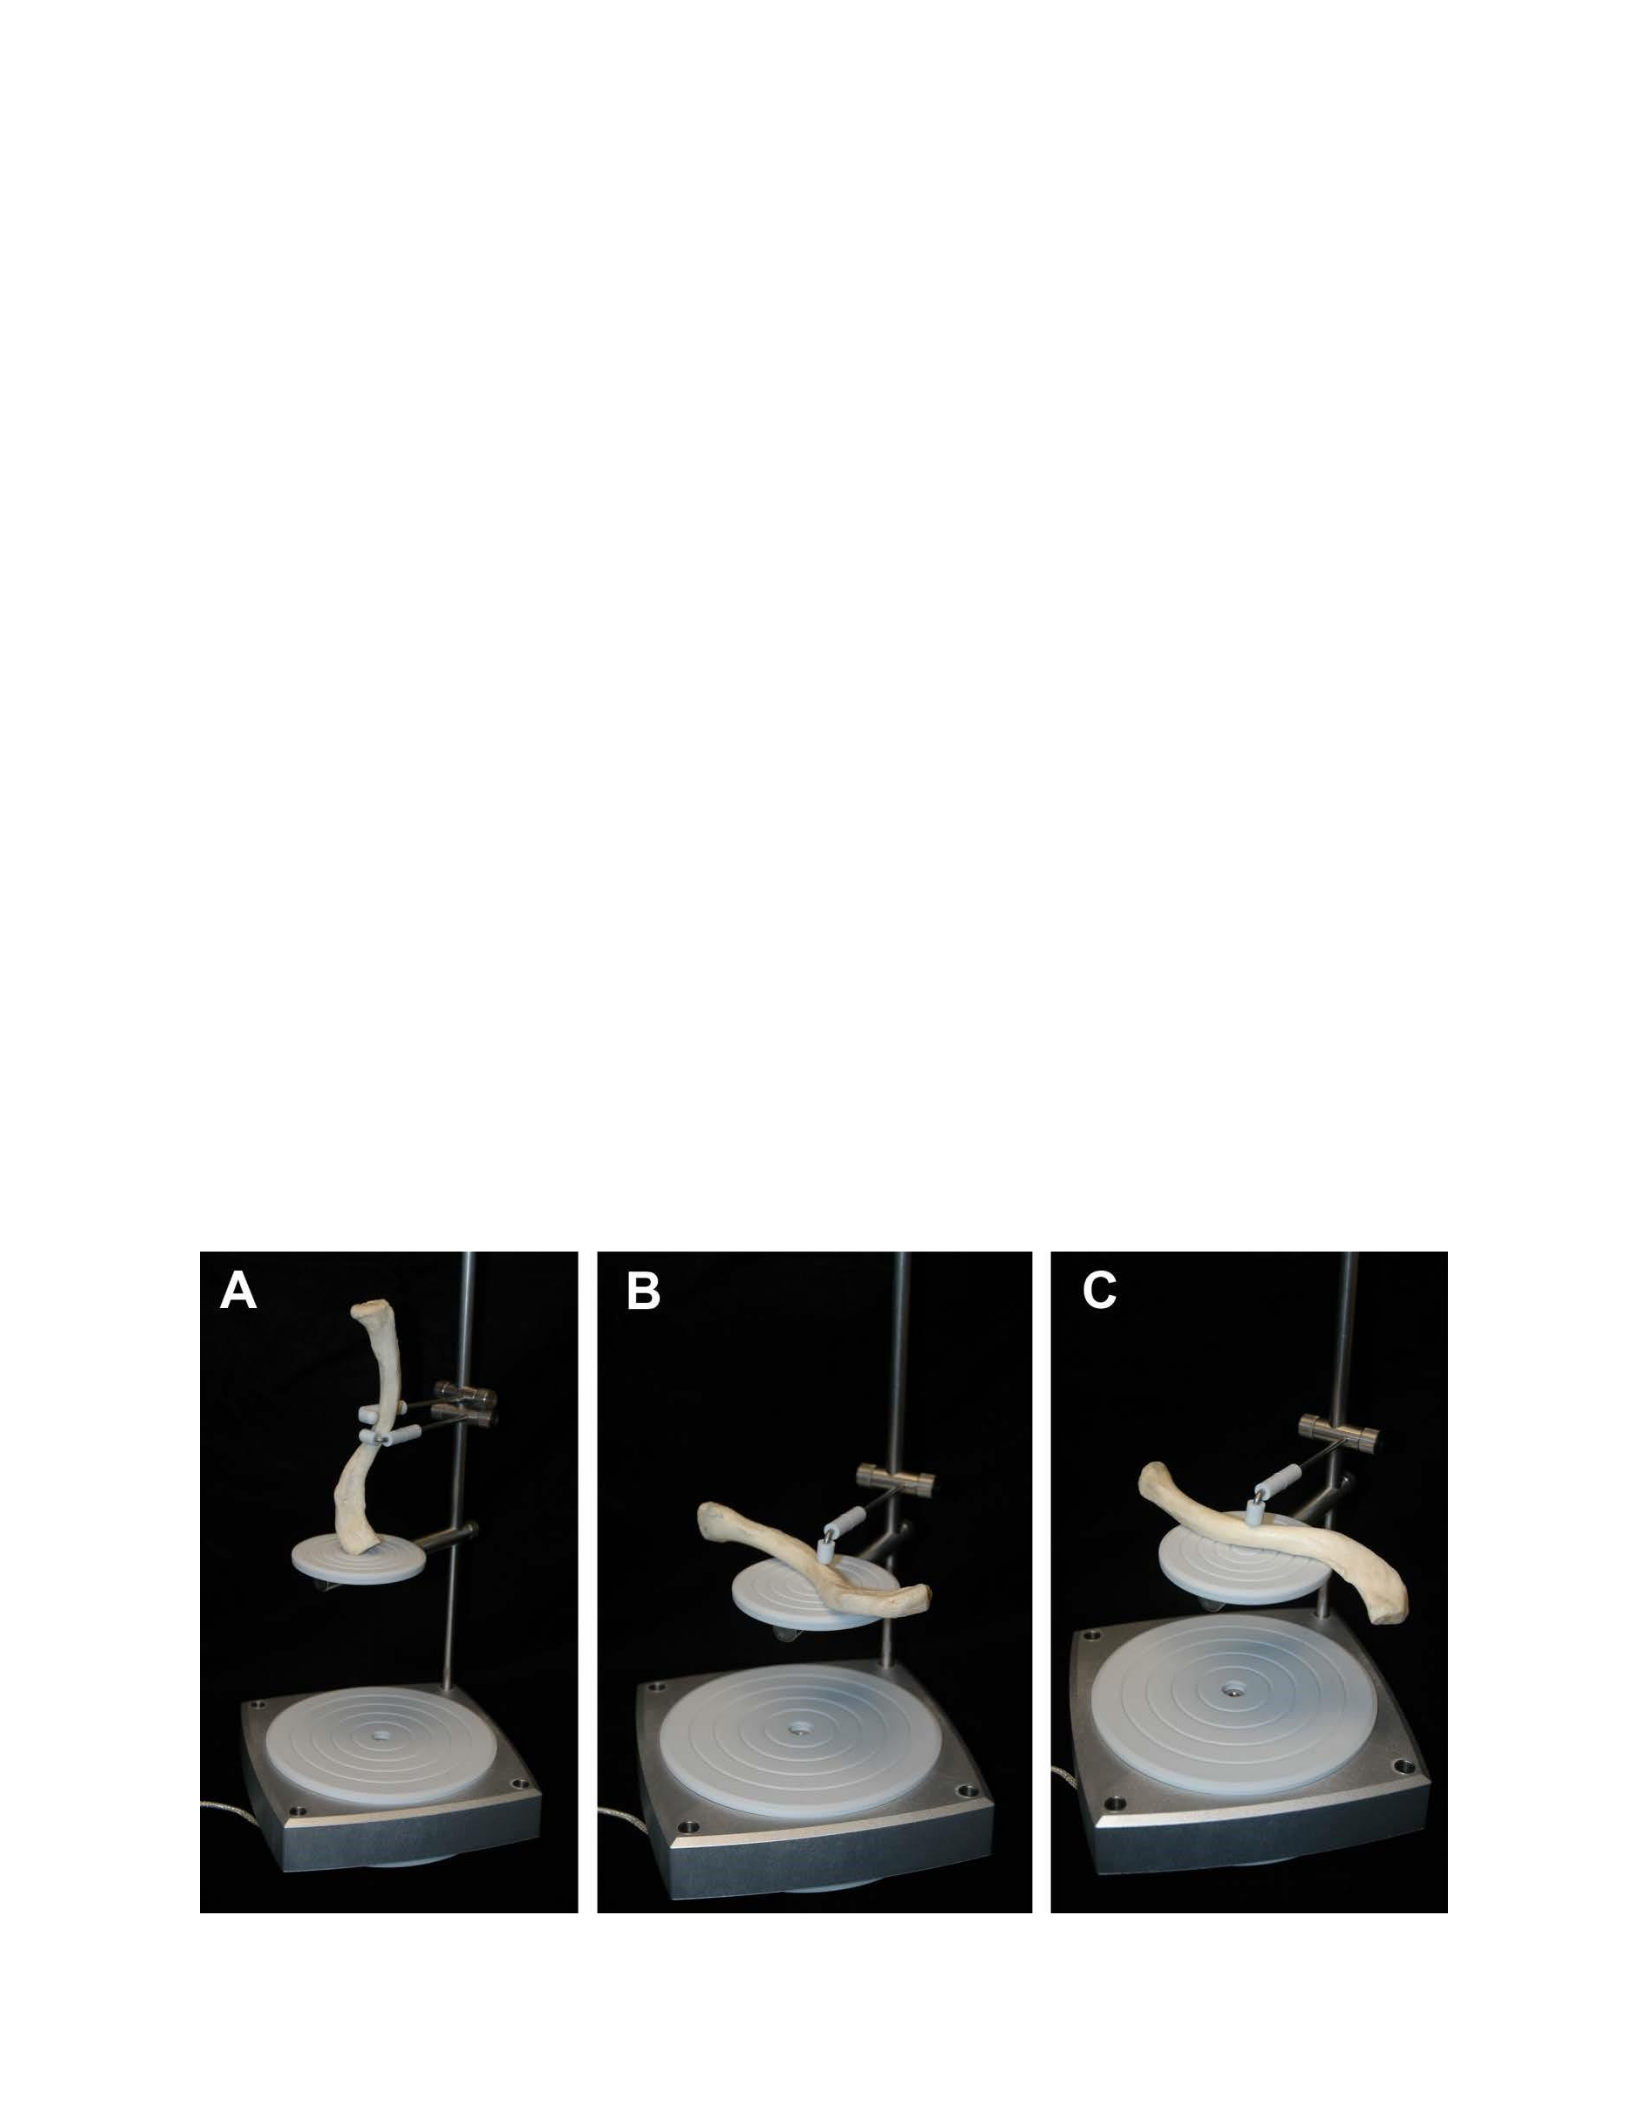
not acquire the sternal and acromial ends (Figure 31 A&B). A few single scans were attempted in
order to capture the missing data, but did not supply enough features to permit an accurate
alignment with the initial 360° scan sets. Further 360° scan sets were collected in order to obtain
sufficient anatomical features for ease of alignment. This was done by placing the clavicle flat,
with the long-axis parallel with the part gripper base, which resulted in the scans within Figure
32 (A &B). One scan was performed with the superior surface of the clavicle placed flat on the
part-gripper base (Figure 29 B). Another scan set was created with the inferior surface of the
clavicle placed flat on the part-gripper base (Figure 29 C). The scan sets were then aligned by
referencing the anatomy: the muscle attachment of the deltoid on the anterolateral surface (Figure
33 A), the conoid tubercle (Figure 33 B), and a nutrient foramen that was located medial to the
trapezius muscle attachment (Figure 33 C). After aligning the scans together, they were then
fused (Figure 34). The process of scanning the clavicle was straightforward and required minimal
alignment, presenting no exceptional challenges.
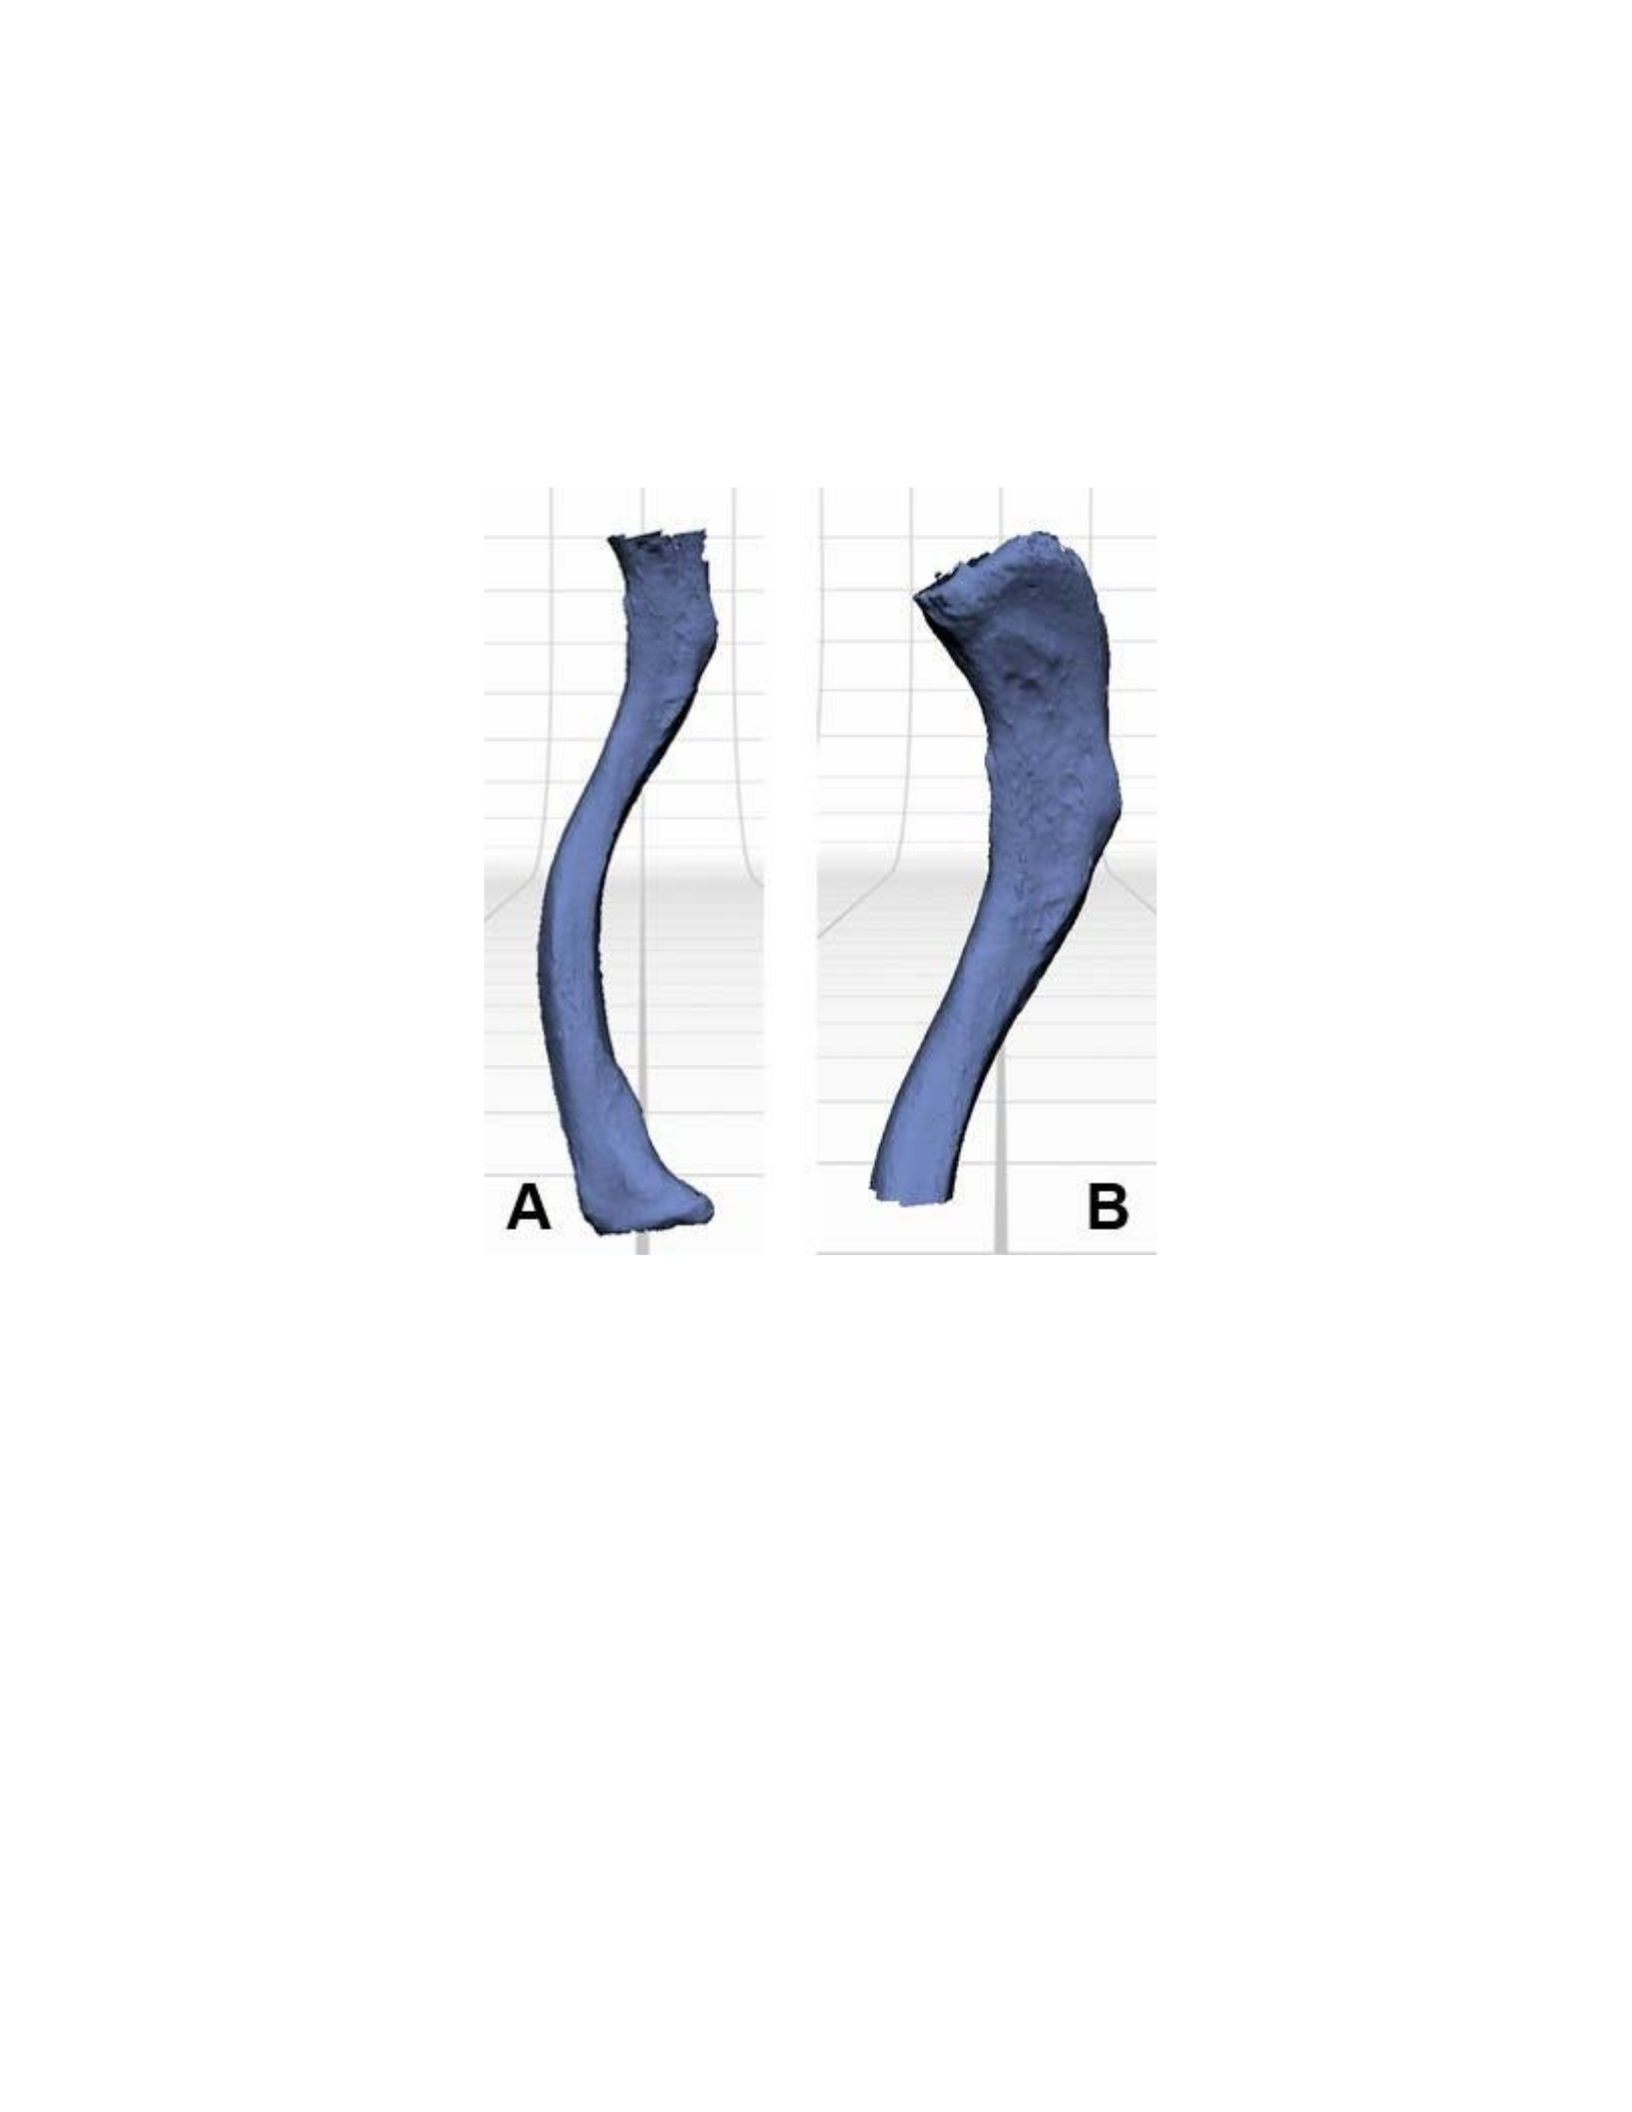
Figure 29:The surfaces of the clavicle were obtained through a series of three 360° scan sets: one with acromial end
place on the part-gripper base (A), and two more with the bone placed lengthwise, one with the inferior surface
upward (B) and another with the superior face upward (C).
Figure 30: Two 360° scan sets were acquired with the clavicle oriented vertically. The first (A) scan set acquired the
majority of the surfaces, except for the acromial end. The part gripper was then lowered so that the surfaces of the
acromial end of the clavicle (B) could be collected.
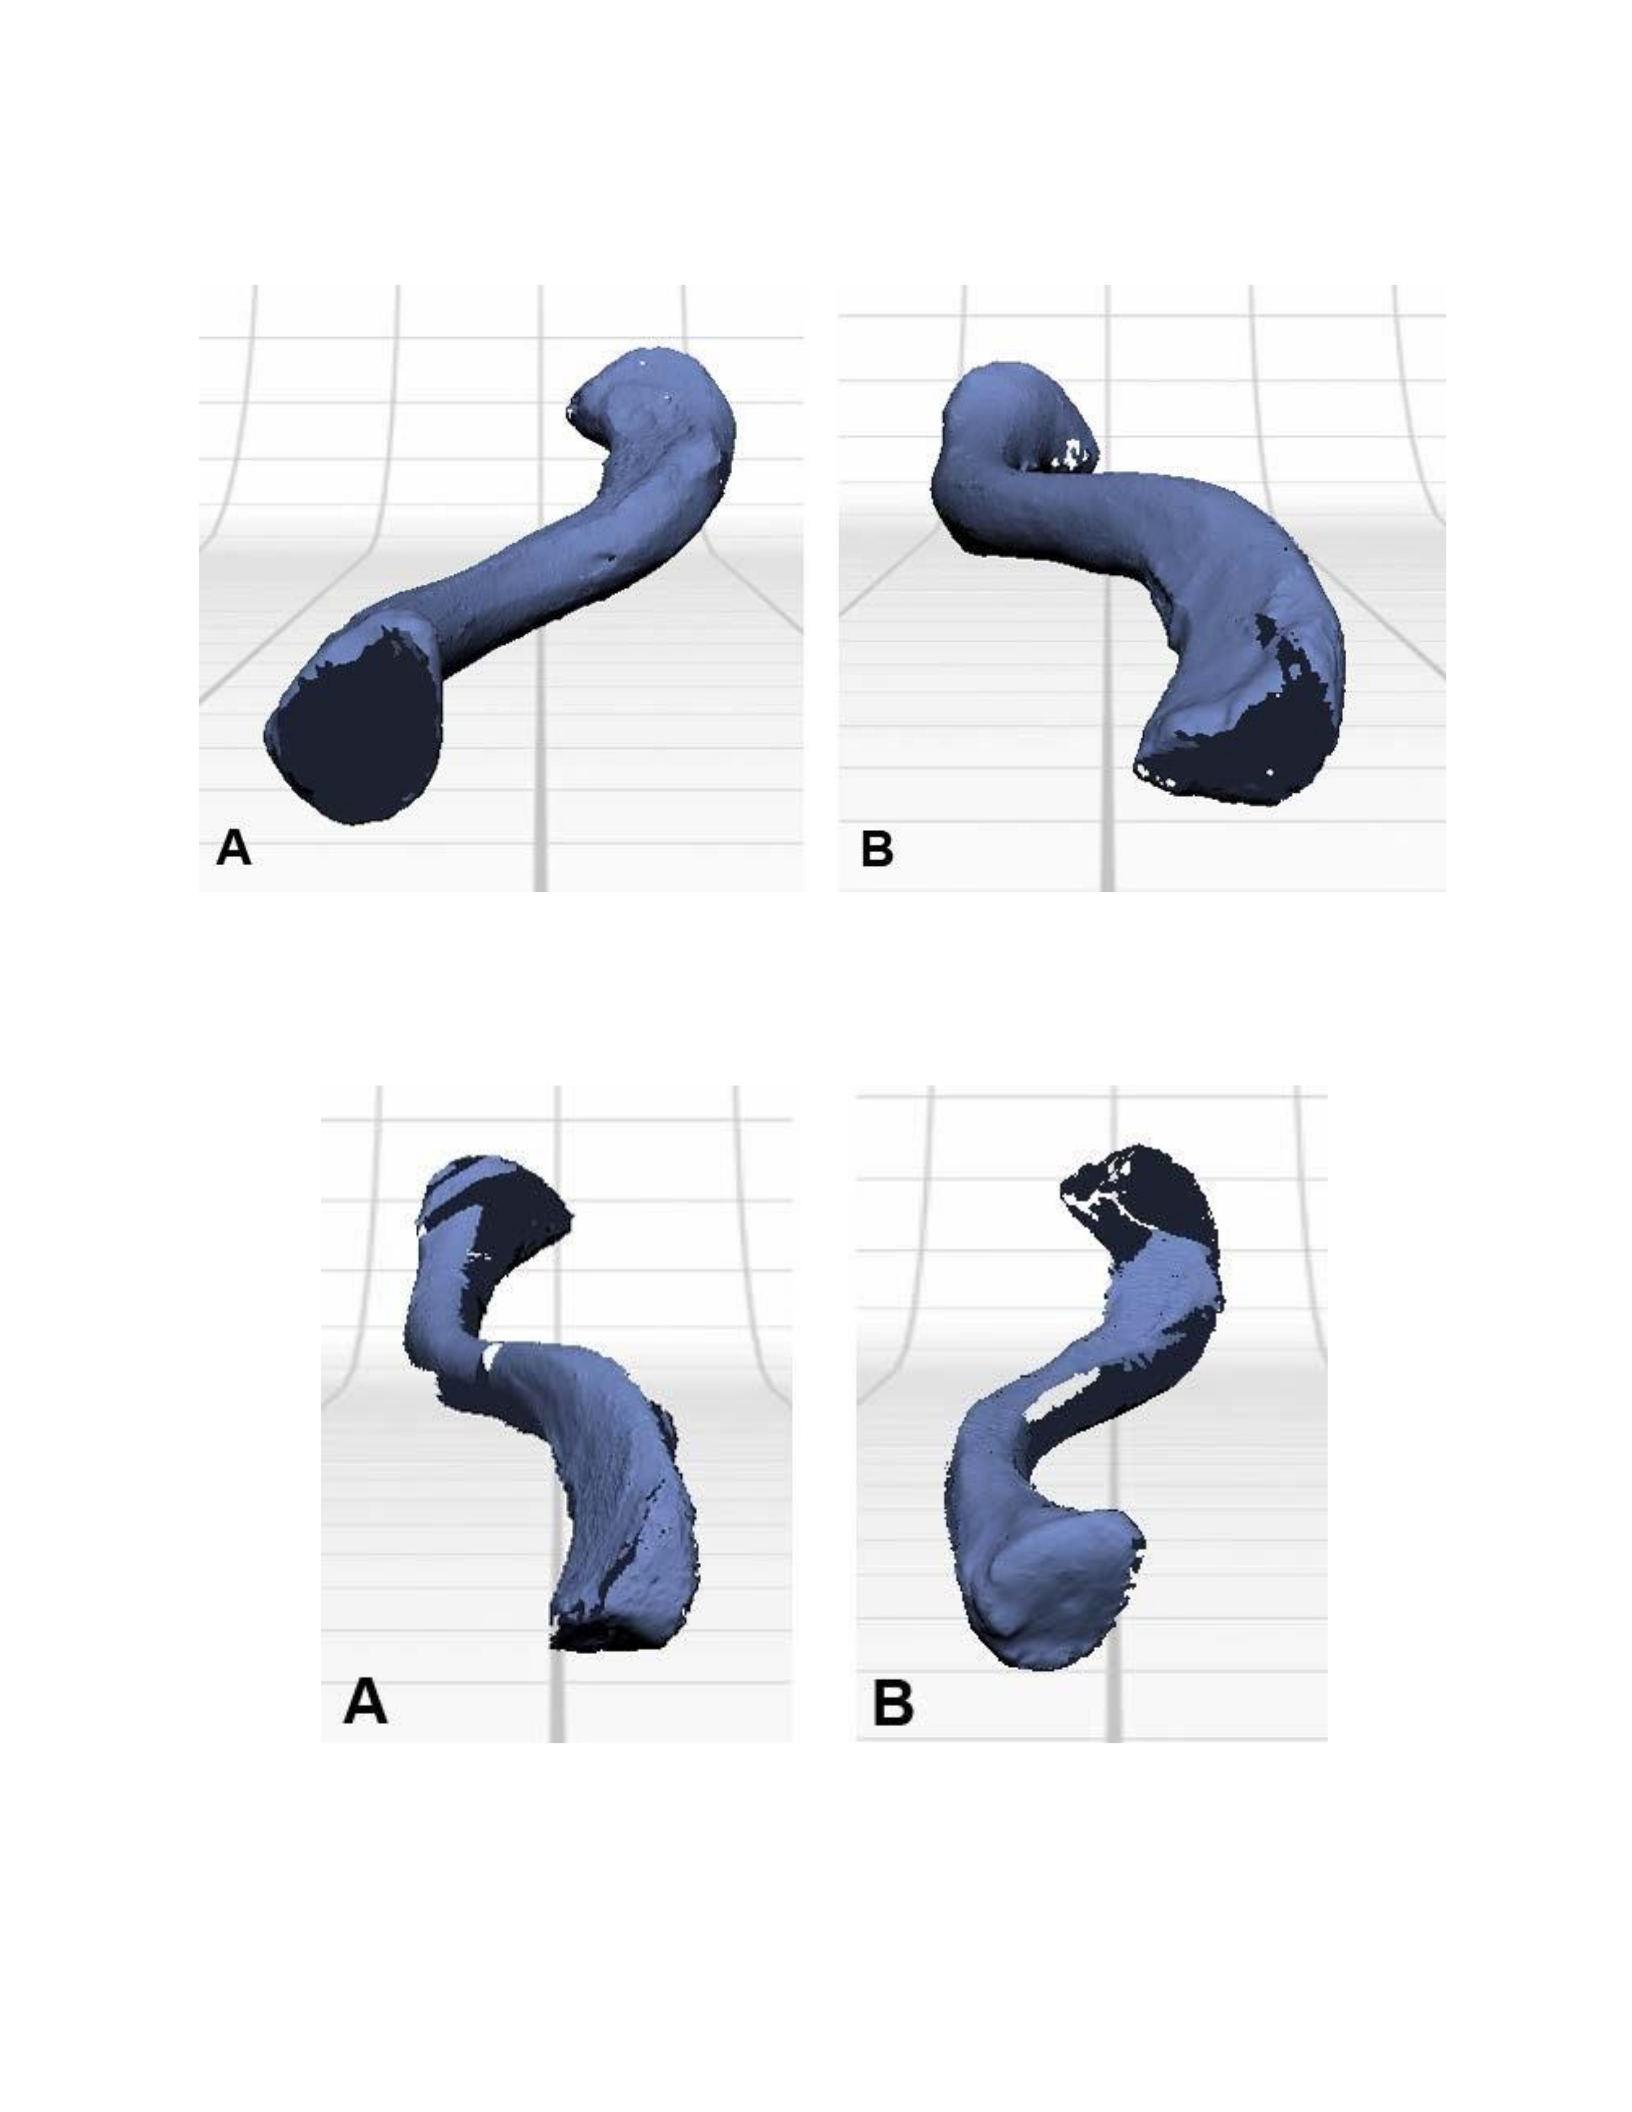
Figure 31: The surfaces of the sternal (A) and acromial (B) ends of the clavicle were missing from the 360° scan sets
where the bone was oriented in a vertical position.
Figure 32: The acromial (A) and sternal (B) ends were acquired by orienting the clavicle horizontally and placing it
flat on the part gripper base.
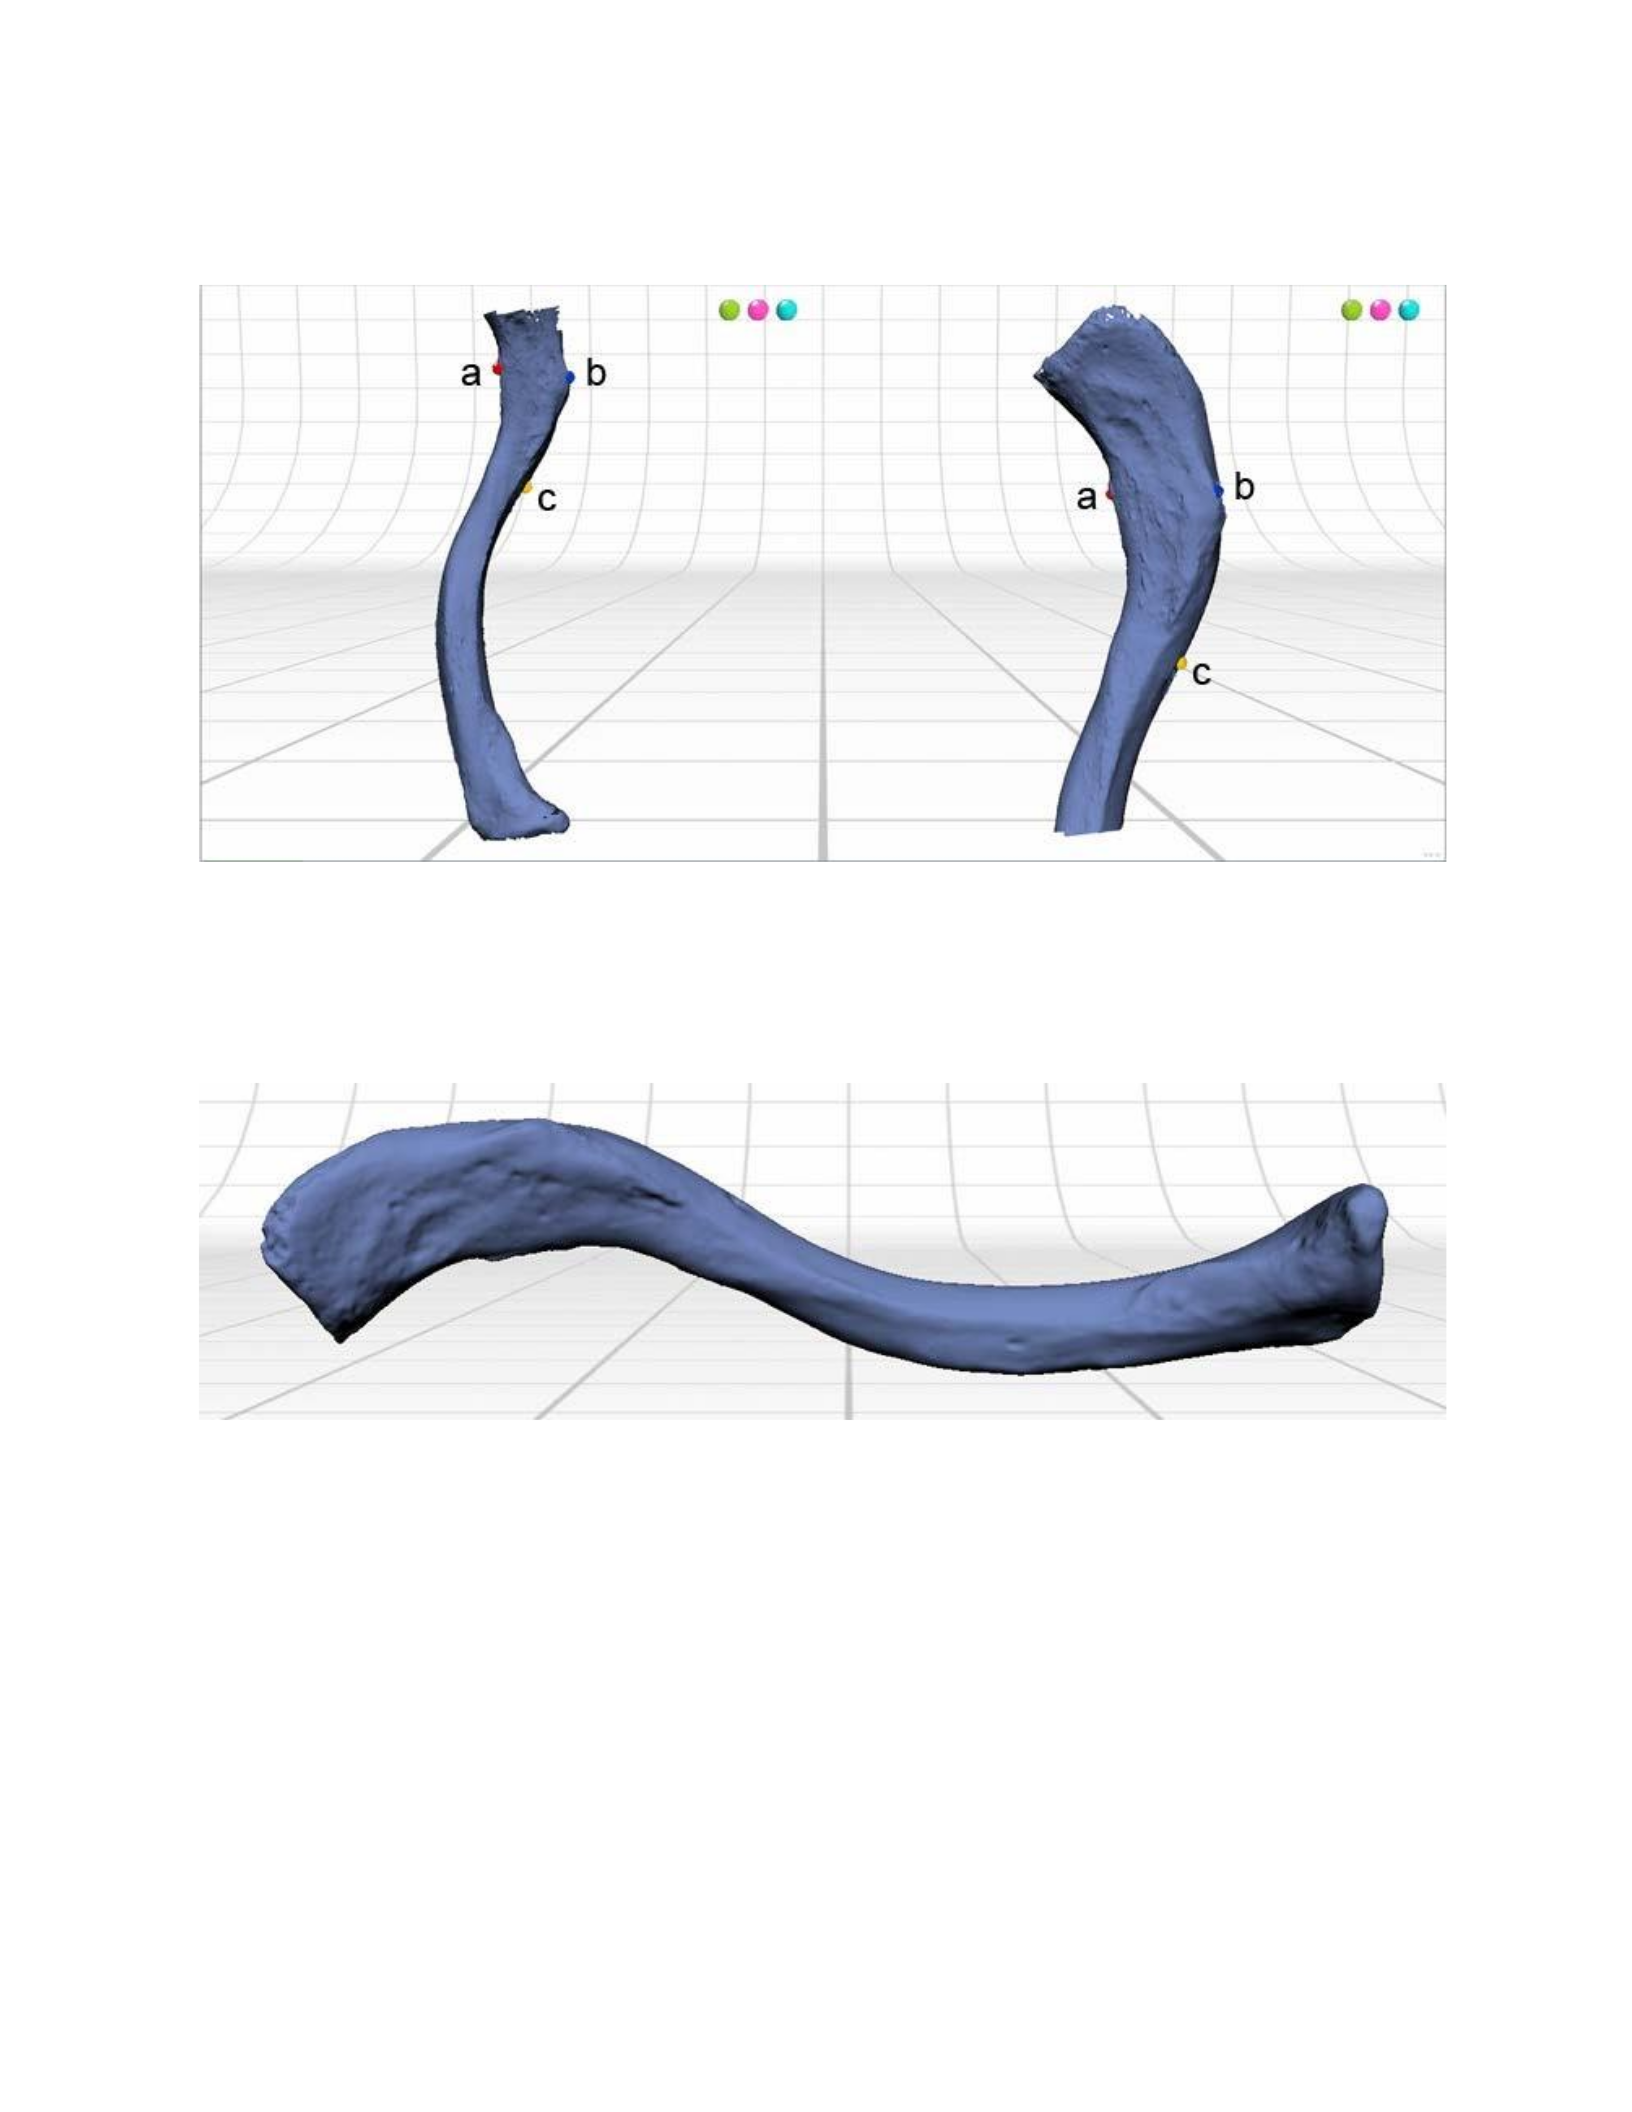
Figure 33: The muscle attachment of the deltoid on the anterolateral surface (A) and the conoid tubercle (B) were
used as references for alignment of the vertical scan sets of the clavicle, in addition to a nutrient foramen that was
located medial to the trapezius muscle attachment (C).
Figure 34: A view of the inferior surface of the final 3D model of the clavicle once the scan sets have been aligned
and fused together.
Os Coxae
The first 360° scan set was created with the ischiopubic ramus placed flat on the part
gripper base (Figure 35 A). An extra adjustable horizontal post was taken from another
partgripper and combined with the one mounted on the scanner. The iliac blade was pinched

between the rubber tips of the adjustable horizontal posts, enabling greater support to the bone as
it rotates during the automated scanning process. This initial 360° scan set allowed much of the
surfaces to be scanned, but the surfaces of the iliac crests, ischial tuberosity and ischiopubic
ramus required additional scans. The outer rim of the ascetabular fossa was placed on the part
gripper base and another 360° scan was performed (Figure 35 B). Additionally, several more
single scans were acquired in order to obtain several areas of missing data that could not be
obtained using the automated scanning. Primary features used for alignment included the
acetabular fossa (Figure 36 a), the anterior inferior iliac spine (Figure 36 b) and the sciatic notch
(Figure 36 c). The particular specimen that was scanned had a few damaged areas where the
cancellous bone was exposed. This included the ischial spine (Figure 37 a), the tip of the
posterior inferior iliac spine (Figure 37 b) and the medial edge of the ischial tuberosity (Figure 37
c). The porous surface of the cancellous bone exhibited a problem for the scanner, and these
areas were unable to be scanned, leaving holes in these areas. The scan sets were fused with the
water-tight model setting and the holes were filled over without presenting any particular
problems (Figure 38 A& B).
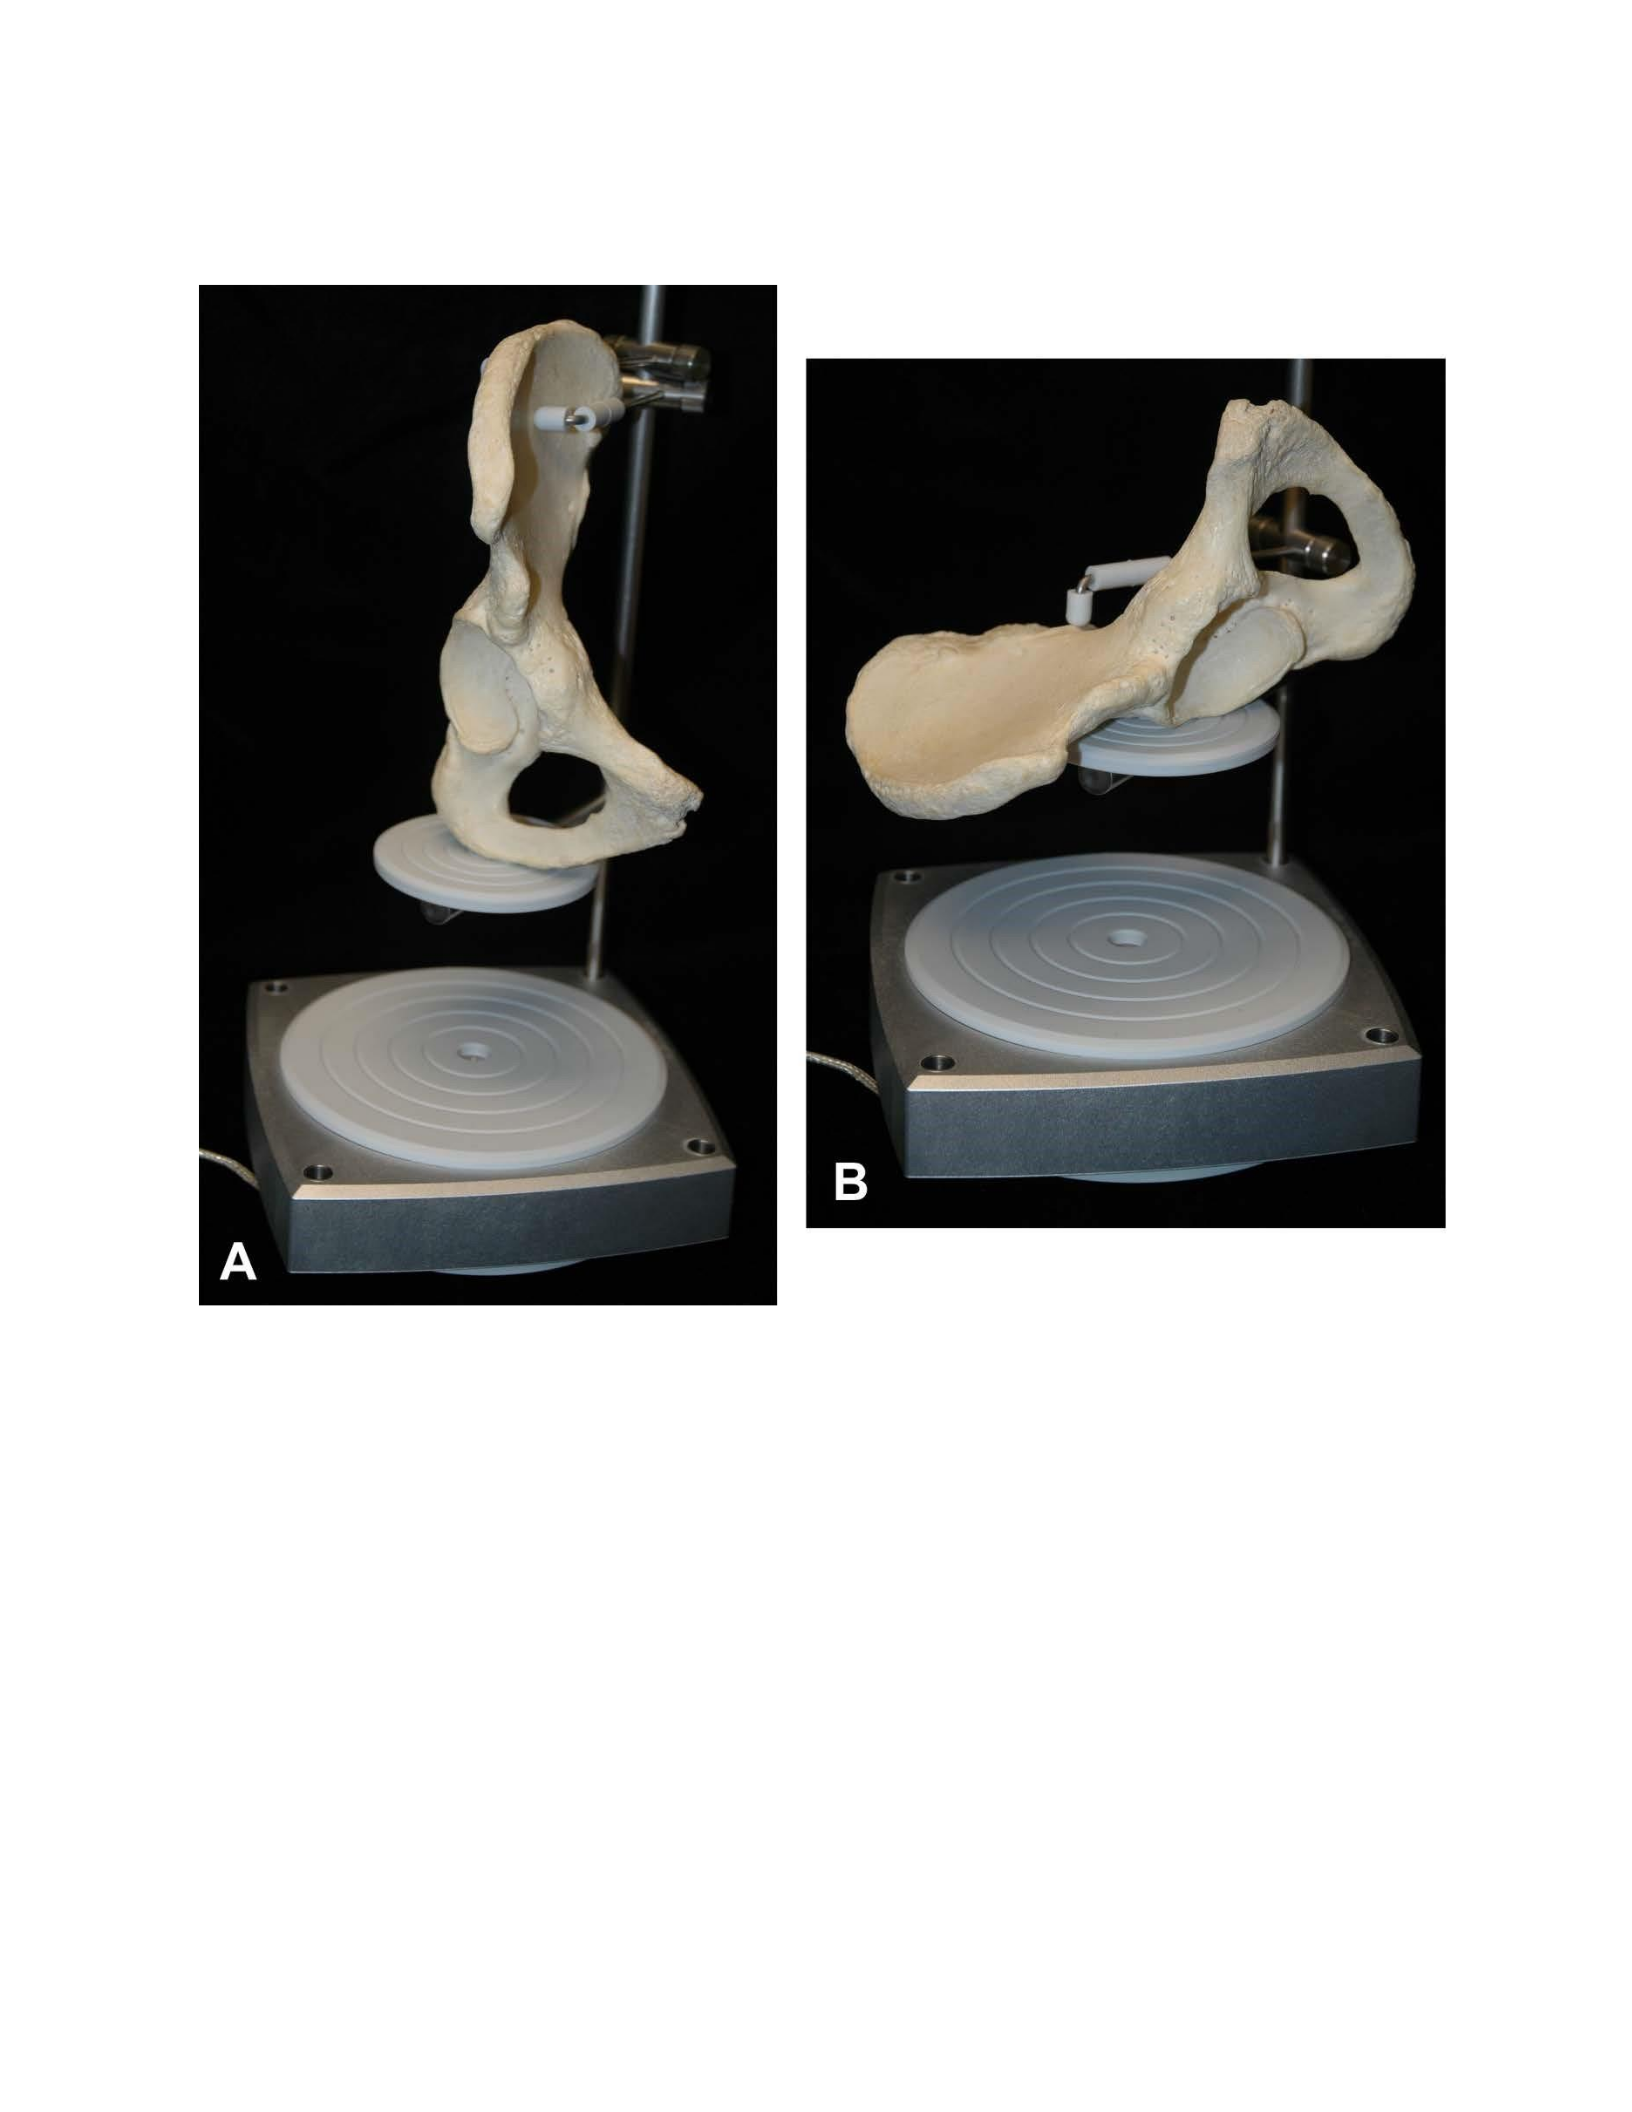
Figure 35: For the first 360° scan set the long-axis of the os coxa was oriented vertically, with the ischial tuberosity
placed on the part-gripper base, and the iliac blade pinched with the supporting prongs (A). The second 360° scan
set was collected with the long-axis oriented horizontally, with the posterior aspect of the ascetabulum resting on the
part-gripper base. A single supporting prong of the part-gripper base was used to press down on the auricular surface
and secure the bone (B).
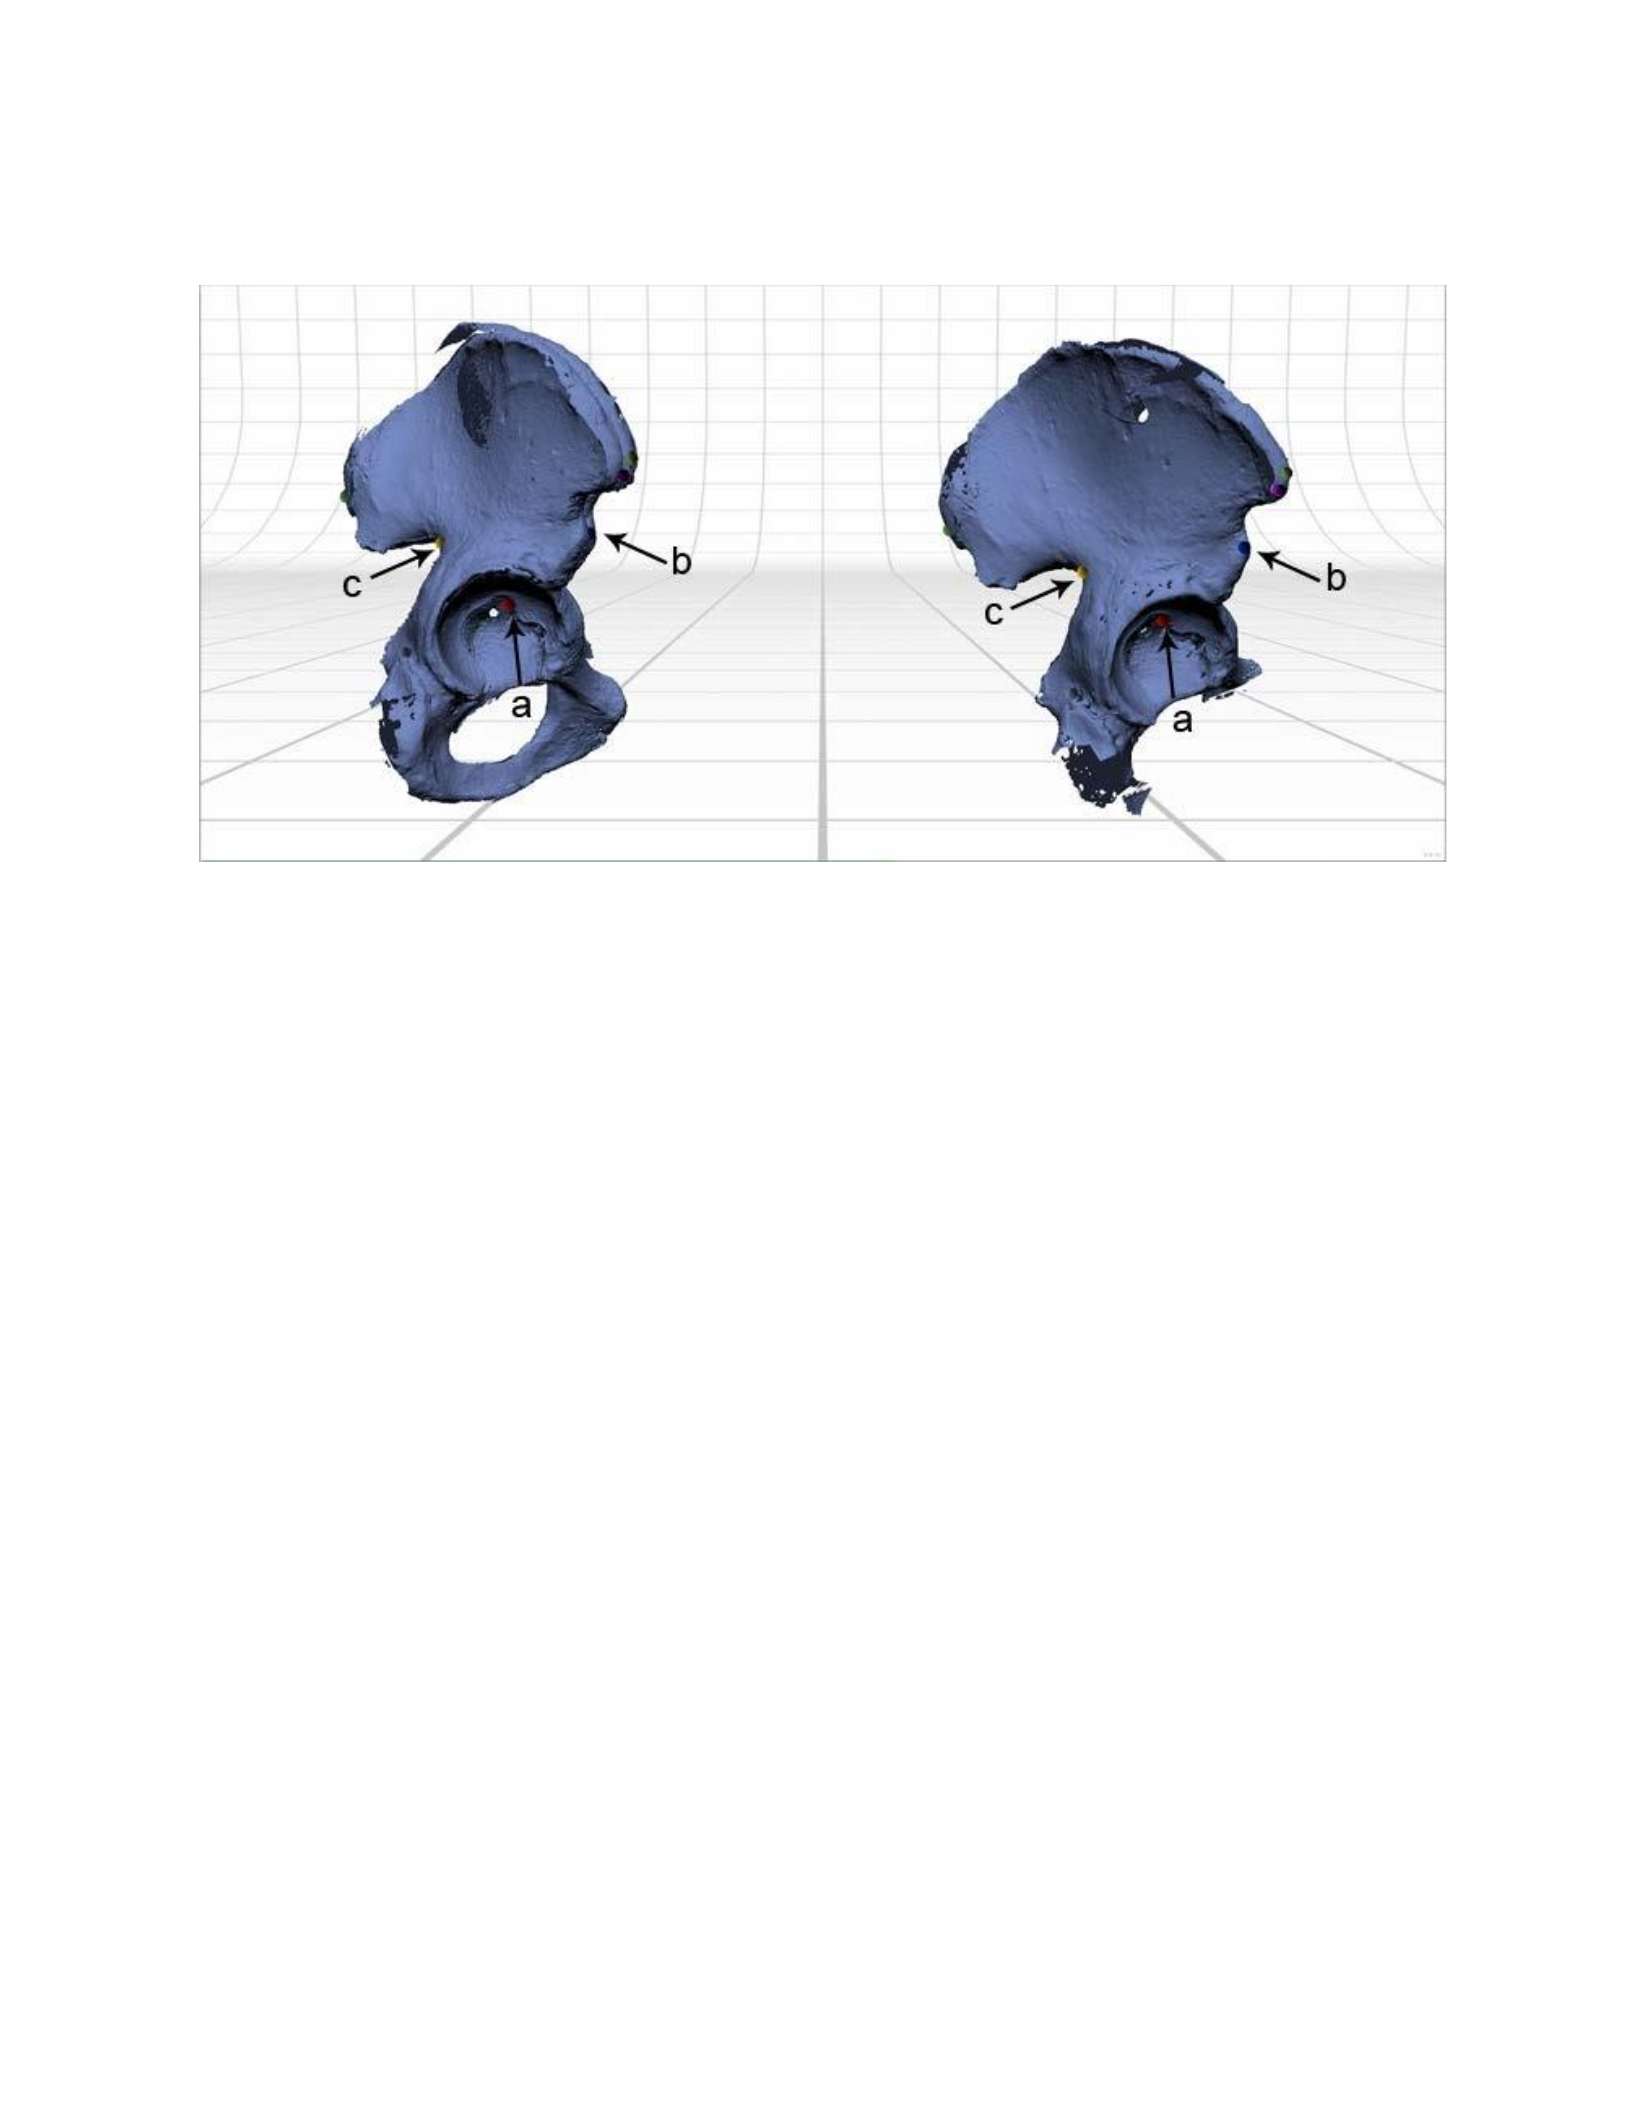
Figure 36: Numerous alignment pins were used to align the scan sets of the os coxa. Primary features used for
alignment were the acetabular fossa (a), anterior inferior iliac spine (b) and the sciatic notch (c).
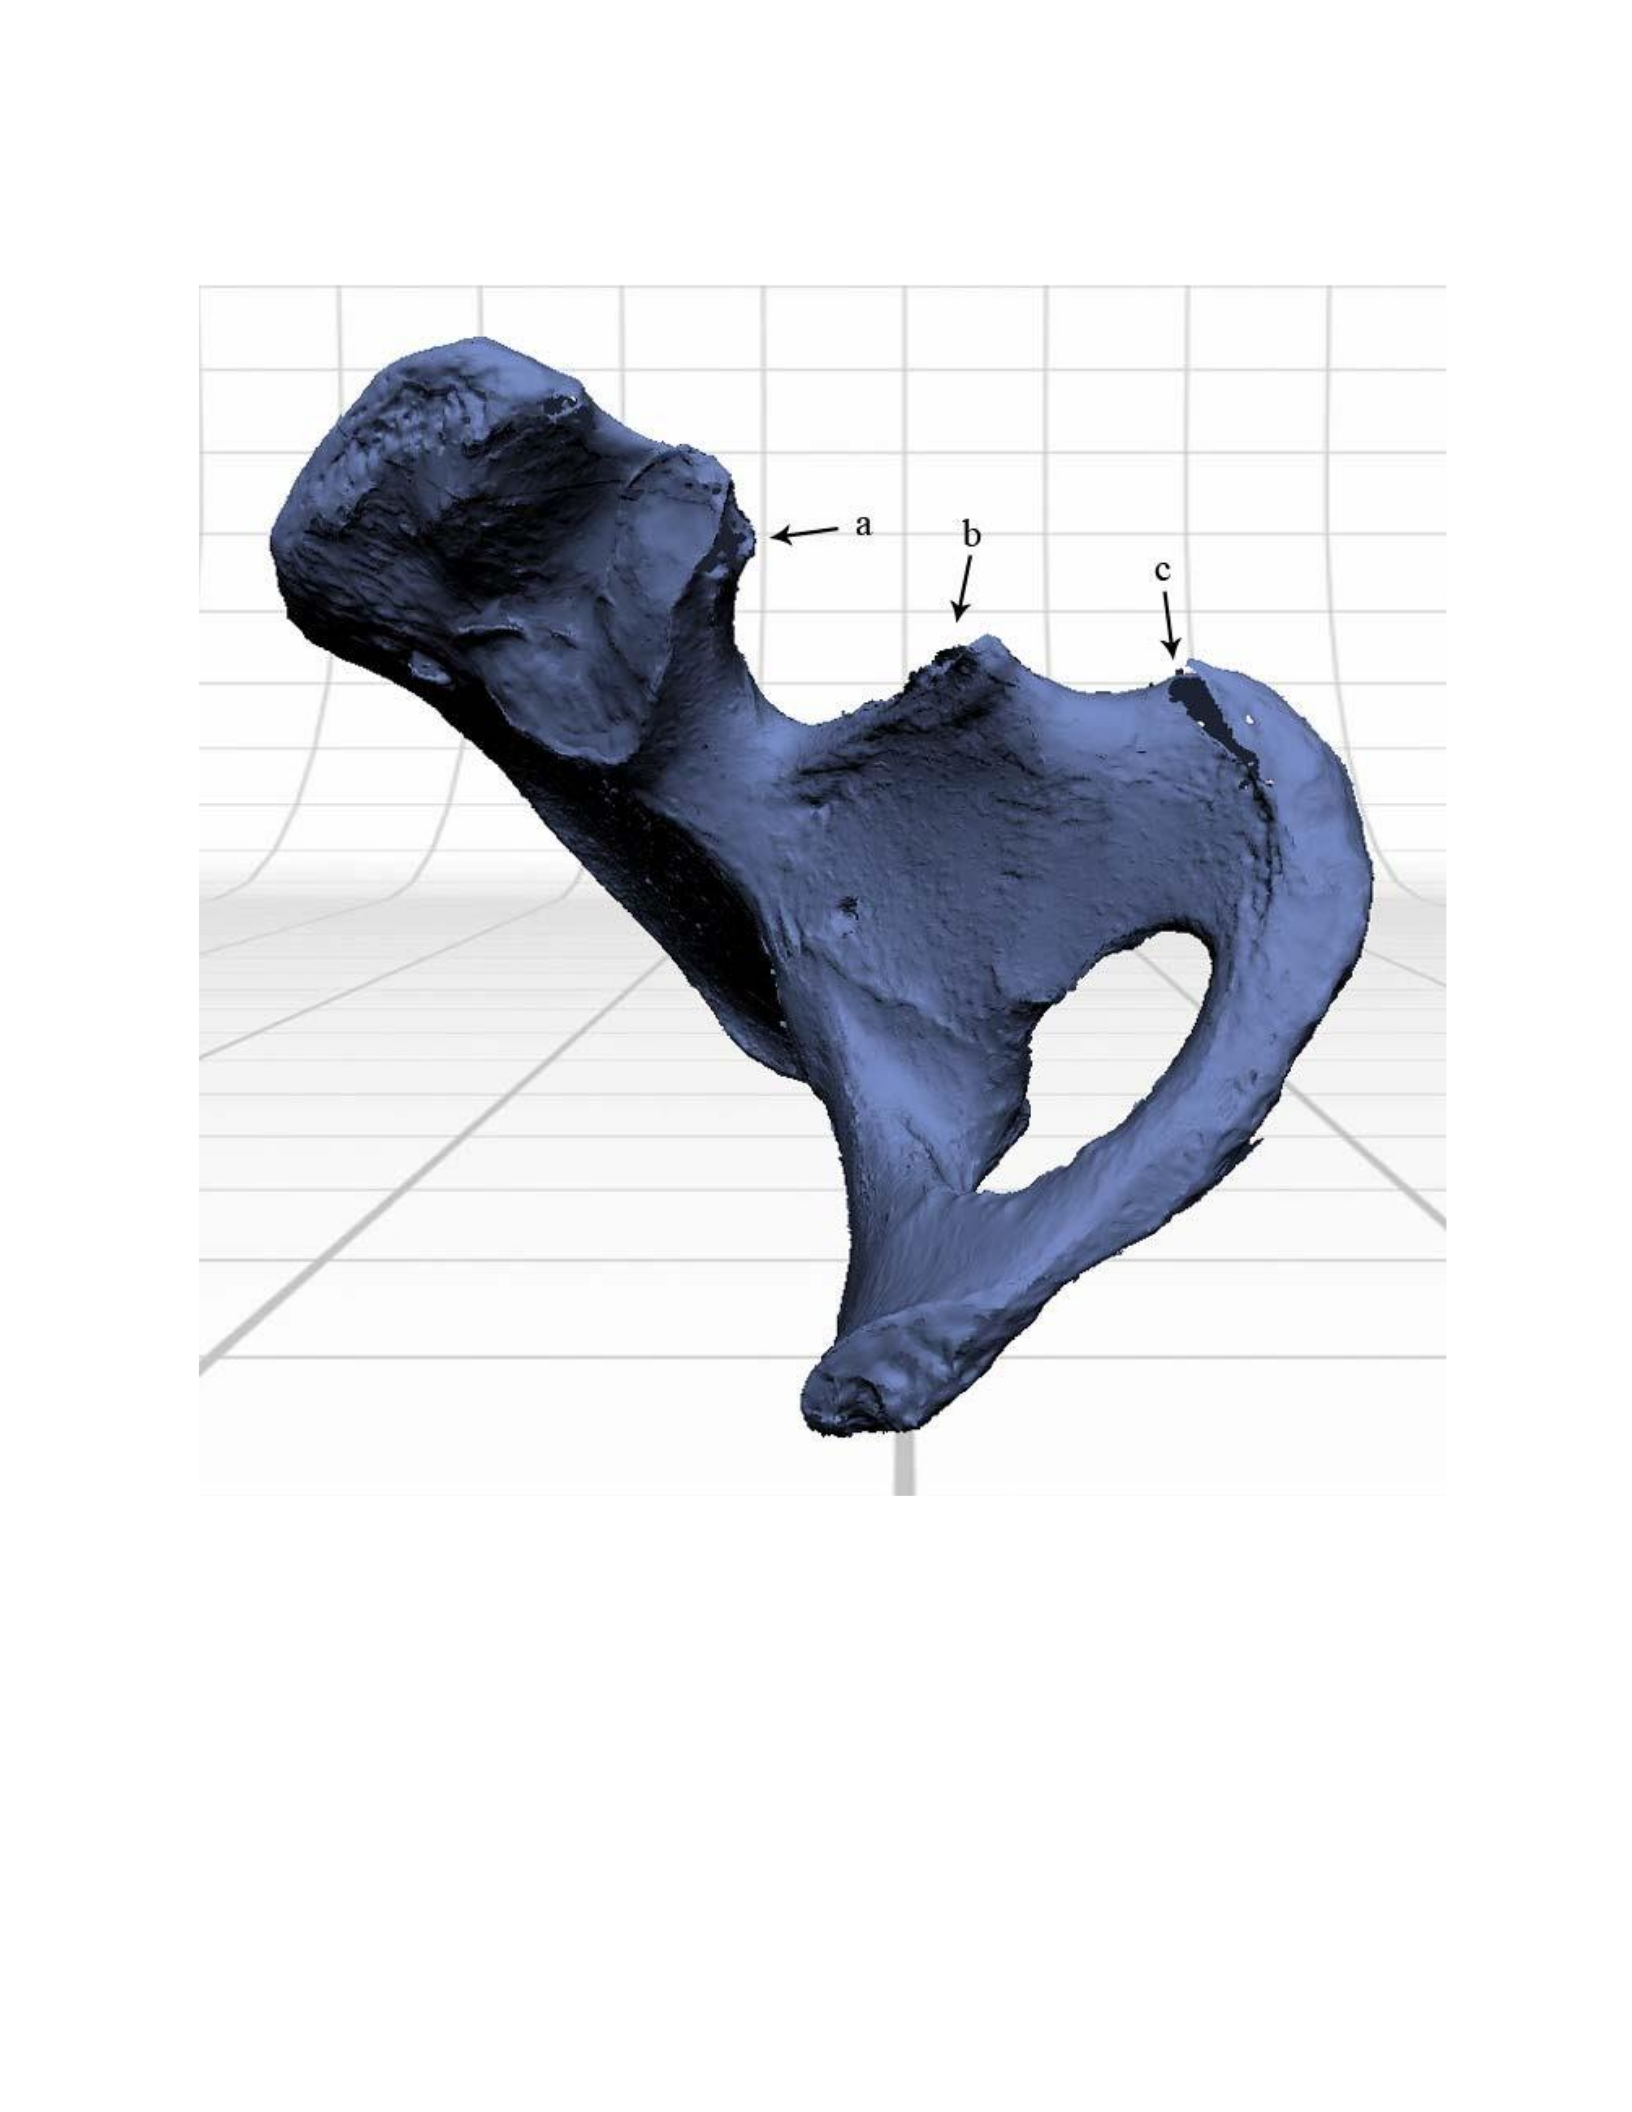
Figure 37: The tip of the posterior inferior iliac spine (a), the ischial spine (b), and the medial edge of the ischial
tuberosity (c) presented cancellous bone on the os coxa that was difficult to capture with the laser scanner.
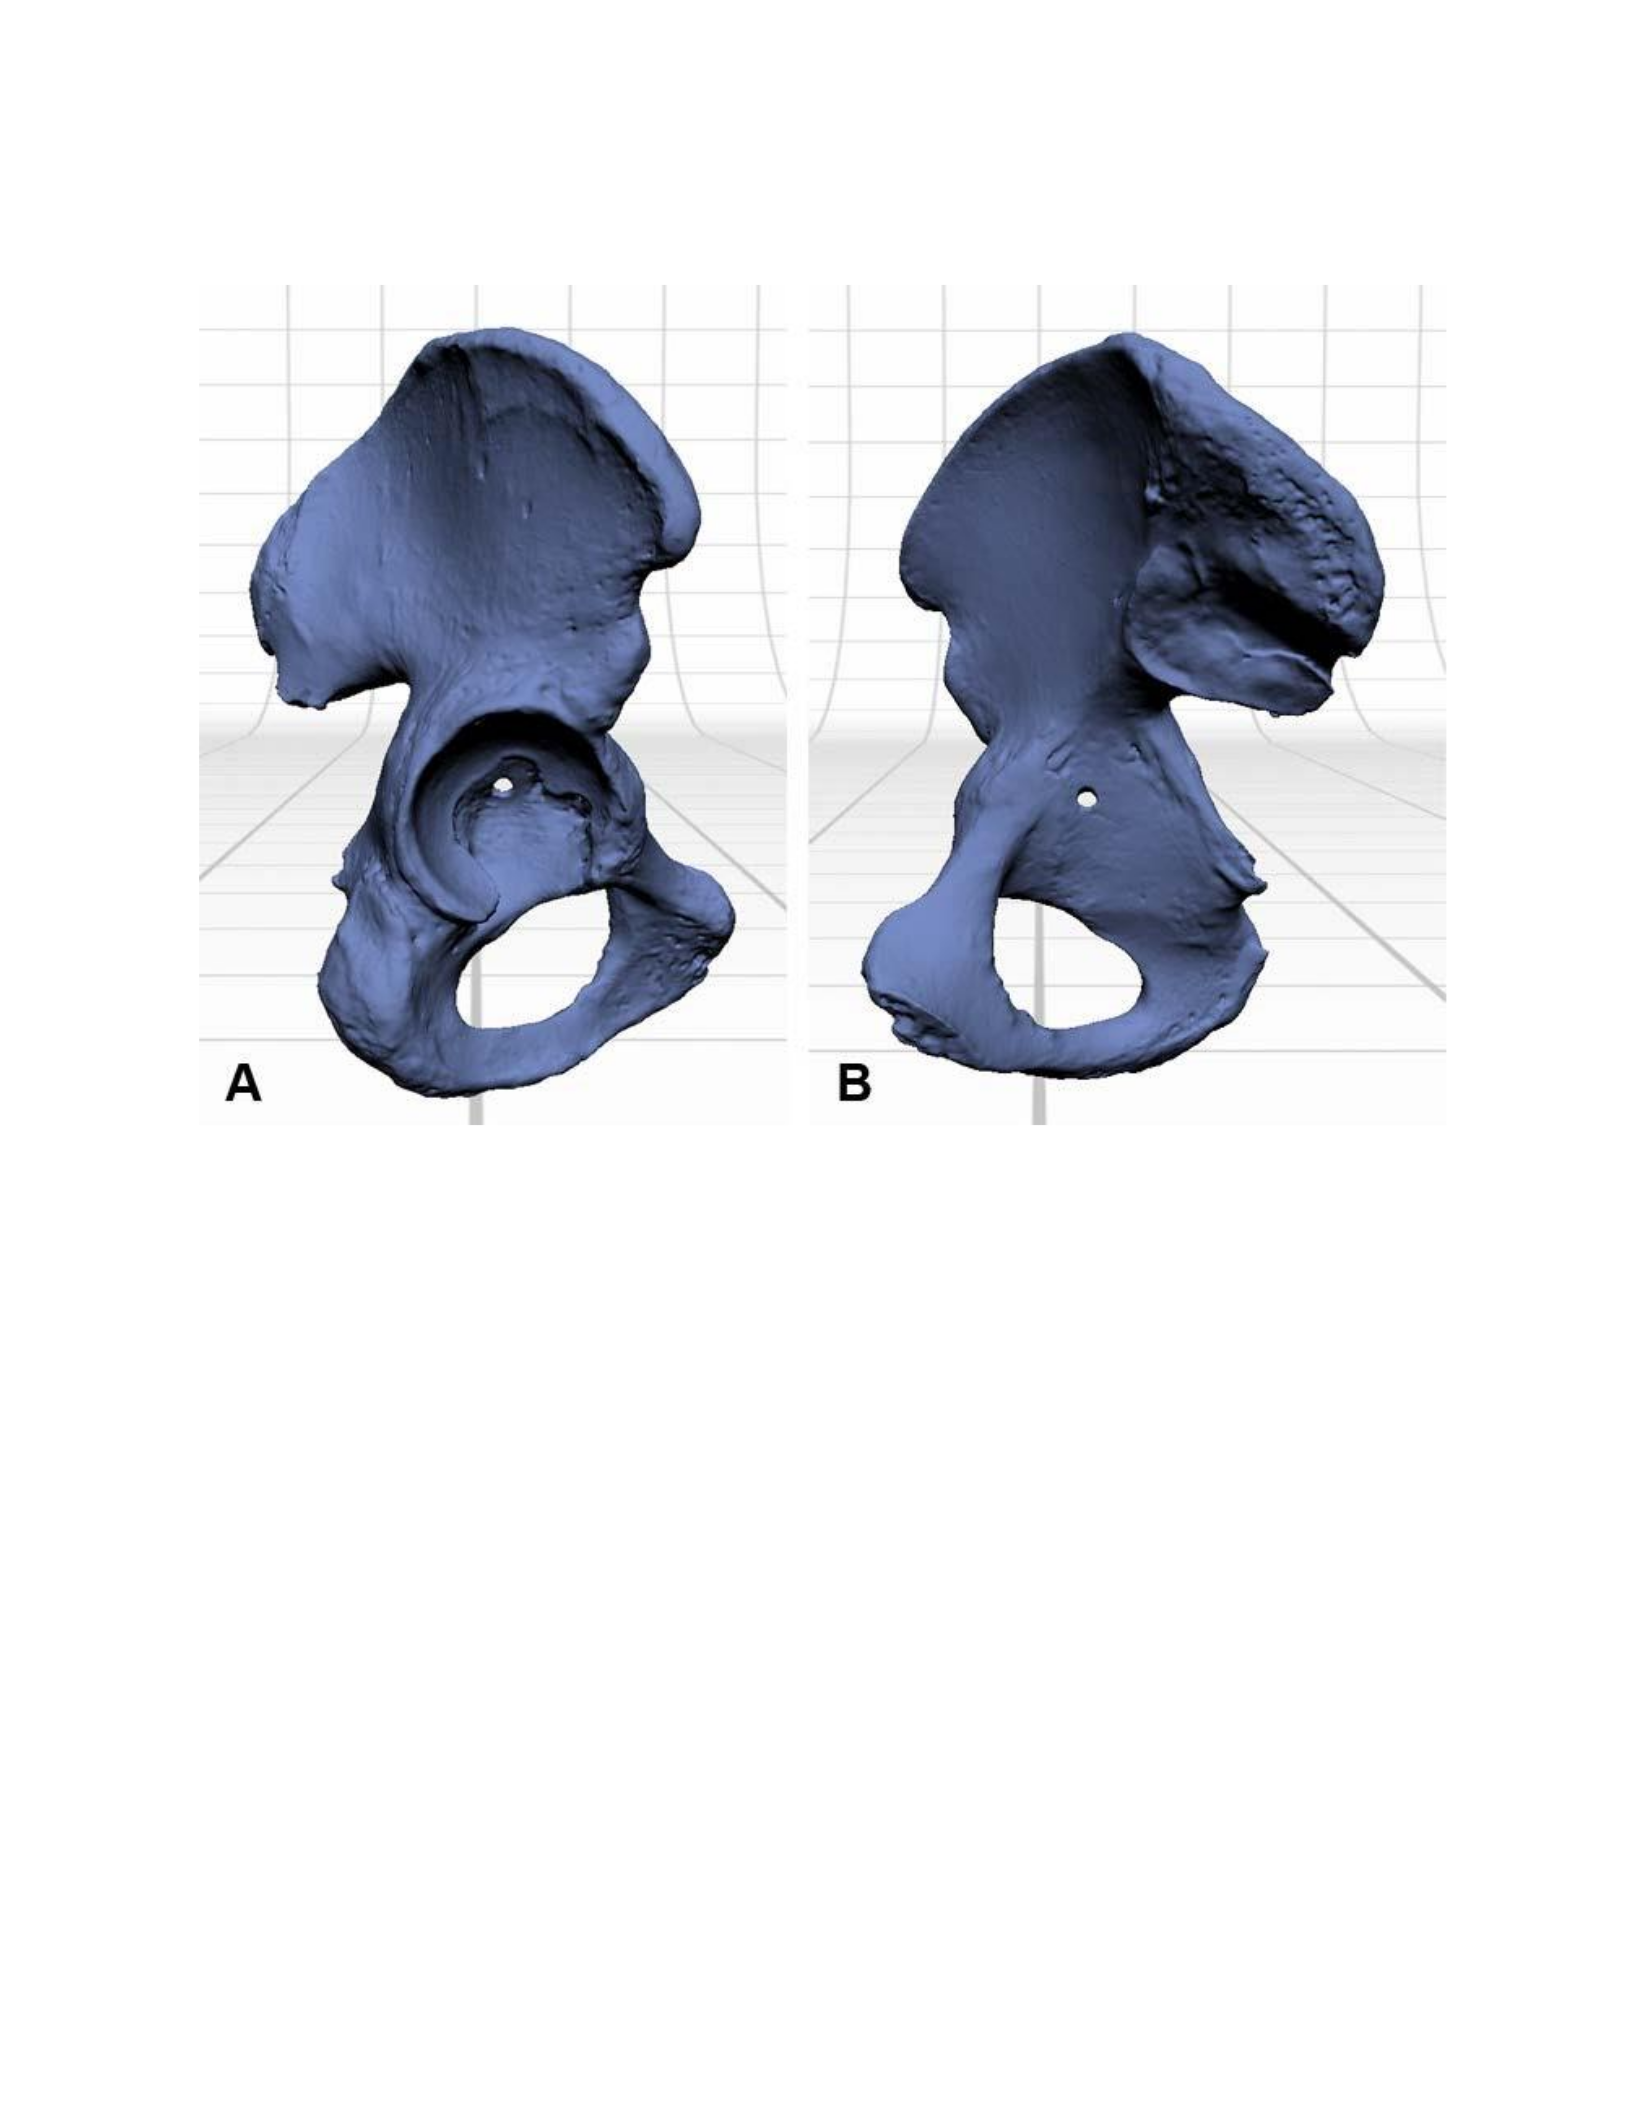
Figure 38: The lateral (A) and medial (B) views of the final scanned model of the os coxa after fusing the scans.
Sternum
The initial scan of the sternum was collected by placing the bone upright on the part
gripper base and pinching it between the adjustable horizontal support posts. Unfortunately,
during this initial scan, the bone was not pinched securely enough and moved slightly during the
scanning process. This caused a visible error during alignment, displaying two copies of the bone
within the same scan. In order to address this, the part gripper was further adjusted to secure the
bone properly. Once this was done, the surfaces of the sternum were obtained with two 360° scan
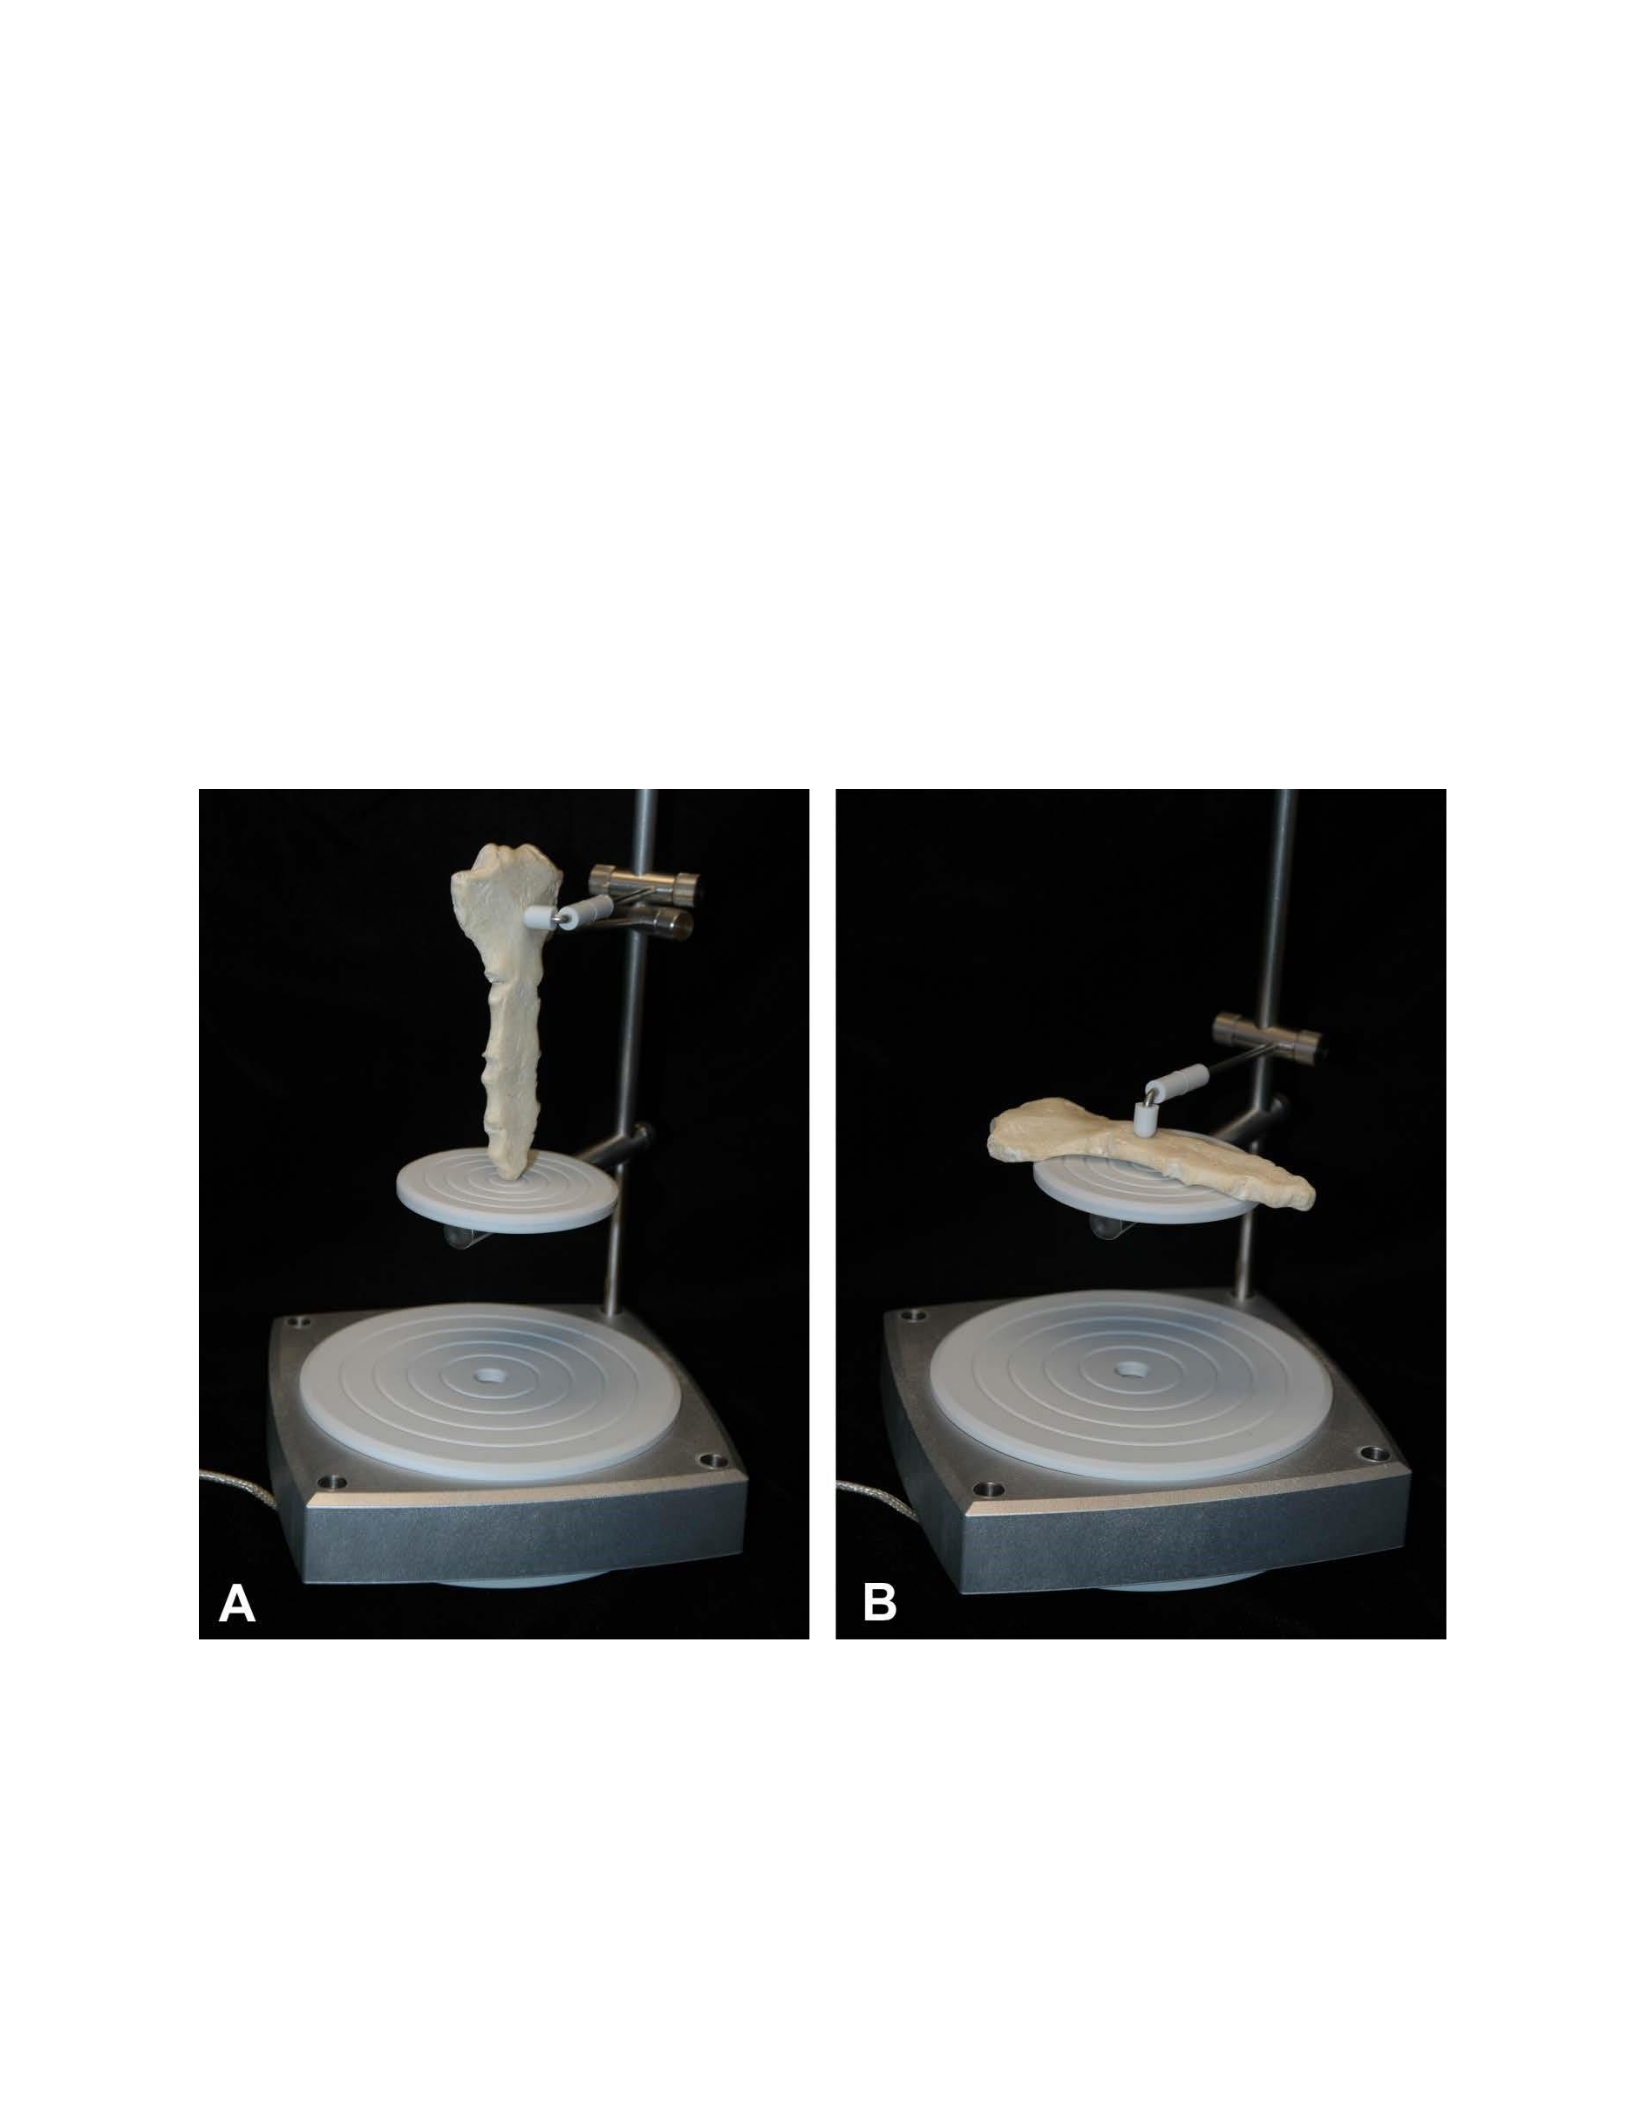
sets, one with the sternum upright in anatomical position (Figure 39 A), and another with it lying
flat on the part gripper base (Figure 39 B). These protocols resulted in the scan data shown in
Figure 40 (A & B). The scan sets were then aligned easily aligned using the costal notch of the
2nd left rib (Figure 41 a), the lateral right edge of the jugular notch (Figure 41 b) and the superior
edge of the costal notch of the 4th right rib (Figure 41 c). After alignment, the sternum scans
were fused (Figure 42A&B) requiring no further scanning.
Figure 39: The sternum oriented vertically (A) and horizontally (B) in two different 360° scan sets.
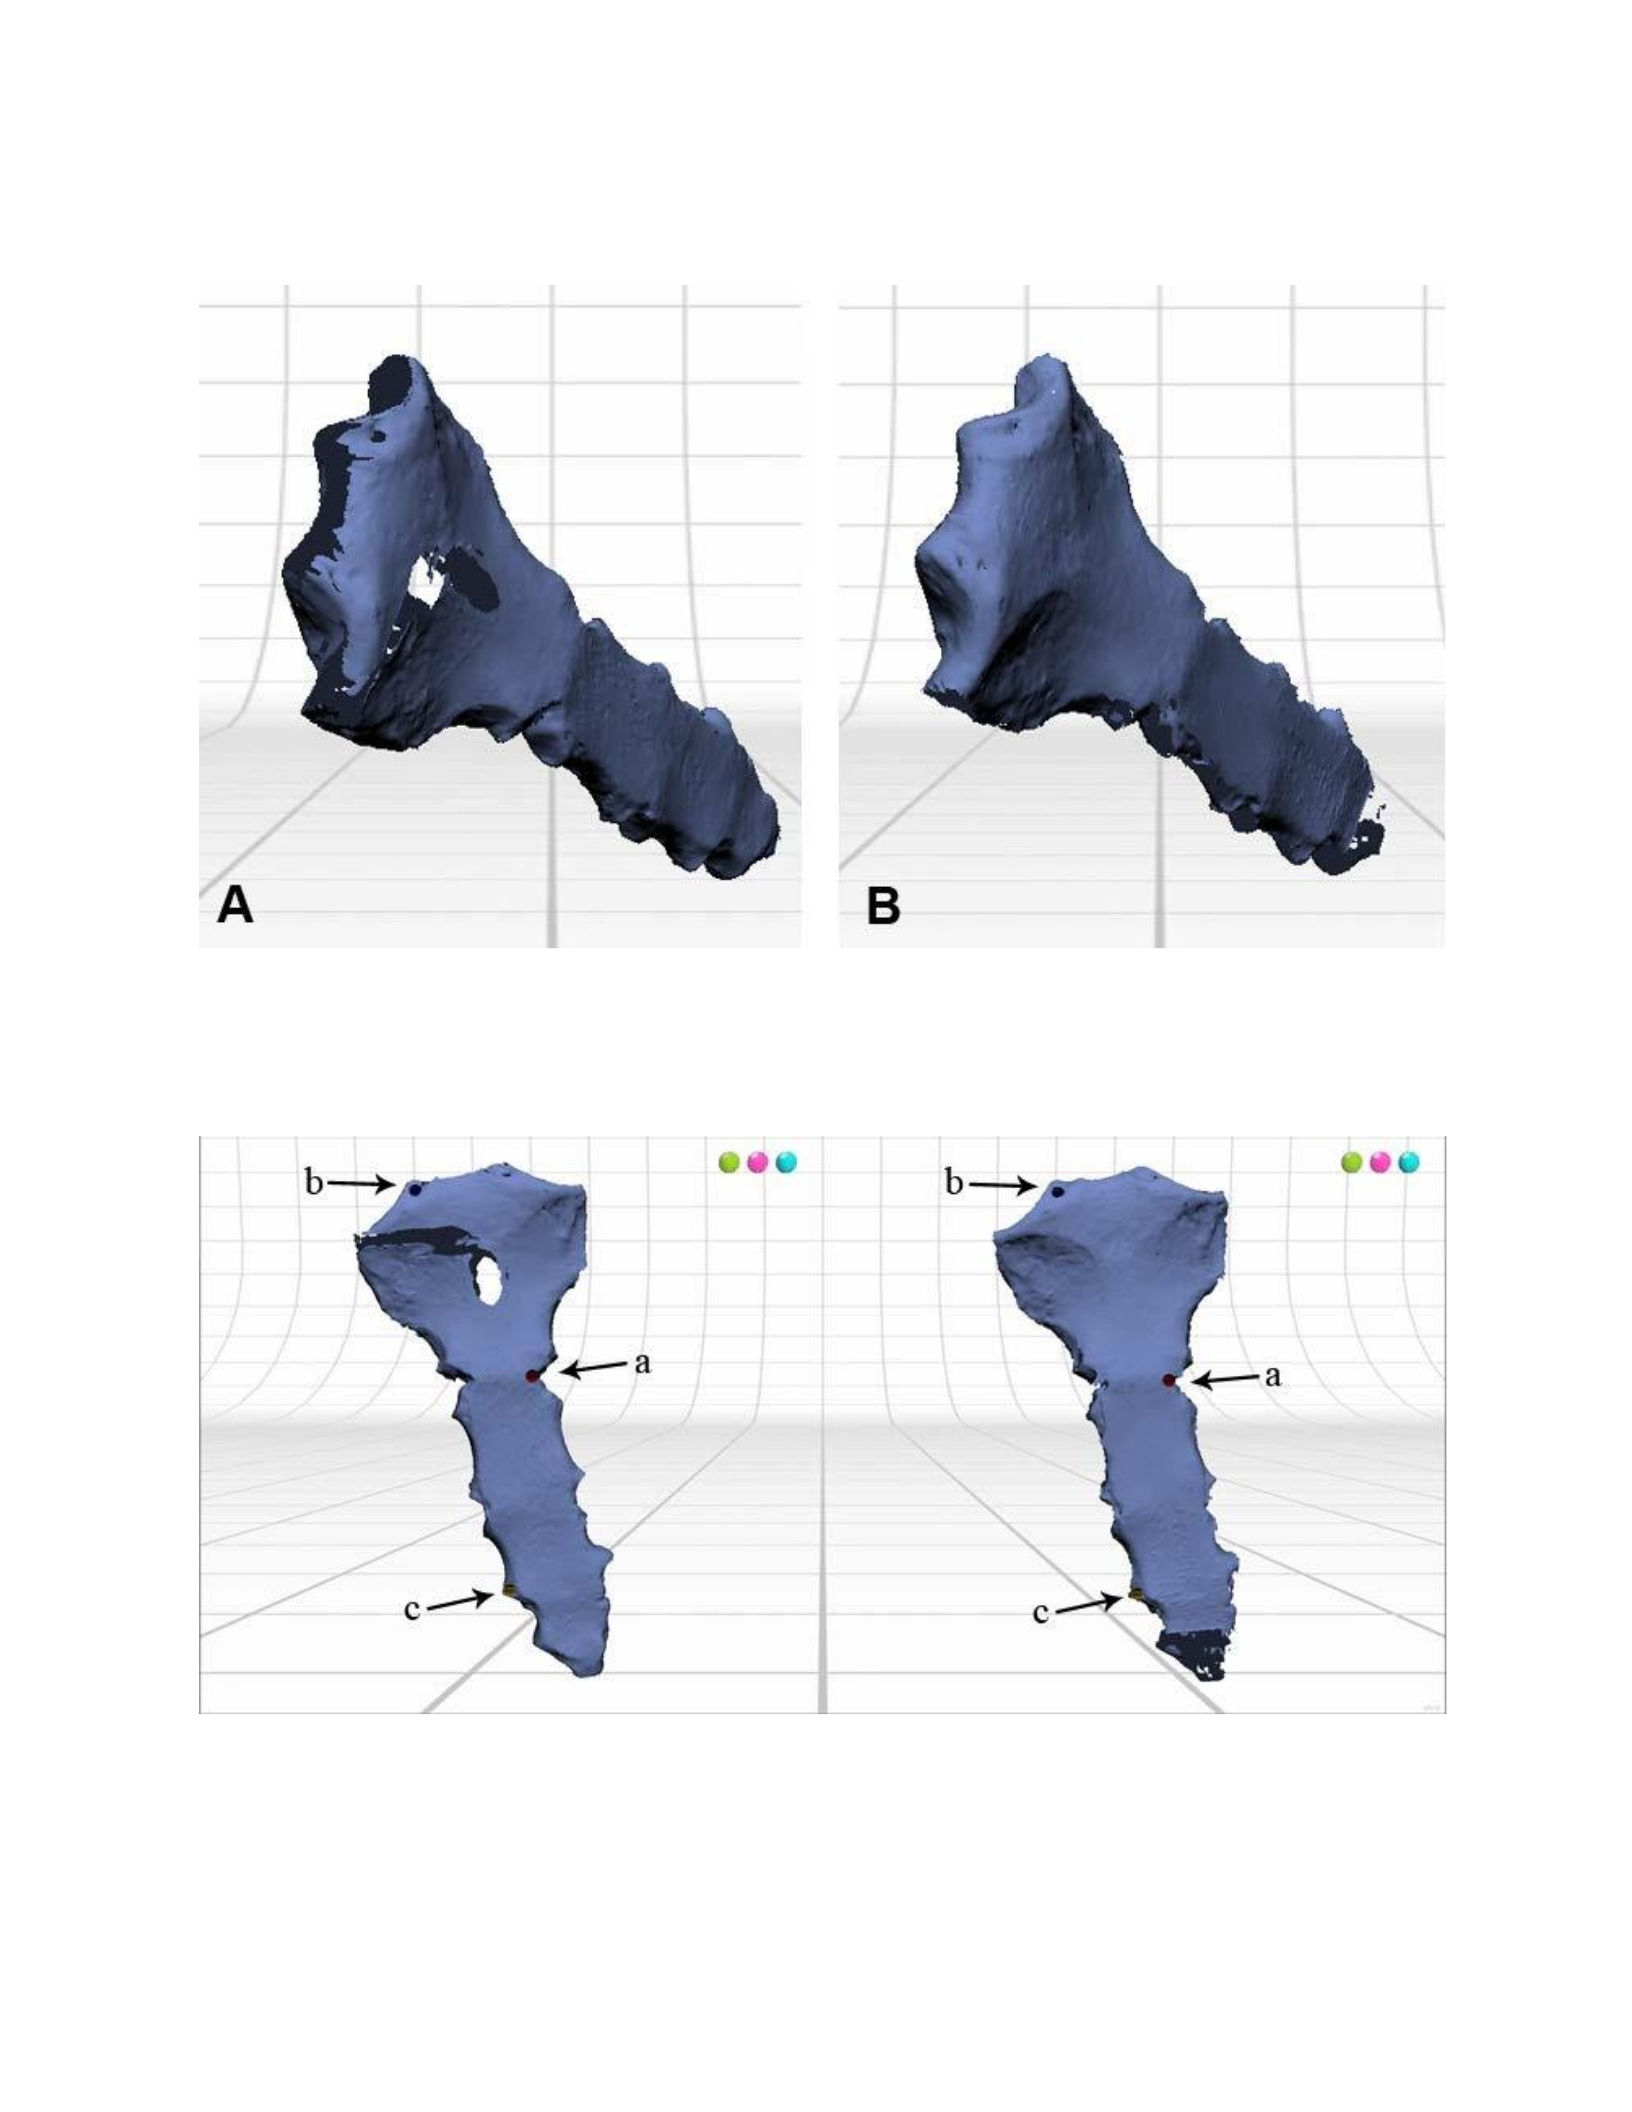
Figure 40: The horizontal 360° scan set (A) is missing the surfaces of the jugular and clavicular notches of the
sternum. The vertical scan (B) is missing some of the lateral edges of the corpus sterni.
Figure 41: The costal notch that articulates with the 2nd left rib (a), the lateral right edge of the jugular notch (b), and
the superior edge of the costal notch of the 4th right rib (c) were used as references to place the alignment pins.
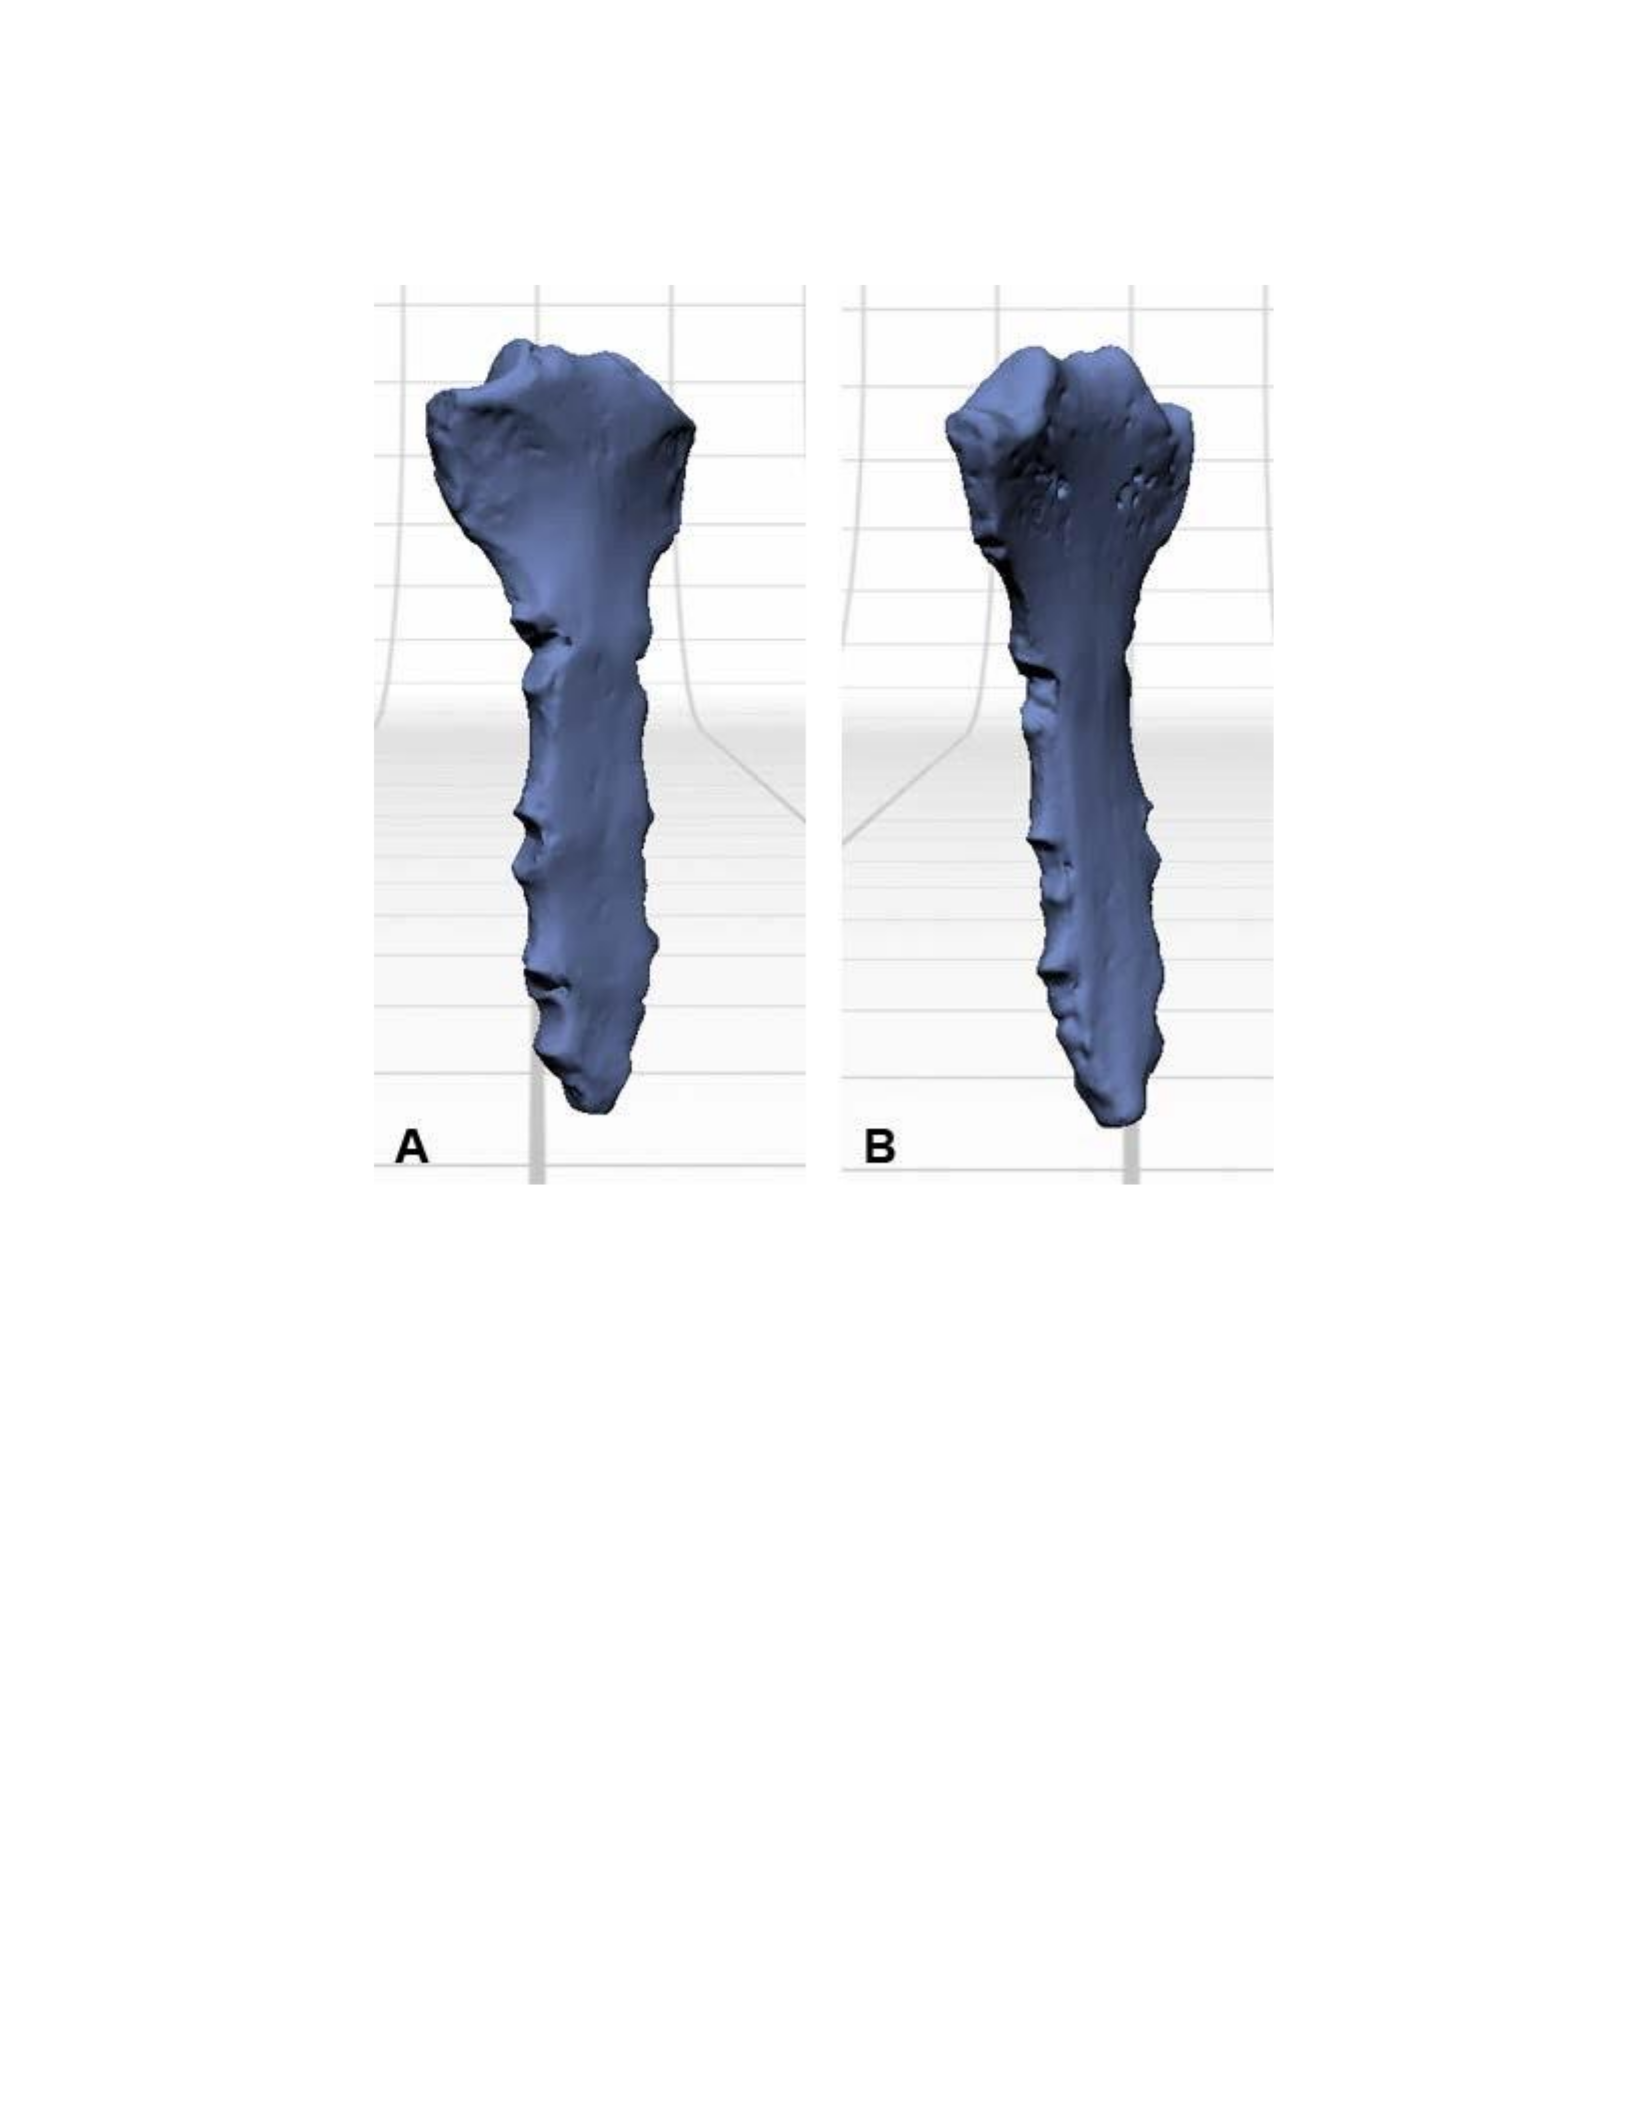
Figure 42: An anterolateral (A) and posterolateral (B) view of the final model of the sternum after the scans were
aligned and fused.
Rib
Ribs are particularly challenging to scan because there are few substantial surfaces to
provide support when placing the bone on the part gripper base. Because of this, it took a
considerable amount of time to properly secure the bone with the supporting prongs so that the
bone did not move during the scanning process. The rib that was chosen to be scanned was a left
second rib. The first 360° scan was collected with the rib placed in anatomical position, flat on
the part gripper base (Figure 43). Two more 360° scan sets were possible after considerable

adjustment of the supporting prongs of the part gripper. One of these sets was acquired with the
sternal end placed on the part gripper base, and the vertebral end supported above by pinching
with the part-gripper prongs (Figure 44 A). The other set was created with the bone in the
opposite orientation, with the vertebral end lying on the part-gripper base and the sternal end
oriented superiorly (Figure 44 B). The three 360 scan sets resulted in the scan data shown in
Figure 45 (A, B & C). The scan sets were then aligned by referencing the tubercle (Figure 46 a),
and two areas where the bone had been slightly damaged (Figure 46 b & c). After alignment, the
scan sets were fused, creating a water-tight model (Figure 47A & B). Except for the difficulty in
securing the rib with the bone oriented length-wise in a vertical position, the rib was not
complicated to scan and process.
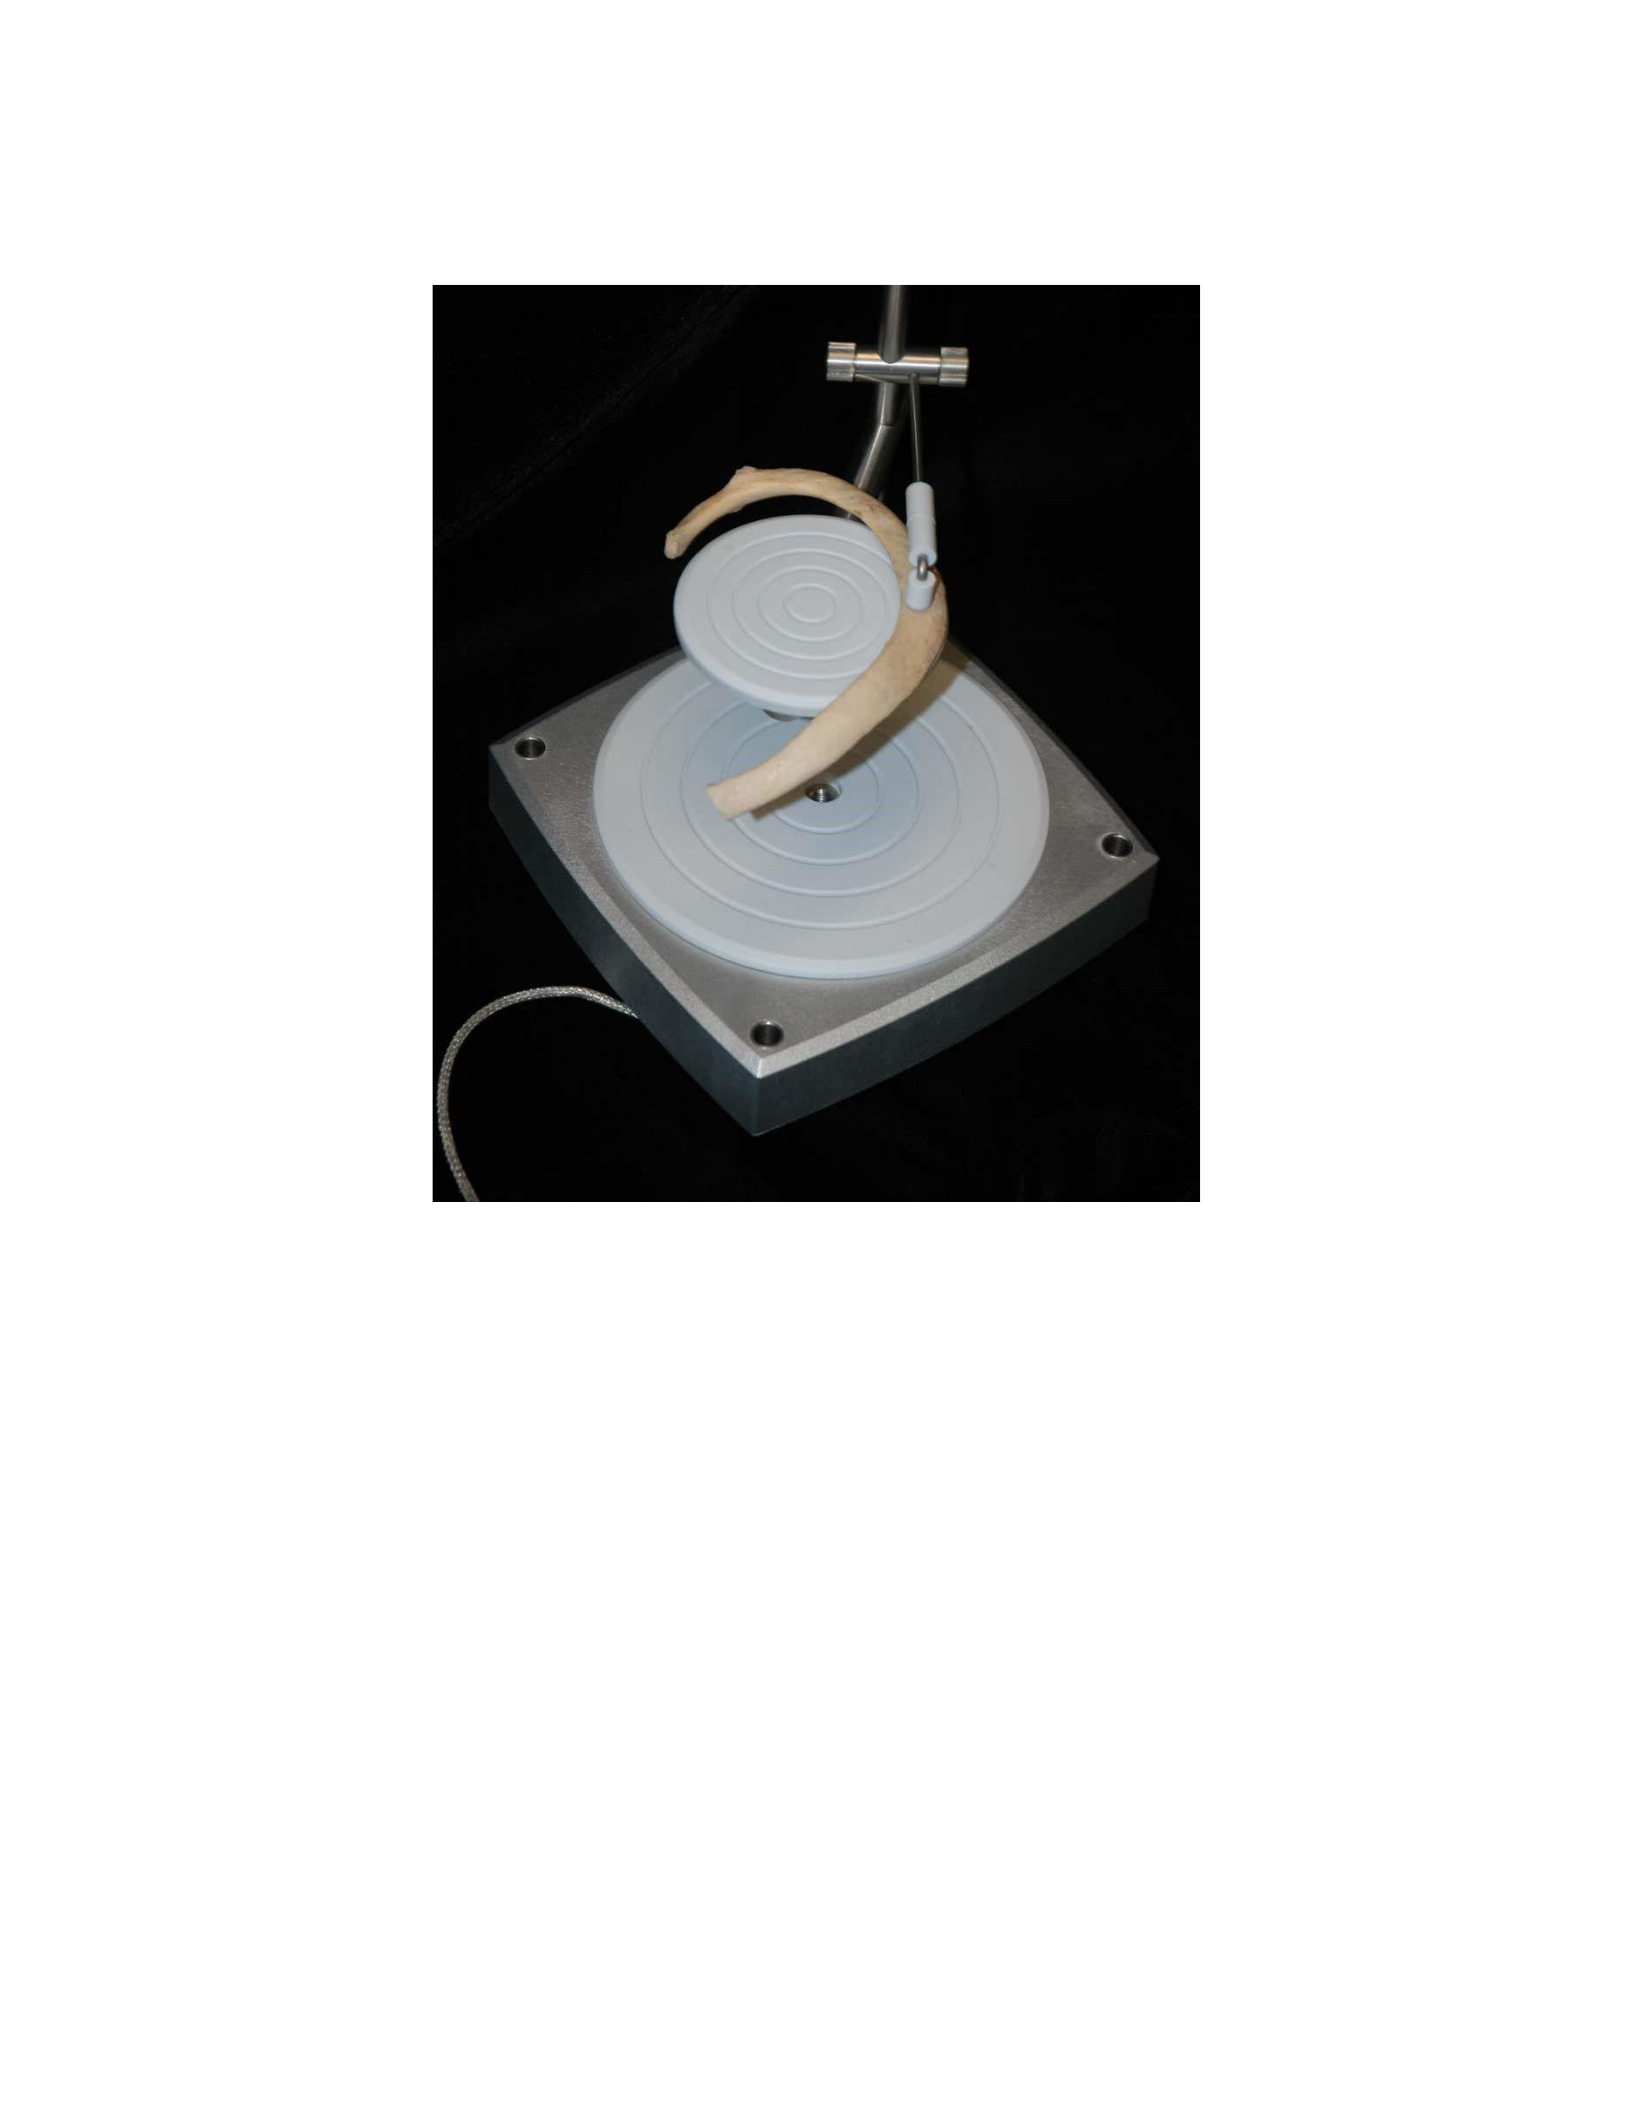
Figure 43:
The first 360° scan set was acquired with the length of the rib oriented horizontally.
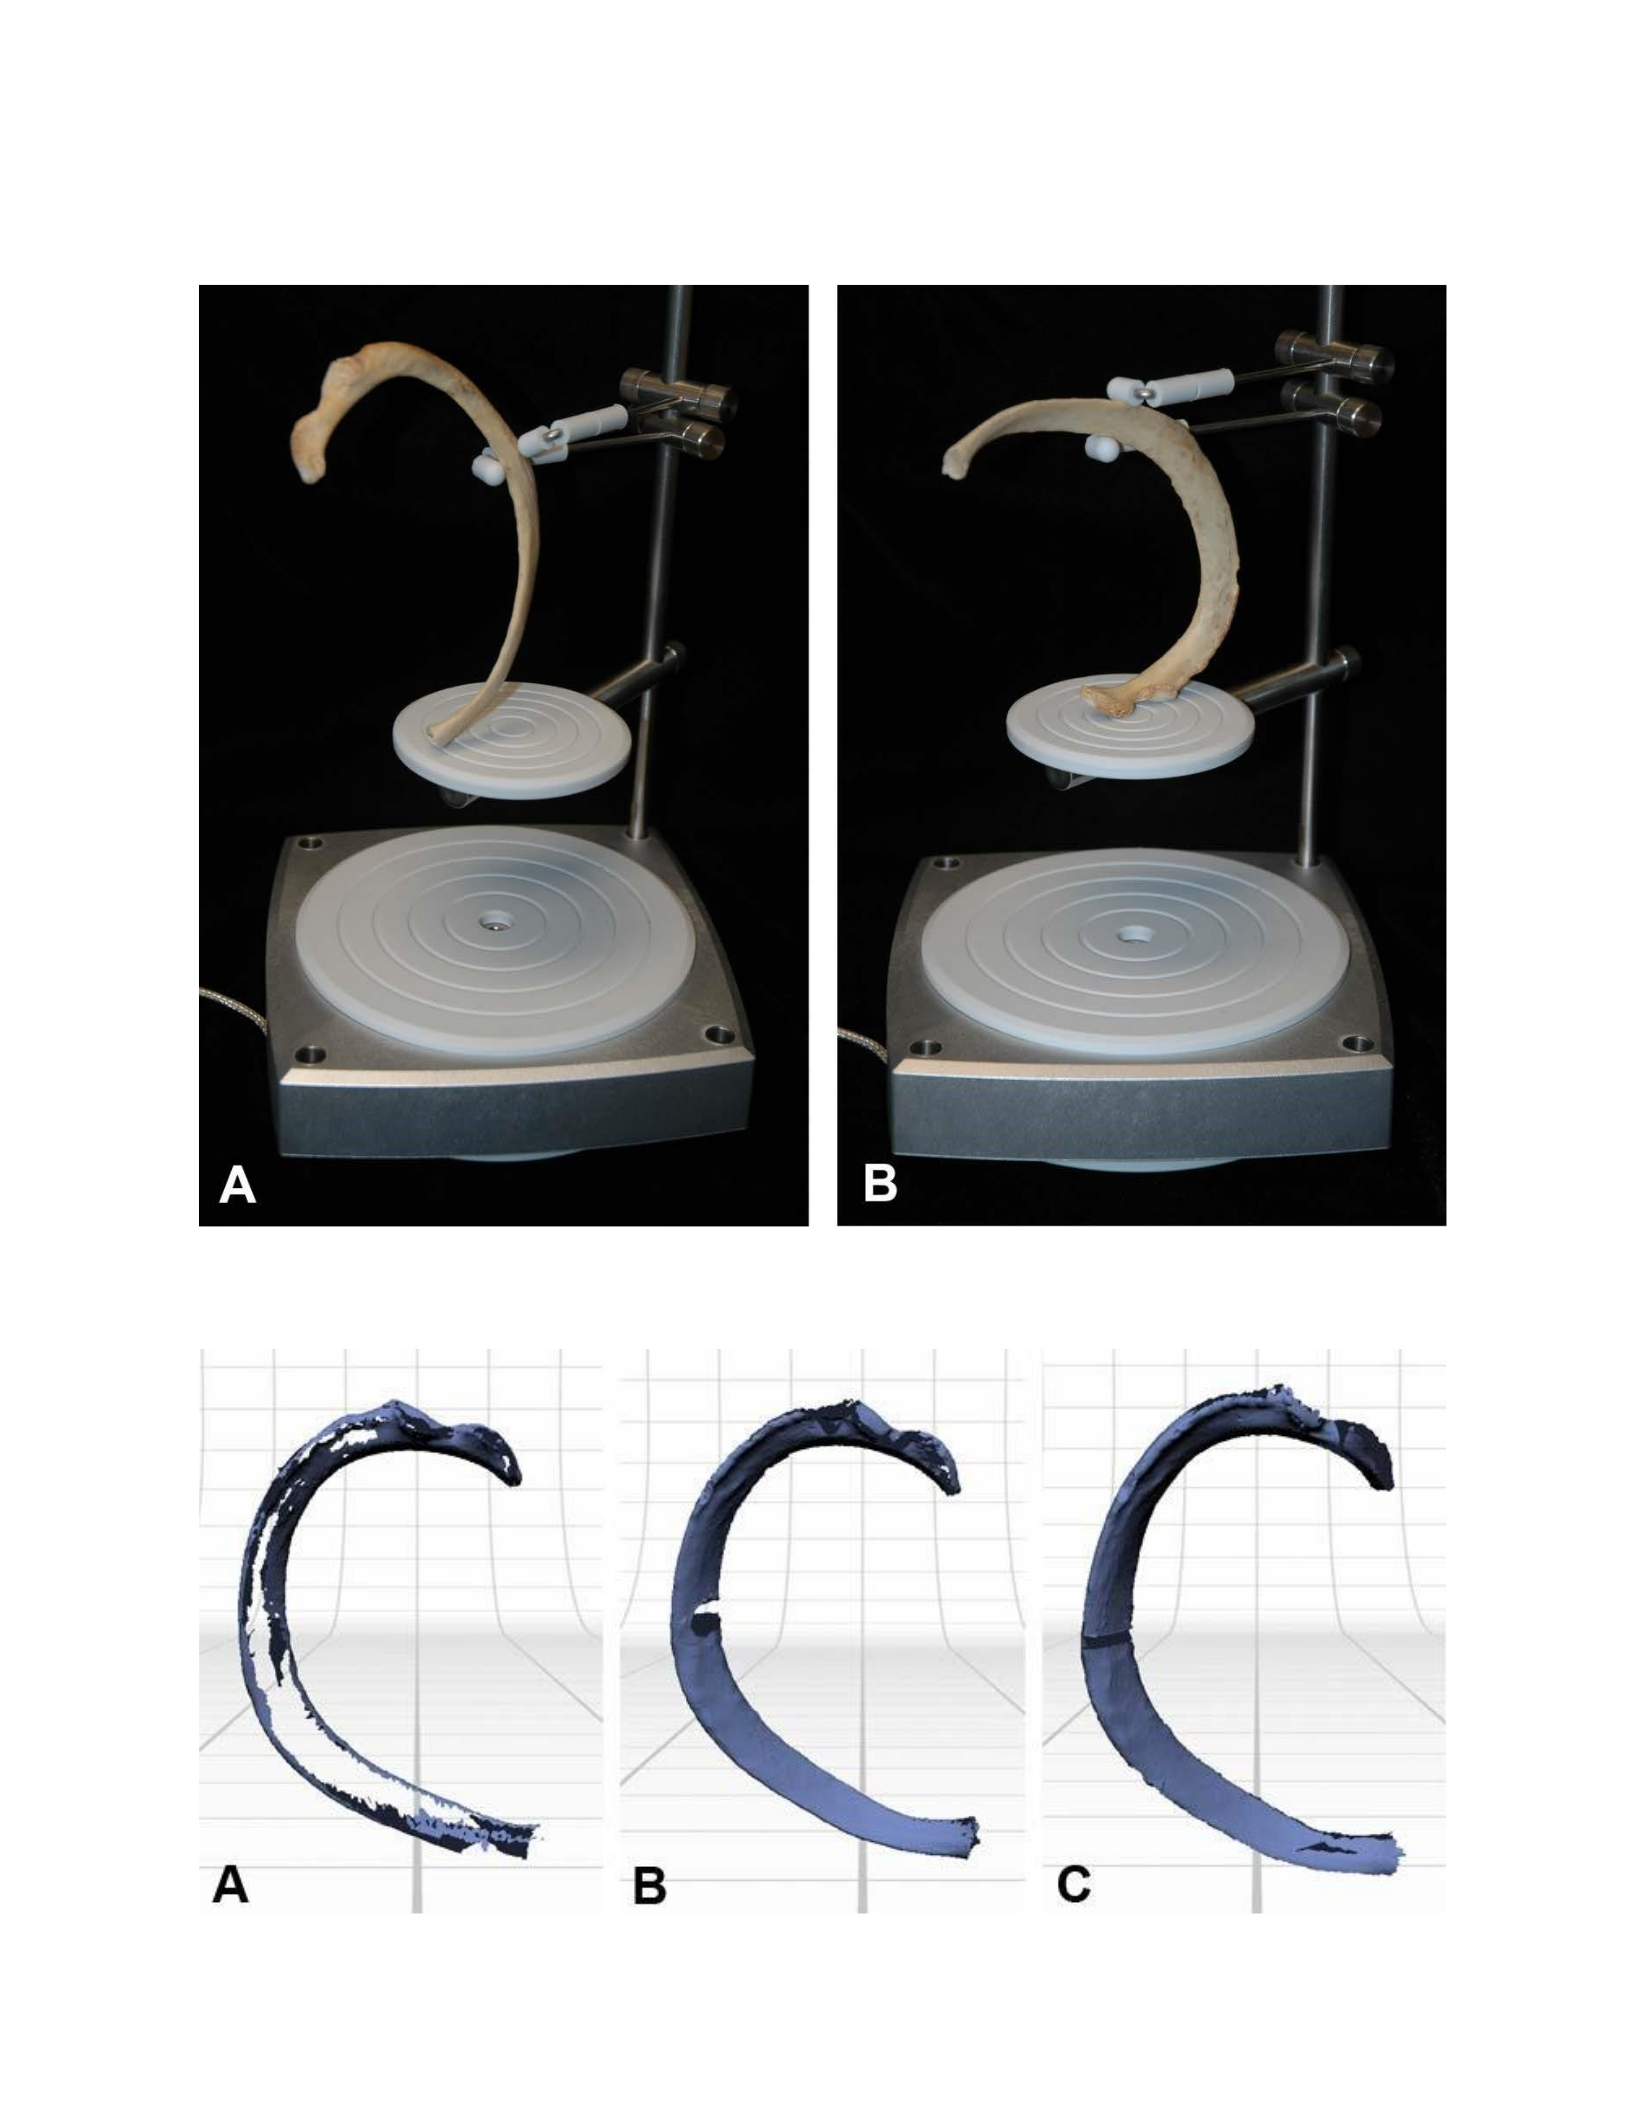
Figure 44: The rib is placed in a vertical orientation for scanning. One set is collected with the sternal end resting on
the part-gripper base, and the other scan set was acquired with the vertebral end resting on the base.
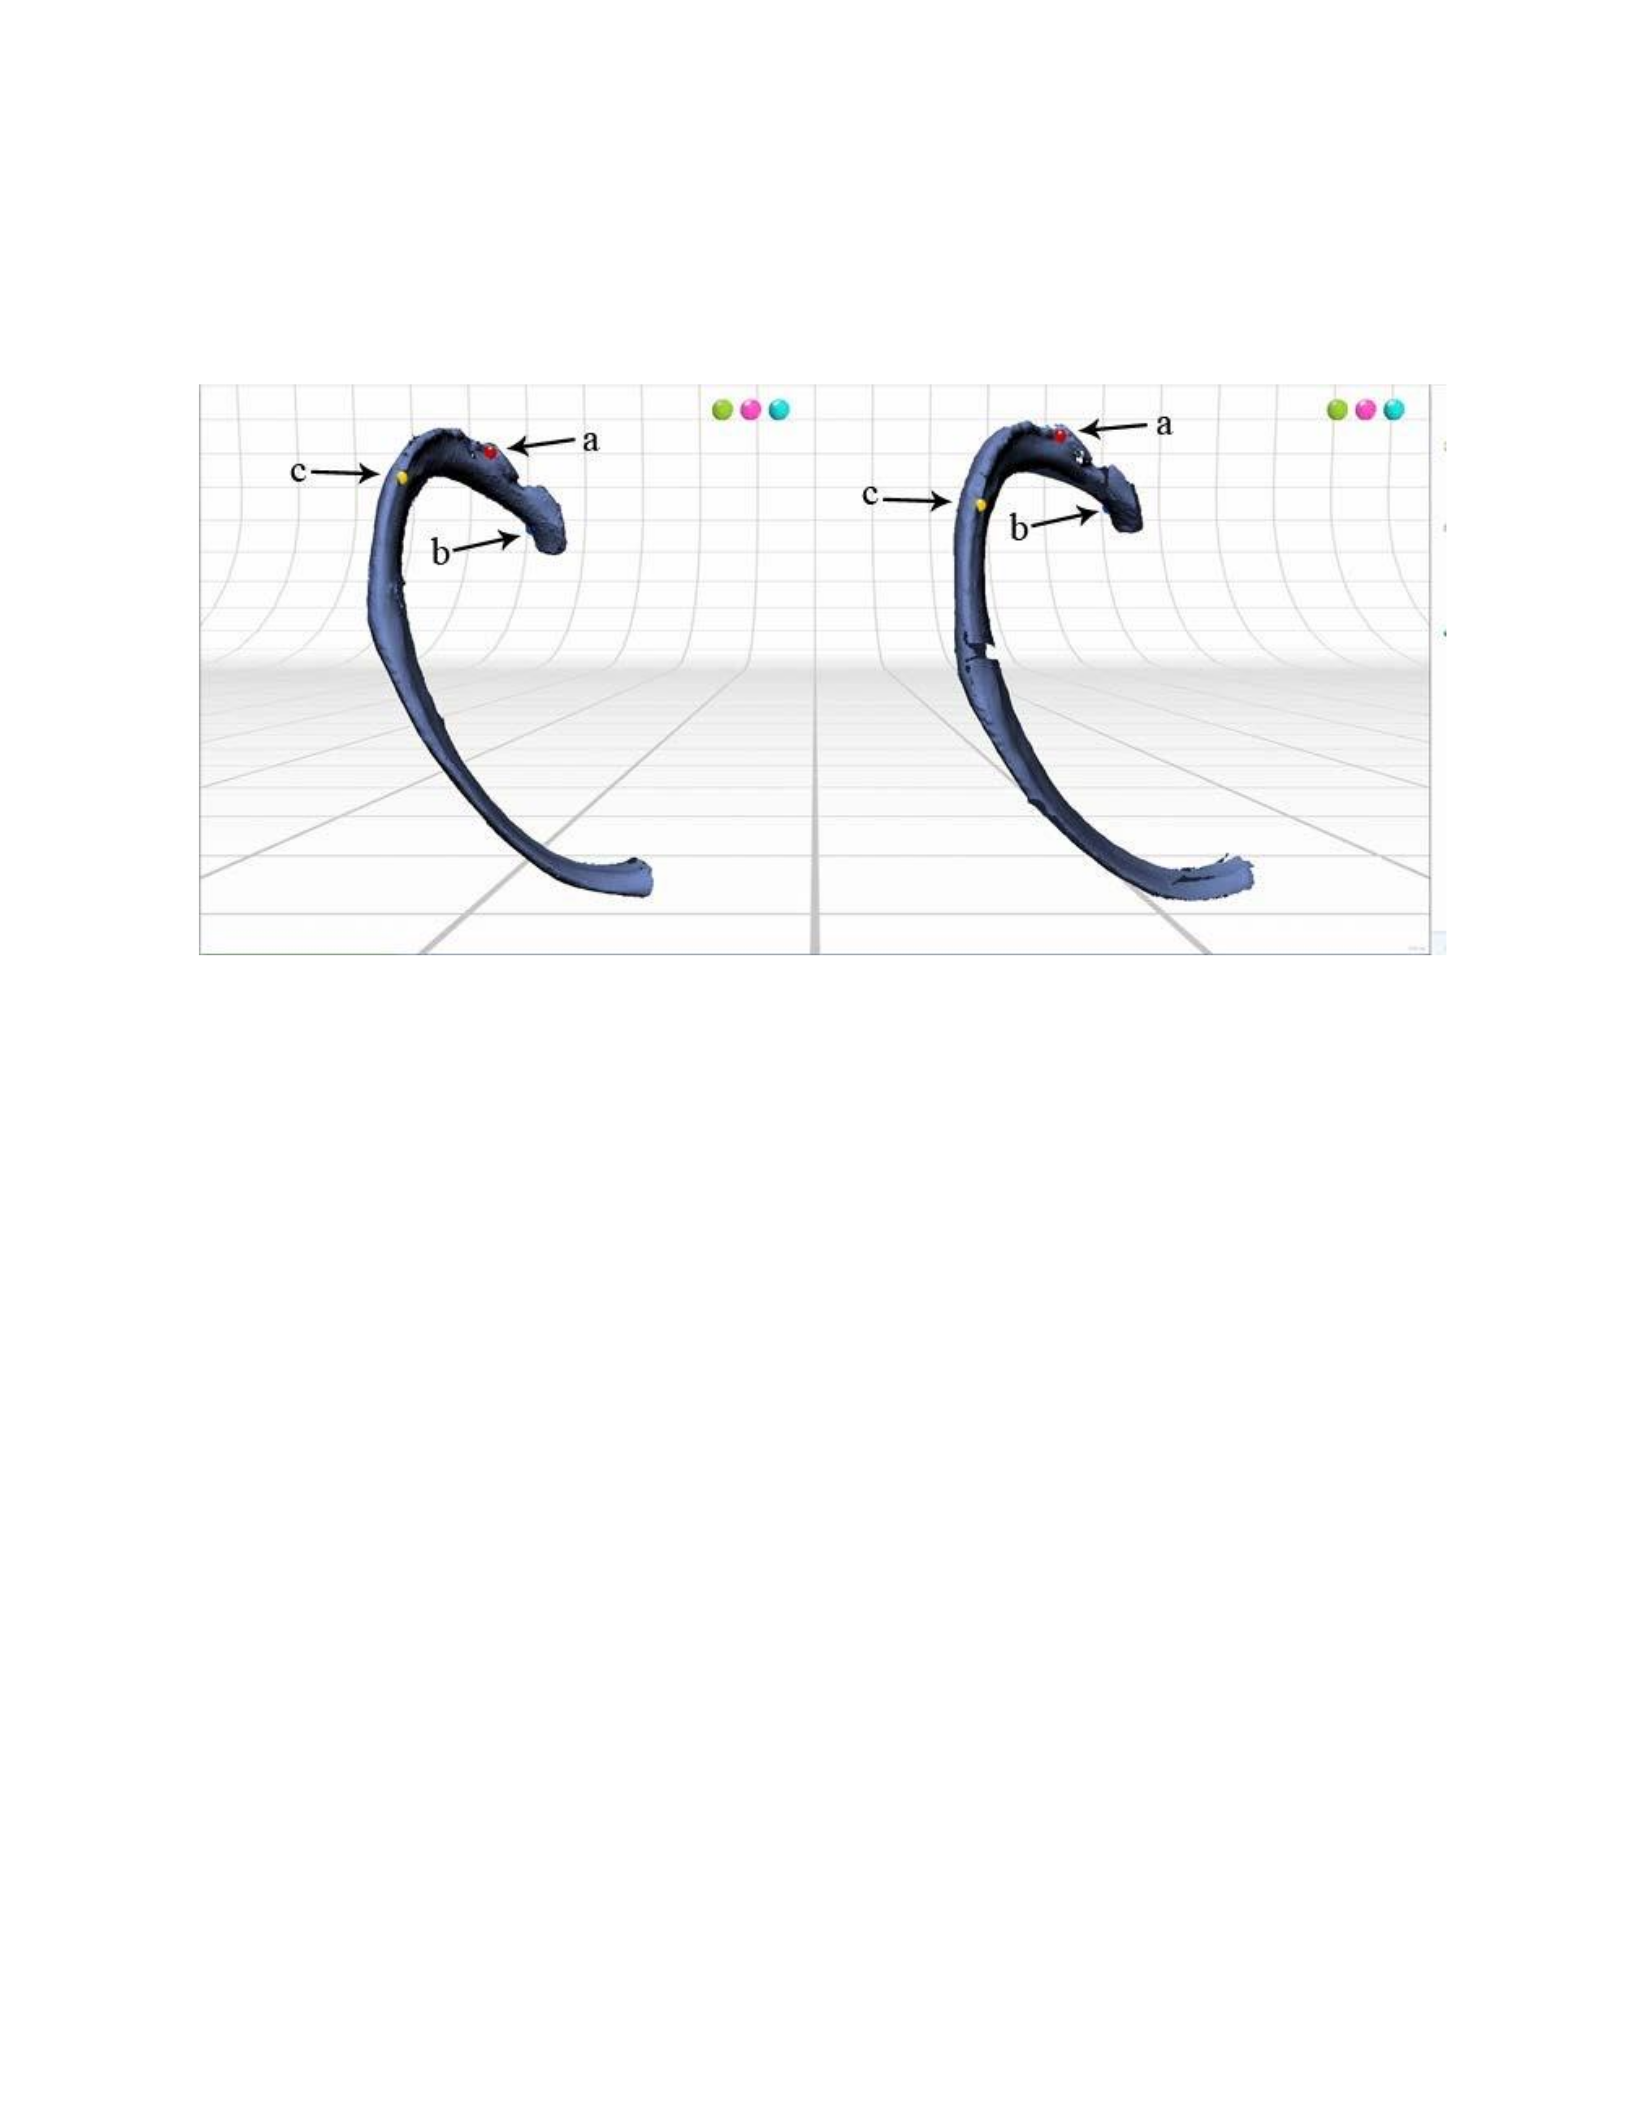
Figure 45: The results of the horizontal (A) and two vertical (B, C) 360° scan sets of the rib.
Figure 46: The tubercle (a) was the only anatomical feature that was used for alignment between these scan sets of
the rib. The other alignment pins (b, c) were placed on small areas where the bone had been chipped.
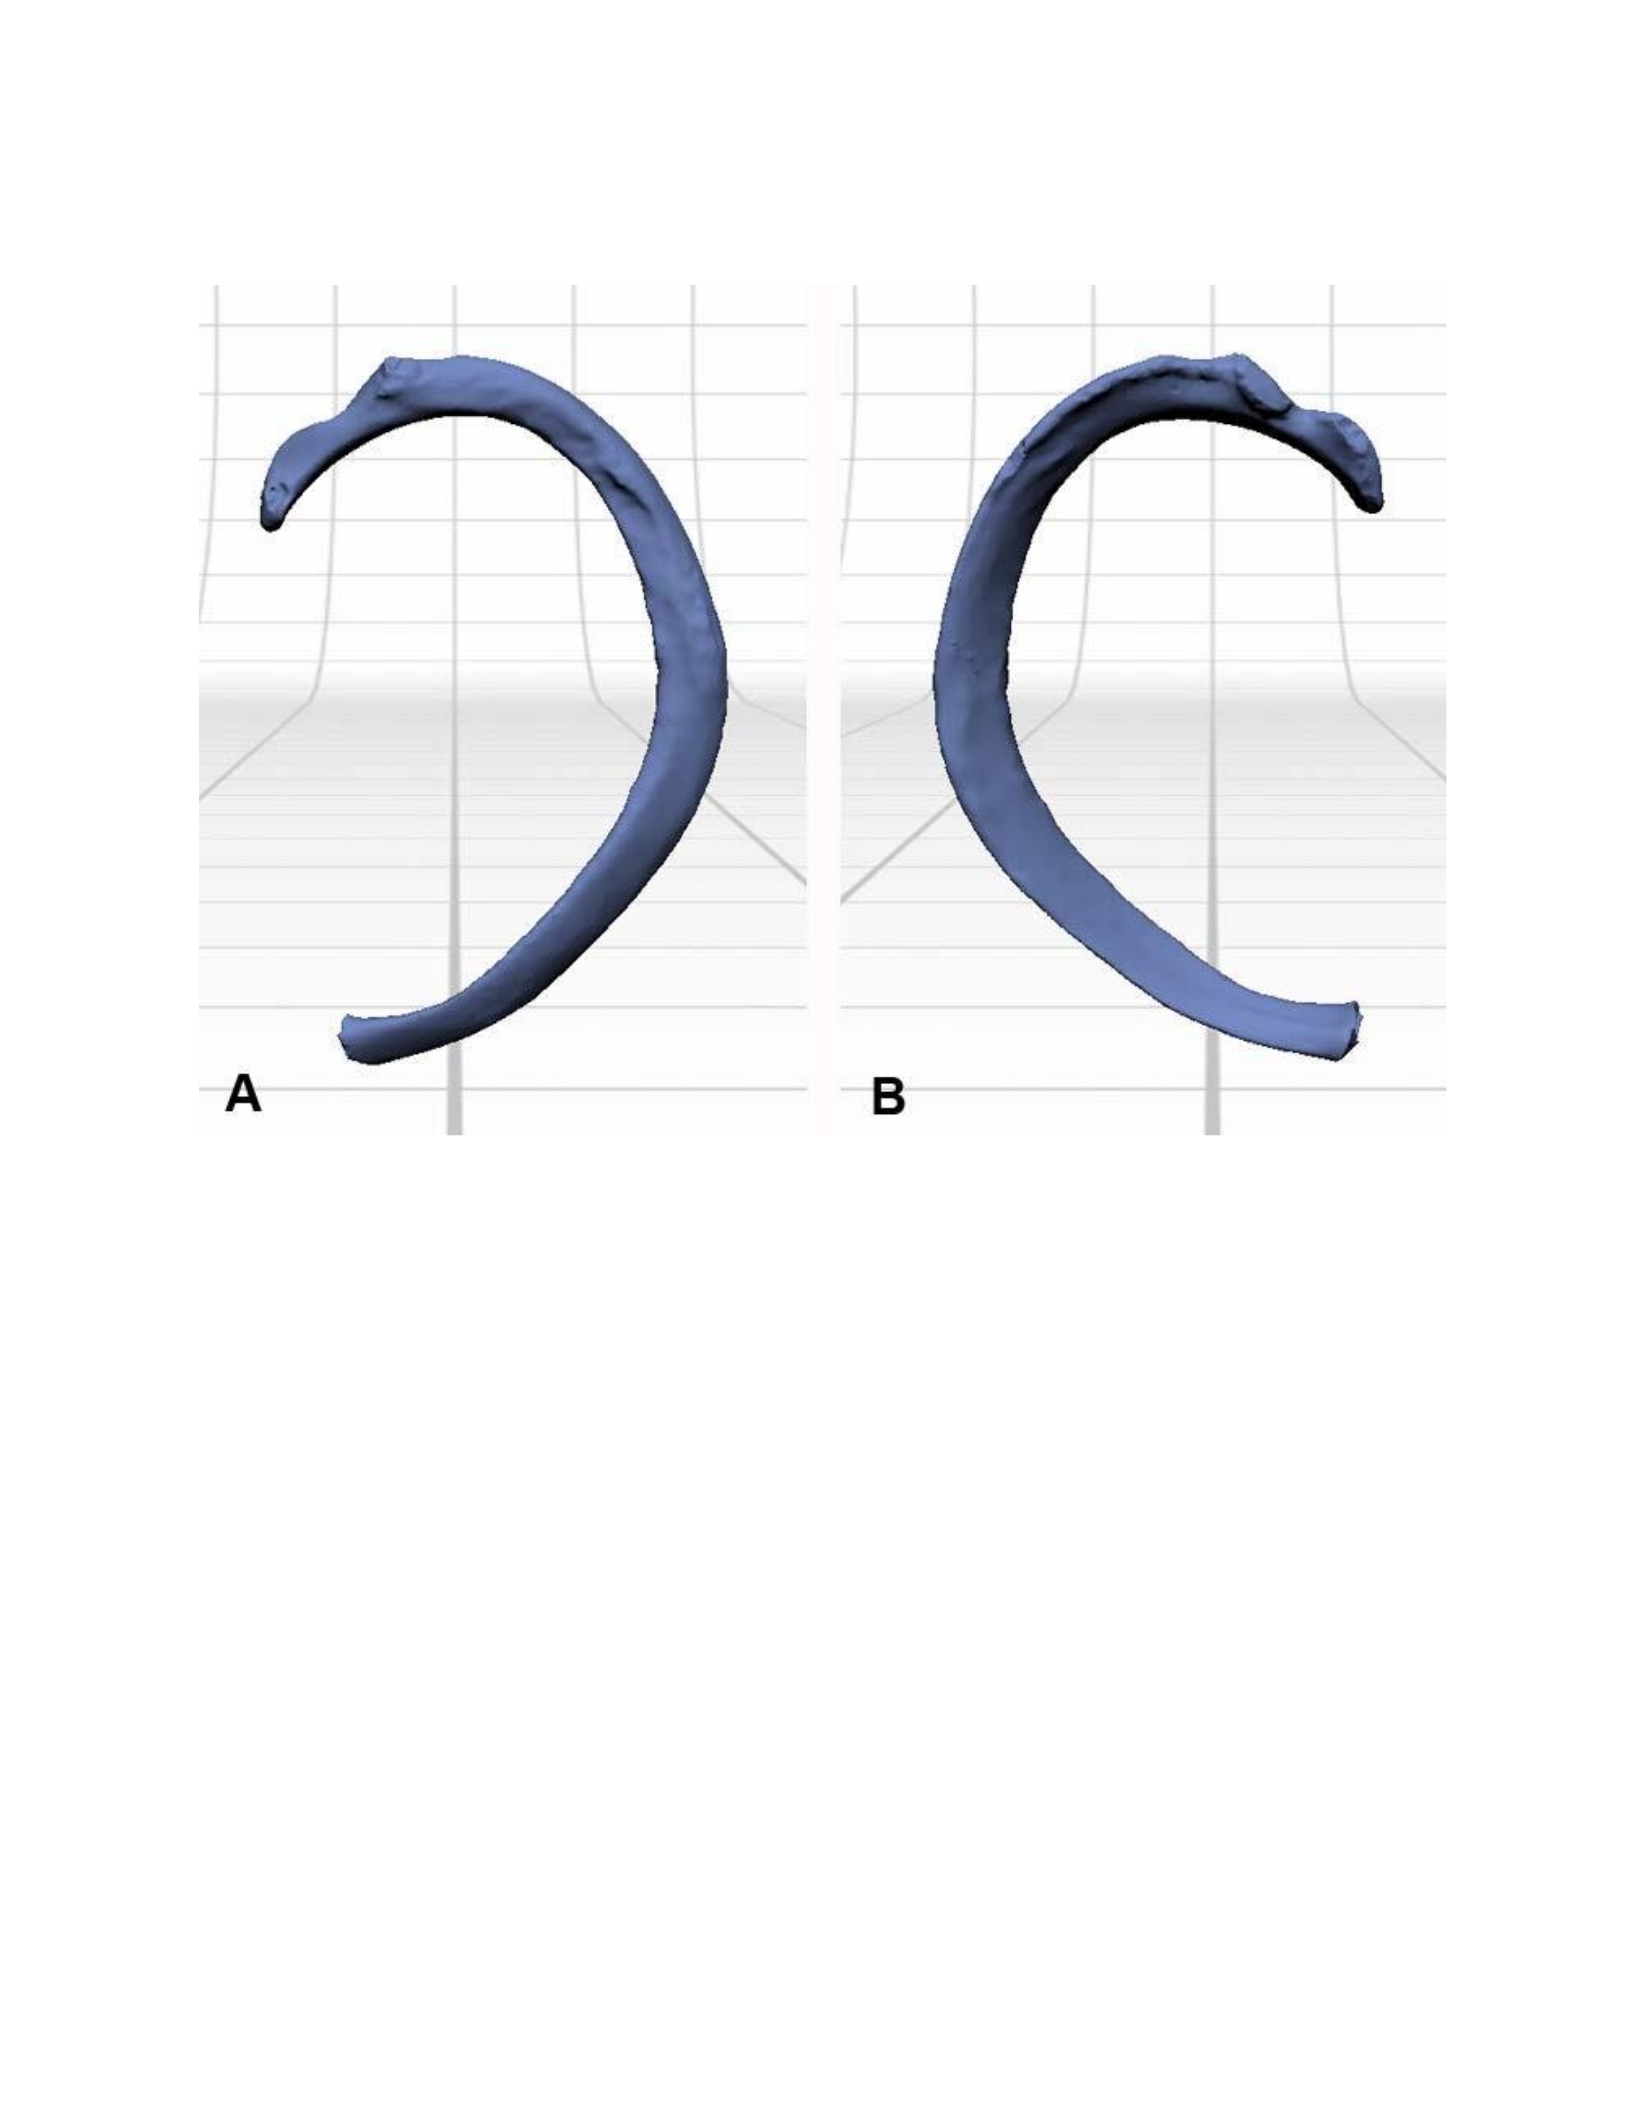
Figure 47: Superior (A) and inferior (B) views of the final rib model.
Femur
The primary challenge in scanning the femur has to do with its length. Scanning within
the ideal range restrictions for the ‘macro’ settings allows only a portion of the bone to be
captured with the 360° scan mode. The first 360° scan set was collected with the femur oriented
in anatomical position, with the epicondyles lying on the part gripper base (Figure 48). The two
supporting prongs of the part gripper were adjusted to pinch the top of the femur in order to
stabilize the bone and prevent it from moving during scanning. The part gripper base was then
lowered so that the bottom of the bone was visible in the scanning window. The second 360°

scan set was acquired with the bone in the same position, but with the base lowered all the way
down to allow further coverage of the bone during scanning. The third set was created with the
femur flipped, with the head of the femur lying on the part gripper base. The supporting prongs
pinched the shaft of the femur just below the epicondyles. A fourth scan set was acquired
similarly as the second, with the part gripper base lowered as much as possible to increase
coverage. When attempting to align the first and second sets with the third and fourth sets, a
significant portion of the mid shaft of the femur was still missing and it was not possible to align
the sets together. The scan settings were changed from ‘macro’ to ‘wide’, changing the ideal
distance of the object from the scanner from 6.5” to 17”. This allowed a greater extent of the
femur to be scanned. However, after attempting to align the scan set collected with the ‘wide’
setting, the mid-shaft of the femur was found to contain few anatomical features that could be
used for alignment. The results of the wide scan settings also resulted in comparatively lower
resolution than the macro scan settings (Figure 50), compounding the challenge of manual
alignment.
A new strategy was attempted, by placing the scanner on a platform in order to increase
the vertical range of the scanner setup. Several large textbooks were stacked on top of each other
to create a platform that measured approximately 10” tall (Figure 48). This allowed the entire
length of the femur to be scanned in several 360° scan sets by adjusting the height of the
partgripper accordingly. Five 360° scan sets were acquired, each time adjusting the height of the
part gripper slightly to maintain overlap while capturing new data. The part gripper components
were not trimmed before aligning the scans since they provided references for alignment along
the mid-shaft where there are few distinct anatomical features to be used for matching the

alignment pins. After aligning the five scans, the part gripper was then removed with the trim
tool. The part gripper prongs prevented the laser stripe from reaching certain areas of the mid-
shaft, so an additional 360° scan set was created after adjusting the prongs to an area that in
which scan data had been obtained. After these 360° scan sets were created, two single scans
were acquired in order to capture the superior aspect of the head of the femur and the inferior
surface of the epicondyles (Figure 49). These were easy to align to the existing sets. After the
scan sets were aligned, a water-tight model of the femur was successfully created (Figure 51 A &
B). Due to the size of the femur, and the relatively featureless surfaces of the mid-shaft, the
femur was a challenge to scan, yet it was still possible generate an accurate water-tight model.
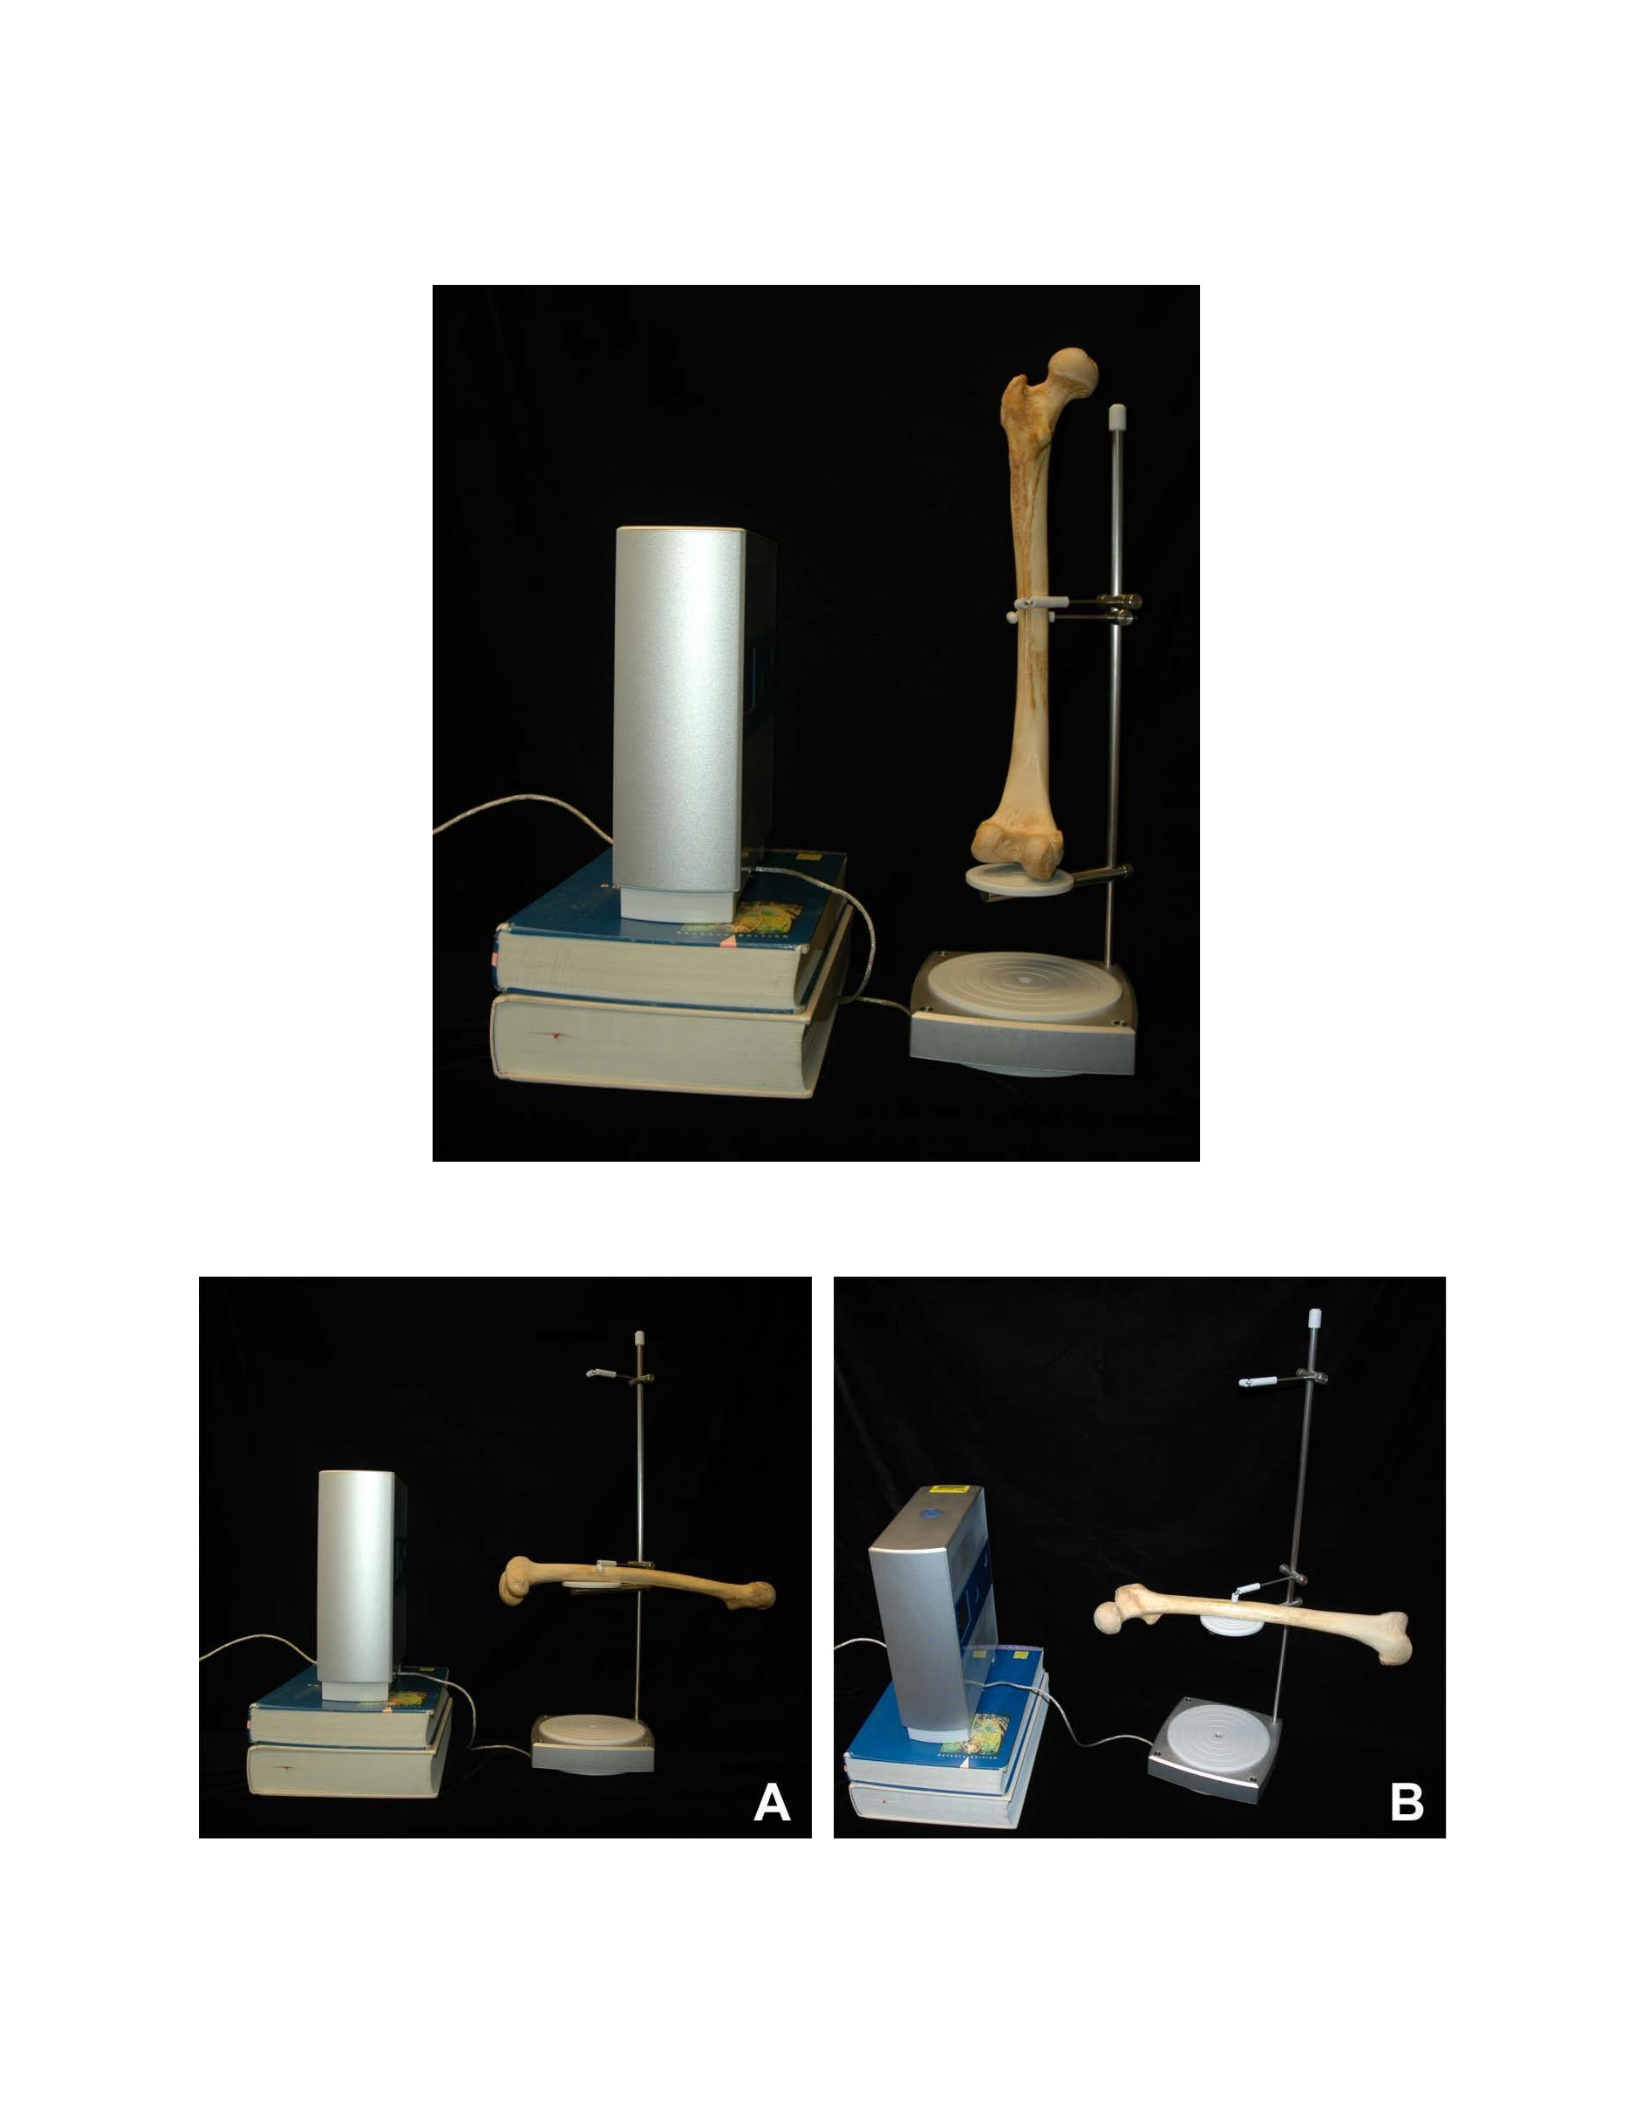
Figure 48: The first series of scans was created with the femur oriented in anatomical position. The height of the
part-gripper was then adjusted several times until the majority of the surfaces were obtained.
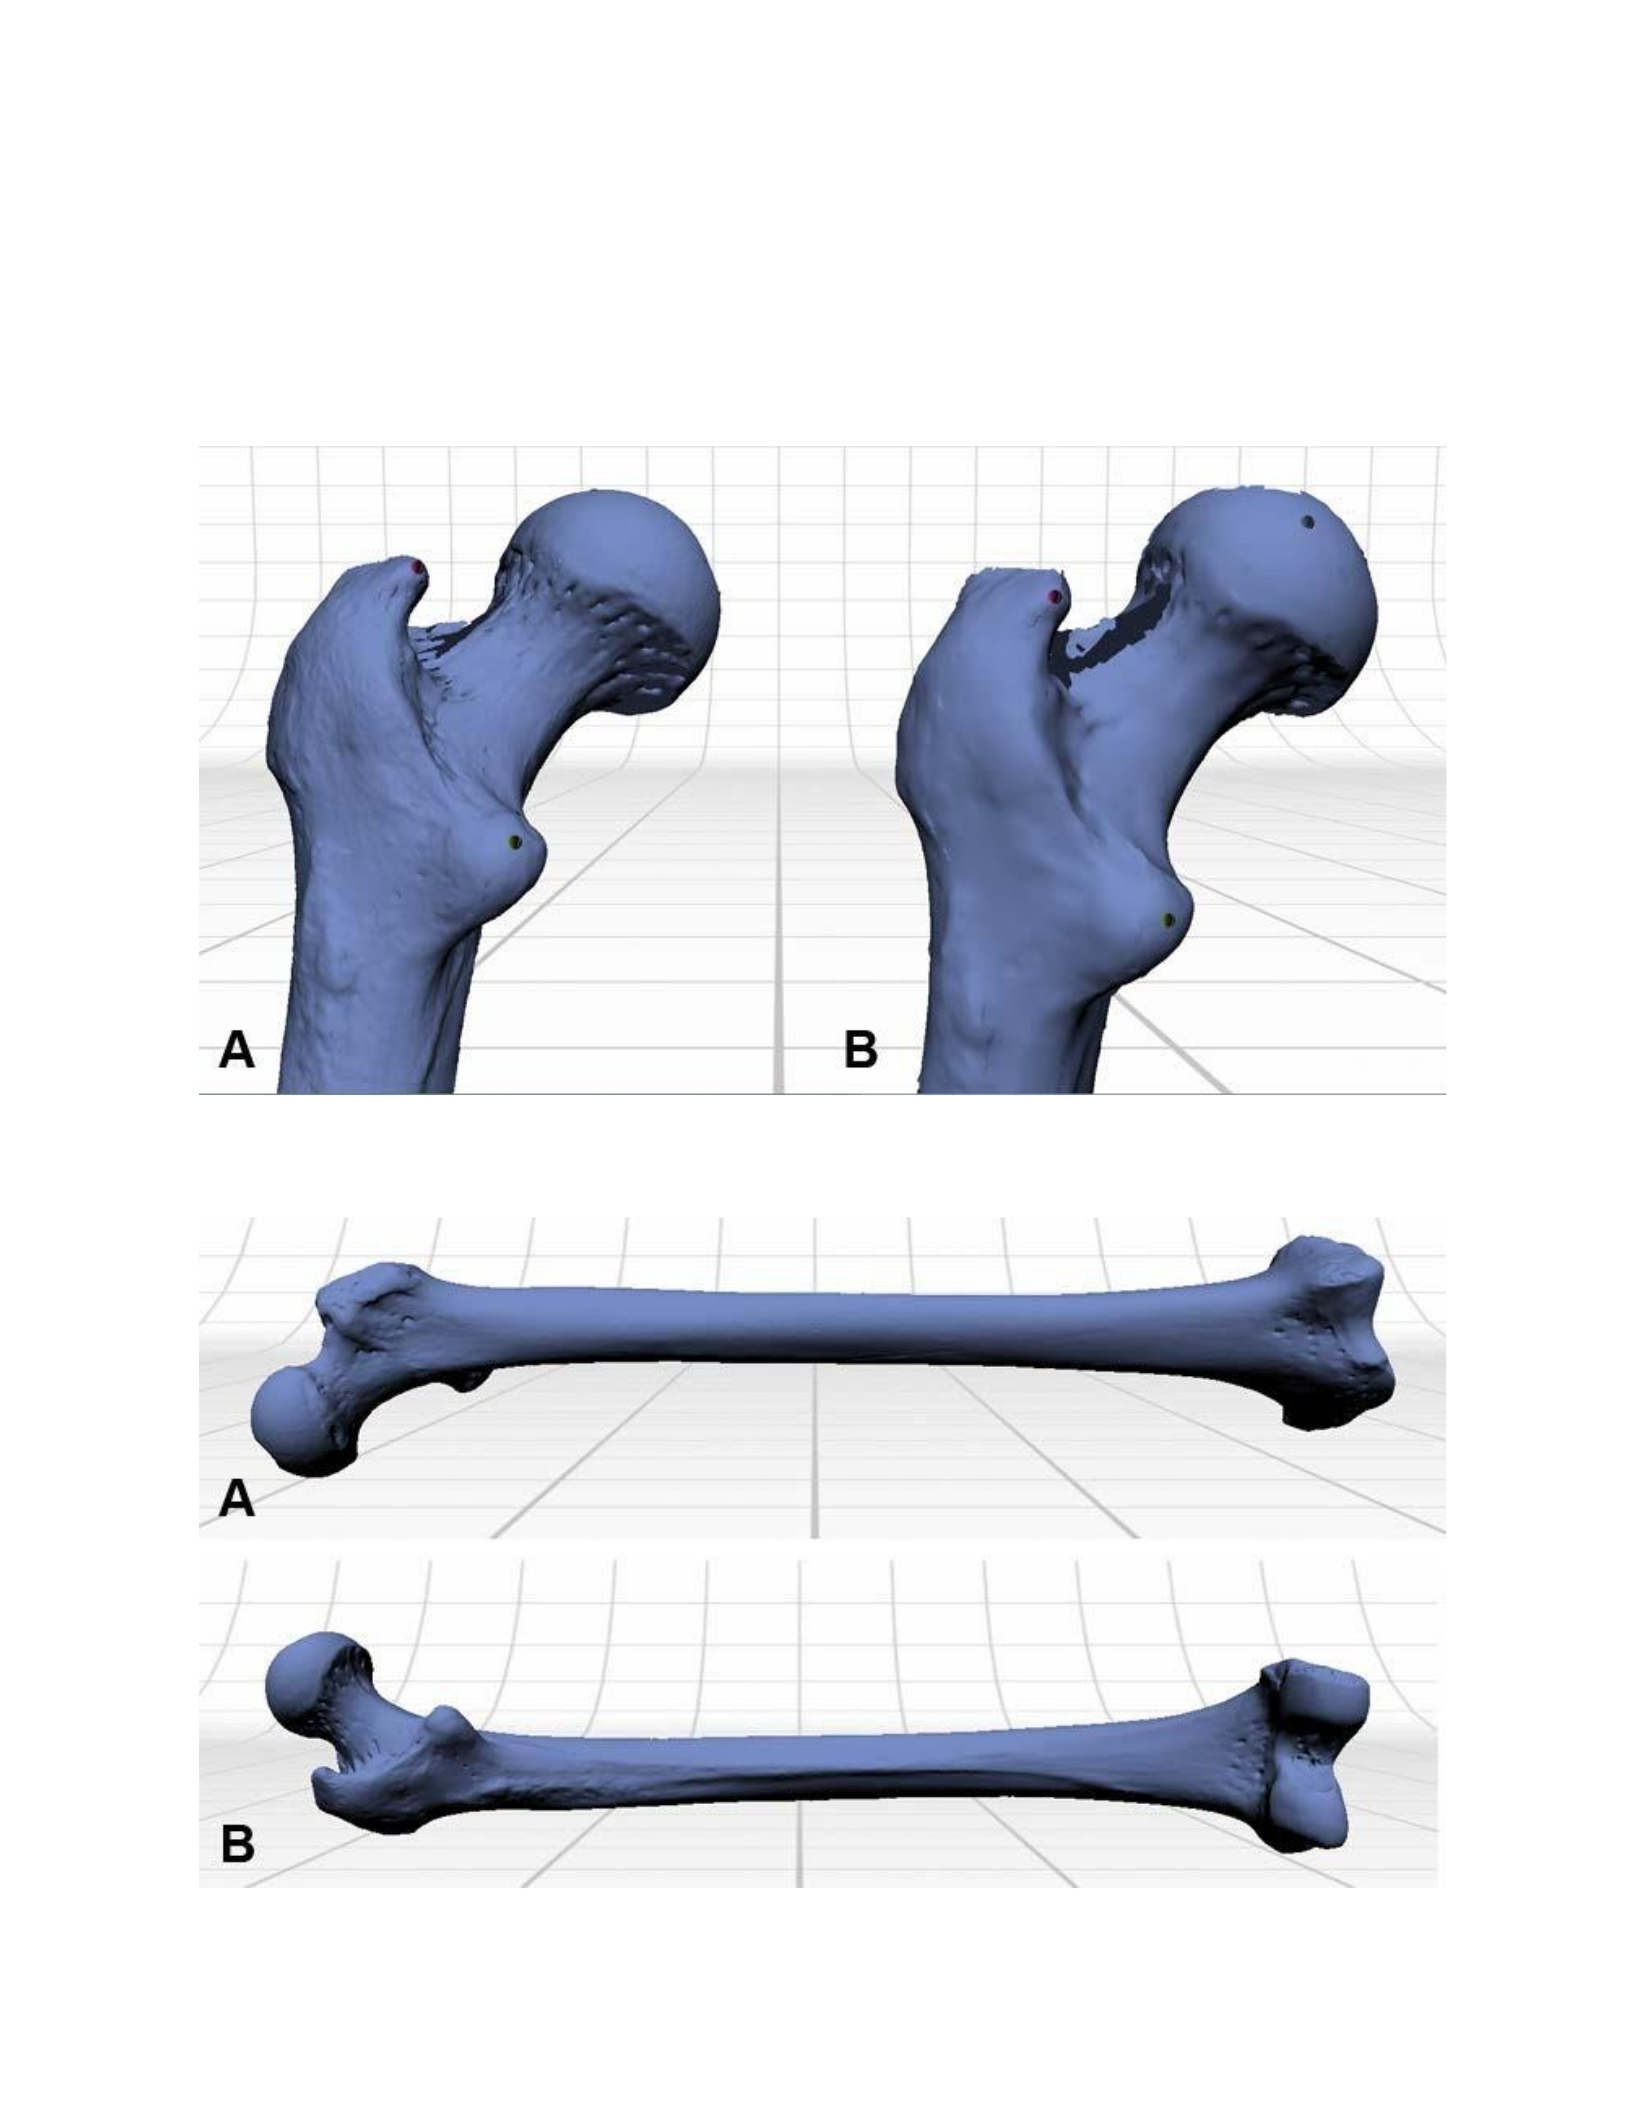
Figure 49: In order to obtain the inferior surfaces of the epicondyles and the superior aspects of the head of the
femur and greater trochanter, the length of the femur was oriented horizontally. A series of single scans was
collected, and aligned with the existing scan data.
Figure 50: A view of the posterior surface of the proximal end of the femur illustrates the difference in resolution
between the macro (A) and wide-area (B) scan settings.

Figure 51: An anterior (A) and posterior (B) view of the final fused model of the femur.
Cranium
The complex morphology of the cranium makes it the most challenging bone in the
human skeleton to document with a laser scanner. As with the other bones, the majority of the
surfaces were obtained with a series of 360° scan sets. The first scan set was created with the
cranium in anatomical position (Figure 52 A), and the second was created with the cranium lying
on its side (Figure 52 B). Bracket scans were collected with the cranium oriented in a variety of
positions depending on the missing data that was being obtained (Figure 52 C). These 360 scan
sets resulted in the scan data shown in Figure 53 (A, B & C). The underside of the cranium and
orbits were the most difficult areas to scan. For the underside of the cranium the most
challenging areas were the teeth, the posterior aperture of the nasal cavity and the surfaces of the
maxilla, in addition to the surfaces of the temporal and sphenoid bones that are medial to the
zygomatic arch. These surfaces were obtained using several bracket scans with careful
positioning of the cranium with the part-gripper.
Because the cranium has numerous openings and cavities many of which could not be
entirely scanned, the creation of a water-tight model could not be achieved without significant
distortions (Figure 54 A:a & b). In order to create a more accurate model without any holes, it
would be necessary to use a scan data processing program that has the ability to manually fill
individual holes in the scan data. An alternative model was created with the Fuse function
without the hole-fill setting (Figure 54 B).
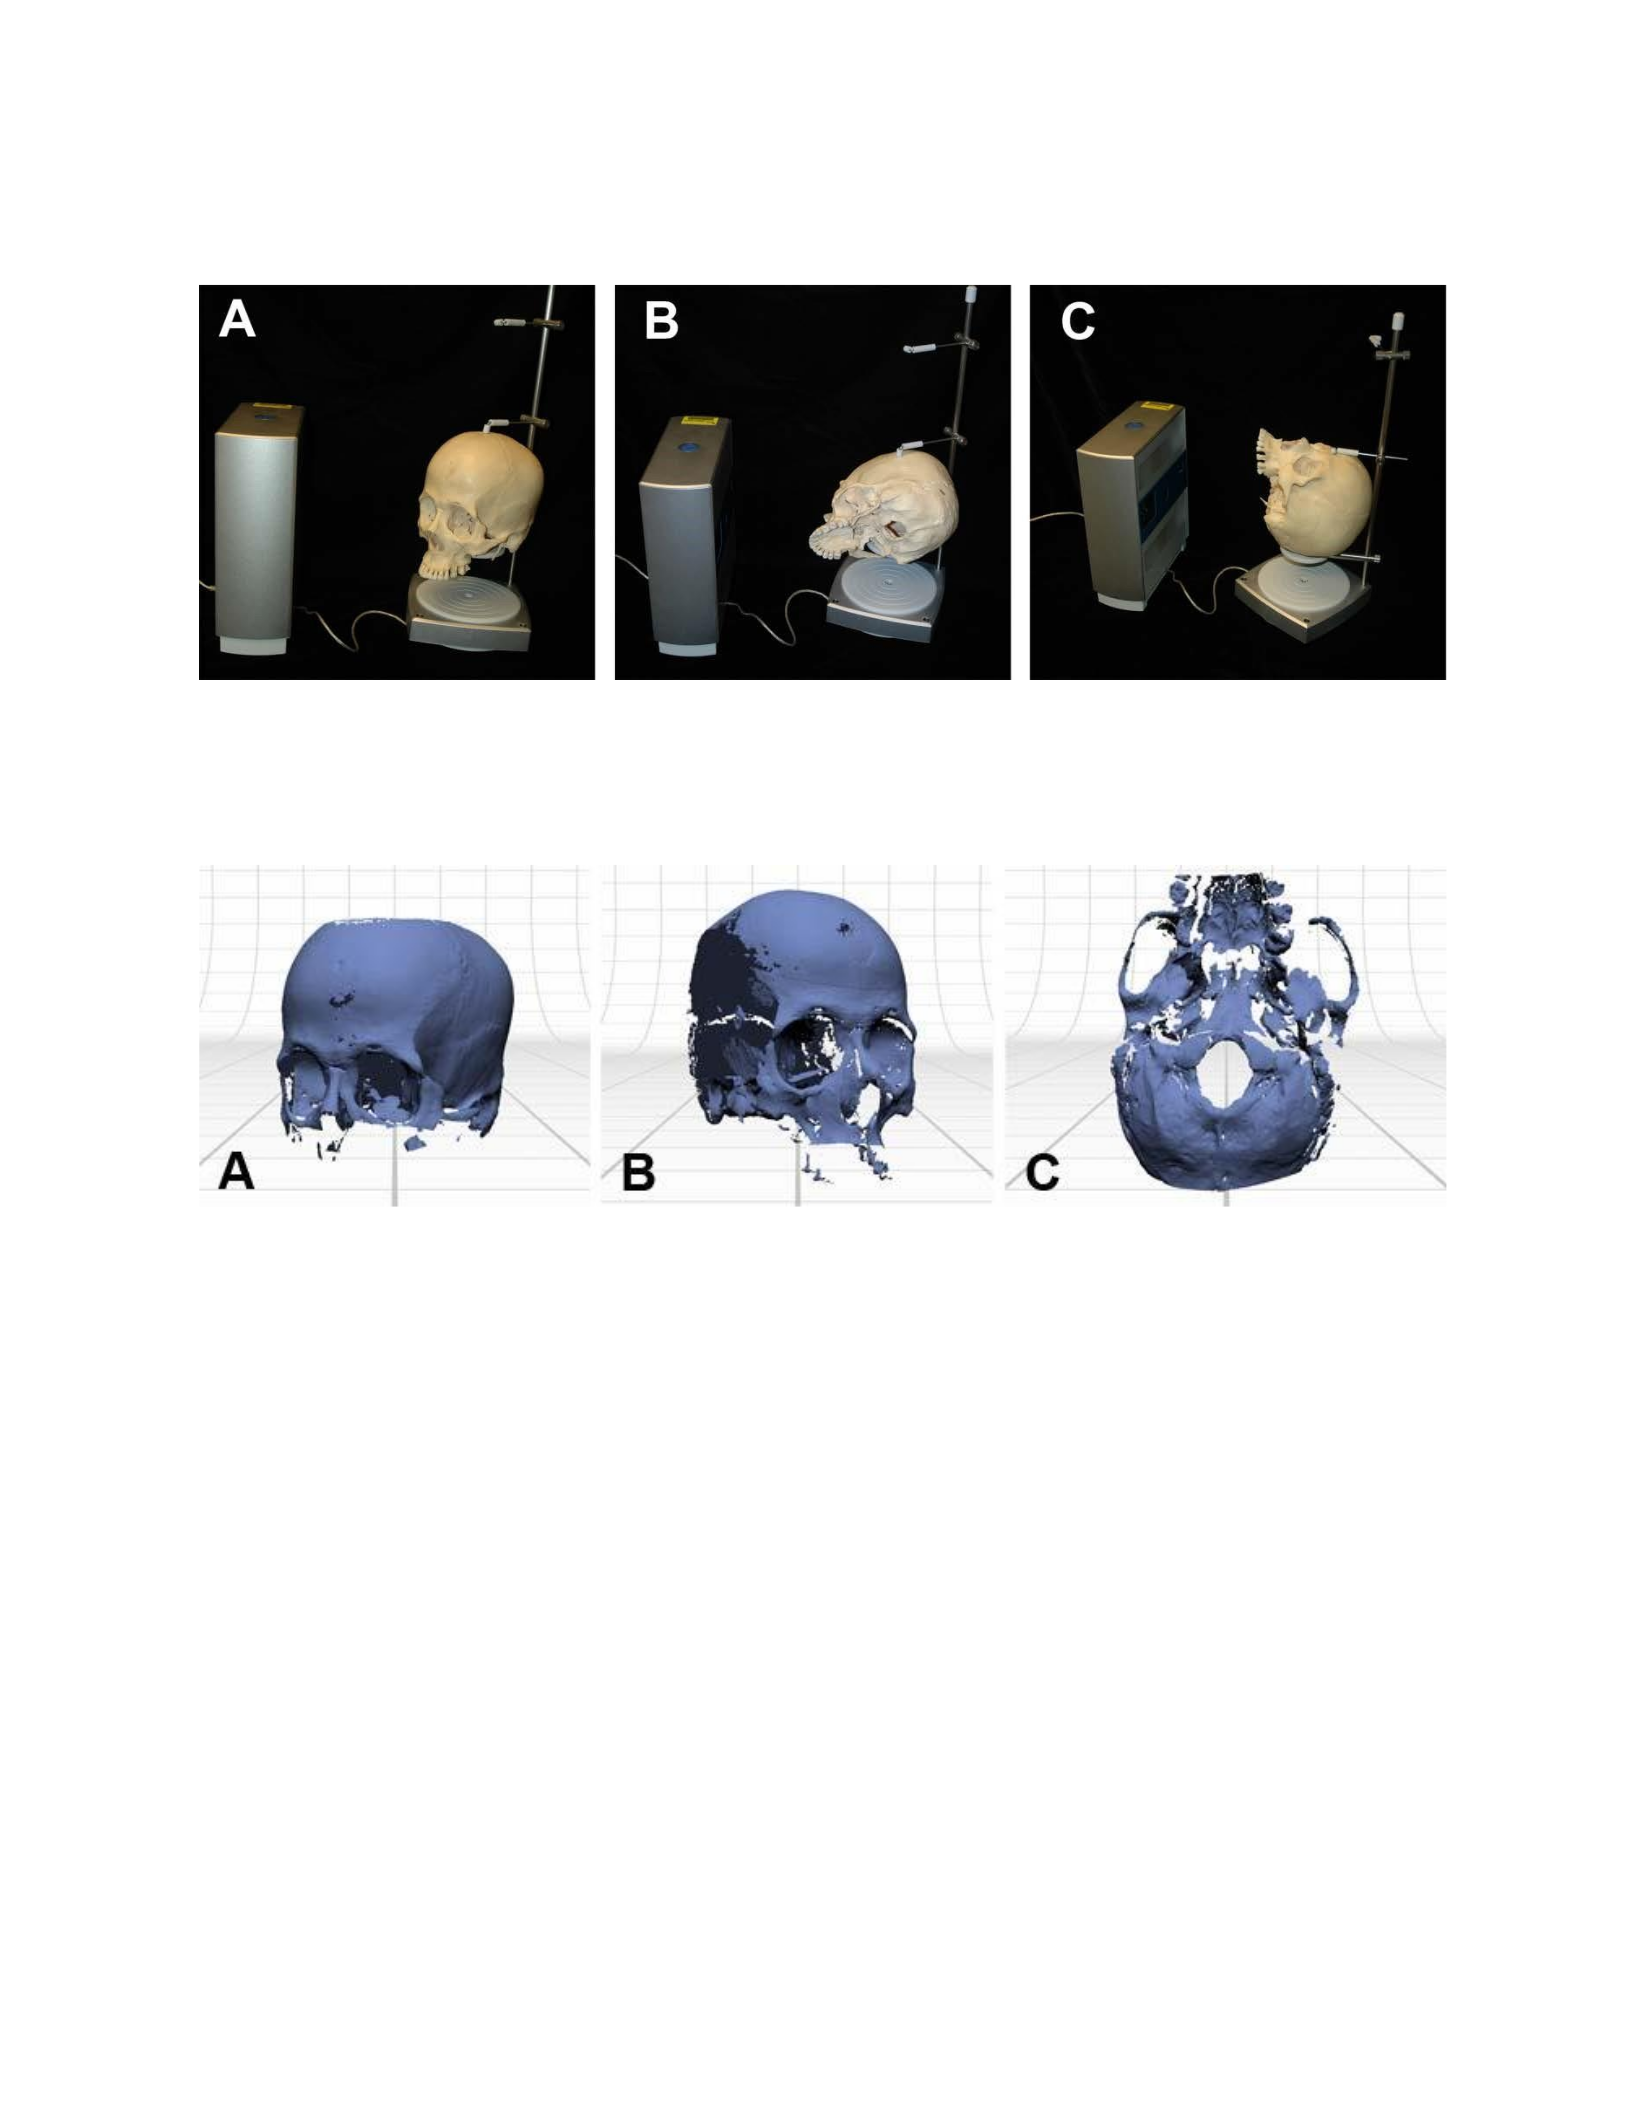
Figure 52: Many of the surfaces of the cranium were obtained through a series of 360° scan sets. The first scan was
created with the cranium oriented in anatomical position (A). The second set was made with the lateral aspect placed
flat on the part gripper base (B). Multiple bracket scans were performed with the cranium oriented in different
positions depending on the data that was missing (C).
Figure 53: The greater part of the cranium was obtained through 360° scan sets with the bone oriented in a
horizontal (A) and vertical (B) position. Bracket scans were used to obtain missing data (C).
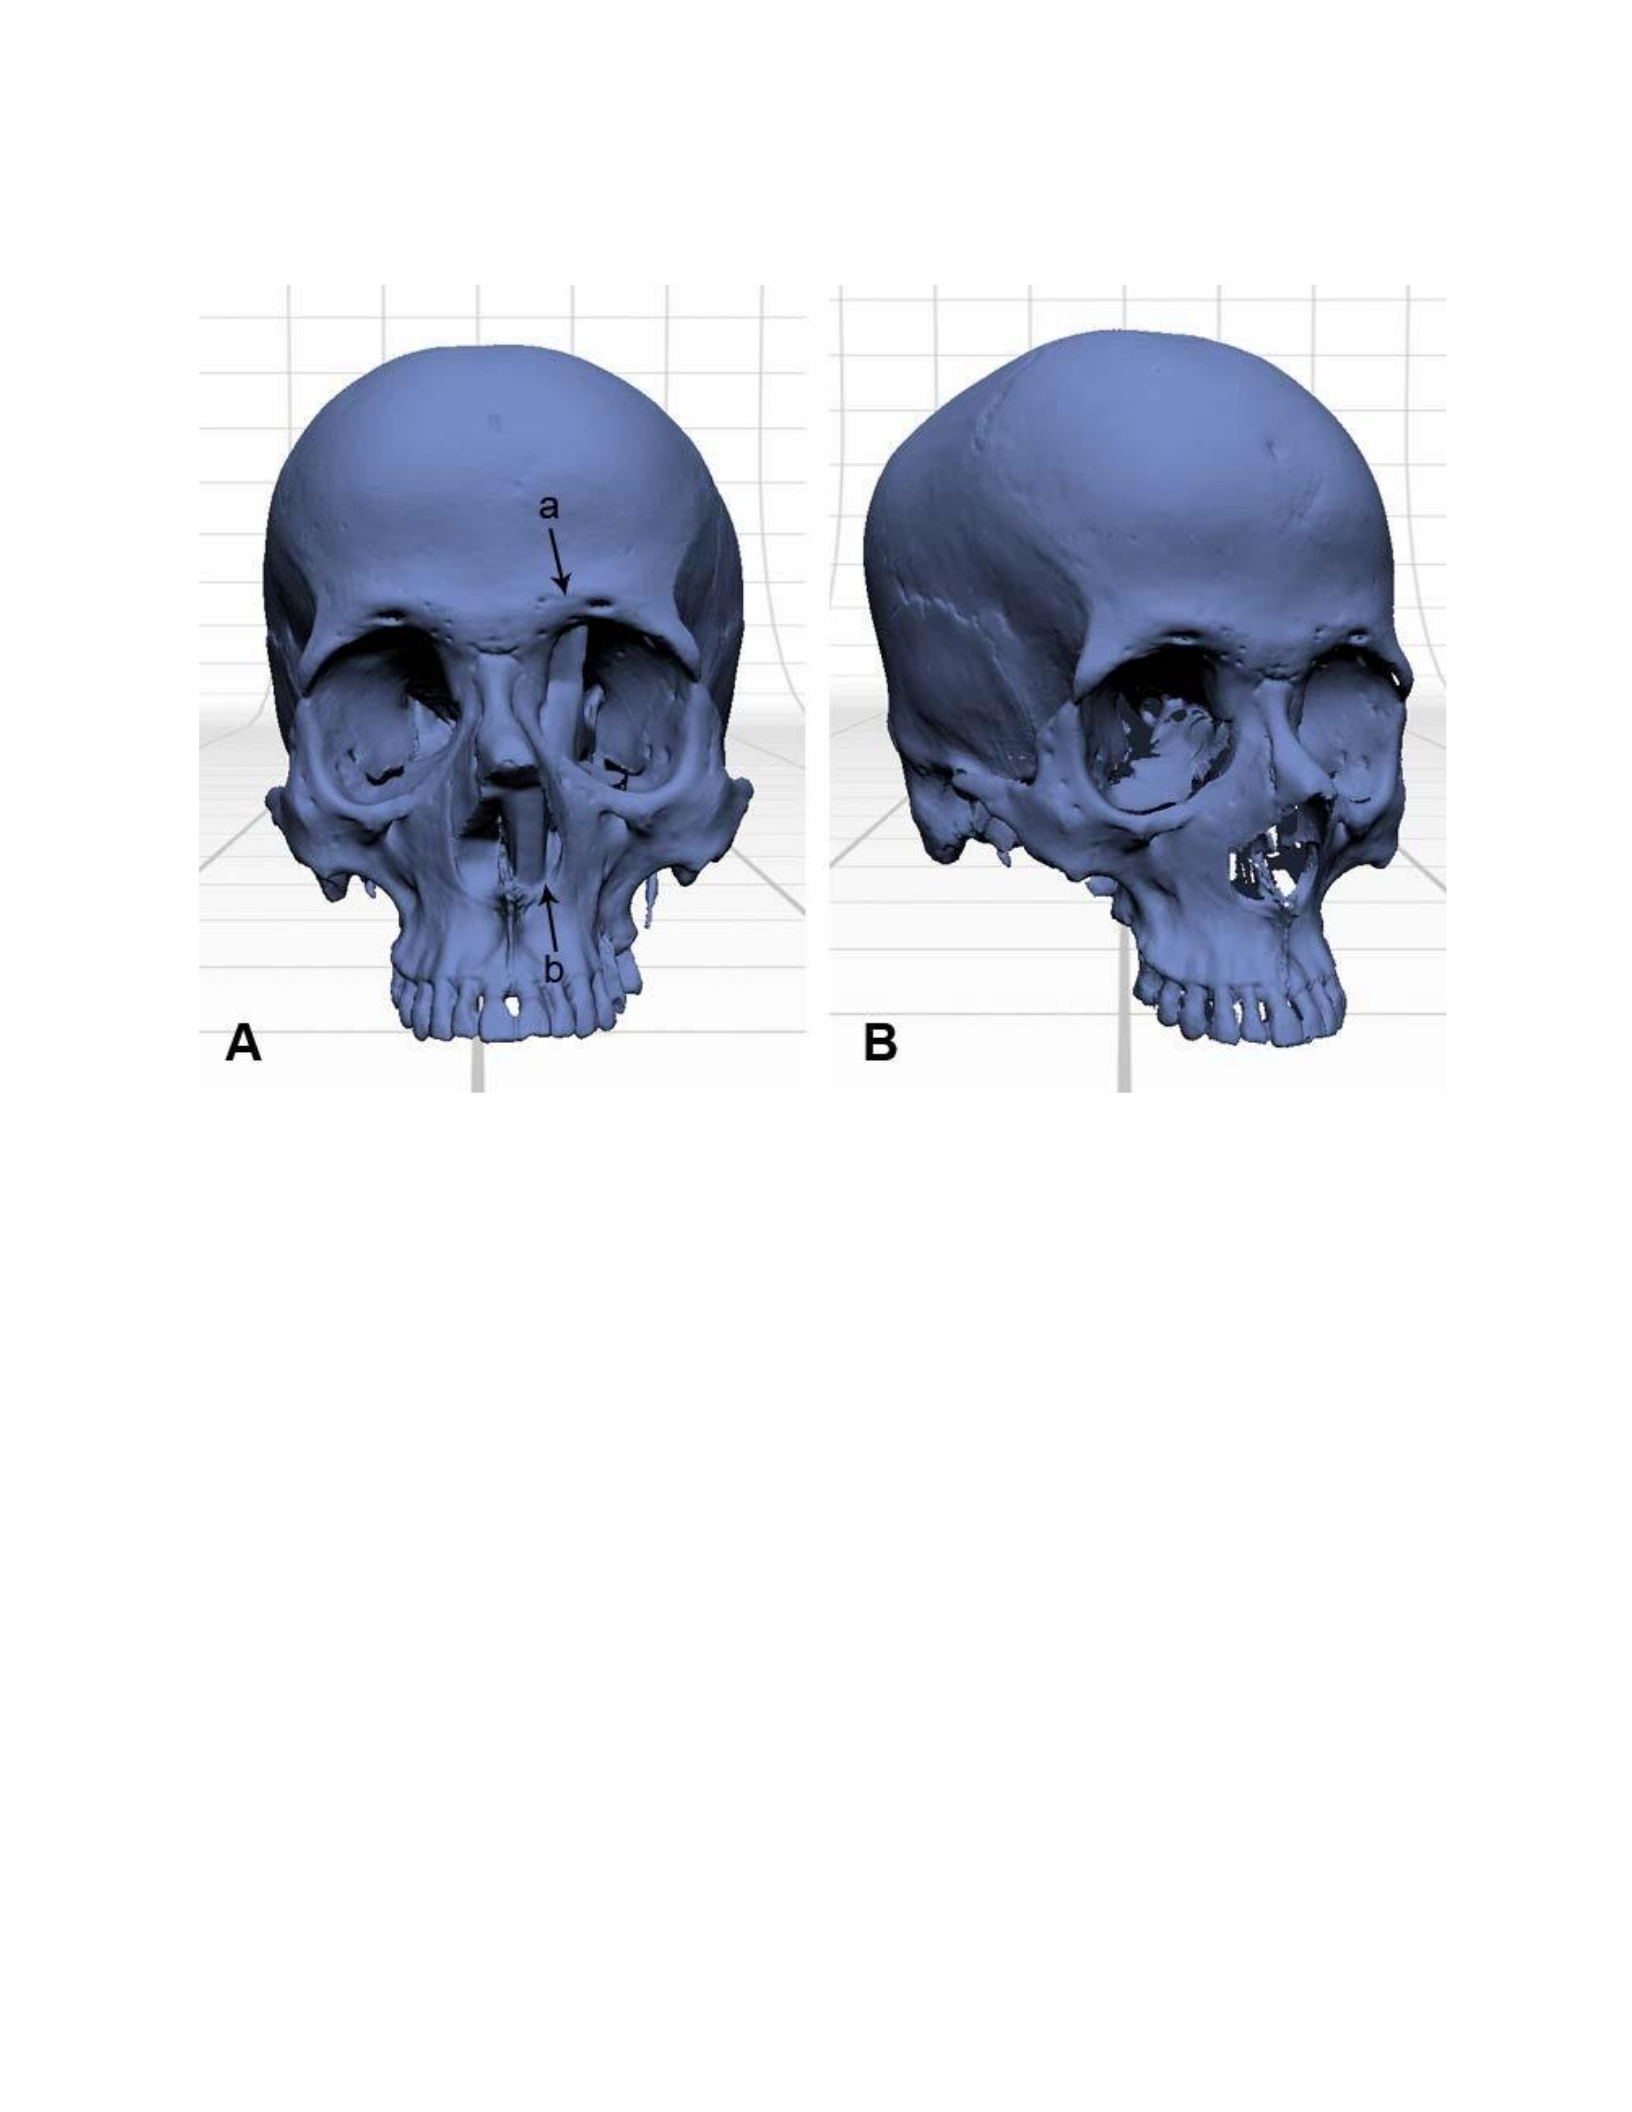
Figure 54: Fusing with the water-tight settings (A) produced distortions in the left orbit (a) and the nasal cavity (b).
These distortions were to significant to ignore, so the Fuse function was performed without an hole-filling settings
(B).
Mandible
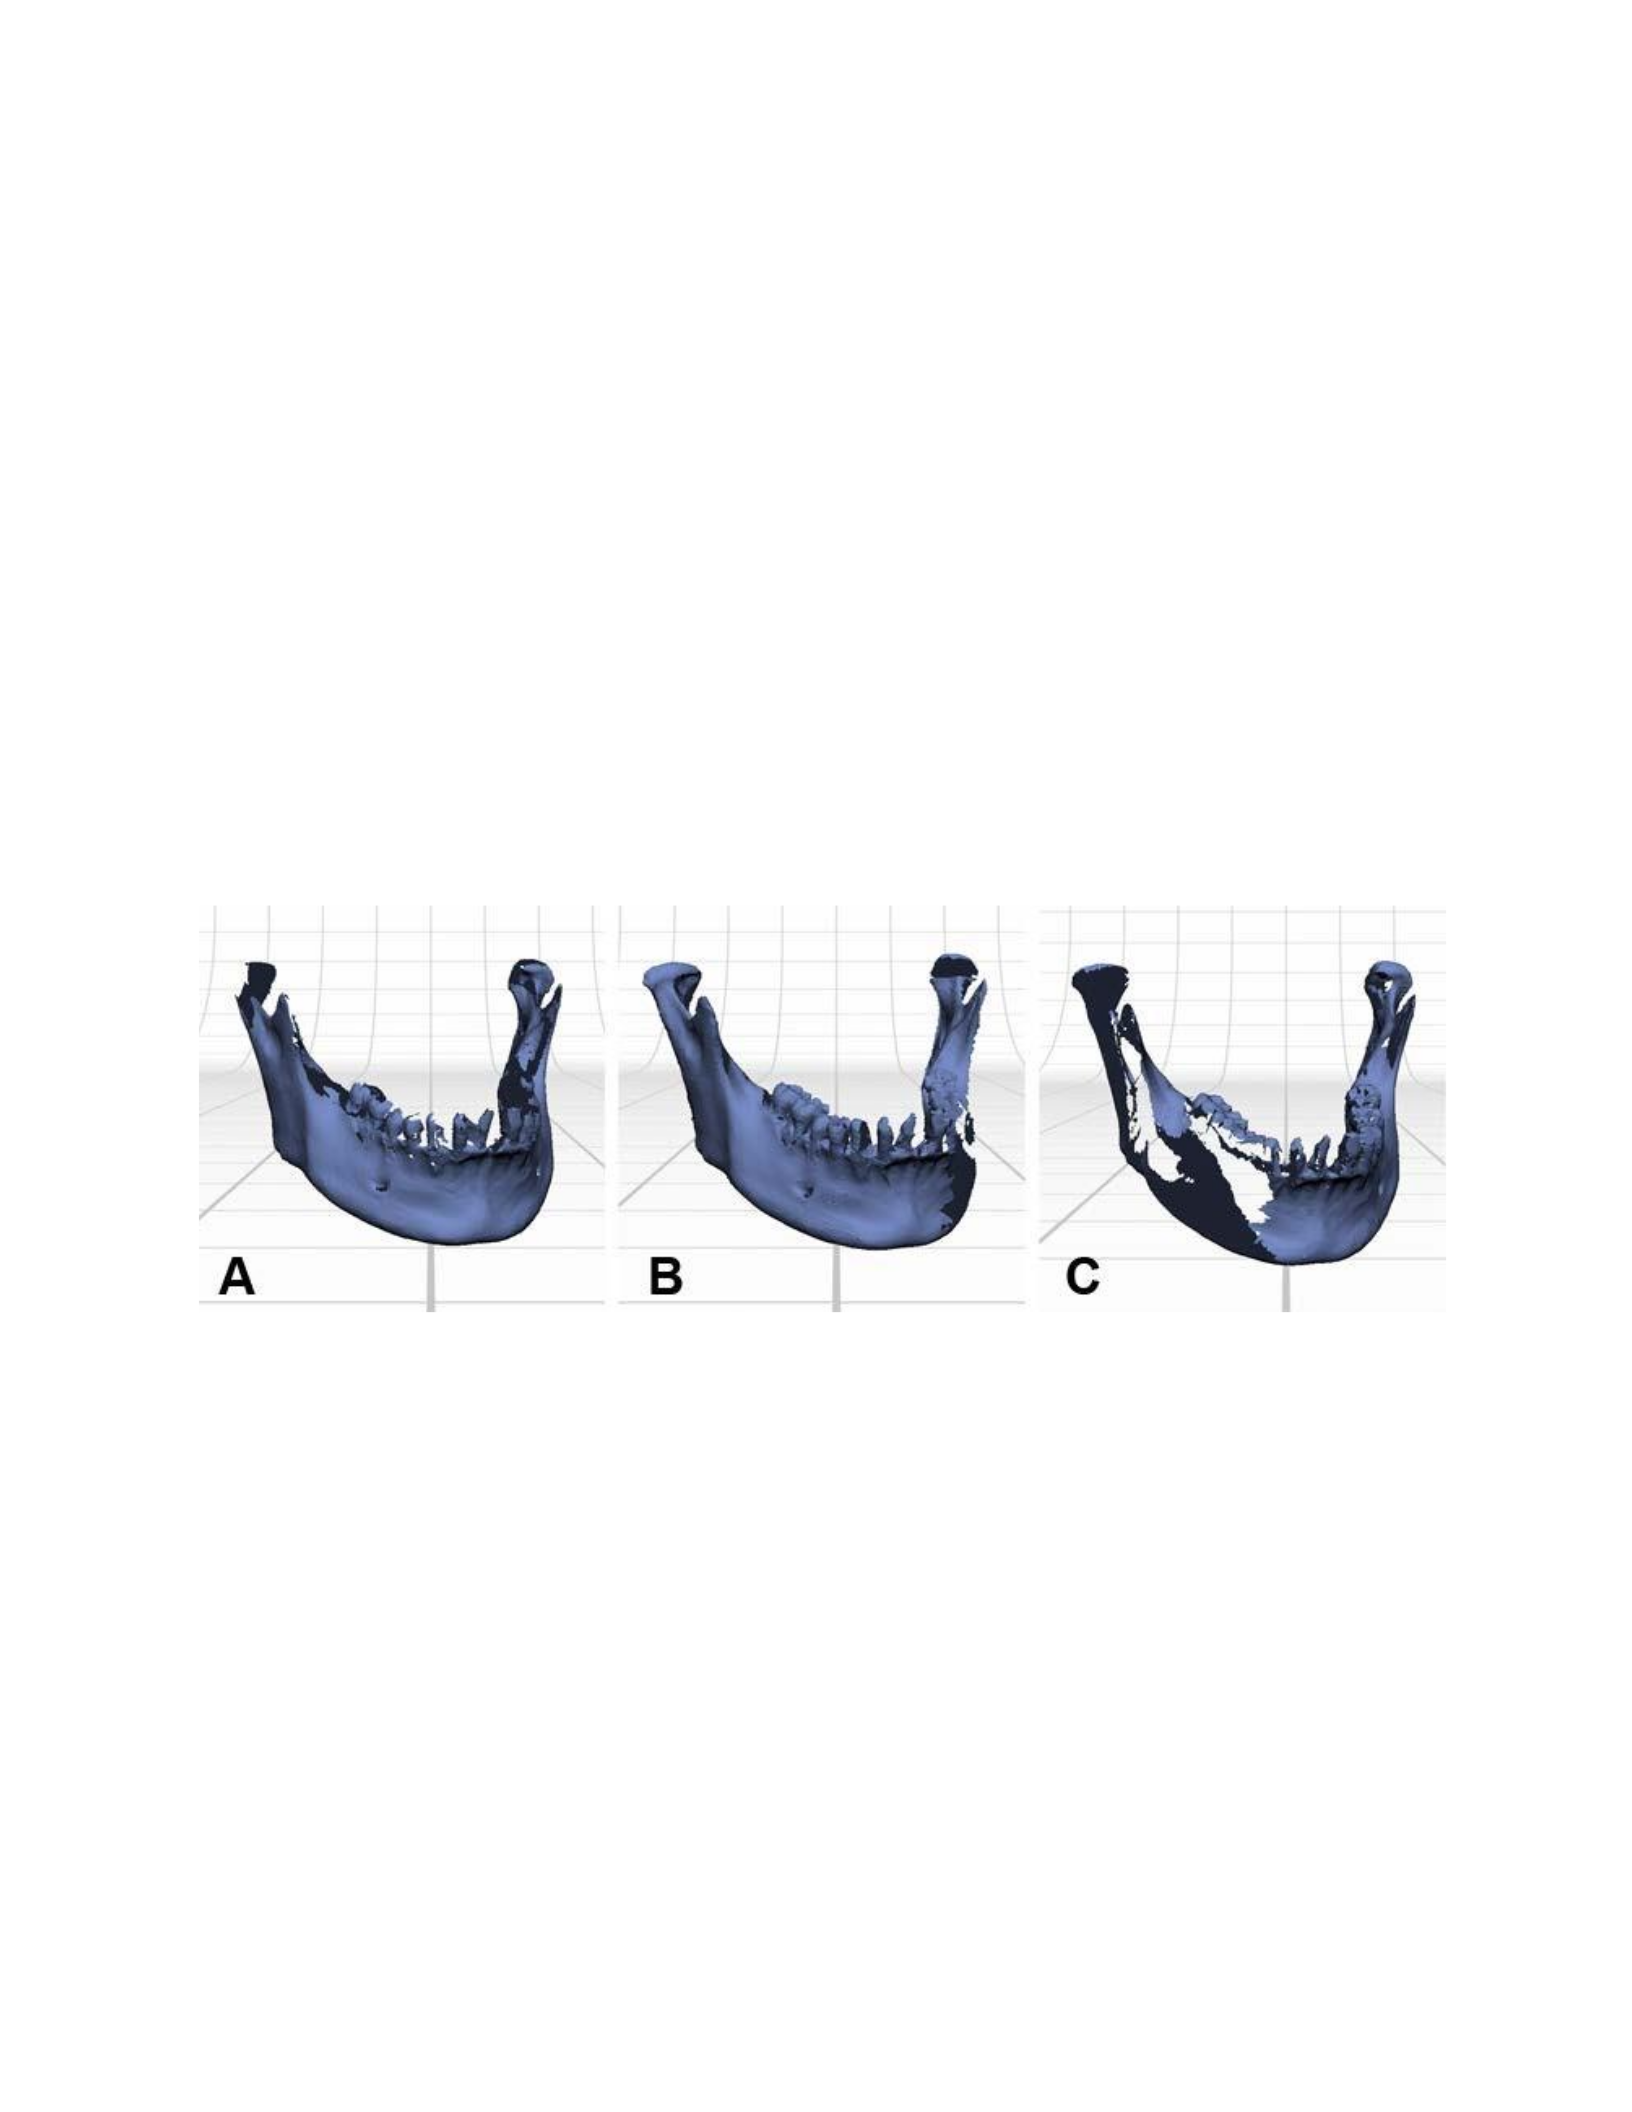
As with the other bones, the mandible was digitized through a series of 360 scan sets. The
first scan set was collected with the mandible in anatomical position (Figure 55 A), with the
inferior border of the horizontal ramus resting on the part-gripper base. The second and third sets
were collected with the lateral surface of the ascending ramus placed flat on the part-gripper
base, one with the right ascending ramus (Figure 55 B) and the other with the left ascending
ramus placed on the part-gripper base (Figure 55 C). After aligning these scan sets together, the
majority of the data was captured. However, the scan data of the teeth did not present a clean and
accurate surface. The scanning of the teeth resulted in surface noise and artifacts between the
interproximal surfaces of the teeth (Figure 56 a & b). This is likely caused by the slight
translucency of the enamel, which would absorb the lasers coming from the scanner. The
problem areas were removed by detaching the affected scans from the original scan sets and
manually removing the undesired areas using the polyline selection tool (Figure 57: A, B, C
&D). A water-tight model was created using the Fuse function with the scan sets before (Figure
58 A) and after (Figure 58 B) manually removing the noise and artifacts from the teeth. Despite
manually removing the problem areas, there was no appreciable difference between the two
models.
Figure 55: The mandible was acquired with three sets of 360 scans. The first was made with the mandible in
anatomical position (A). The second and third were made with the lateral surface of the ascending ramus placed flat
on the part-gripper base, one set for the right side (B) and another for the left (C).
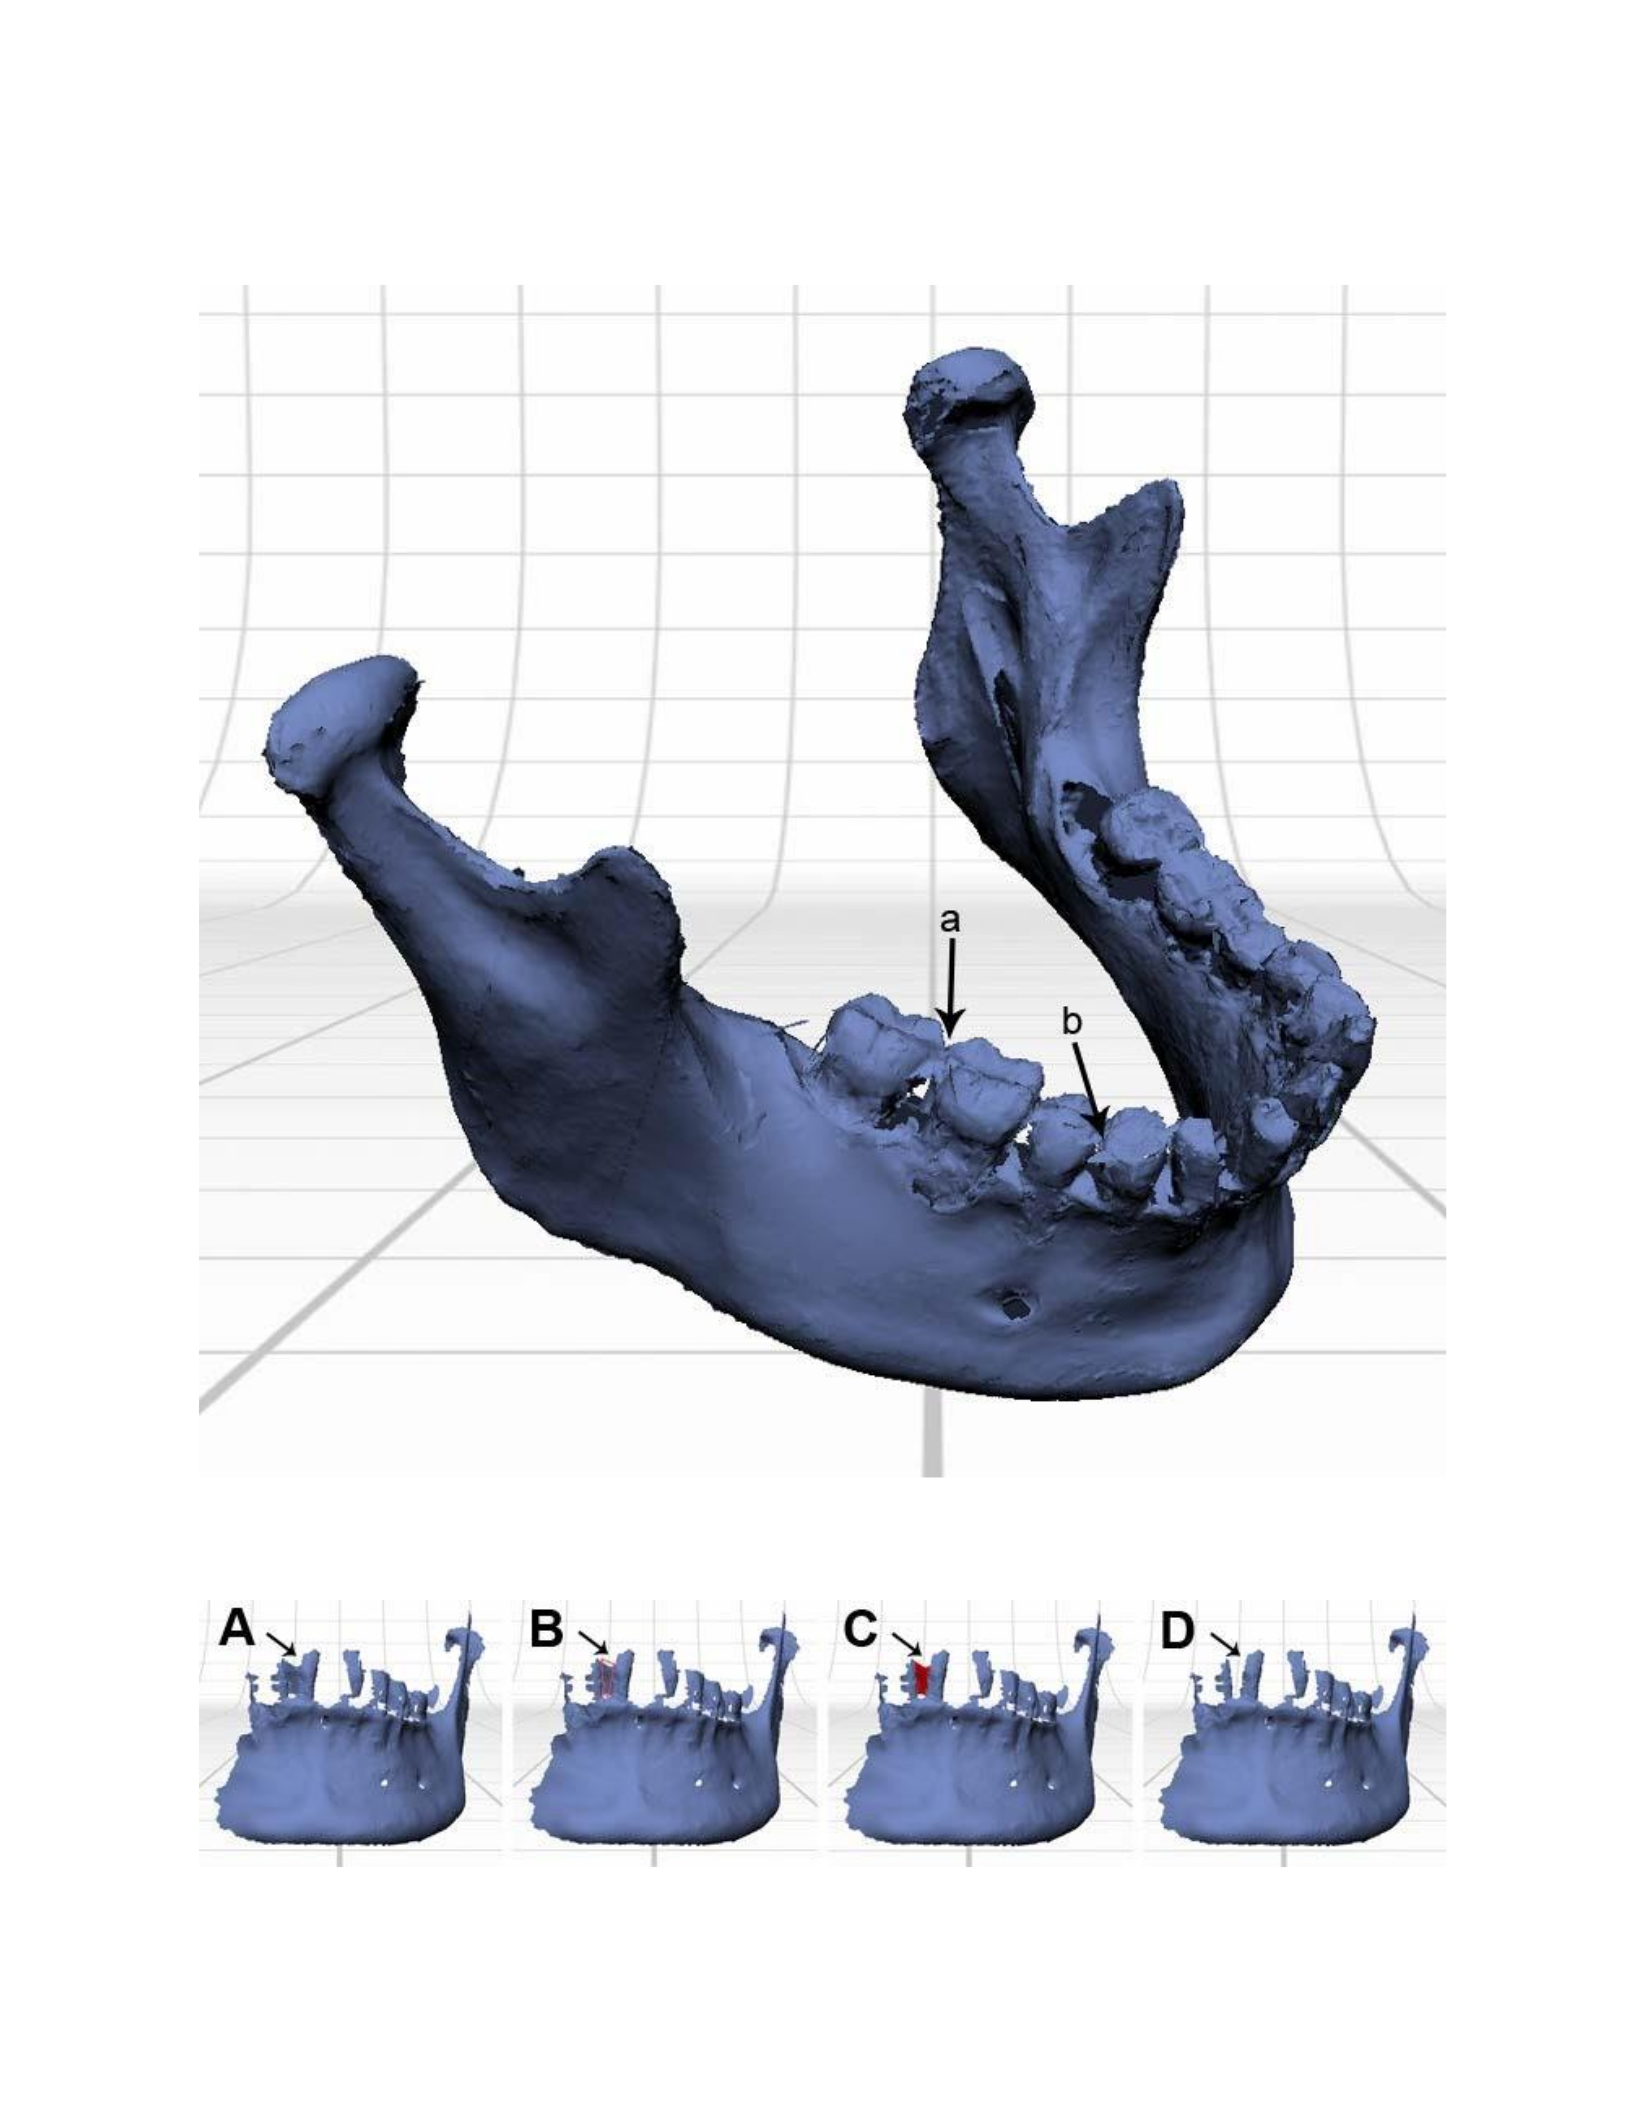
Figure 56: Much of the surfaces of the mandible were captured with the 360 scan sets. The teeth however had
numerous artifacts (a) and noise (b).
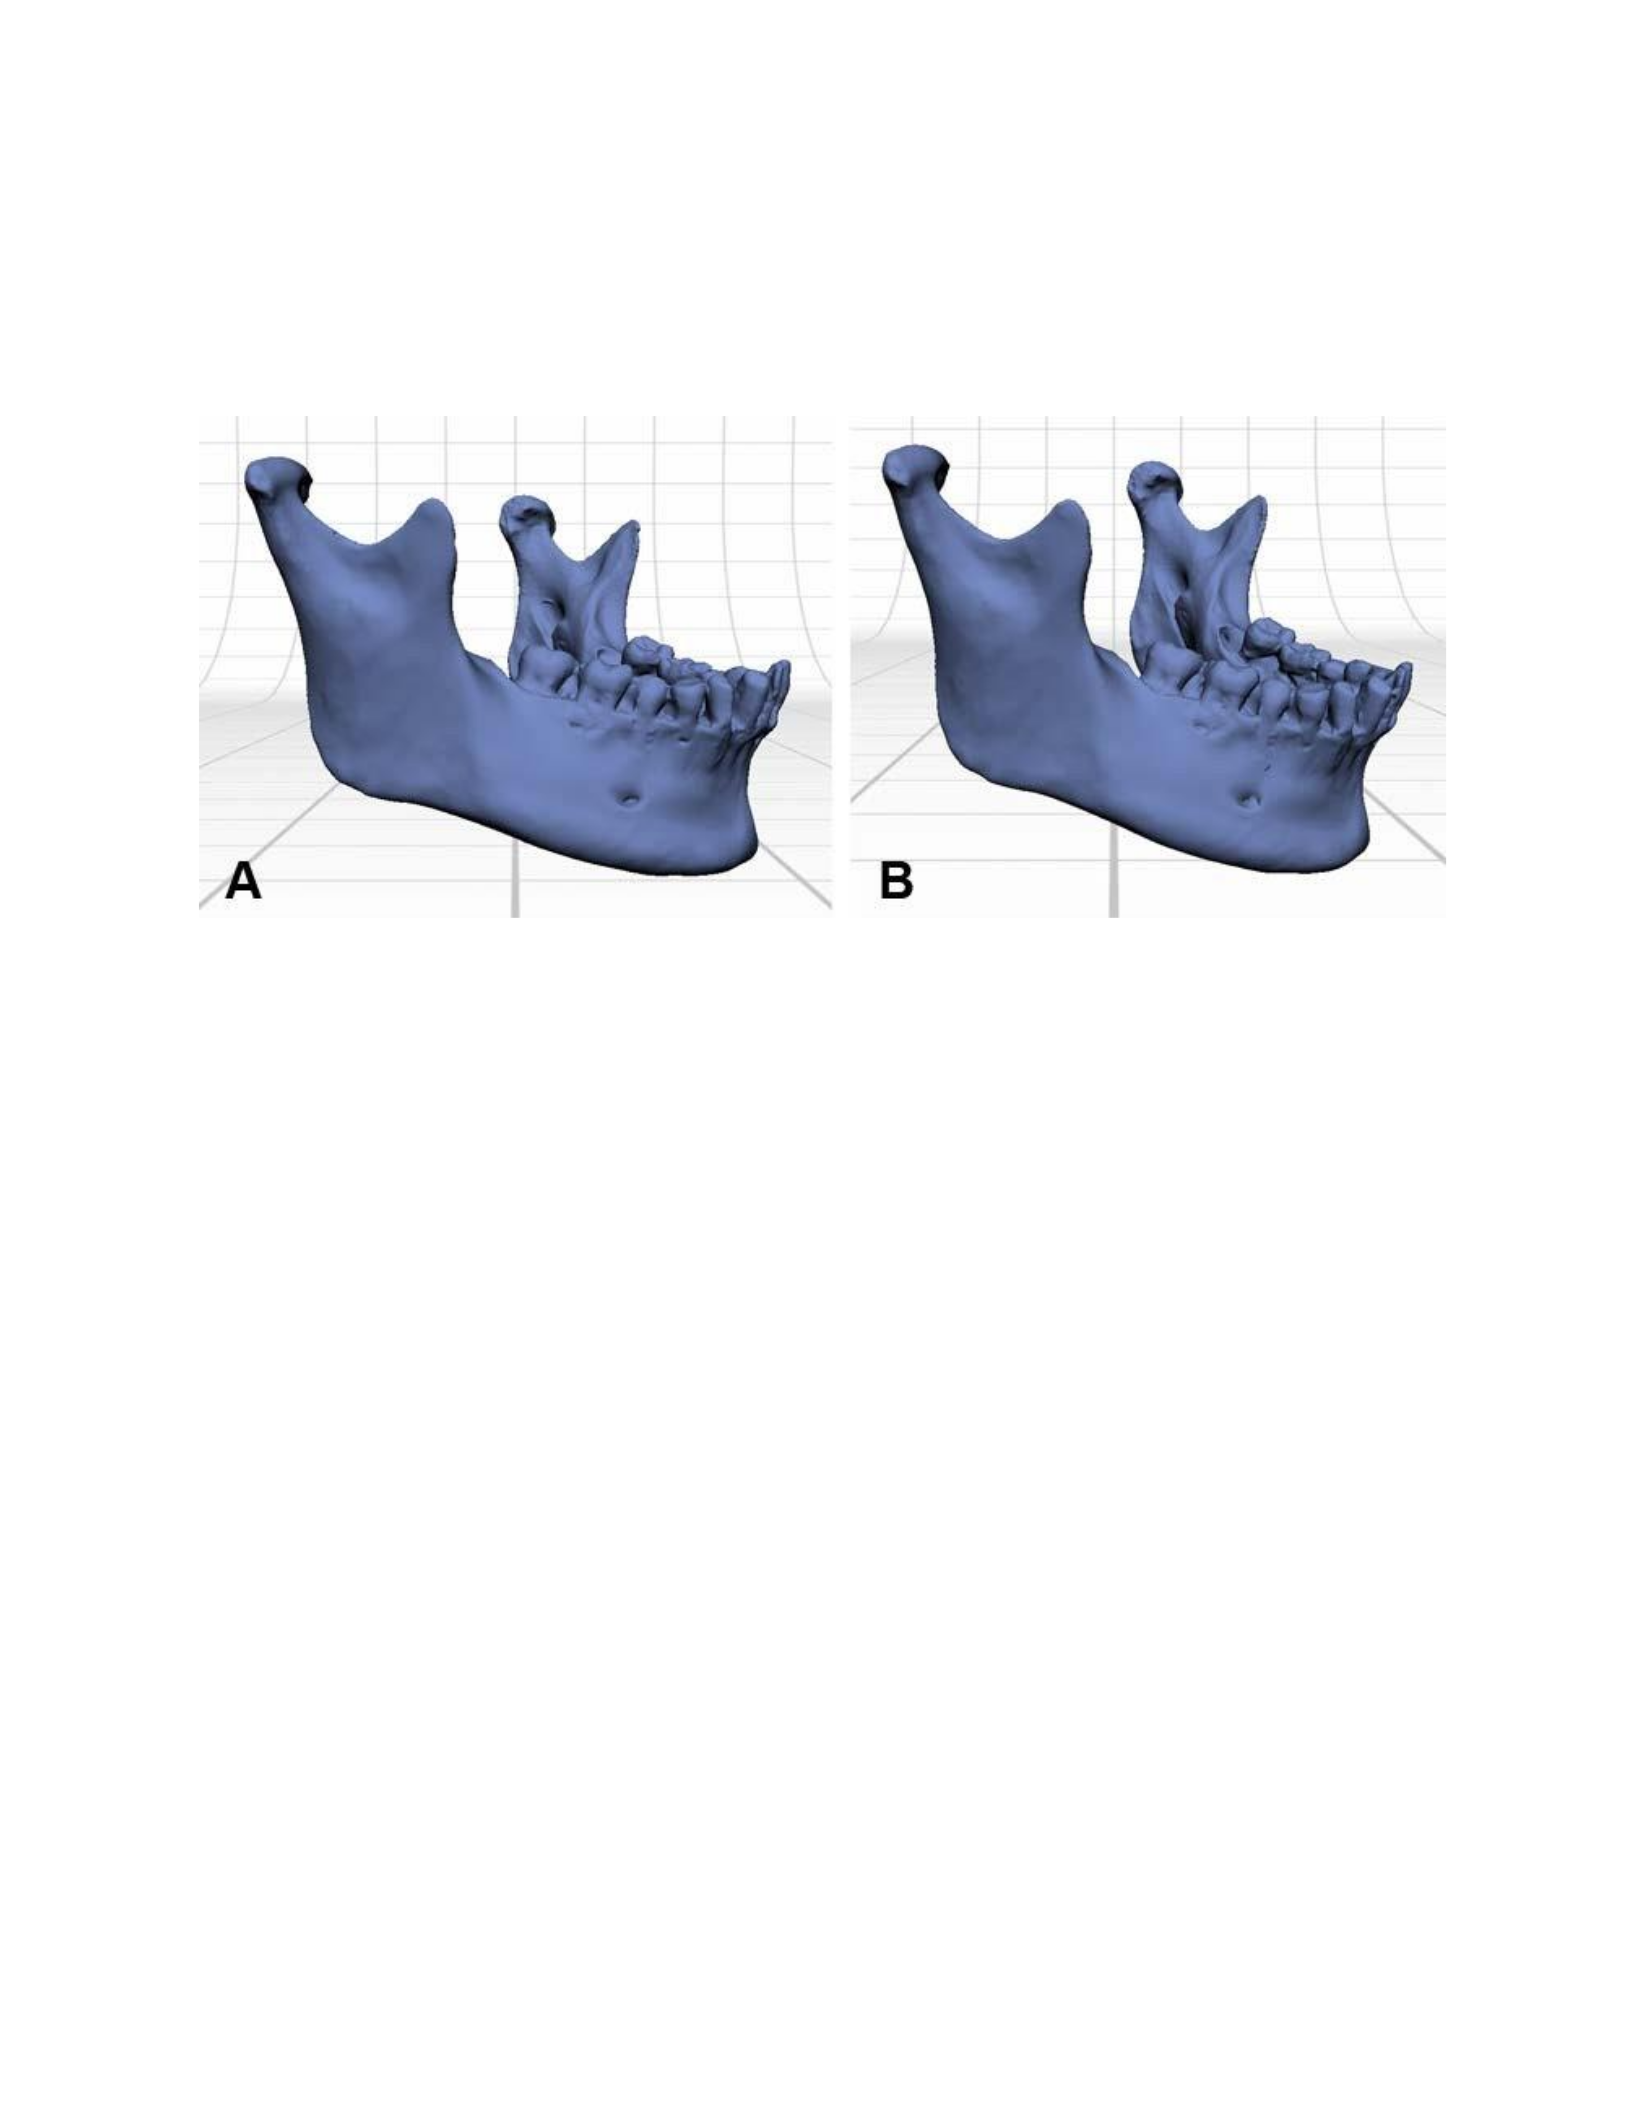
Figure 57: Artifacts in the scan data (A) were manually removed from individual scans by using the polyline tool
(B) to select problem areas (C) and remove them (D).
Figure 58: A water-tight model was created before (A) and after the manual removal of the problem areas in the
teeth (B). Despite the manual removal of artifacts and noise from the scan data, there was no appreciable difference
between the two models.
CHAPTER FIVE: RESULTS – APPLICATIONS
Once the scan data has been acquired, processed and exported as a 3D file, the resulting
data can be utilized to achieve a variety of virtual techniques that can be employed by the
forensic anthropologist. The most basic application of the 3D file is as a form of documentation
which can be reviewed with a computer at any time. More advanced techniques include
recording virtual measurements, creating illustrations with rendered stills, and performing virtual
reconstructions of fragmented or missing bone. This chapter will outline the software and
procedures used for performing these techniques.

Documentation
The most basic operation that can be performed with the 3D model once it has been
created is to save the file, label it in its own folder and add this to a library of scan files as a form
of digital curation. The model files can then be secured with a password protected ZIP folder or
external storage device, and sent to colleagues for additional examination. However, any user
attempting to open the file would require a program for viewing 3D models. In order to
circumvent this and standardize the viewing of the 3D model, the file can be embedded into a
PDF using Adobe® Acrobat® X Pro. Although a distinction was made between documentation
and visualization in Chapter 2, the creation of a 3D PDF serves to integrate both of these
applications.
3D PDF
A 3D PDF is an ordinary PDF file that contains an embedded 3D file which can be
opened with Adobe® Acrobat® Reader. However, viewing the 3D PDF may be limited by the
computer’s hardware based on the size and resolution of the model embedded within the PDF. A
graphics card with 3D capabilities is also required, and greater quantities of random-access
memory (RAM) allow the viewing of larger models without inhibiting computer performance.
Together, Adobe® Photoshop® CS5 and Adobe® Acrobat® X Pro are utilized in the production
of 3D PDFs. The creation of a 3D PDF is essentially a file conversion process, achieved through
changing the OBJ file to a U3D file and then saving the U3D file into a PDF (Figure 59).
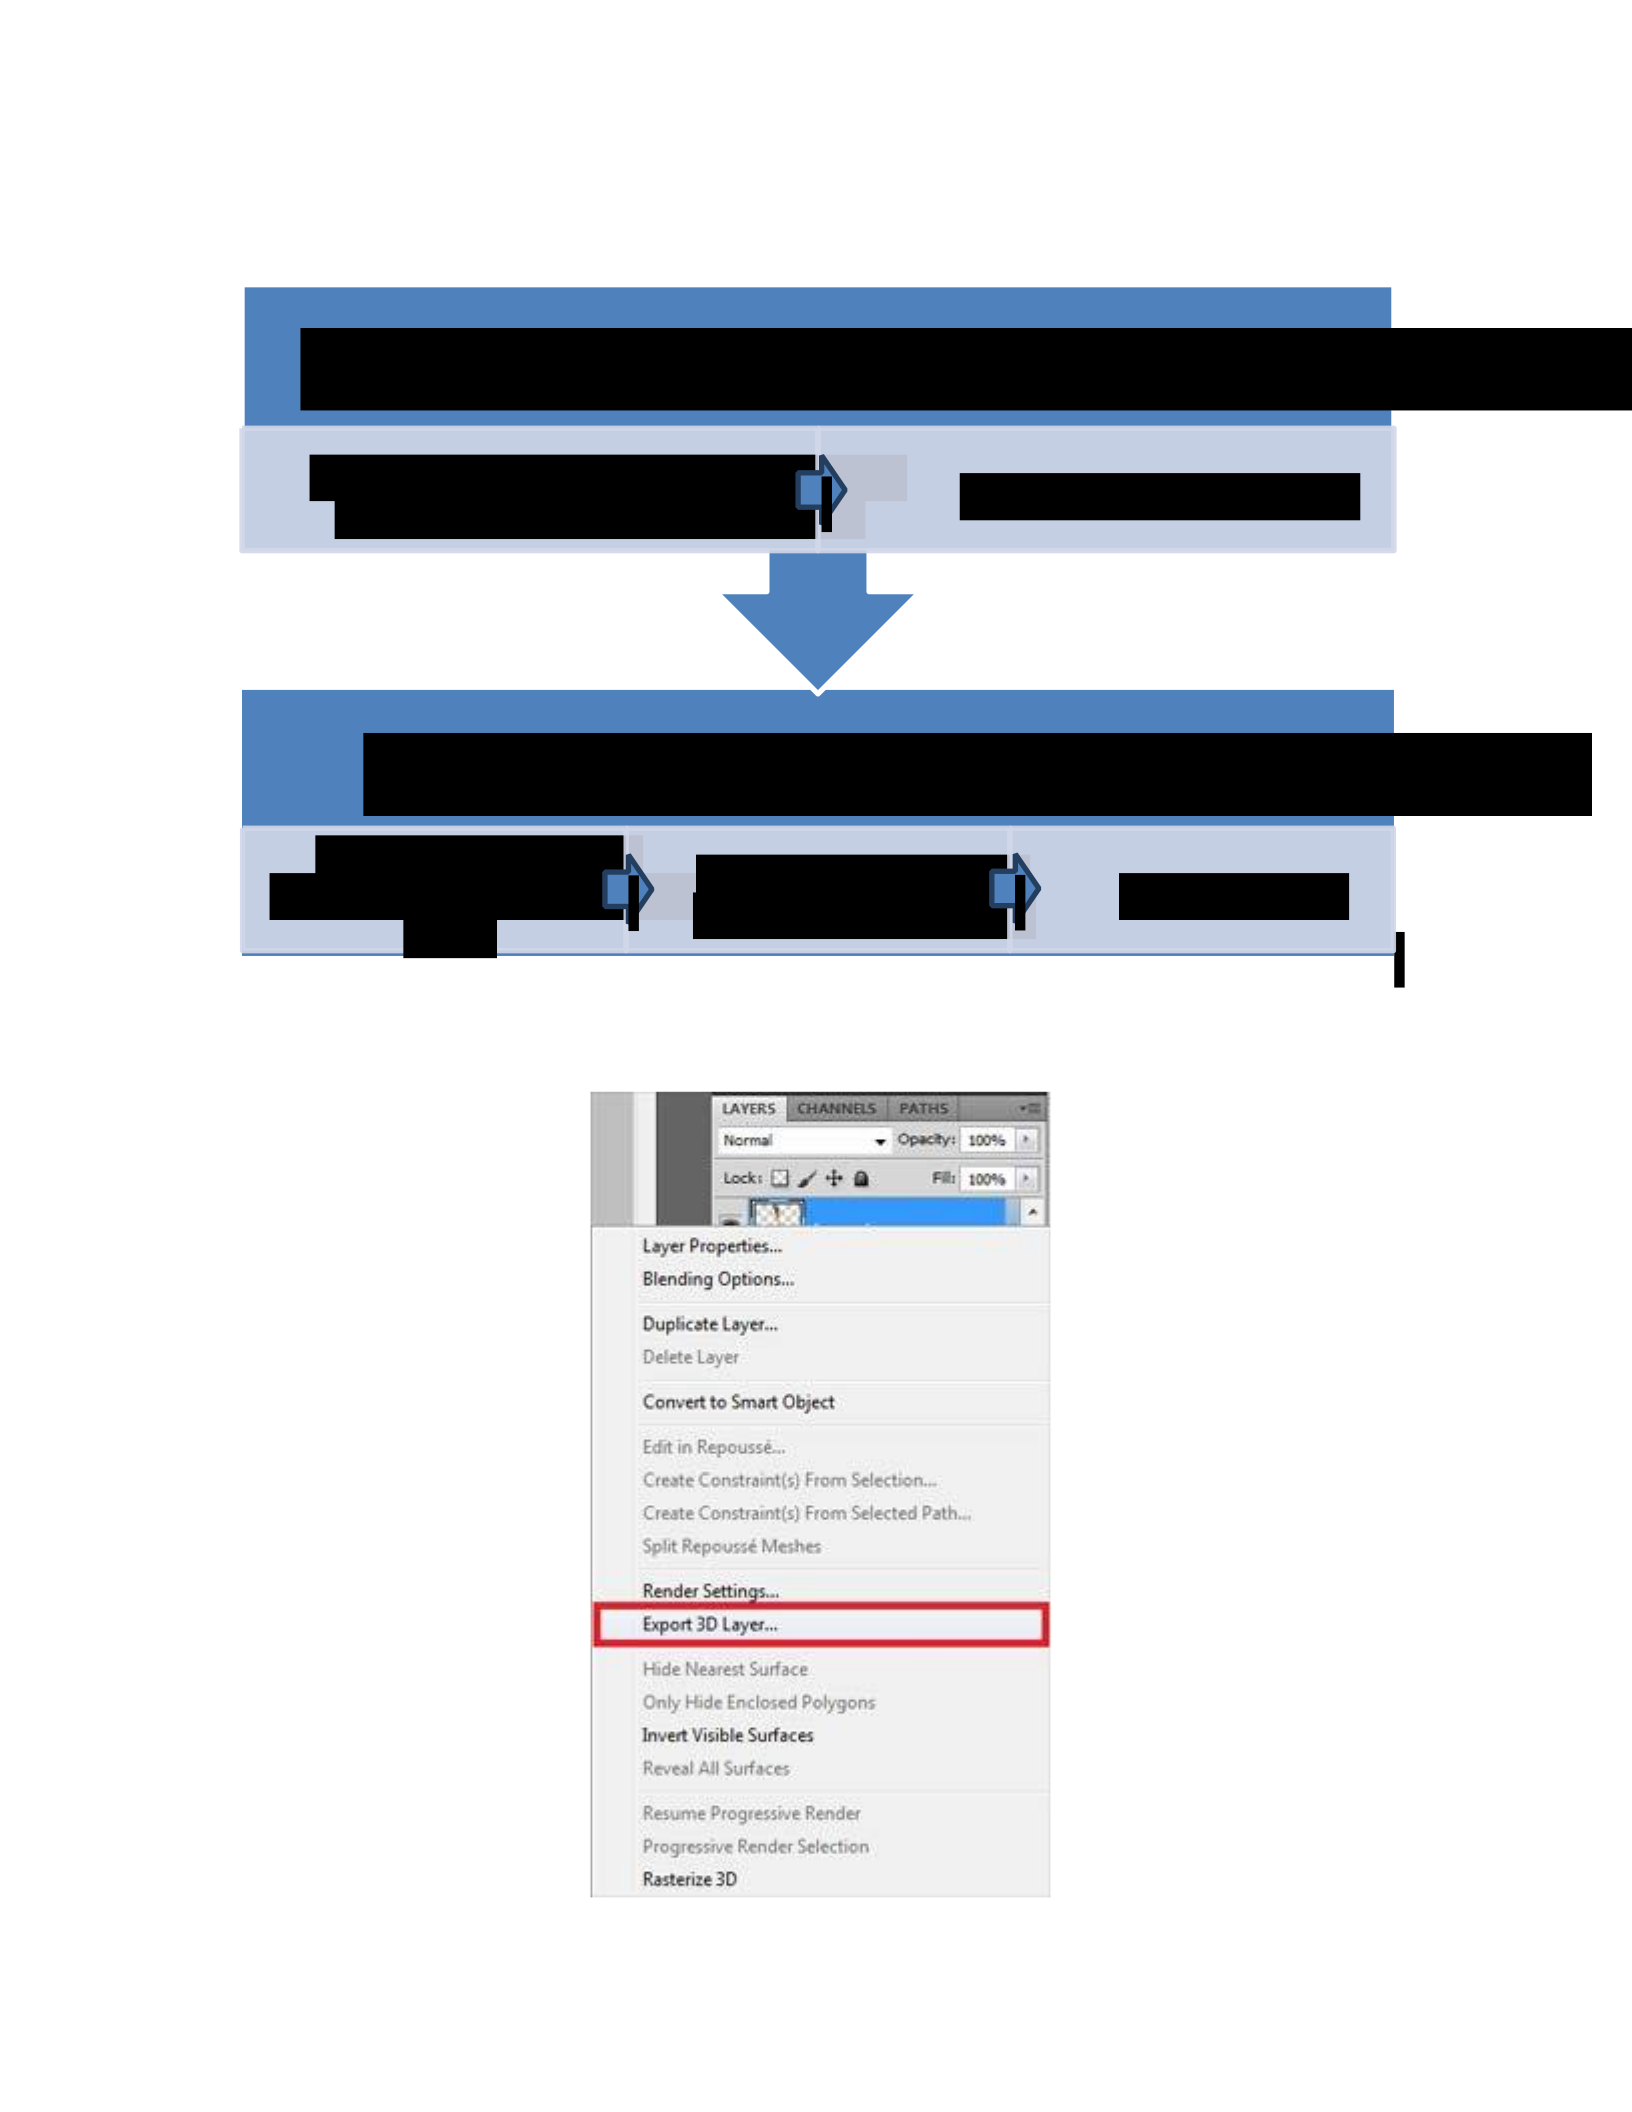
Figure 59: A basic workflow illustrating the file conversion process for creating a 3D PDF from the scan data file
that was saved in the OBJ format.
O U3D in Adobe® A ® X Pr
Open U3D file by
changing file type to All
Files
Modify advanced
settings if needed
Save as PDF
O OBJ file in Adobe® Phot ® CS5
Right-click on 3D layer in Layers
pallette and export 3D layer
Save as U3D file type

Figure 60: In Adobe Photoshop CS5, the Layers palette is usually docked on the right side of the screen. To export
the OBJ as a U3D file, right-click on the 3D layer and click on Export 3D layer (highlighted in red). This brings up a
Save As screen, and allows the user to change the saved file format to a U3D file.
First, the OBJ file of the scan data is imported into Adobe® Photoshop® CS5. After this,
it can be saved as a U3D file by going to the Layers palette, right clicking on the 3D layer and
choosing ‘Export 3D layer’ (Figure 60).Once the U3D file has been saved, it is then opened in
Adobe® Acrobat® X Pro to be saved as a PDF. Before saving the 3D file in PDF format,
Adobe® Acrobat® X Pro allows the user to make modifications to the document using the
advanced settings checkbox, which brings up a menu with three tabs. Several features that are
useful to change in this menu are located in the Default Display Settings under the 3D tab (Figure
61).
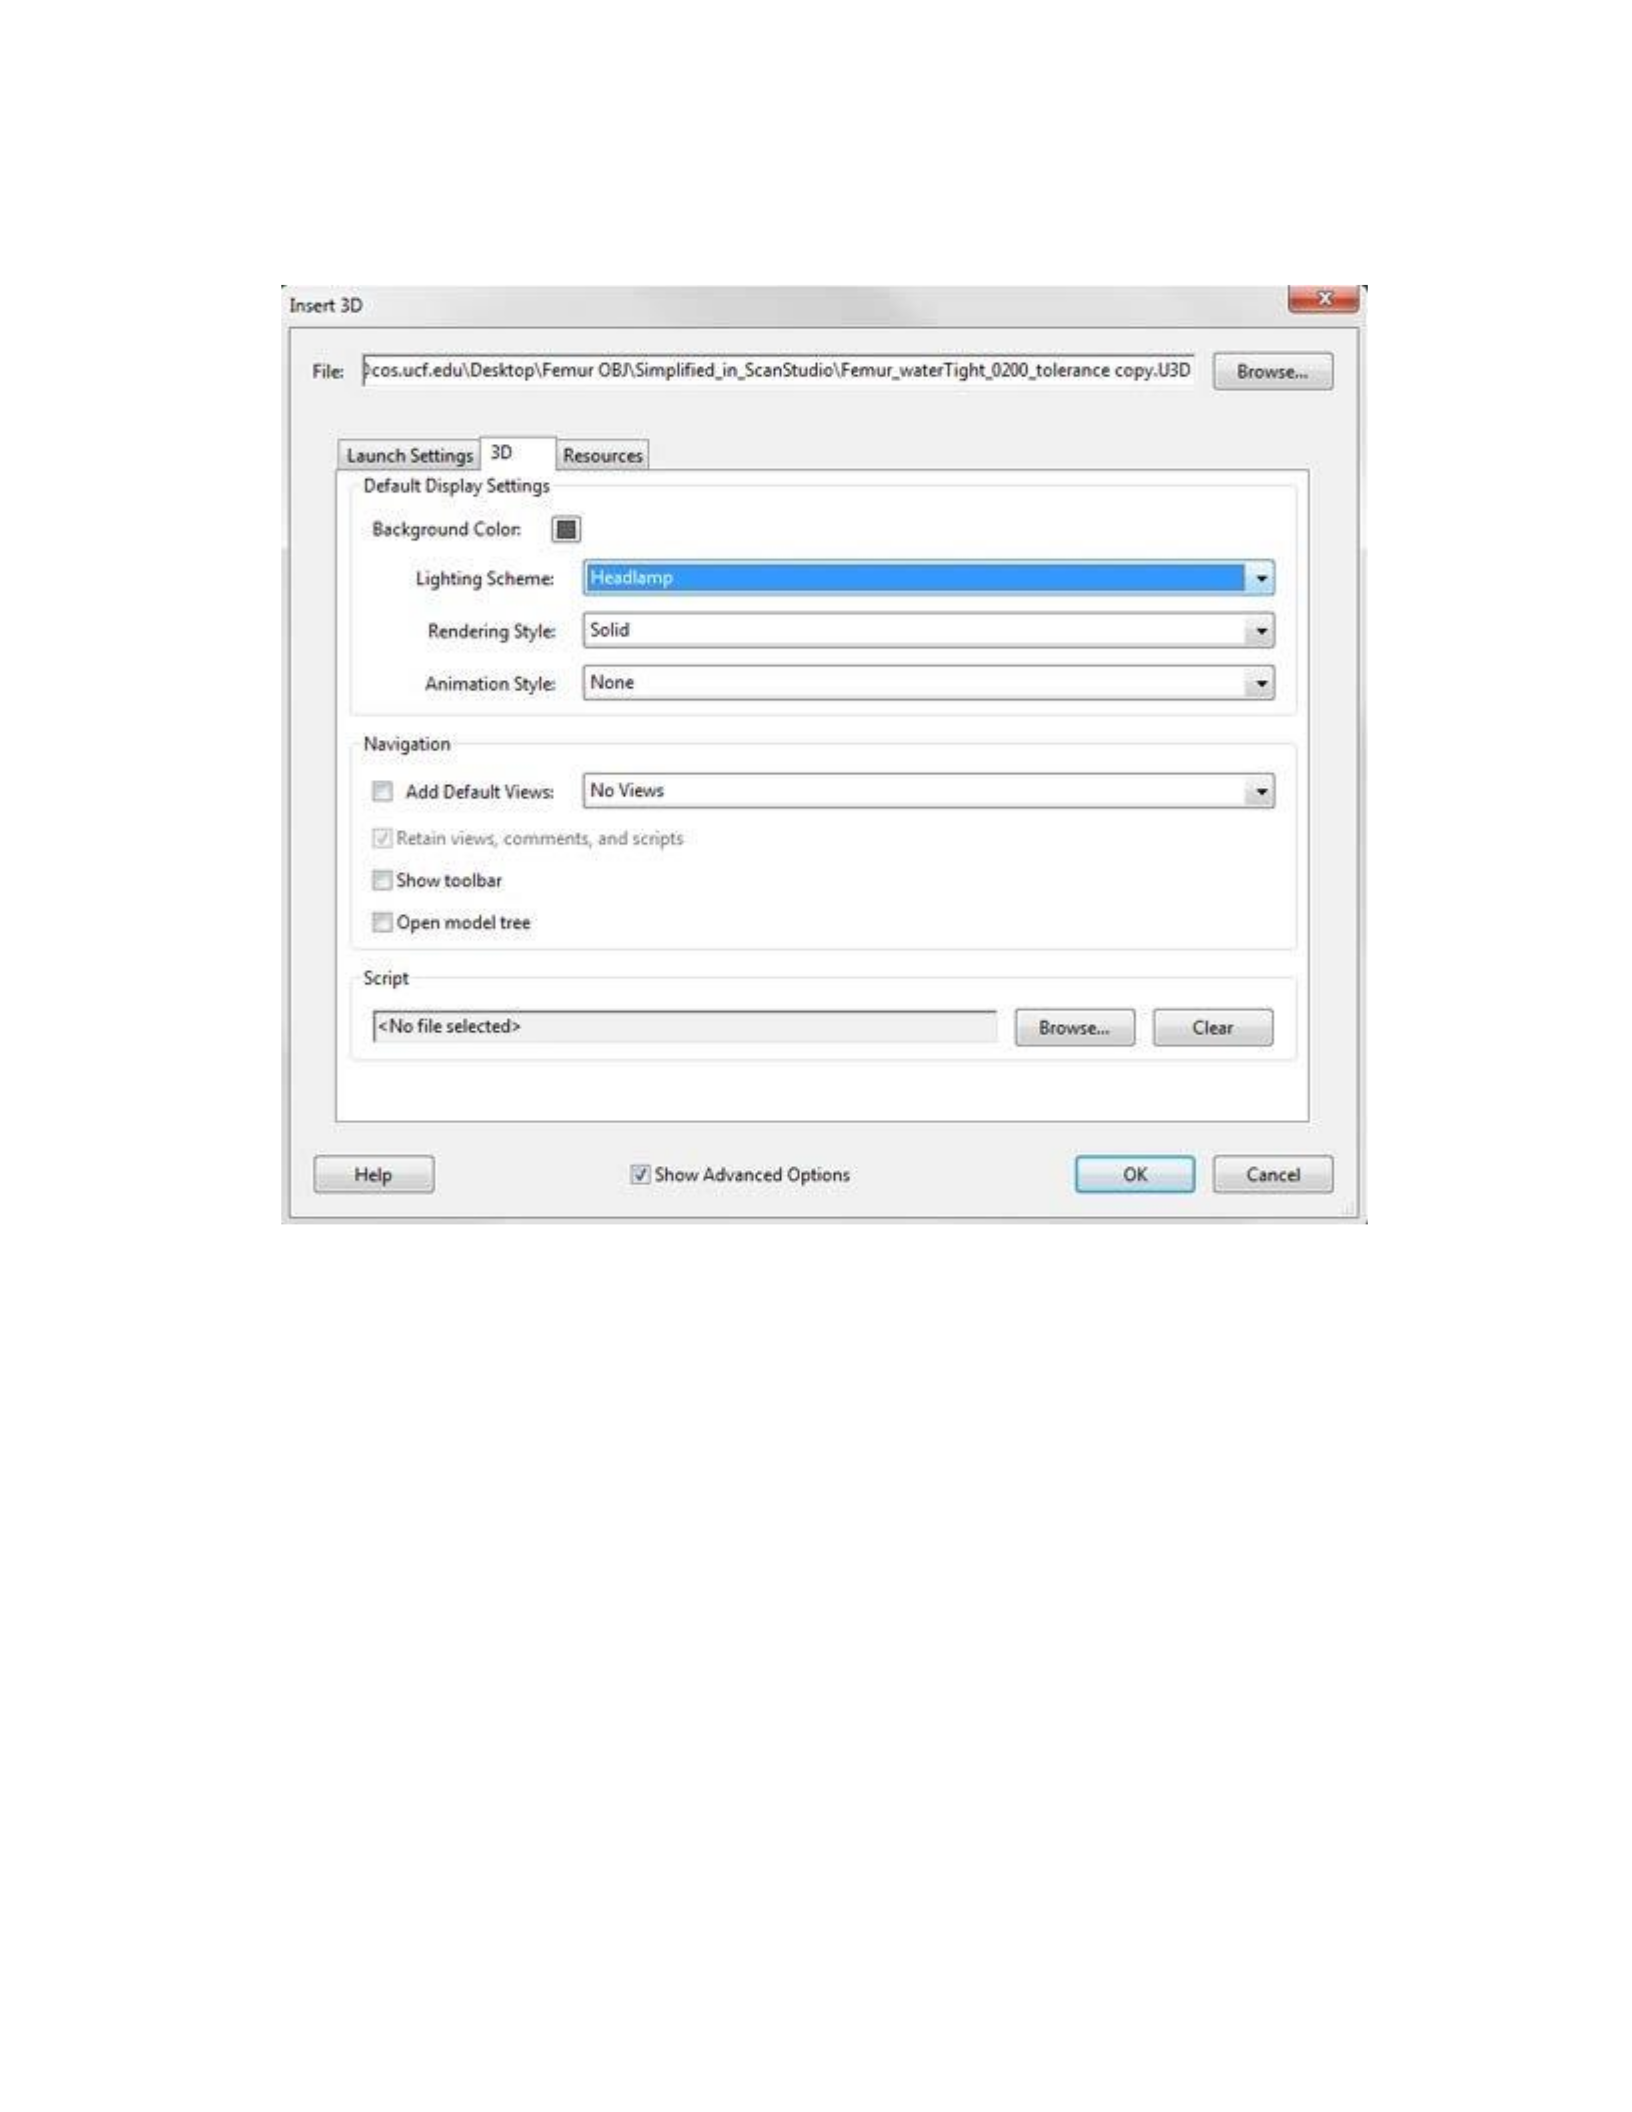
Figure 61: The Advanced Options window allows many features to be modified before creating the PDF.
An important feature to change before creating the 3D PDF is the default lighting scheme.
The default lighting scheme is Lights from File, which will create a fixed highlight on the model.
The Headlamp light scheme is more preferable, causing whatever surfaces of the model are
facing the user to be illuminated interactively. In this menu it is possible to change the default
Lighting Scheme from ‘Lights from File’ to ‘Headlamp’, which will consistently light the
surfaces that are facing the viewer while interacting with the 3D object. Although this setting can
still be changed after the file has been created, it is efficient to create this as a default setting so
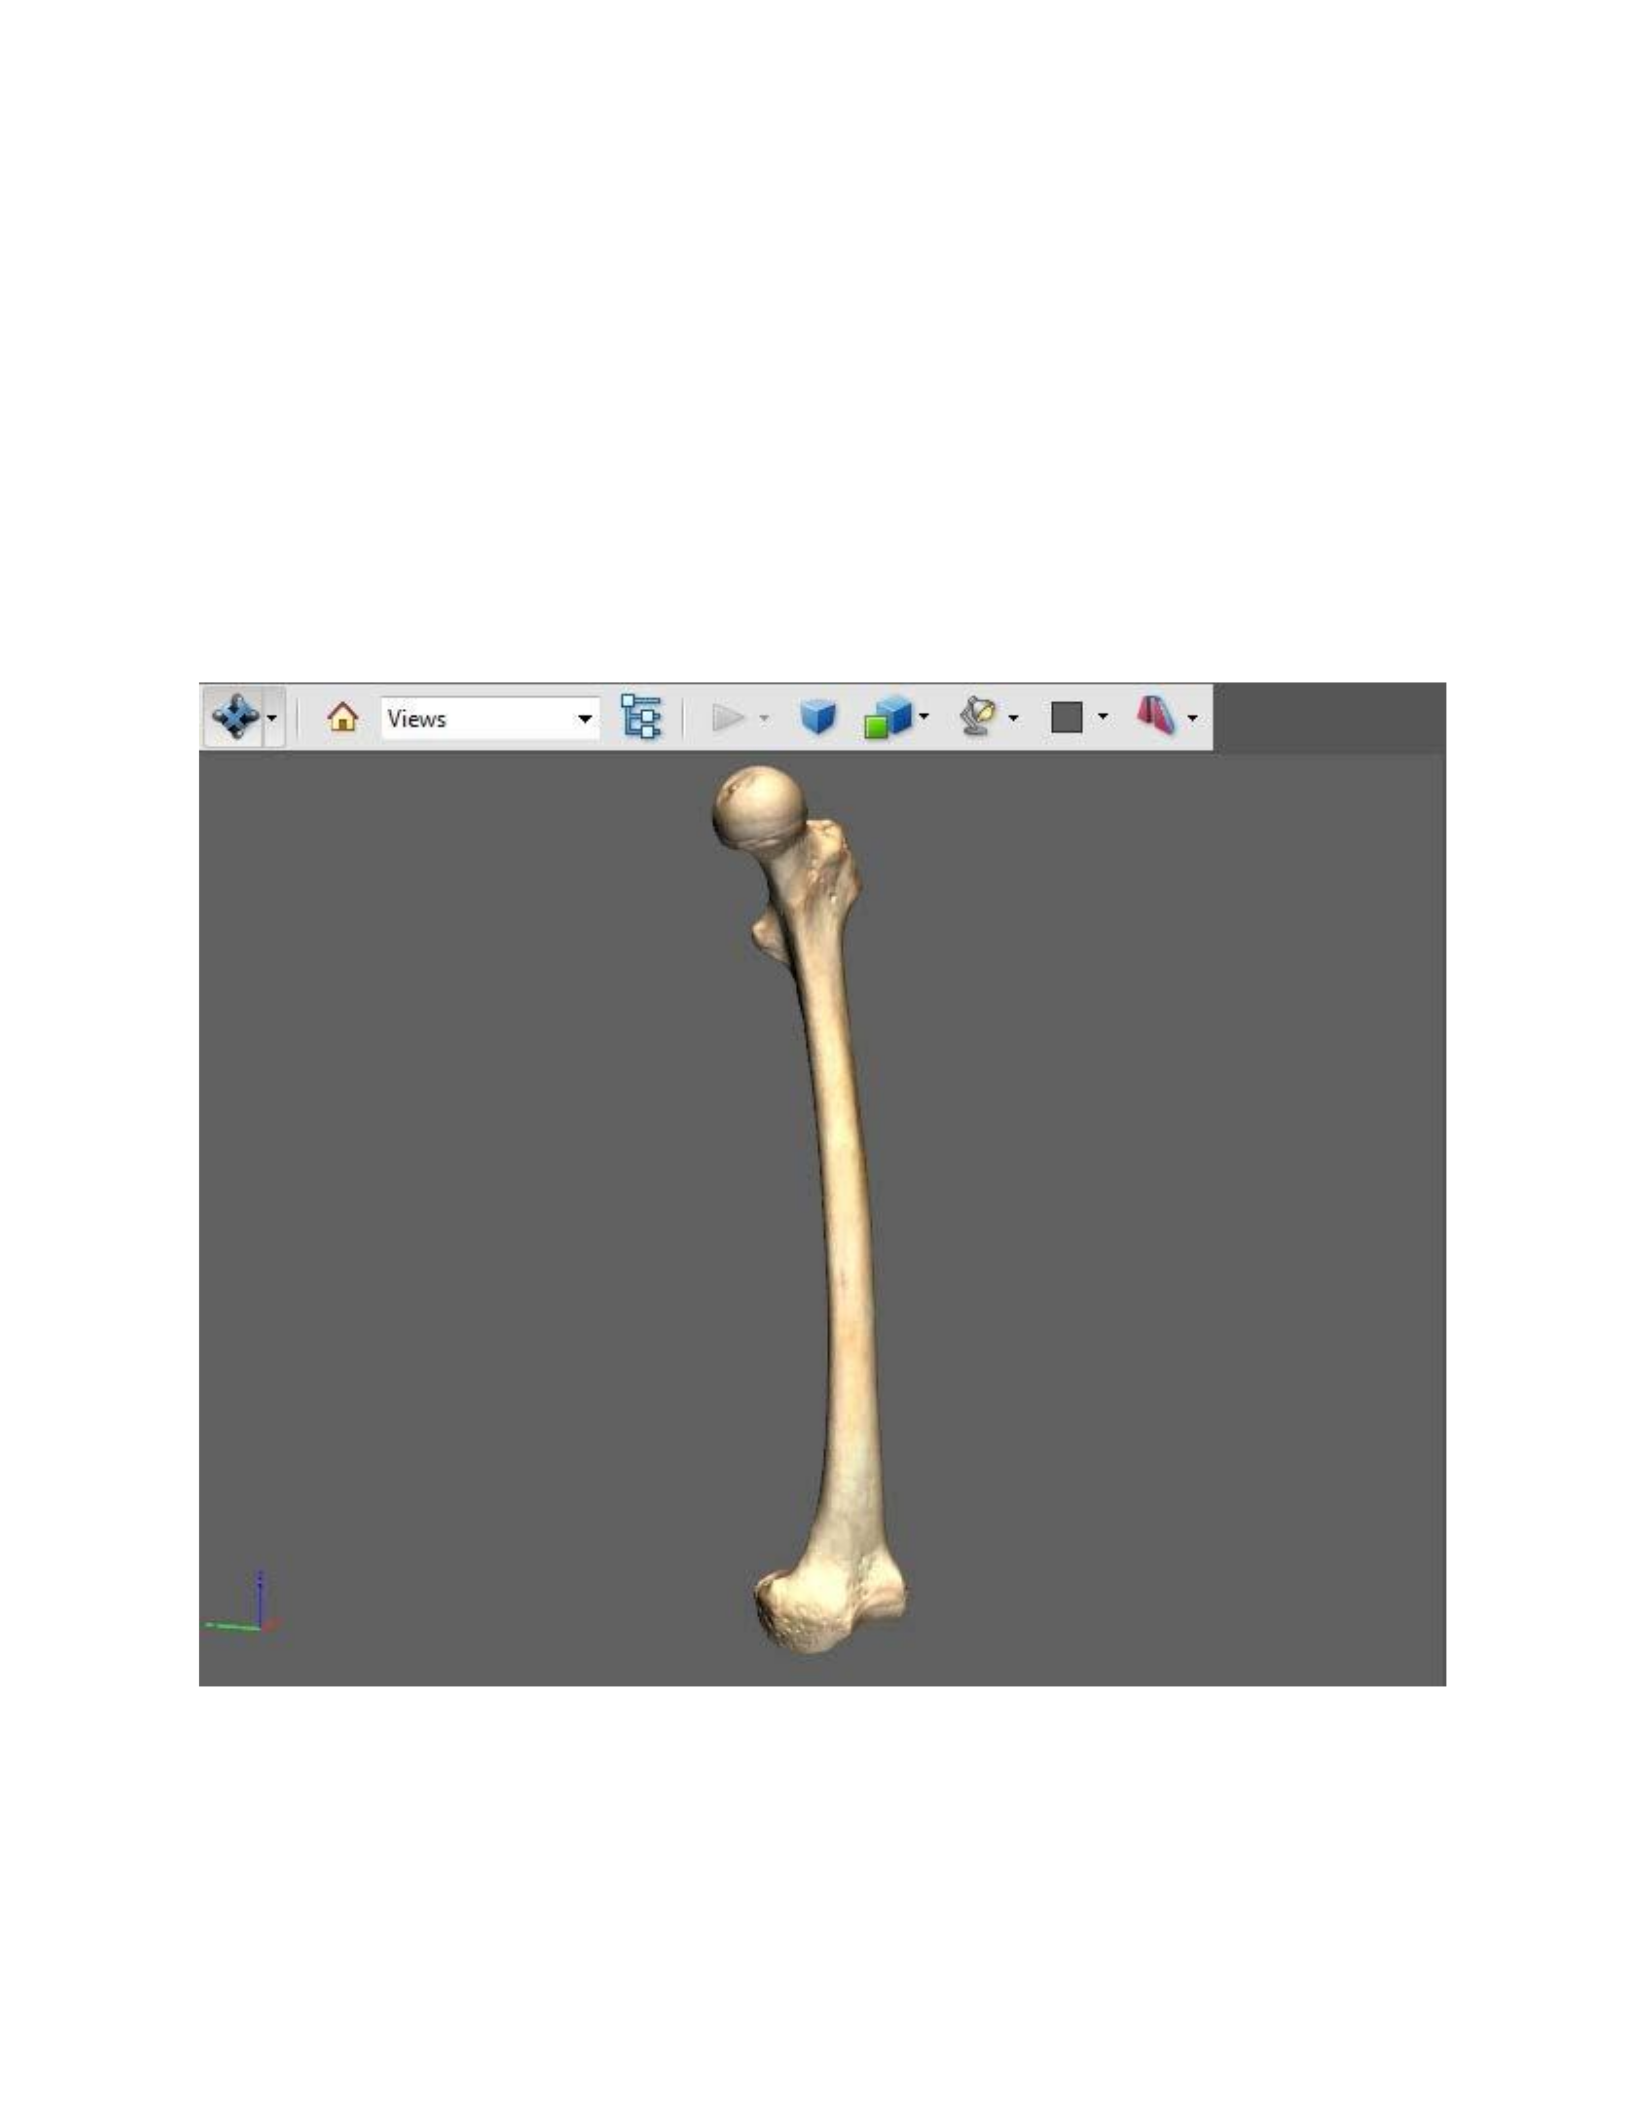
that the user does not have to change it every time the file is opened. Modifying the default
settings is especially useful if the file will be sent to lawyers, colleagues and other experts so that
the default shading is of a higher quality when the document is opened. Whether or not any
advanced settings have been chosen, the 3D PDF is created simply by saving the opened U3D
file as a PDF (Figure 62).
Figure 62: The scan data of the femur complete with texture, imbedded and viewed within a PDF file.

Issues
The final model of the femur that was produced in Chapter 4 (Fig. X) was used to
create a 3D PDF using the workflow outlined above. When opening the PDF created with this
file and attempting to rotate the model within the viewport, the rotation was delayed and the
computer had to load each time an attempt was made to move the model. After troubleshooting,
it became apparent that the high-resolution of the 3D model was causing the performance issue.
To correct this problem, the Simplify function in ScanStudio HD Pro™ was used to decrease the
amount triangles contained within the model. This feature is found by going to the Polish button
on the main toolbar and choosing Simplify (Figure 63). A specific area or the entire model can be
selected. In this case, the entire model was selected for simplification by clicking ALL (Figure
64). Note that the model must also be fused prior to simplification. The process of simplifying a
model in ScanStudio HD Pro™ requires experimentation since the software only allows the user
to specify a general tolerance value for the simplification and not a specific target triangle count.
It is also possible to simplify the model too much, which results in loss of accuracy. To efficiently
organize the simplification process for determining an optimal model resolution, it is important
to document the original quantity of triangles contained within the model and compare this with
the triangle counts that result from simplification using different tolerance values. The total
number of triangles can be viewed by going to File in the main toolbar and clicking on Model
Information (Figure 65), or by using the keyboard shortcut Ctrl+Shift+I.
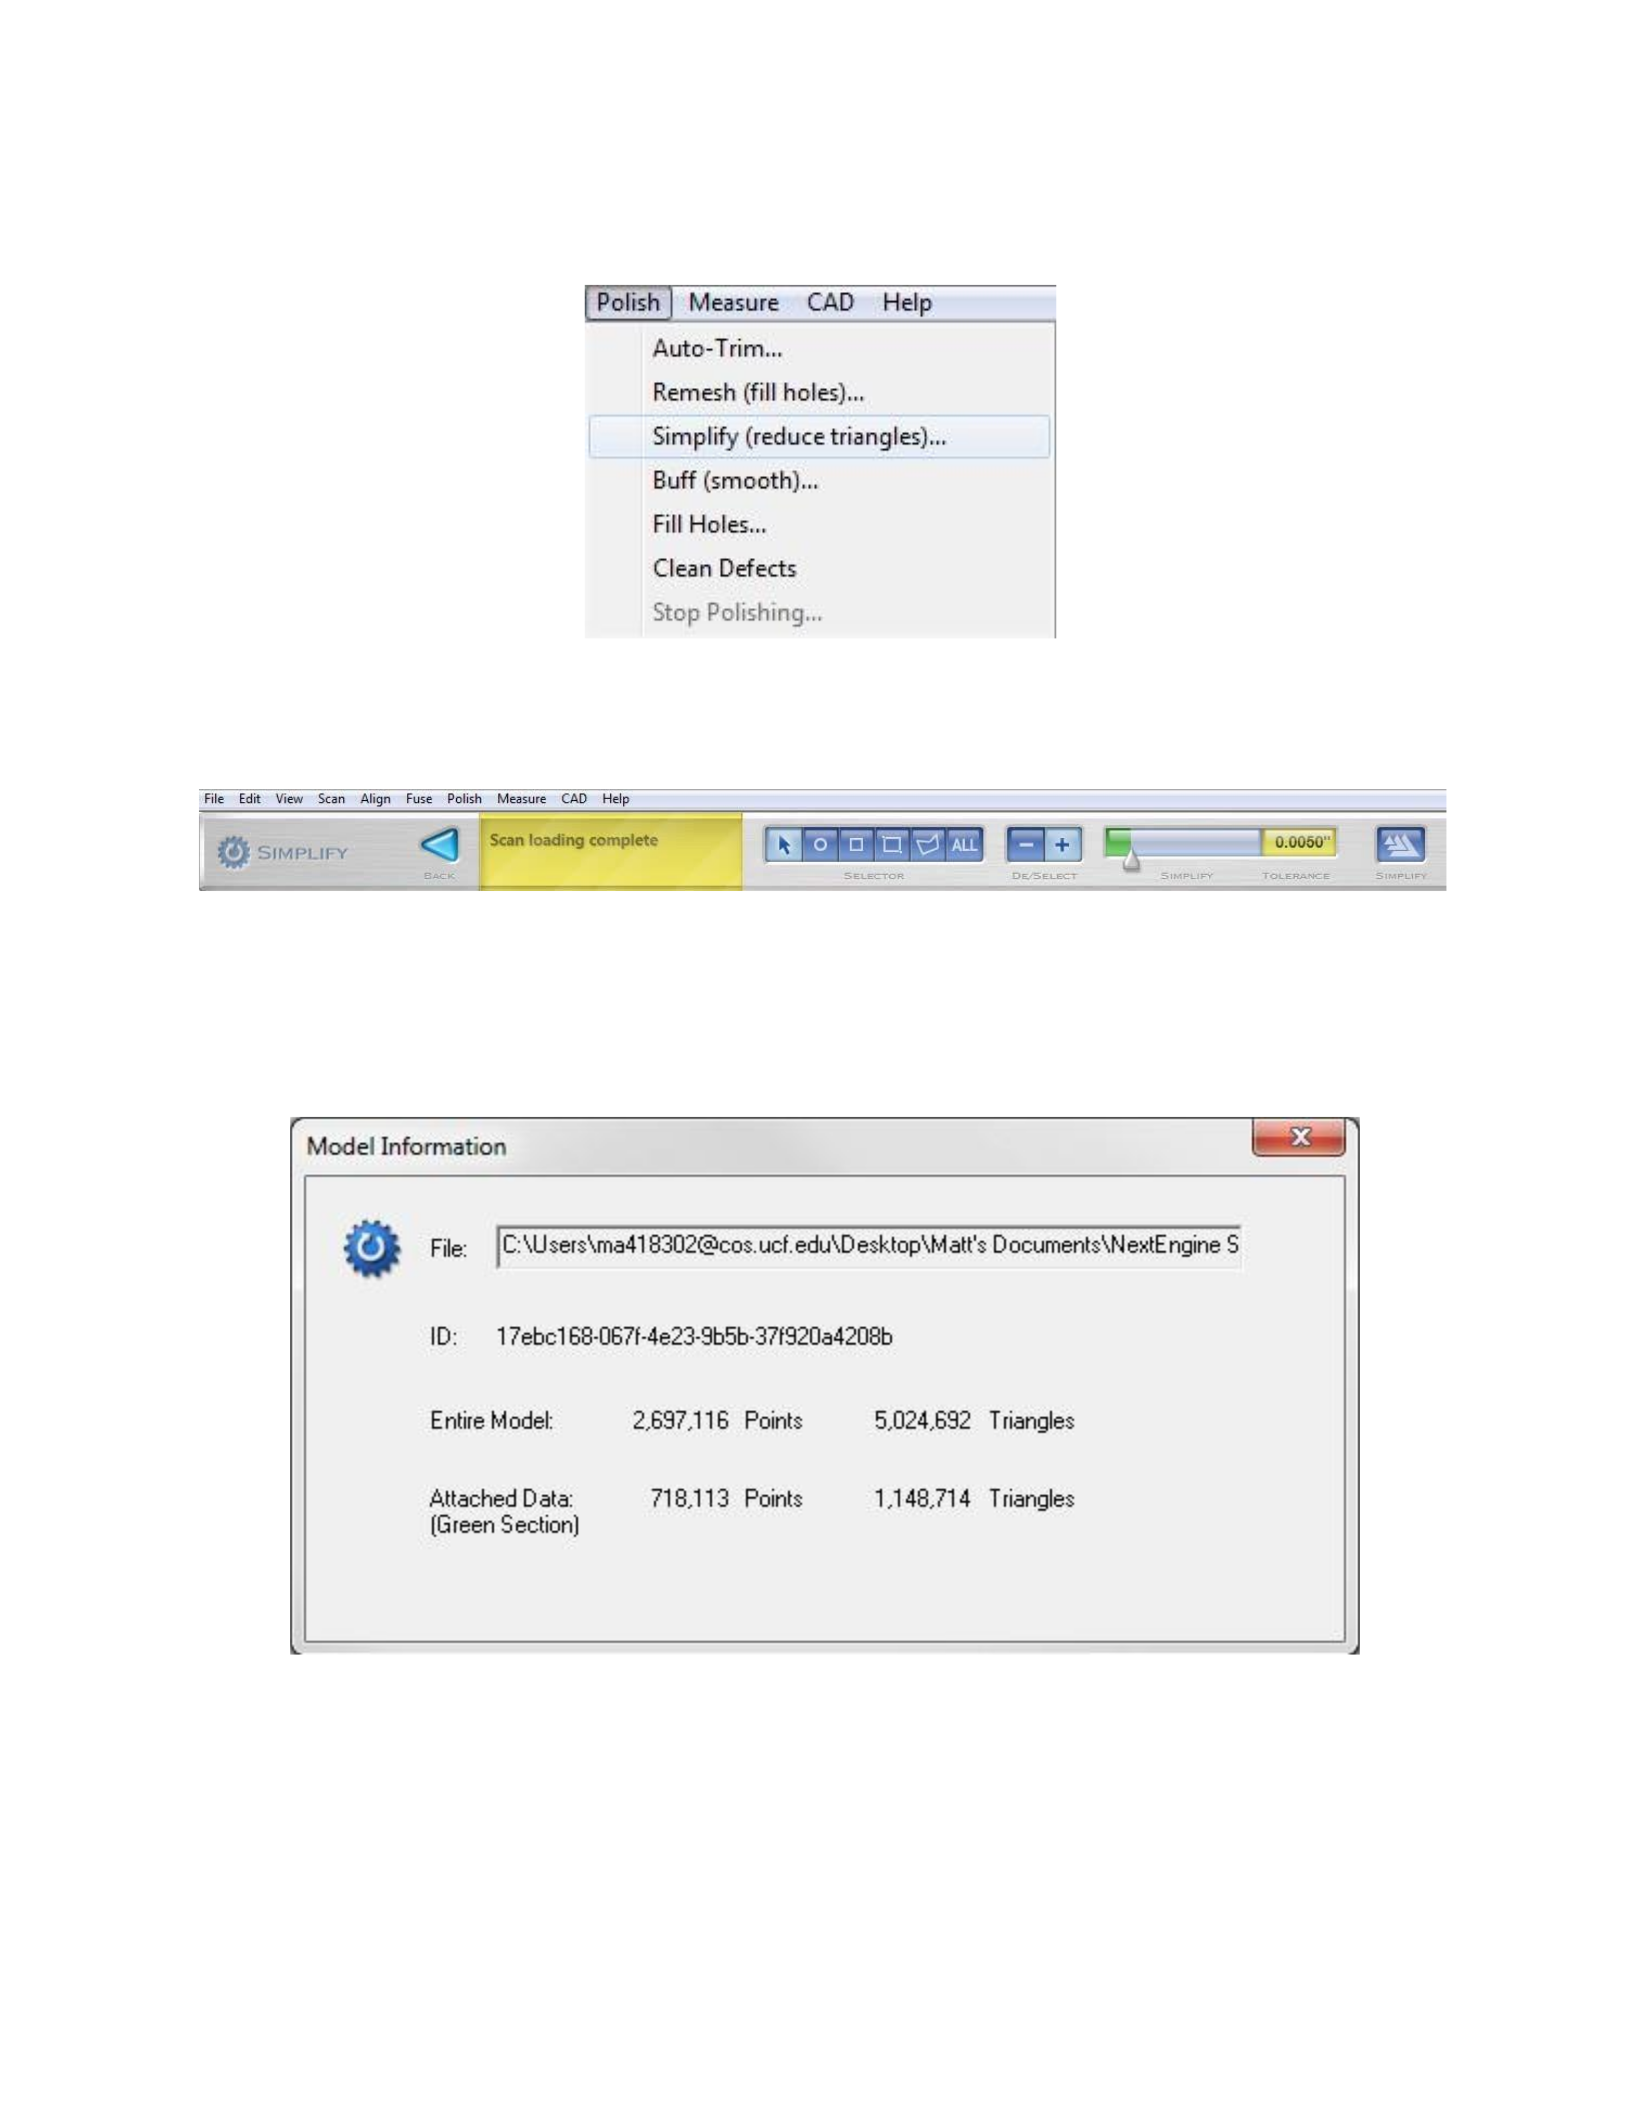
Figure 63: The Simplify function is found under the Polish tab in the main toolbar.
Figure 64: The simplification toolbar within ScanStudio HD Pro™. The entire model is selected by clicking the
ALL button. The simplification level can then be modified by moving the Simplify slider or by typing in a number
to change the tolerance value.
Figure 65: The total number of triangles for the entire model or the attached data is identified in the Model
Information window, which can be accessed under File in the main toolbar or simply by using the keyboard shortcut
Ctrl+Shift+I.

If the model has been fused, then it should be displayed in the green section of the model
list located at the bottom of the ScanStudio HD Pro™ interface. This area is known as the
Attached data section, and the corresponding triangle count is listed at the bottom of the Model
Information window. After the triangle count has been noted, several simplification operations
should be performed using different tolerance values. The tolerance value and resulting triangle
count should be documented and performed until there are visible distortions, or the model loses
a significant amount of detail. The tolerance value that was used prior to the loss in surface detail
should be an appropriate level of simplification for the creation of a 3D PDF. To demonstrate the
loss of resolution, the original fused model of the femur was simplified with five different
tolerance settings: 0.0125”, 0.0250”, 0.0500”, 0.1000 and 0.2000”. A rendered still image was
then created in ZBrush™ 4r4 and Adobe® Photoshop® CS5 for comparison. Figure 66 shows a
shaded view of the original femur and additional copies which were processed with different
tolerance values. Although the features remain largely intact, faceting on the head of the femur is
visible with a tolerance value of 0.1000” and is especially pronounced with a value of .2000”.
This faceted appearance is the result of larger triangles that were produced during simplification
with higher tolerance values. Figure 67 shows a wireframe view, which illustrates the triangle
density of each model listed in Table 1.
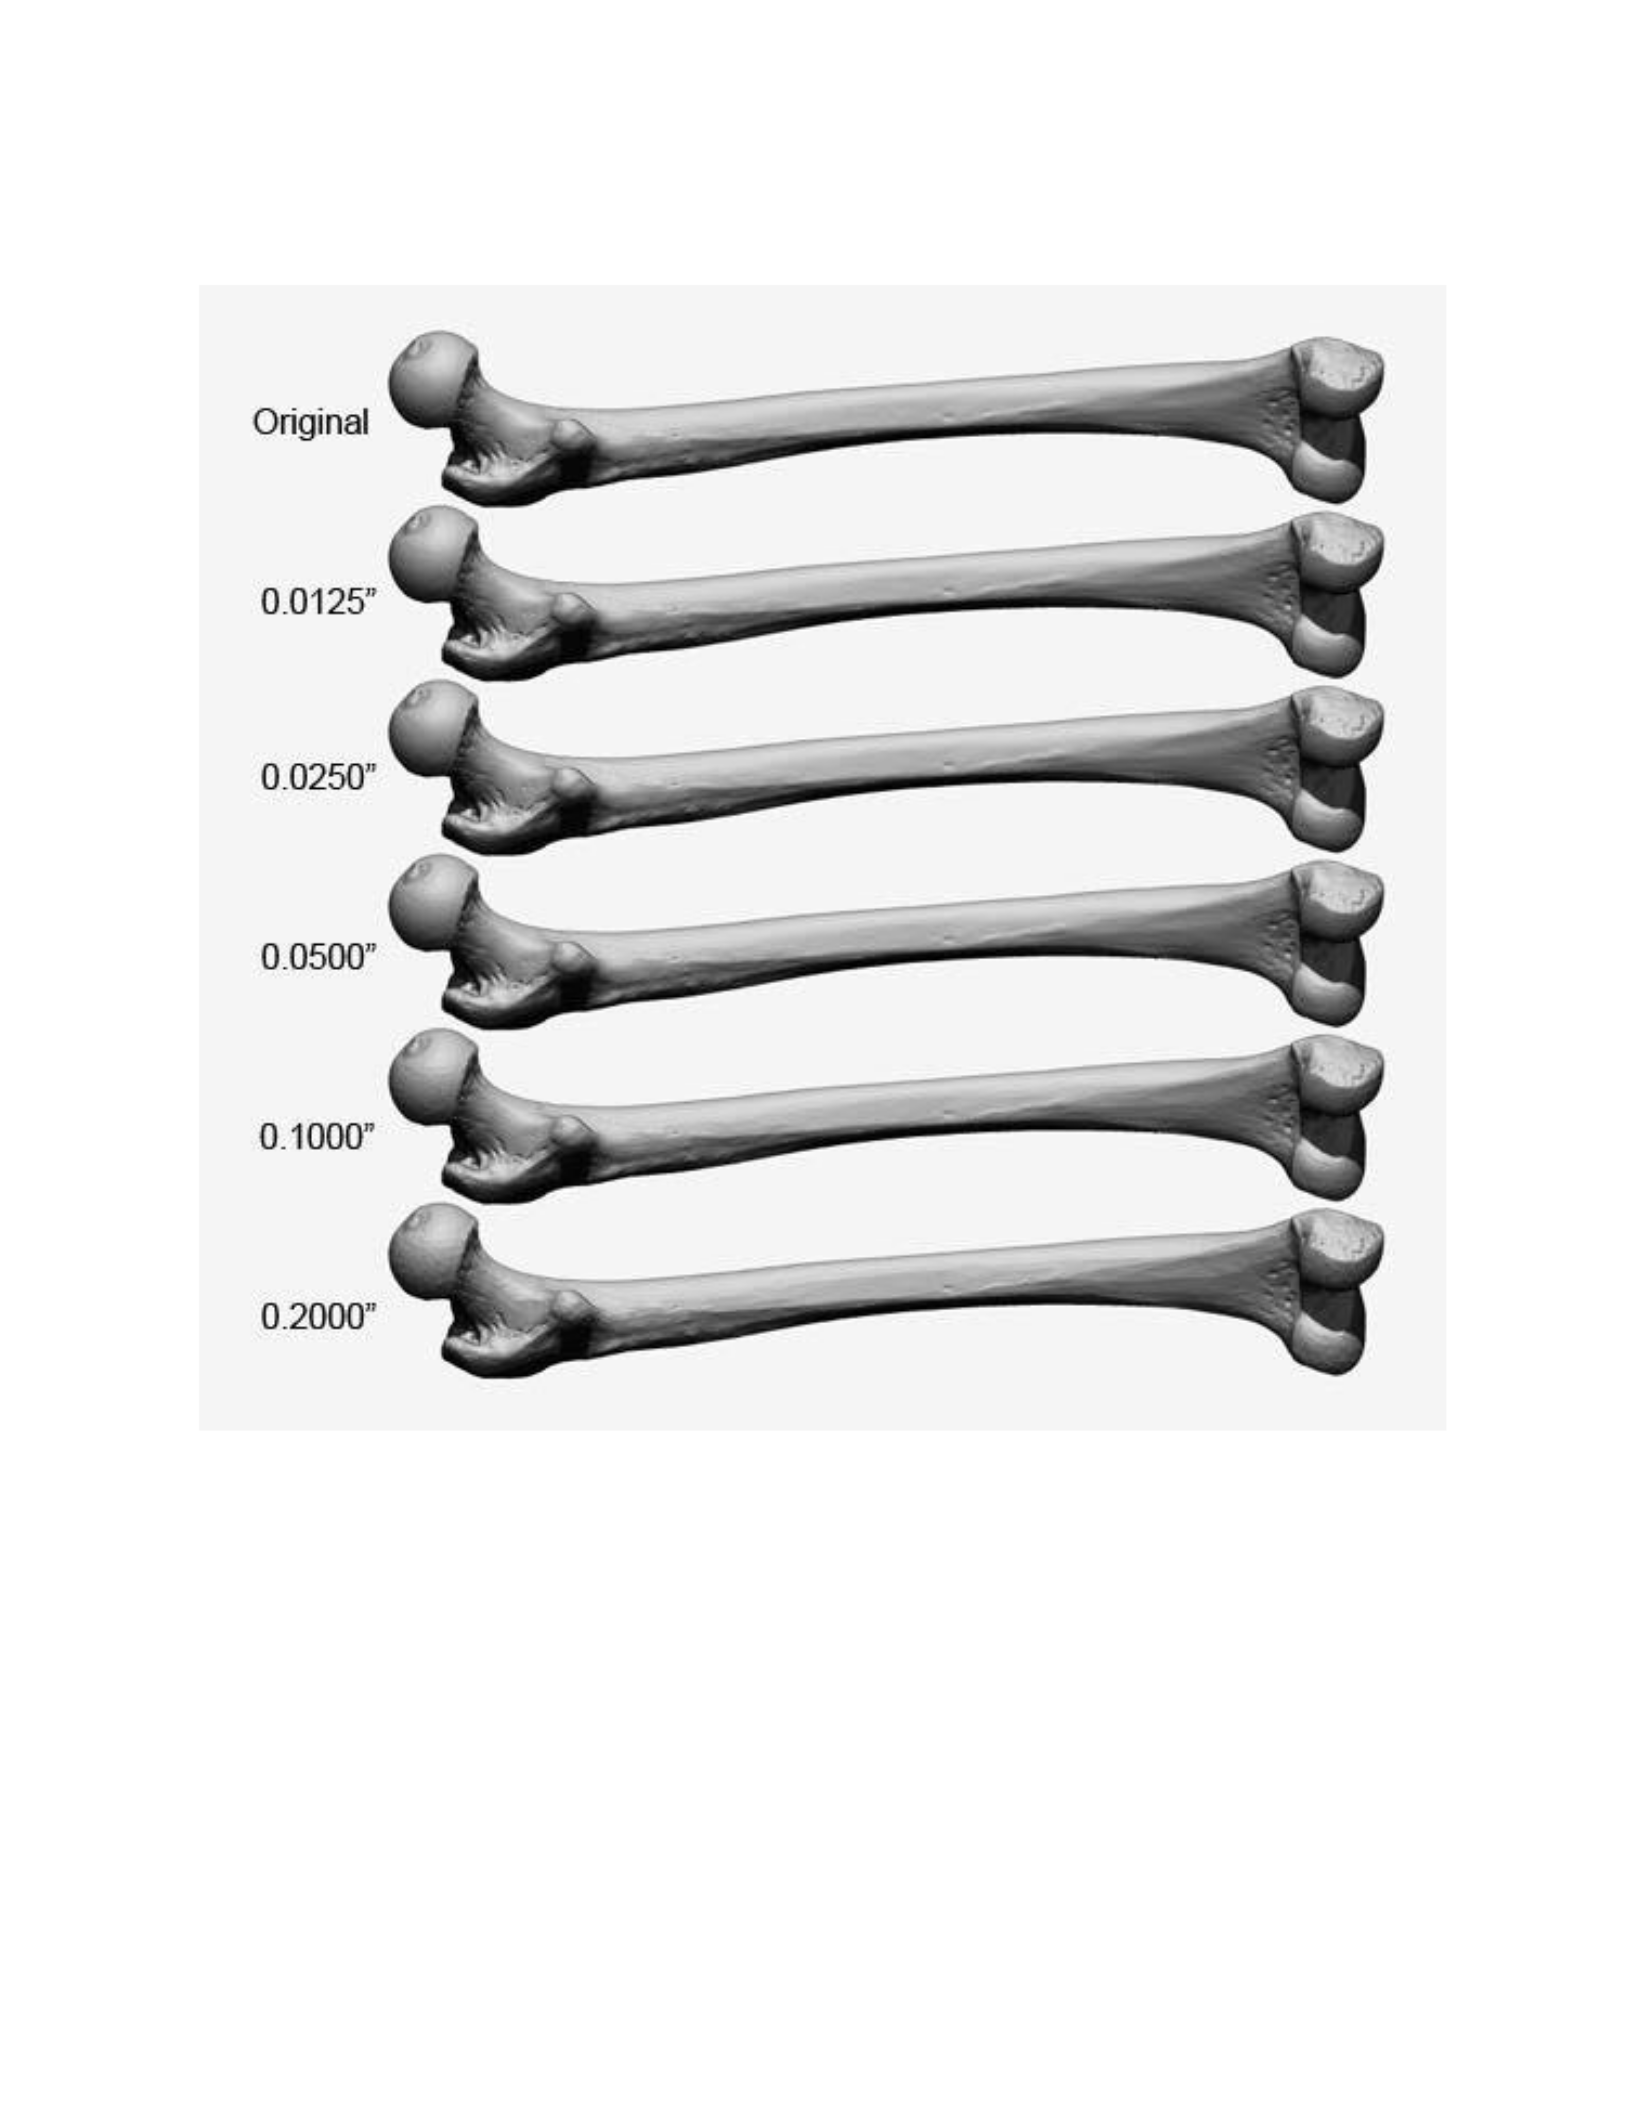
Figure 66: This image was created with ZBrush™ 4r4 and Adobe® Photoshop® CS5 to illustrate the loss of detail
that results from greater tolerance values. The original model without simplification is located at the top, with
increasing tolerance values resulting in higher simplification. Note the faceting of the head of the femur with greater
tolerance values (0.2000”).
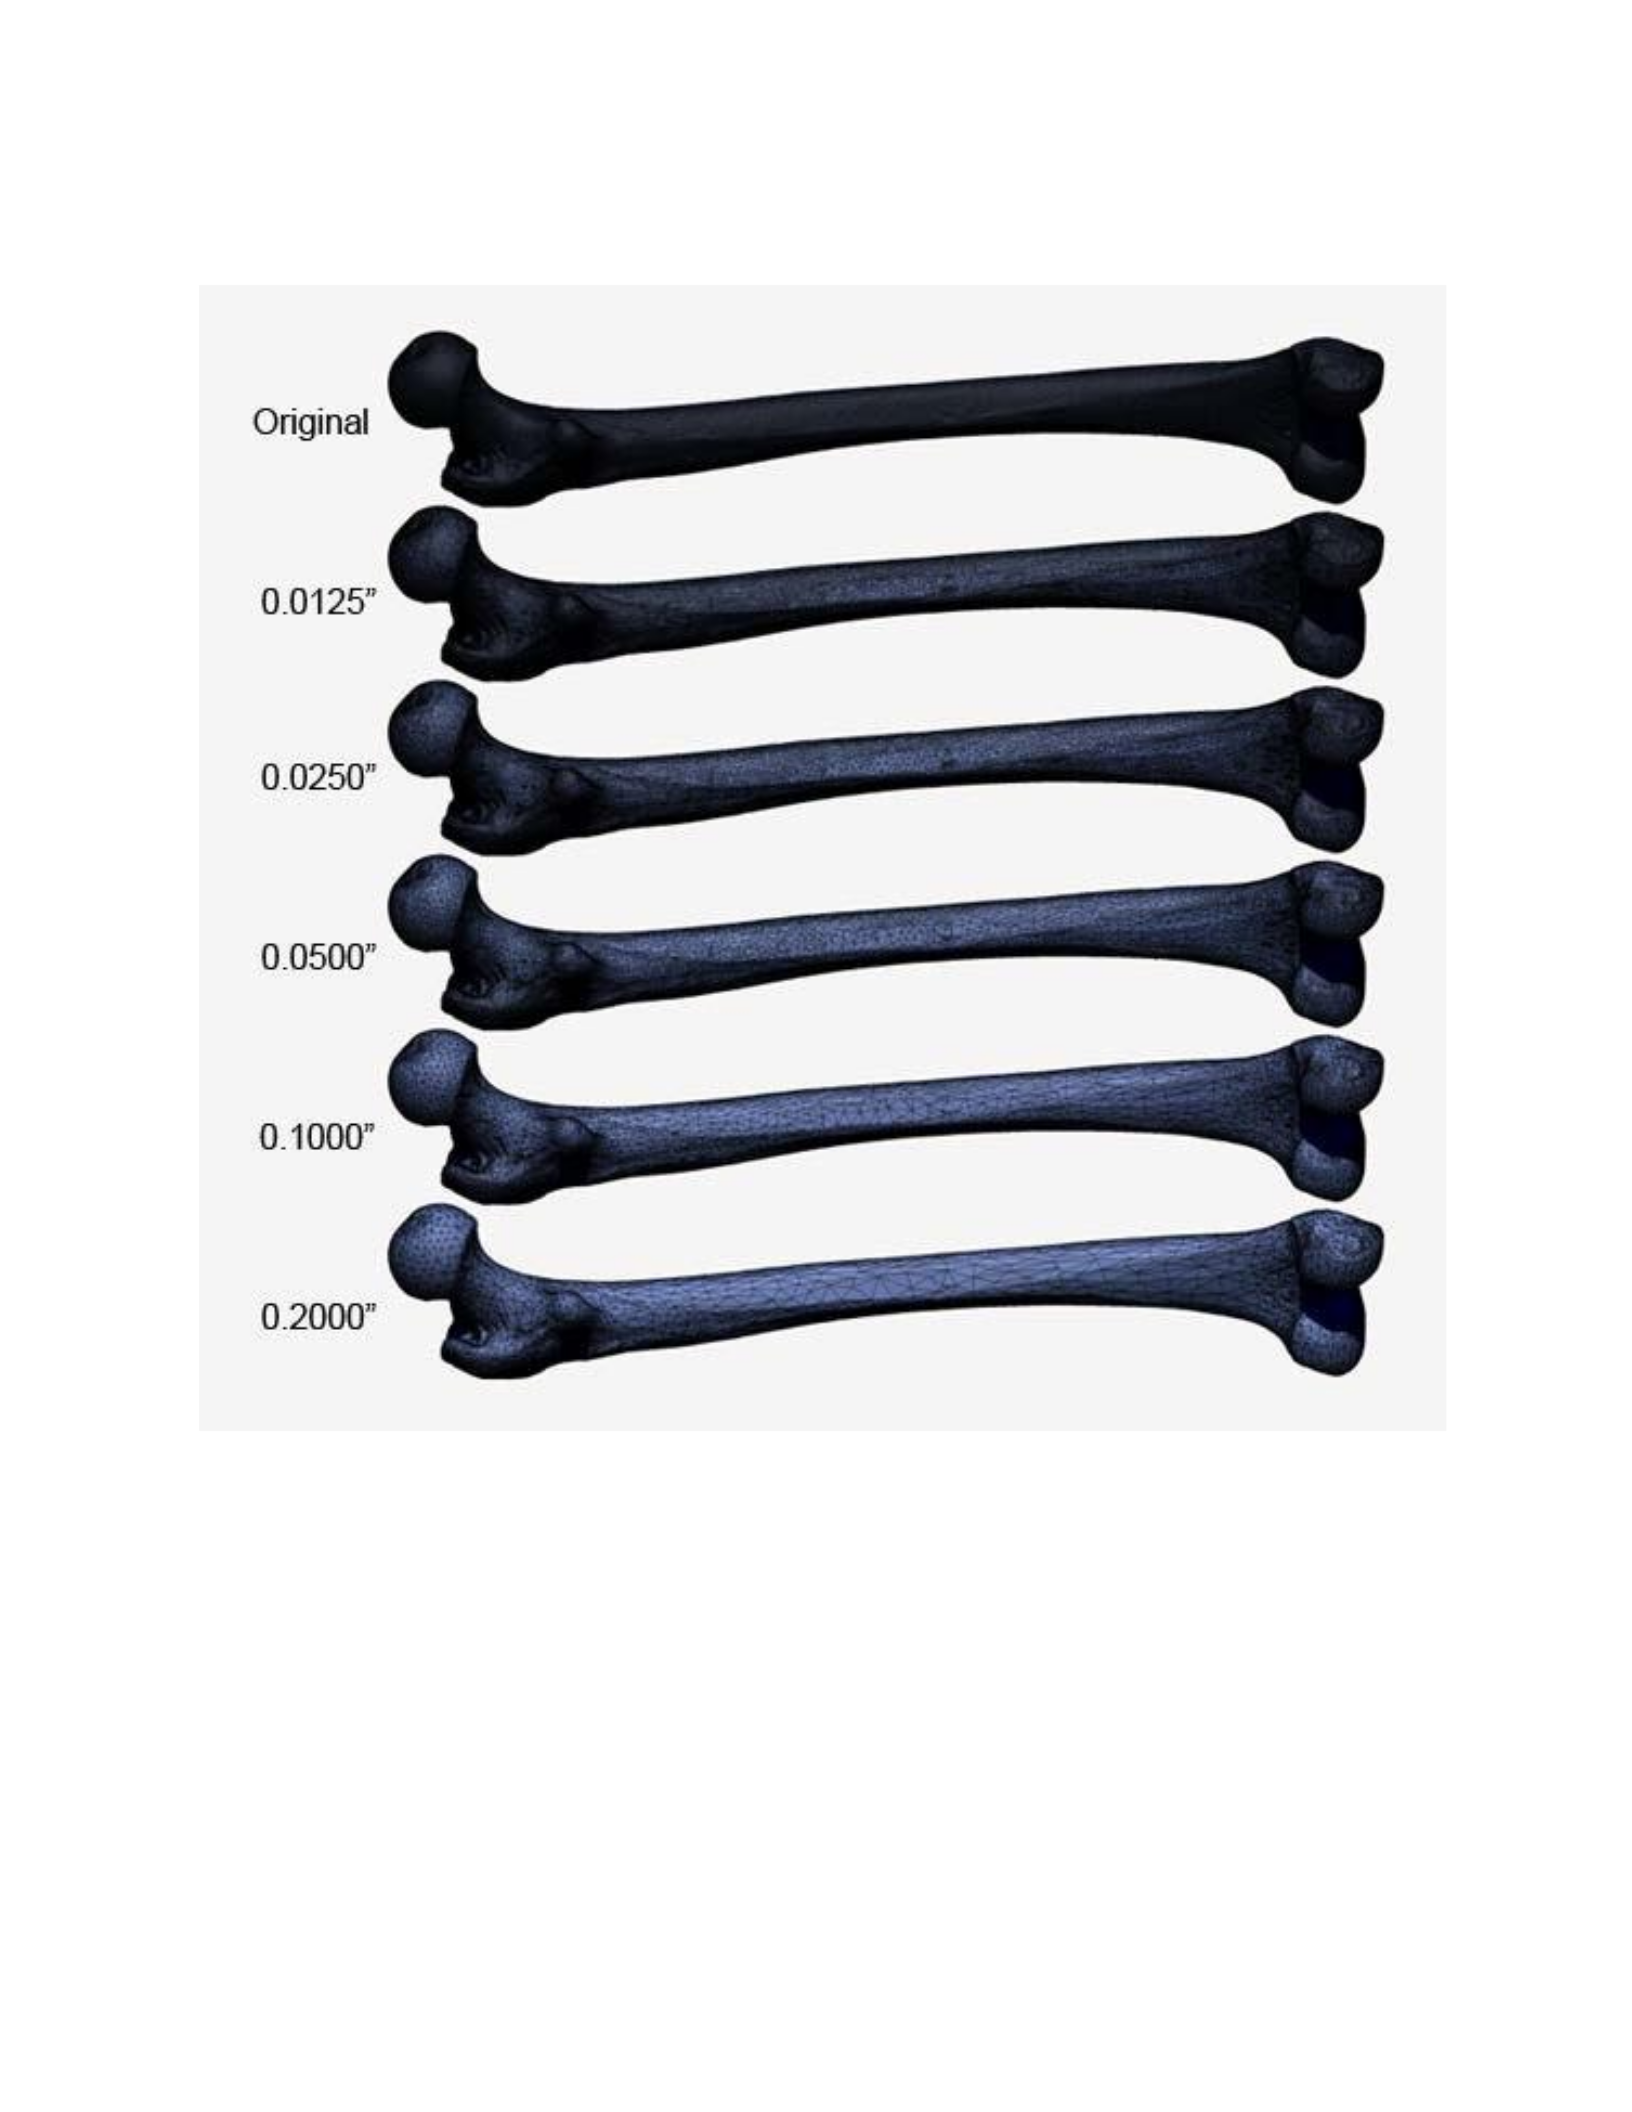
Figure 67: The simplification process is more apparent with a wireframe view of the femur, illustrating the density
of triangles within each mesh.
Table 1: A chart illustrating the amount of triangles contained in the original, and for each tolerance value that was
processed with the Simplify feature in ScanStudio HD Pro™.

Original
1,140,714 triangles
0.0125”
270,658 triangles
0.0250”
118,847 triangles
0.0500”
52,942 triangles
0.1000”
21,833 triangles
0.2000”
9,384 triangles
Choosing the appropriate tolerance value depends on the intended purpose of the PDF
file. If the file will be used simply for presentations and education, the higher simplification
levels should be acceptable. If the PDF will be sent to a colleague for measurement or for
presentation in court, then lower simplification levels should be appropriate if the original
resolution of the model inhibits computer performance. Regardless, the original resolution model
should always be maintained for documentation purposes.
Measurement
Although the NextEngine ScanStudio HD Pro™ software is able to measure surface area,
and volume with additional software, it does not have a function for collecting basic point-
topoint measurements. This deficiency is easily overcome with the use of the 3D measurement
tool accessible within a 3D PDF document. The 3D measurement tool is found in the drop down
menu that is accessed by clicking on the arrow next to the left-most icon in the 3D viewport
toolbar (Figure 68).
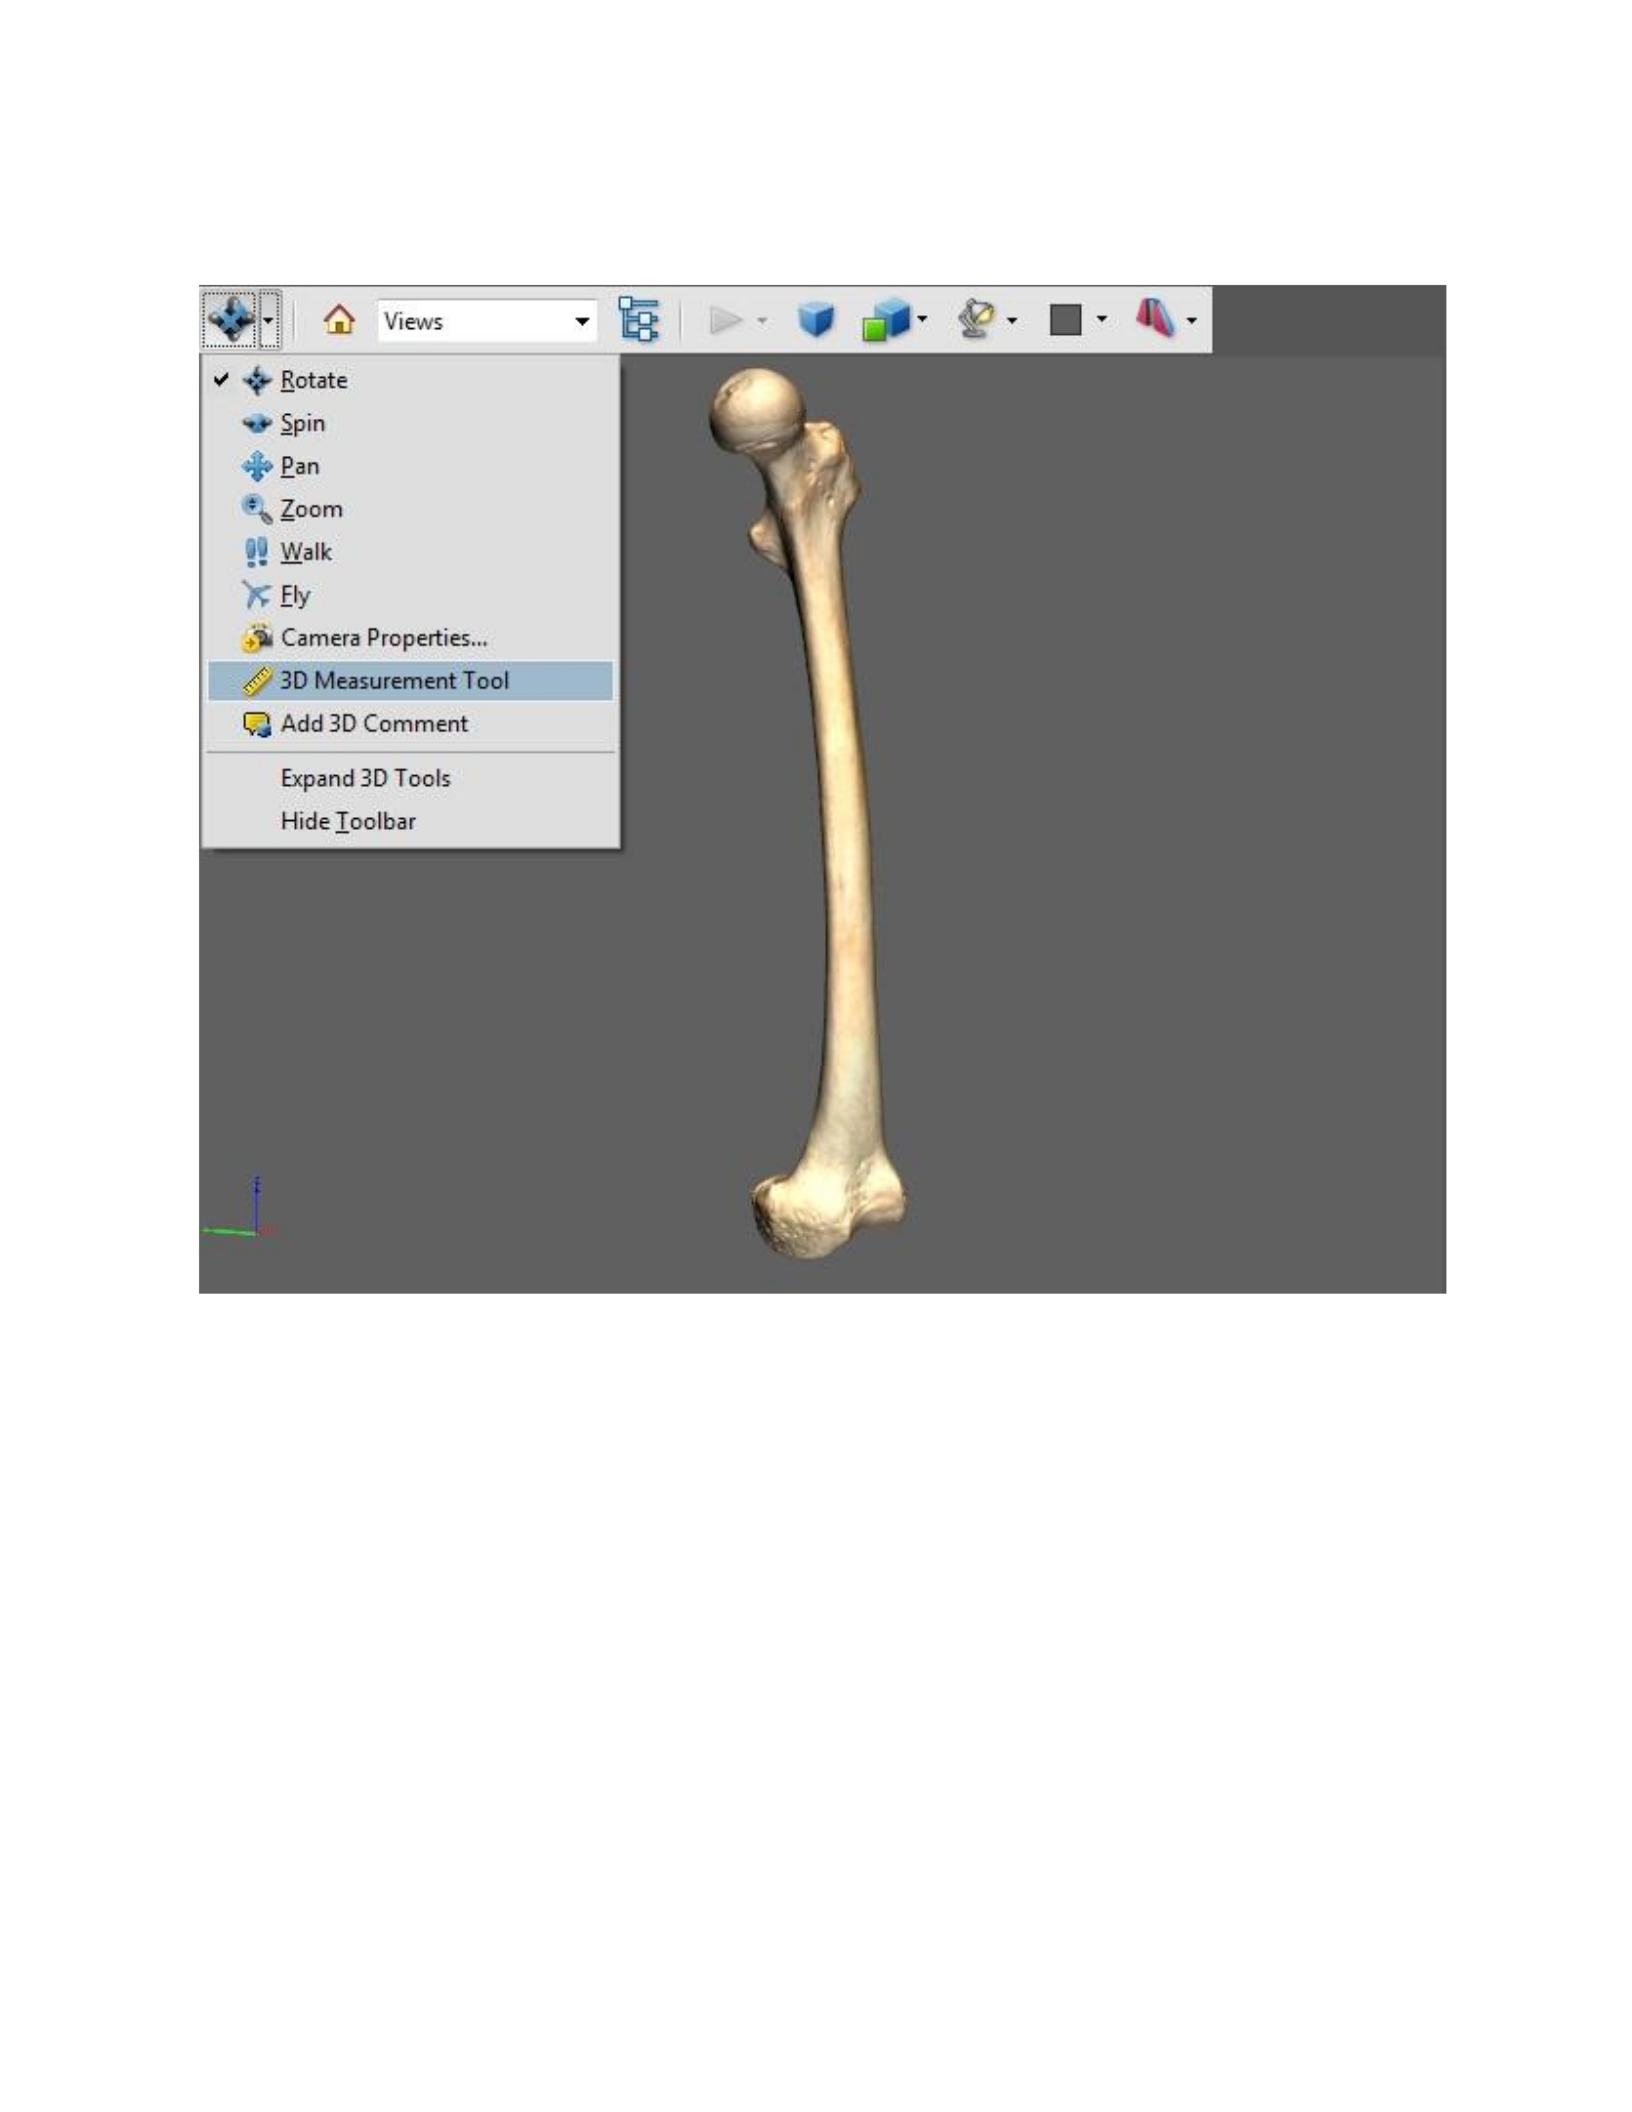
Figure 68: The 3D measurement tool is accessed from the drop down menu on the left side of the toolbar.
Once the 3D measurement tool has been selected, a measurement is recorded by clicking
on the model to choose the first point and then clicking again to select a second point. The user
can navigate within the viewport before selecting the second point if the required location is not
visible in the current view. This is done by holding one of several keys while clicking and
dragging outside of the model, but while still remaining within the 3D window. The Alt key is
used to rotate the model, the Shift key is used to pan the model around the screen, and the
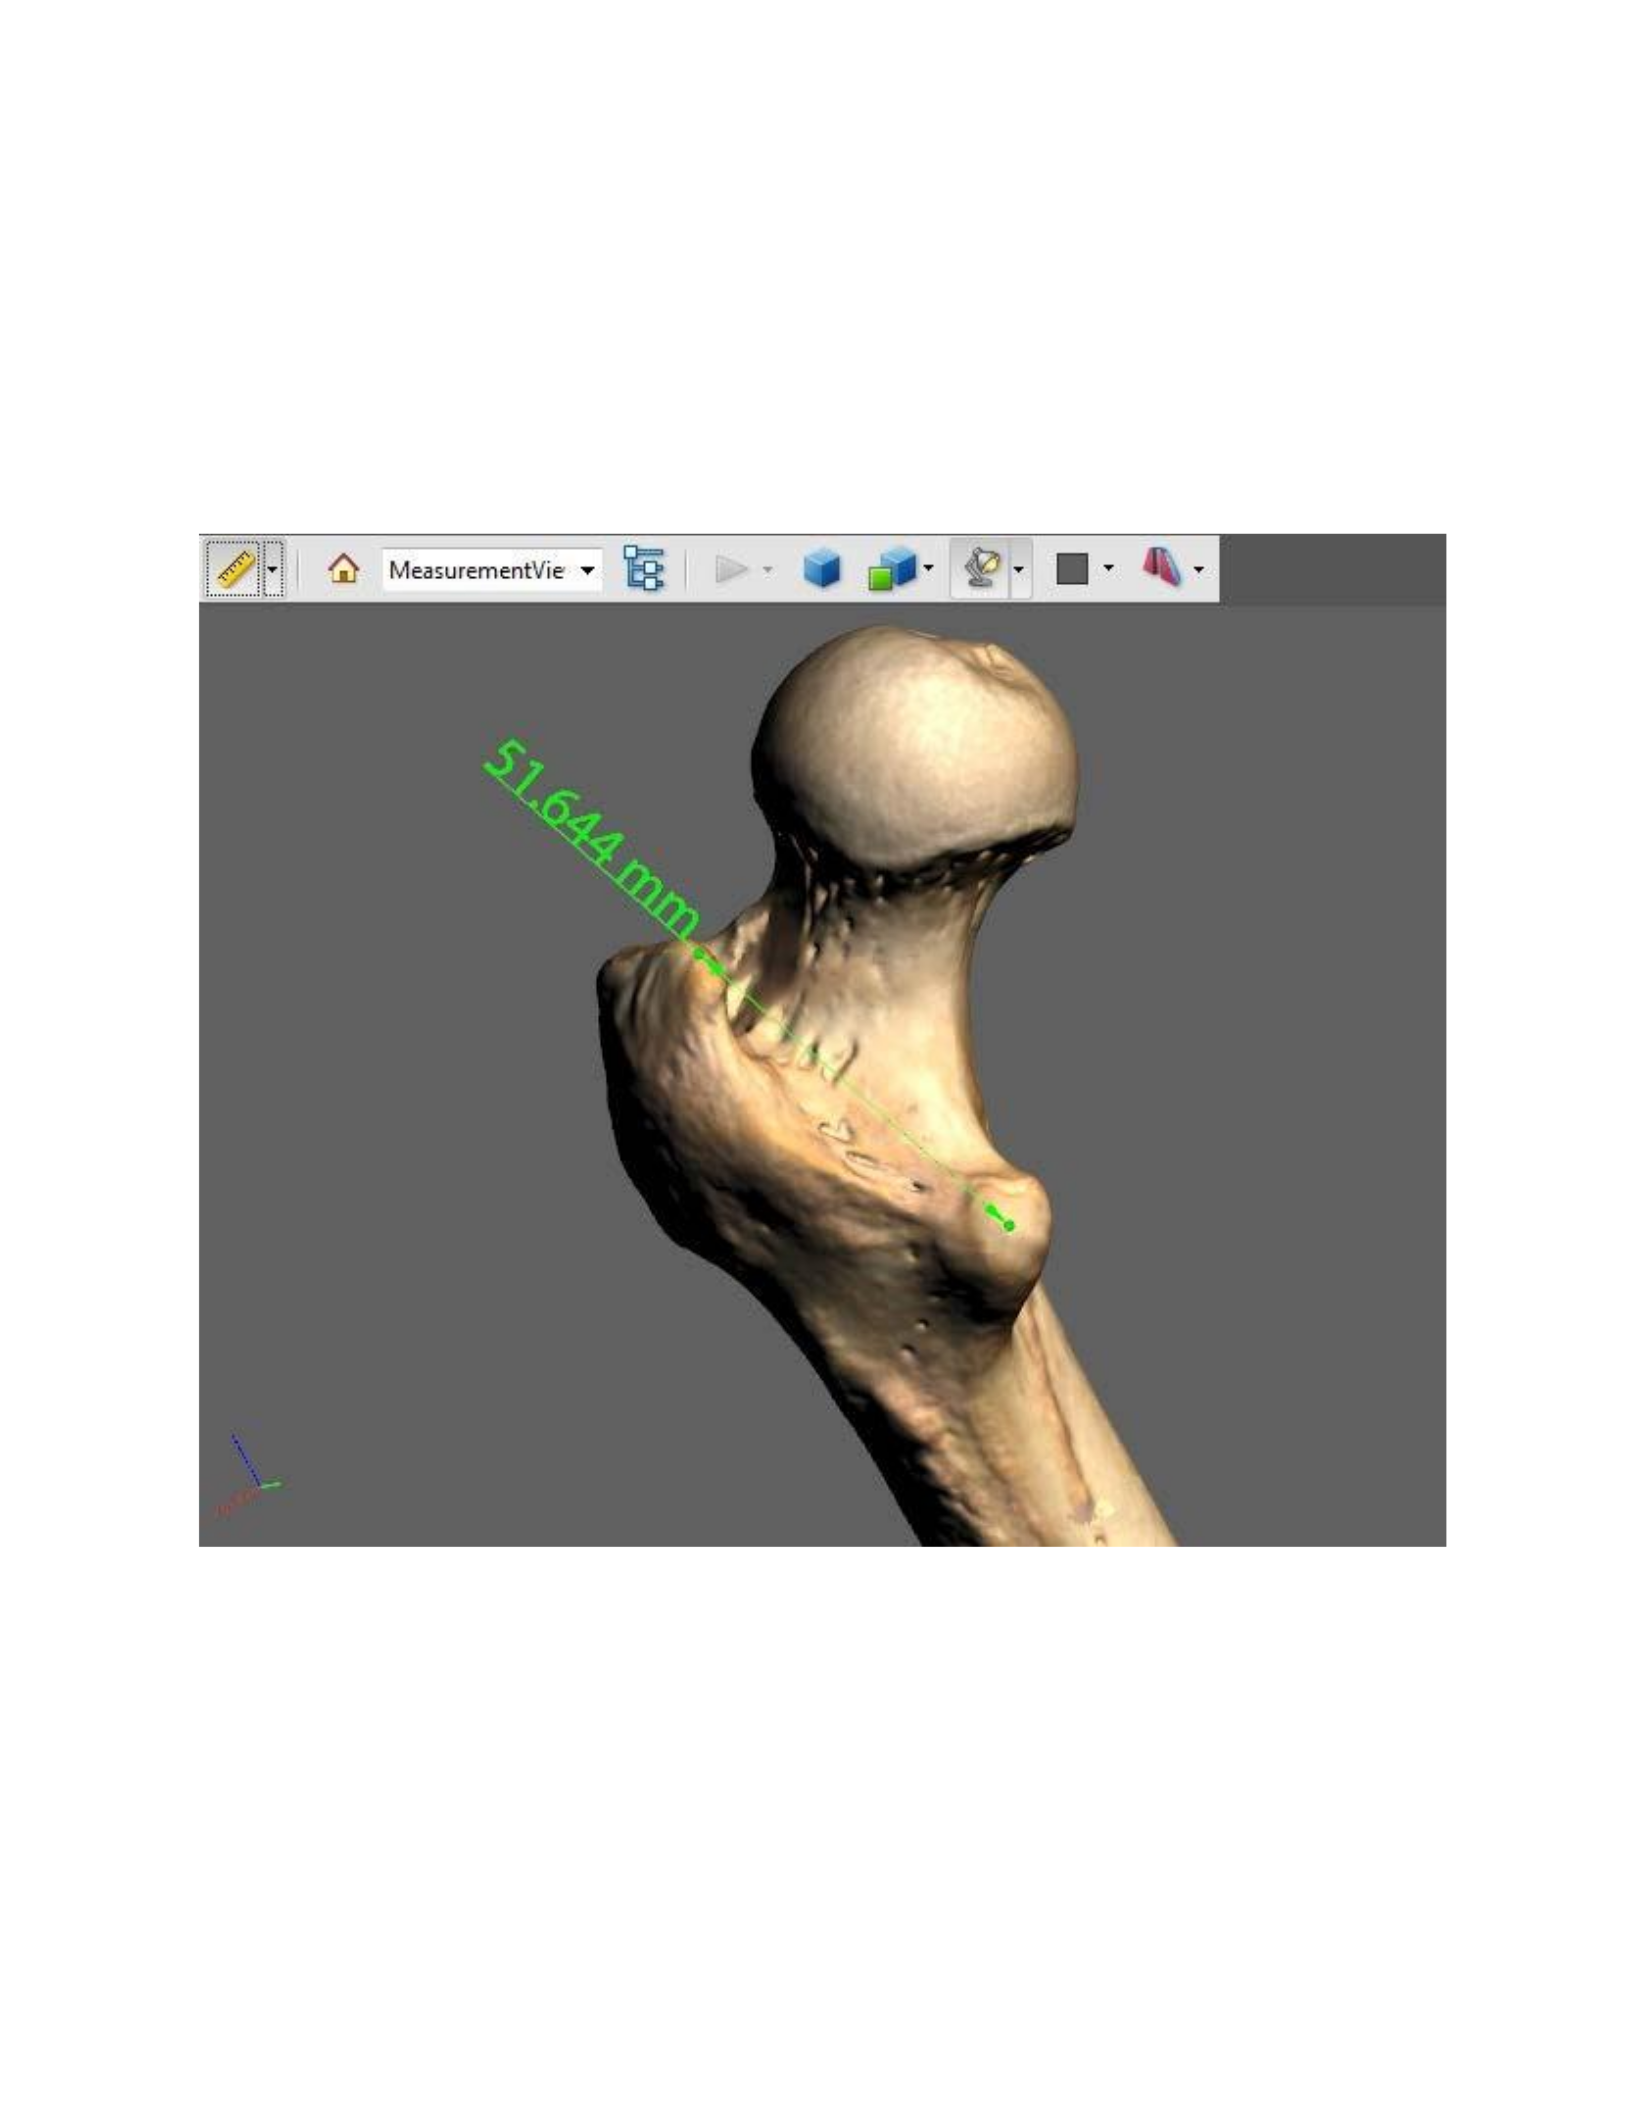
combination of Alt+Shift is utilized to zoom in and out. After the second point is selected, the
resulting measurement is shown within the viewport and can be oriented away from the model by
moving the cursor and clicking once (Figure 69).
Figure 69: An arbitrary measurement being recorded from the femur with the 3D measurement tool within a PDF
opened in Adobe® Acrobat® Reader.
After an individual measurement is recorded, it can be stored and cleared by clicking on
the default view icon in the main tool bar. The measurements taken are saved as Views, which
can be accessed from the corresponding drop-down menu in the main toolbar. These

measurement views can then be relabeled by clicking on Manage Views at the bottom of the
drop-down menu. In order to retain these measurement views within the document, the PDF must
be re-saved.
Issues
The virtual measurement of the human cranium has undergone extensive scrutiny in
testing the reliability of this method when applied to CT data (Hildebolt et al., 1990; Richtsmeier
et al., 1995; Weber et al., 1998), but there have only been limited studies assessing the reliability
of this approach when applied to laser scan data (Park et al., 2006; Scholts et al., 2010). As
mentioned in Chapter 2, Park et al., (2006) and Scholts et al., (2010) did not use the standard set
of measurements used by forensic anthropologists when measuring the human cranium that are
provided by Buikstra & Ubelaker (1994). Thus, the reliability of recording virtual measurements
from laser scan data of the human cranium has not been established for use in forensic
anthropology. In order to address this situation, the standard craniometrics used for FORDISK
(Ousley & Jantz 2005) classification were used in this study, which are outlined by Buikstra &
Ubelaker (1994). These measurements were then collected with manual and digital techniques
for comparison. The manual measurements were recorded from the cranium using both spreading
and sliding calipers, and the digital measurements were acquired using the 3D measurement tools
within the PDF document, which was embedded with a 3D model created from scan data of the
same cranium. Before creating the PDF, the cranium model was simplified with a tolerance of
0.0250”. This lowered the triangle count from 3,324,694 triangles to a more manageable 493,356

triangles. The texture information was also discarded by isolating the OBJ file into its own folder
prior to converting it to a U3D file within Adobe® Photoshop® CS5.
After the measurements were collected using the 3D measurement tool within the PDF,
they were organized into a chart for comparison (Table 2). Note that the maximum alveolar
breadth was not collected because the palette was resorbed. Upon observation, several
measurements were found to be exactly the same and the measurements that were different
deviated by only one or two millimeters. To further investigate the reliability of the digital
technique, each set of measurements was analyzed through FORDISC 3.0 (Ousley & Jantz
2005), using all groups selected, and then only with male groups selected. The results of applying
multigroup discriminant function analysis to both sets of measurements indicated a classification
of the cranium as a Chinese male. When assessed based on sex and ancestry the manual
measurements resulted in a posterior probability of 0.371 and a typicality of 0.593. The digital
measurements resulted in a posterior probability of 0.652 and a typicality of 0.615. When
assessed based only on sex, the manual measurements resulted in a posterior probability of 0.588
and a typicality of .640, and the digital measurements resulted in a moderately high posterior
probability of 0.706 and typicality of 0.638. The analysis of both manual and digital
measurements resulted in the same classification, suggesting the reliability of the digital
techniques. Of special note is that the digital measurements resulted in a slightly higher
probability for the resulting classification.
Table 2: The results of the FORDISC measurements taken with manual and digital techniques.

FORDISC
Measurements
Manual
Digital
Difference
Maximum length (g-op)
174 mm
176 mm
2 mm
Maximum breadth (eueu)
139 mm
137 mm
2 mm
Bizygomatic breadth (zy-
zy)
130 mm
129 mm
1 mm
Basion-bregma (ba-b)
142 mm
143 mm
1 mm
Cranial base length (ban)
95 mm
96 mm
1 mm
Basion-Prosthion length
(ba-pr)
96 mm
95 mm
1 mm
Max. Alveolar breadth
(ecm-ecm)
-
-
Max. Alveolar length (pr-
alv)
50 mm
50 mm
n/a
Biauricular breadth
(auau)
116 mm
117 mm
1 mm
Upper facial height
77 mm
77 mm
n/a
Minimum frontal breadth
(ft-ft)
88 mm
89 mm
1 mm
Upper facial breadth
(fmt-fmt)
98mm
98 mm
n/a
Nasal height (n-ns)
55 mm
55 mm
n/a
Nasal breadth (al-al)
25 mm
25 mm
n/a
Orbital breadth (d-ec)
38 mm (left) 38 mm
(right)
38 mm (left) 39 mm
(right)
n/a & 1 mm
Orbital height
37 mm (left) 39 mm
(right)
39 mm (left) 40 mm
(right)
2 mm & 1 mm
Biorbital breadth (ec-ec)
94 mm
95 mm
1 mm
Interorbital breadth (d-d)
20 mm
20 mm
n/a
Frontal chord (n-b)
117 mm
117 mm
n/a
Parietal chord (b-l)
113 mm
113 mm
n/a
Occipital chord (l-o)
98 mm
96 mm
2 mm
Foramen magnum length
(ba-o)
34 mm
36 mm
2 mm
Foramen magnum
breadth
29 mm
29 mm
n/a
Mastoid length
28 mm (left) 28 mm
(right)
29 mm (left) 29 mm
(right)
1 mm & 1 mm

Illustration
Rendered Still Images
The 3D model processed from laser scan data can be rendered to create 2D illustrations
for use in reports, presentations, and publications. These rendered still images are the result of the
rendering process, which is a digital method for creating high-quality or photorealistic 2D images
from 3D models through the simulation of lighting, shading, material and texture information.
Basic rendered images can easily be made by importing a file into ZBrush™ 4r4 and using the
Best Preview Render (BPR) feature (Figure 70).This is done by clicking Import in the Tool
palette and choosing an OBJ file. The Best Preview Render feature can then be accessed by
going to the Render palette, and clicking on the BPR icon under the BPR RenderPass subpalette
(Figure 71).
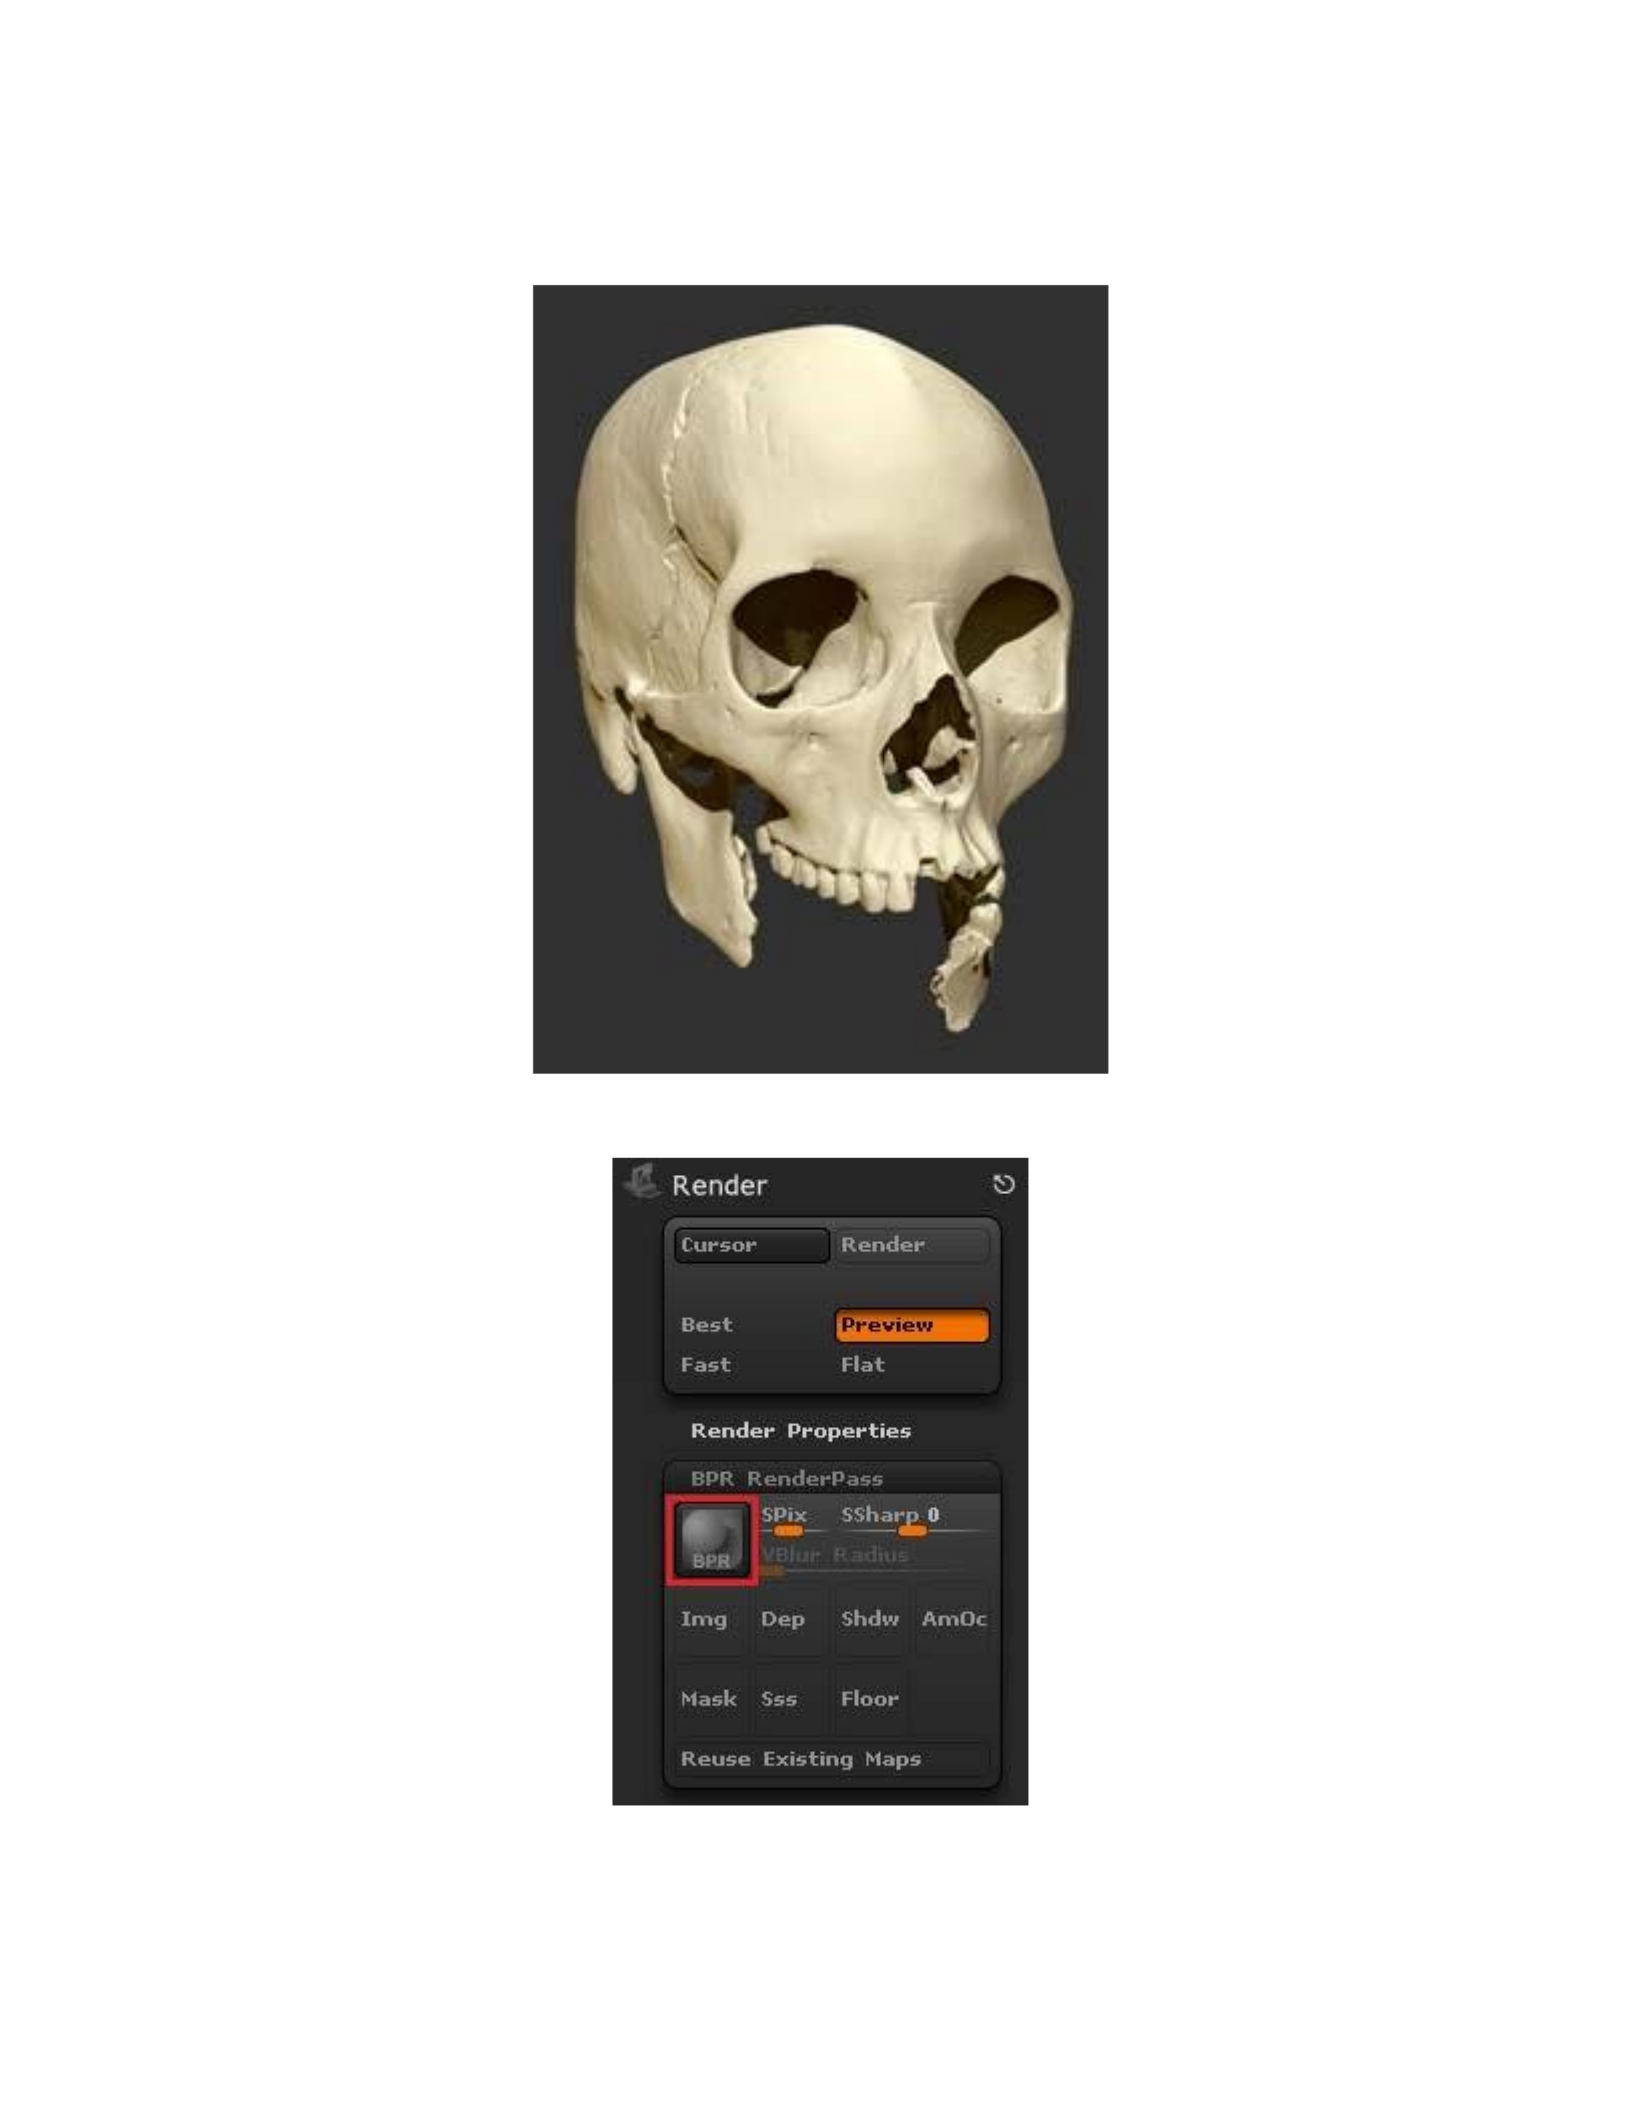
Figure 70: A still image rendered with shadows using the Best Preview Render feature inside of ZBrush™ 4r4.
Figure 71: The Best Preview Render feature within ZBrush 4r4 can be accessed by clicking the BPR button in the
Render palette, highlighted here by the red square.
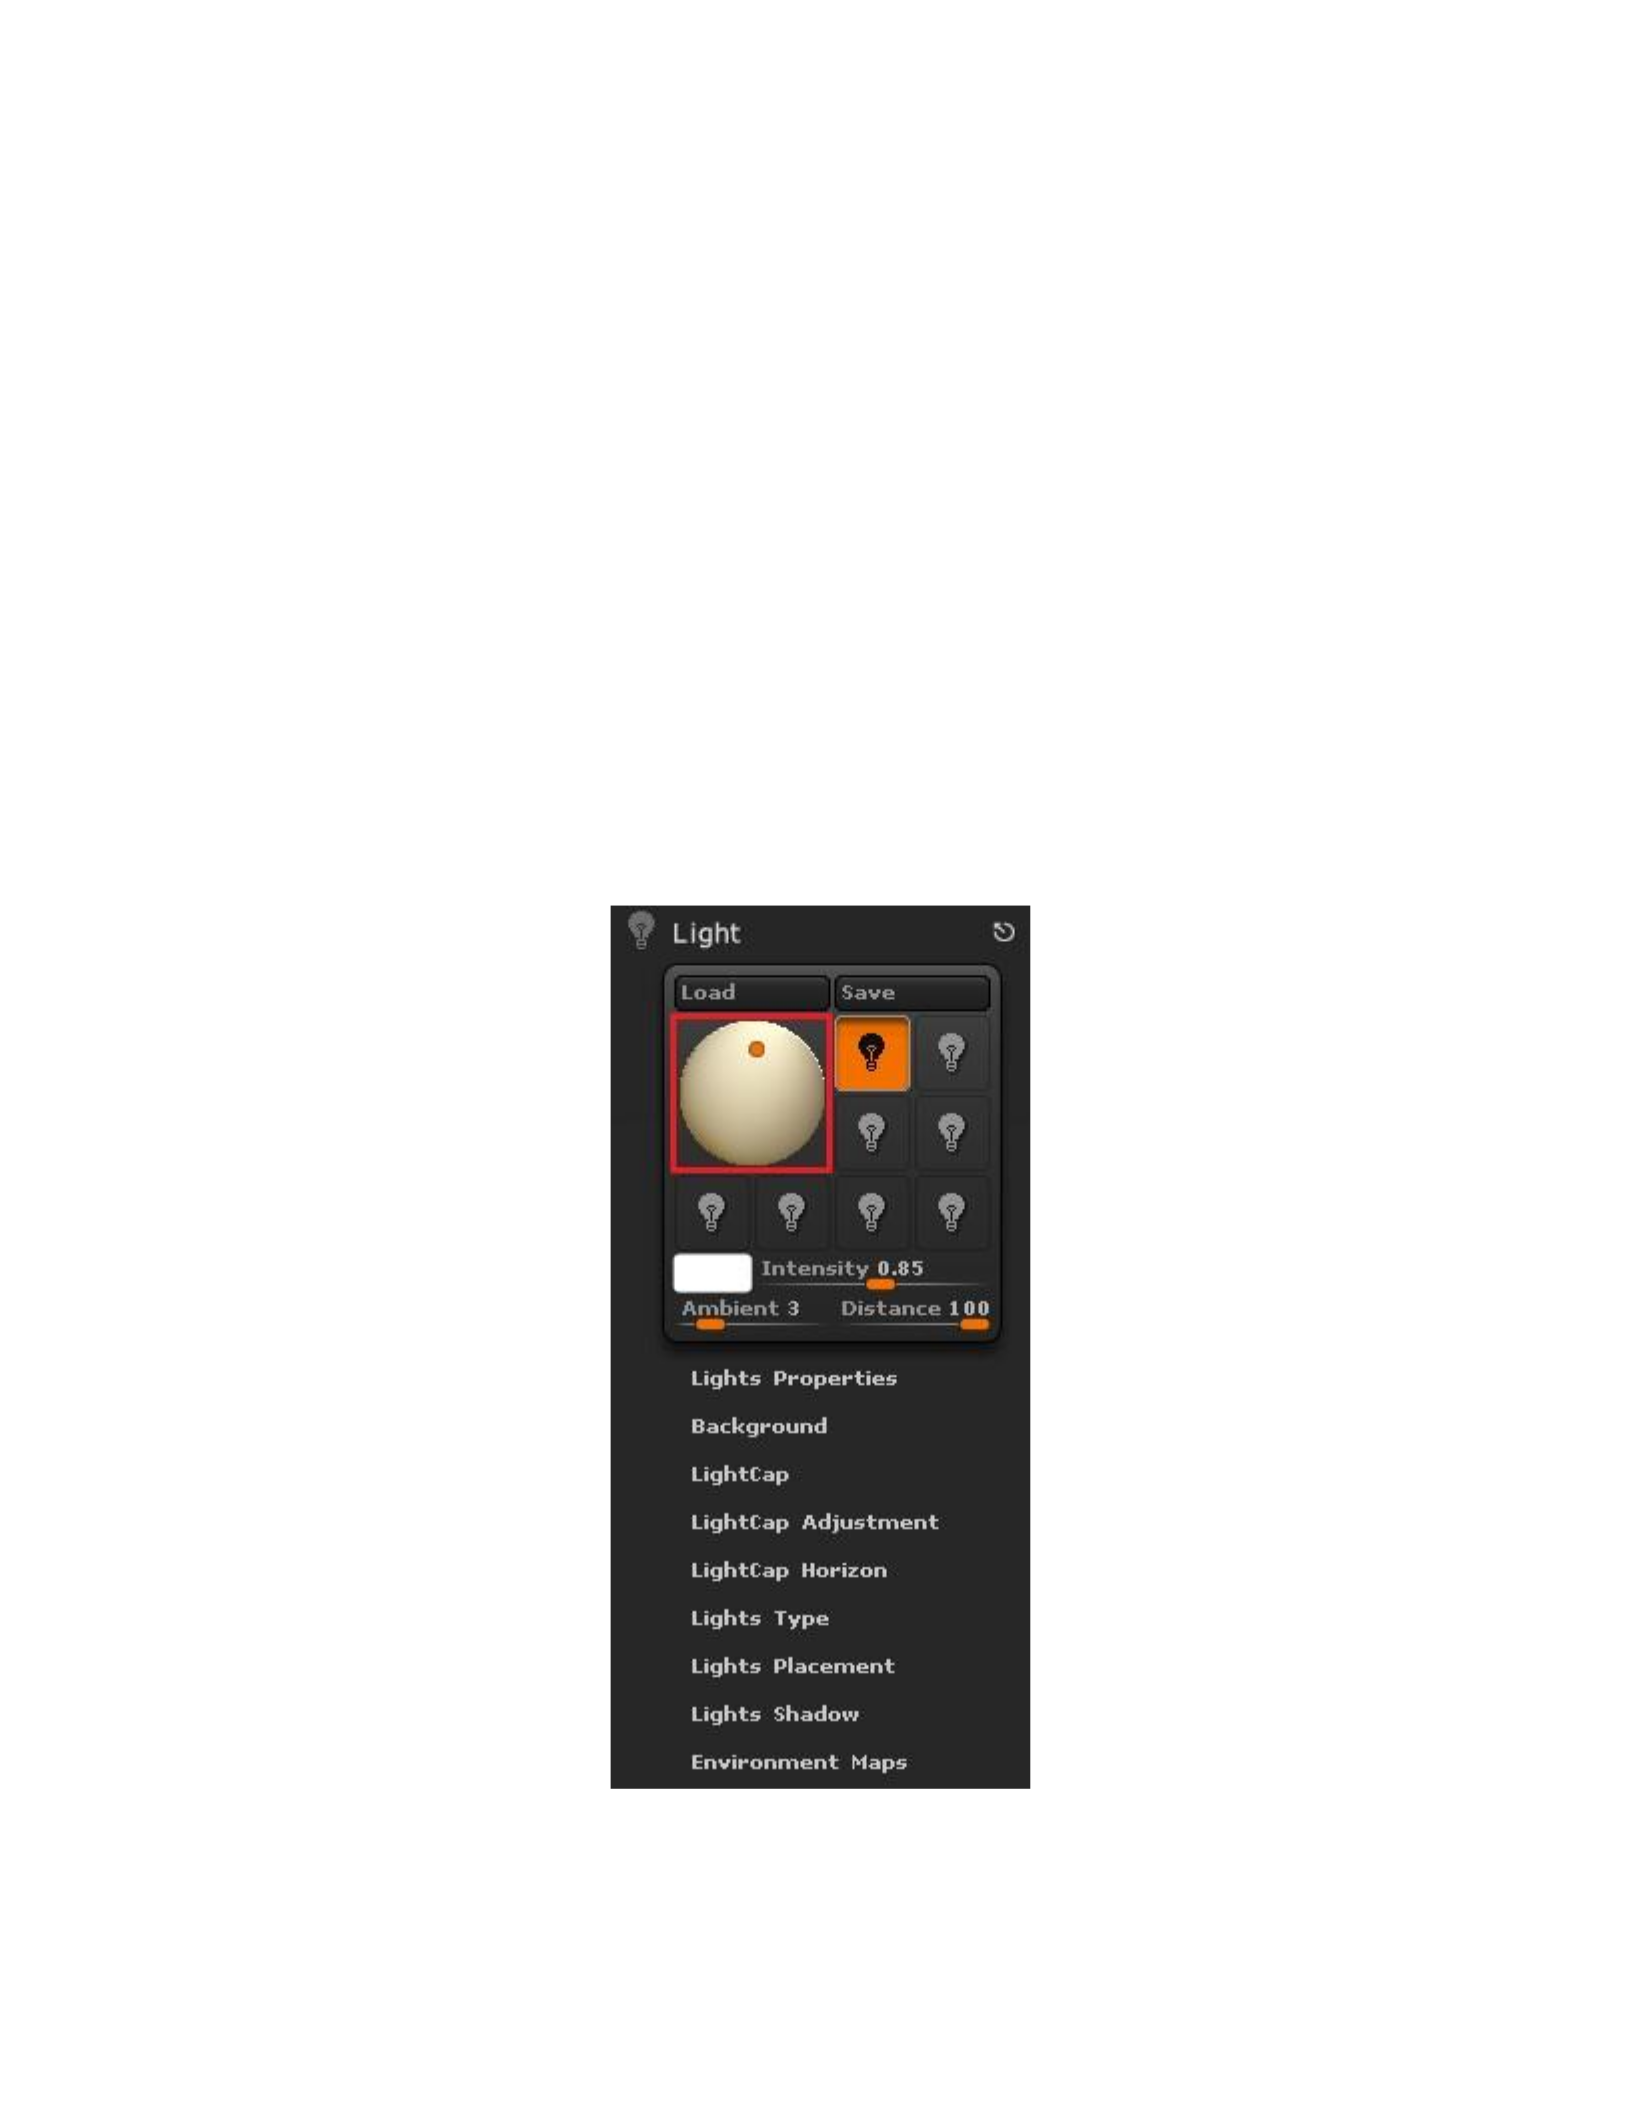
A quicker alternative for using the BPR feature is to use the key board shortcut Shift+R.
The resulting image can then be saved either as a screenshot by pressing the Print Screen key or
by going to the Document palette and using Export to save the image as a PSD or other image
format. The shadows in the image can be controlled by going to the Light palette and
manipulating the colored dot located on the sphere object (Figure 72). This signifies the location
of the light source, and the changes will become apparent after refreshing the render. Additional
lights can be added by clicking one of the light bulb icons next to the sphere object within the
light palette.
Figure 72: Within ZBrush 4r4, the shadows can be manipulated by moving the light source. This is done by moving
the colored dot located on the sphere object within the Light palette, outlined here in red.

The texture information contained within the MTL file that is exported with OBJ files in
the ScanStudio software cannot be imported into ZBrush™ 4r4. Instead, a new material can be
applied to the entire model by clicking on the Material icon in the left-hand palette and making a
selection. The user can also create their own materials, or download materials created by the
ZBrush™ community from the Pixologic MatCap Library
(http://www.pixologic.com/zbrush/downloadcenter/library/). The MatCap Skeleton material was
used with the model in Fig. X. Because the materials in ZBrush™ 4r4 do not represent the actual
color of the object, the rendered stills created using this technique should only be used in
illustrations where color information is not necessary. If texture information in ZBrush™ 4r4
renders is required, it is possible to manually texture the model with photographic references
using the SpotLight feature, but this technique will not be implemented here.
Virtual Reconstruction
When used in conjunction with laser scanned images, the digital sculpting capabilities of
ZBrush™ 4r4 offer a non-invasive alternative to traditional reconstruction techniques for
assembling and recreating damaged or fragmented bone. The virtual reconstruction technique
that is implemented in this project is a manual technique and does not have the scientific
accuracy of other studies that utilize reverse engineering methods such as the one performed by
Benazzi et al. (2009). The example used here to illustrate the digital reconstruction technique in
ZBrush™ 4r4 was a resin cast of an intact cranium and two mandible fragments (Figure 73) from
an actual forensic case purchased from Bone Clones Osteological Reproductions. The cast was
used in lieu of an actual human skull because a fragmented example was unavailable for this
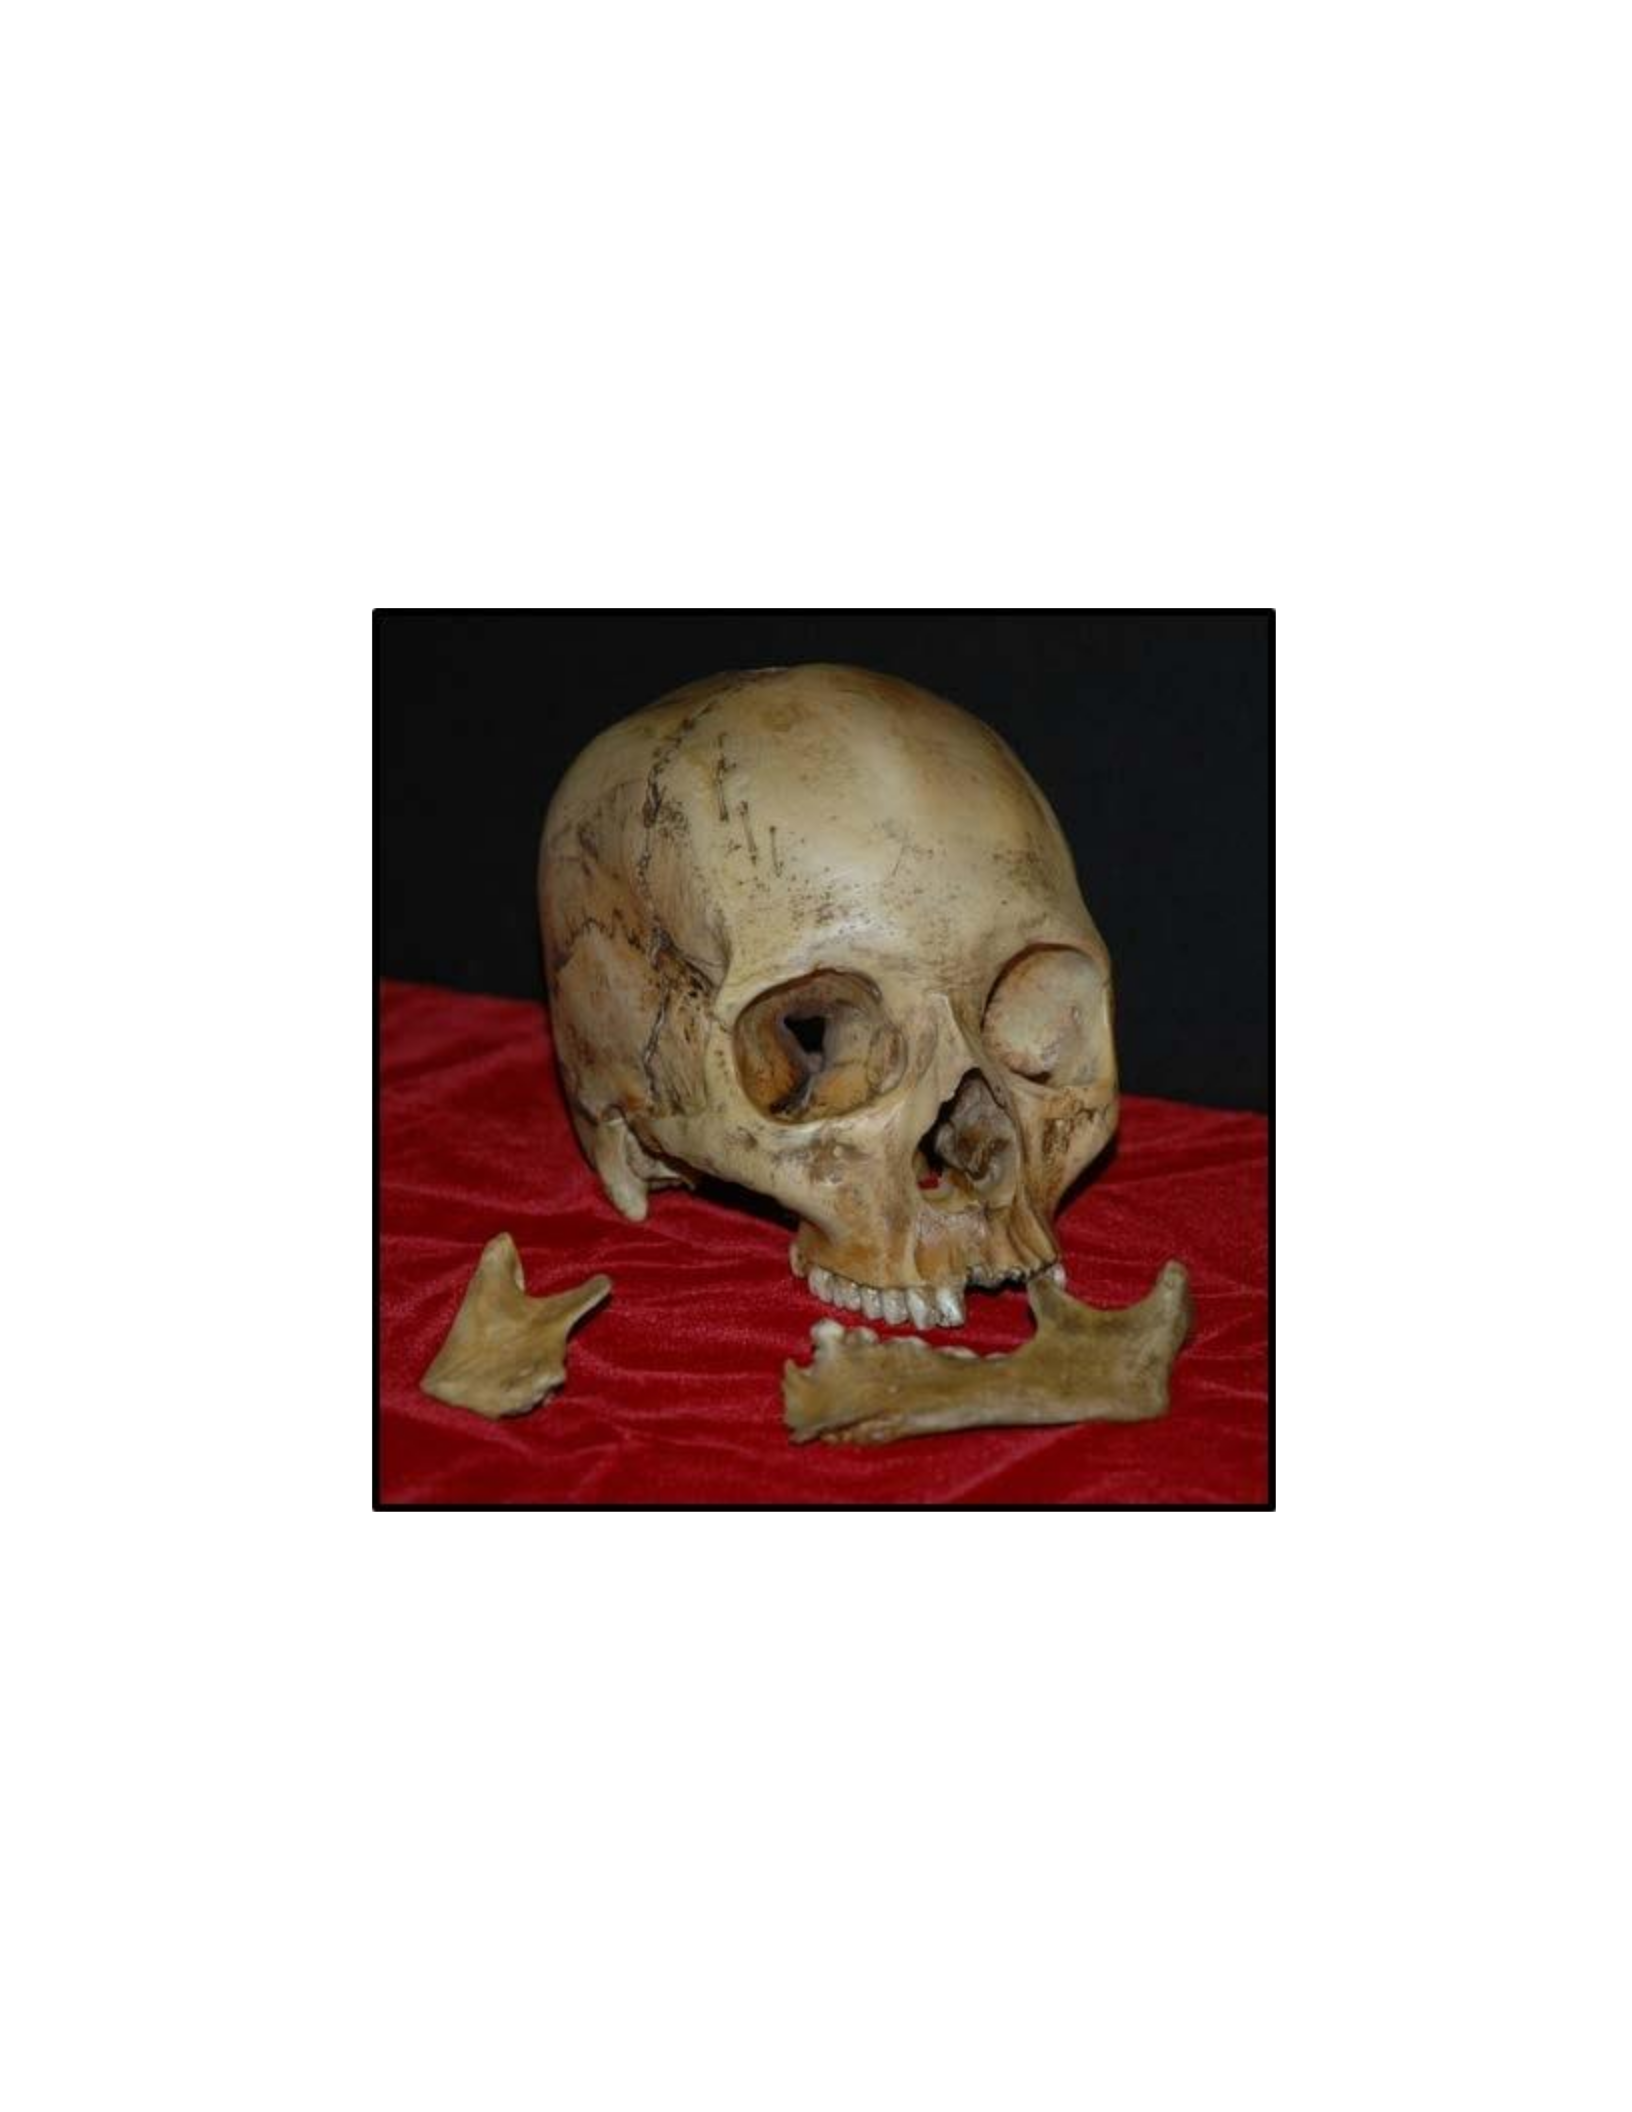
study. The information that arrived with the replica states that the original cranium and mandible
fragments belonged to a female of African ancestry who suffered from two shotgun wounds to
the occipital bone. The mandible was fragmented into at least three pieces, of which only two
were present. The left zygomatic arch was also missing.
Figure 73: A resin cast of a cranium and two mandible fragments were scanned to use as an example for the manual
digital assembly and reconstruction.
The cranium and mandible fragments were scanned and processed using the protocols
outlined in Chapter 4, which resulted in three files that were exported in the OBJ file format.
First, the cranium file was imported into ZBrush™ 4r4 by going to the Tool menu and clicking

import. In ZBrush™ 4r4, a model file is described as a Tool, and the individual selectable
components that comprise the model are called Subtools. After the cranium was opened in the
program, it was reoriented using the offset and rotation sliders in the Deformation palette (Figure
74).
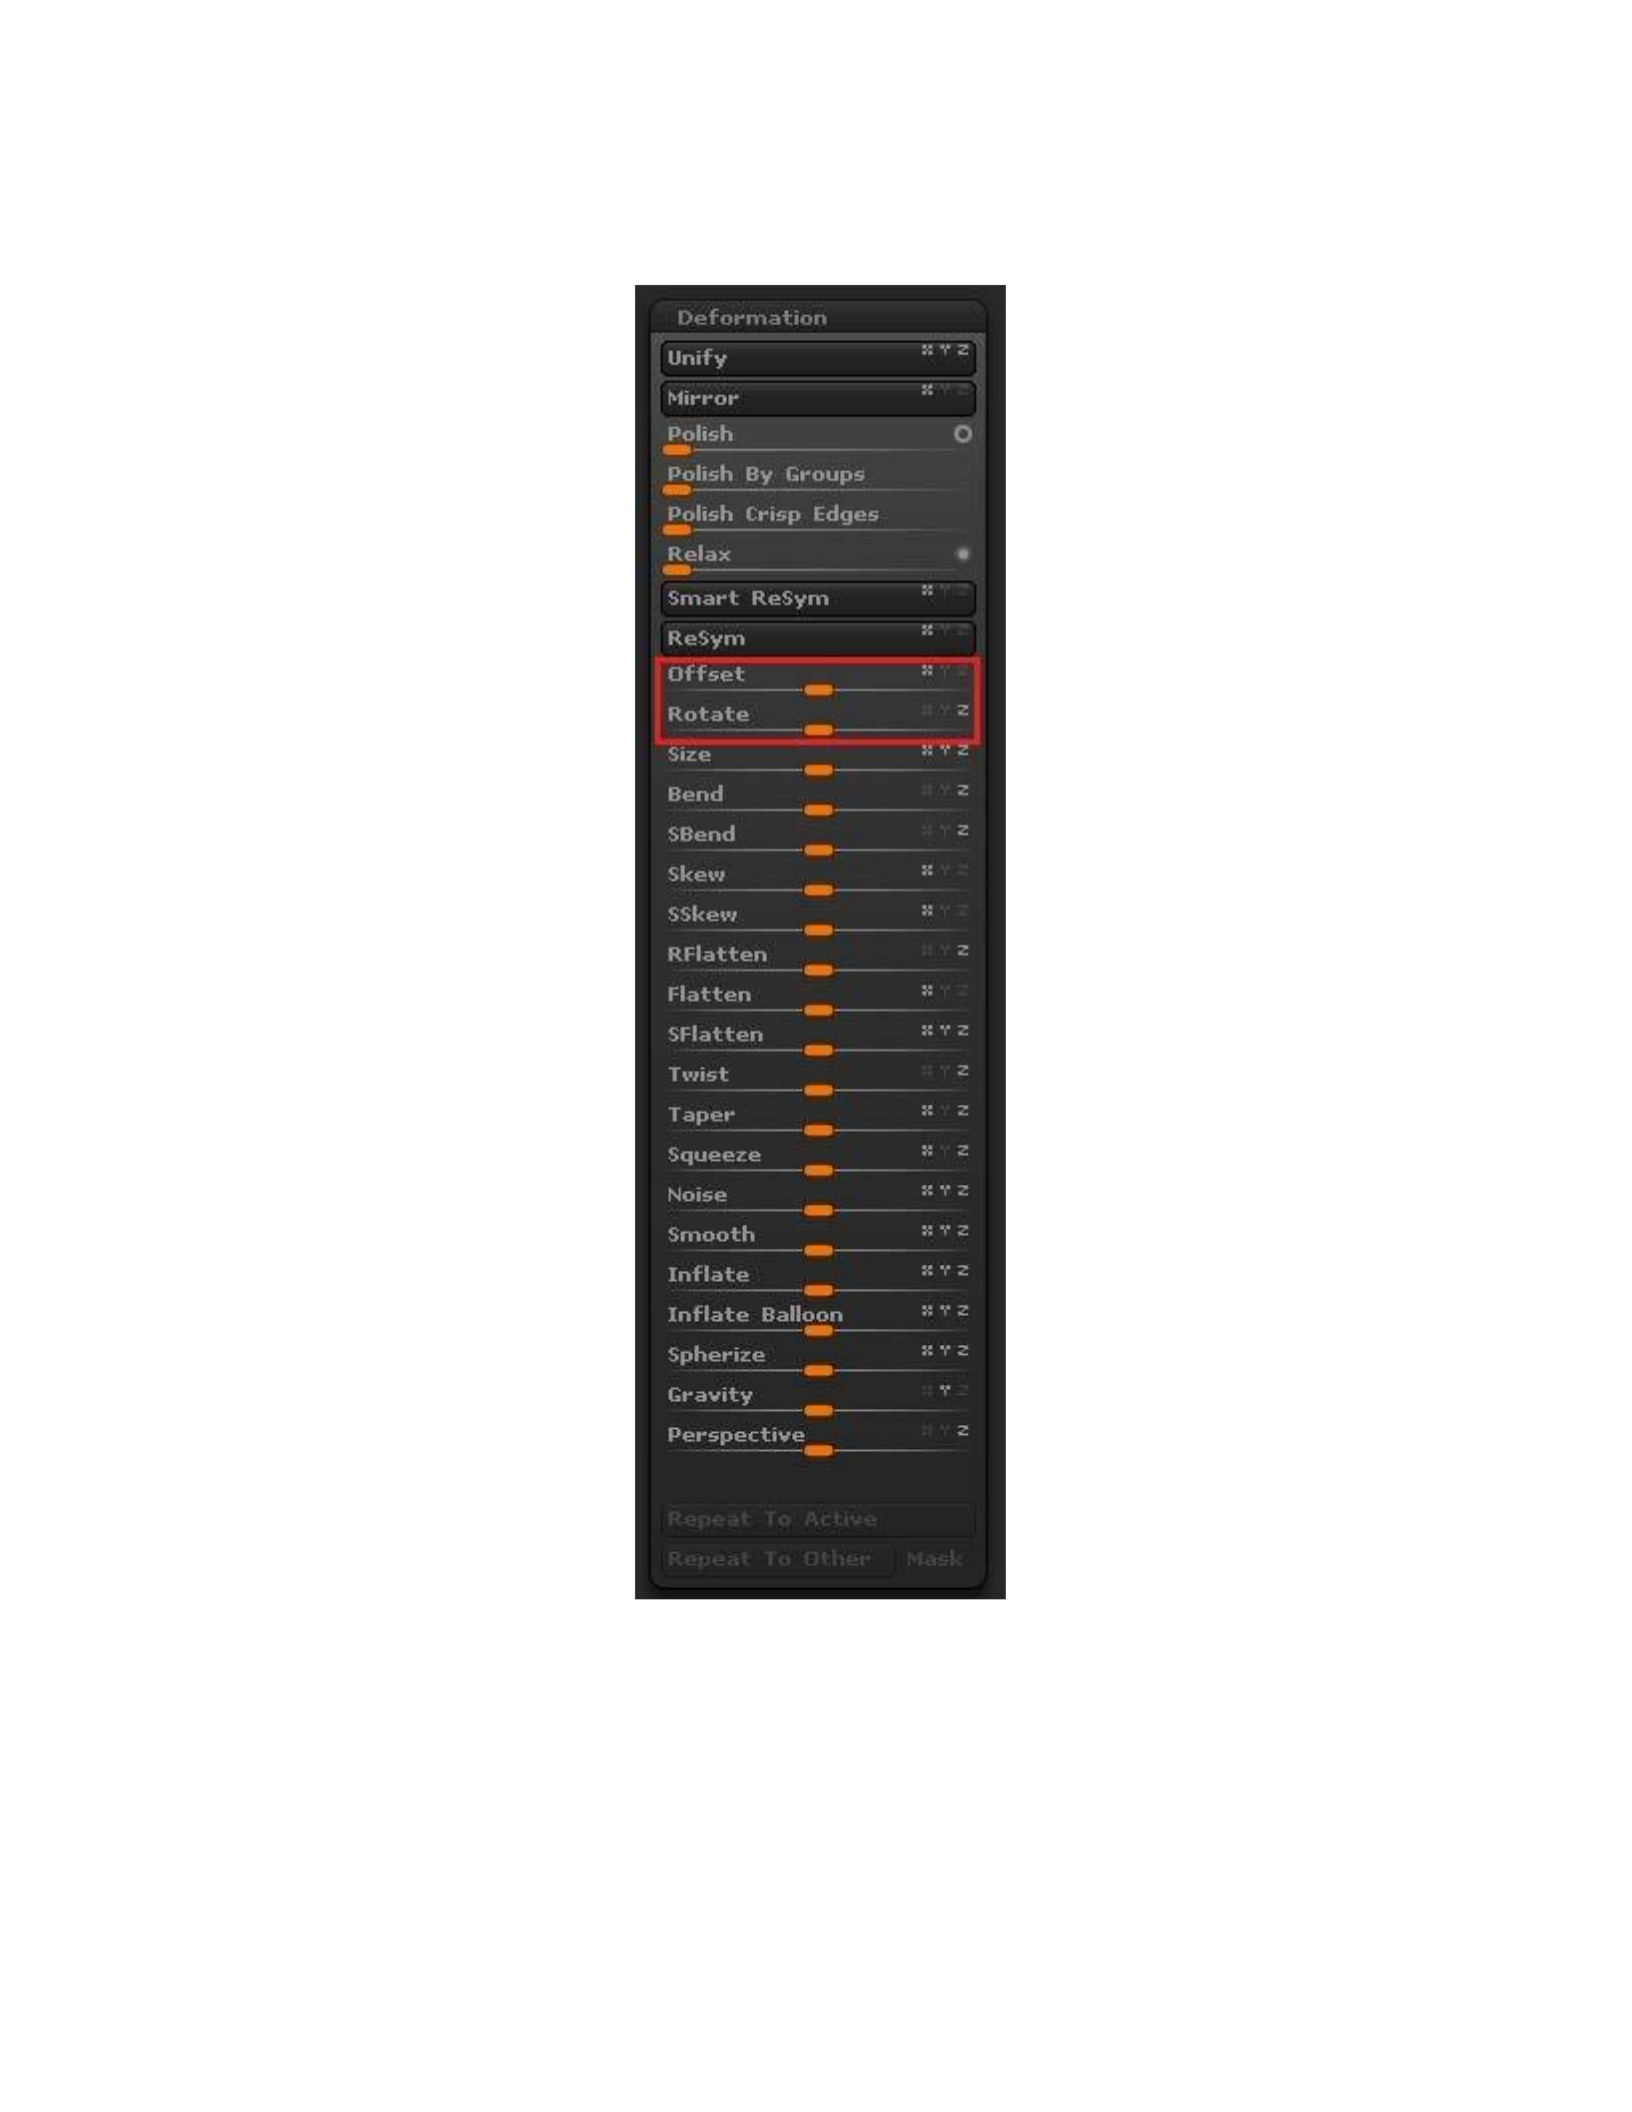
Figure 74: Subtools can be moved and rotated with precision by using the Offset and Rotate sliders in the
deformation palette.
In order to assist in the orientation of the cranium, a series of planes were added as
subtools by clicking on Append in the subtool palette and choosing the Plane3D tool (Figure
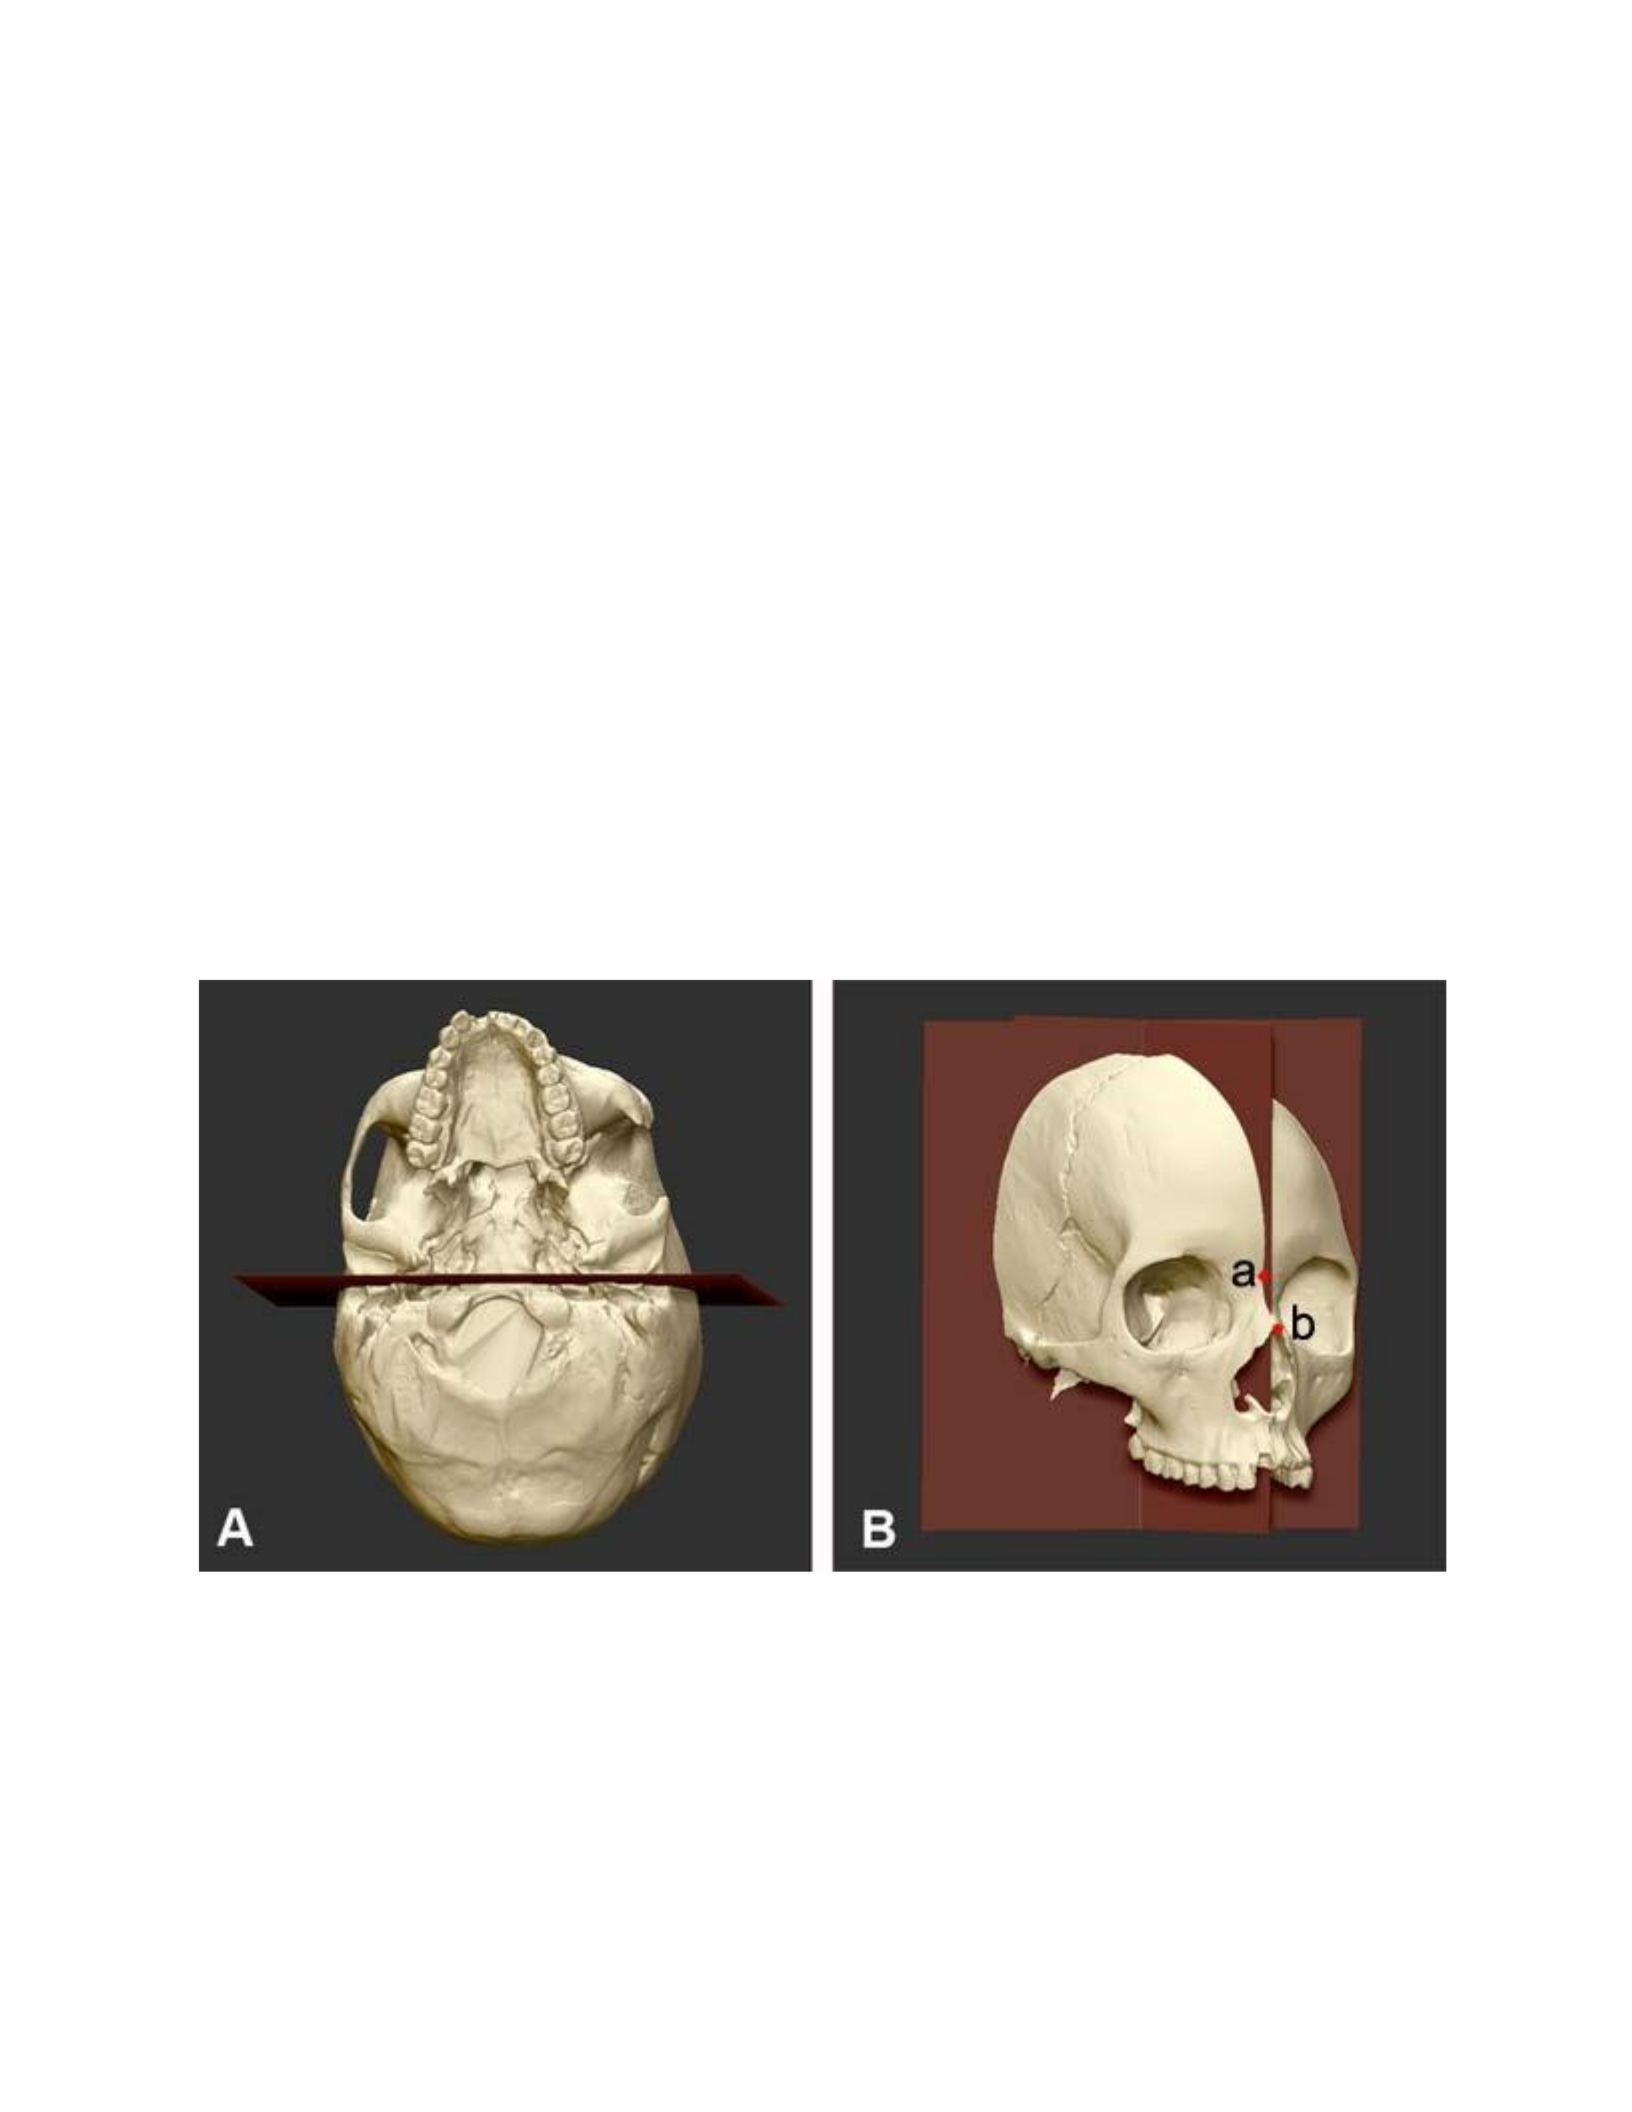
75A&B). In order to render both sides of the plane visible when rotating the tool, it is necessary
to select the plane subtool and click on Double in the Display Properties sub-palette within the
main tool palette. The first Plane3D was placed in the frontal plane by default (Figure 75 A). The
second plane was created by using the keyboard shortcut Ctrl+Shift+D to duplicate the first
plane. This new plane was then rotated 90° in the Y axis using the Rotate slider in the
Deformation palette so that it was oriented in the sagittal plane (Figure 75 B). These planes
served as a reference for orienting the cranium in a symmetrical manner, with the sagittal suture
and craniometric points rhinion and nasion lined up with the Plane3D oriented in the sagittal
plane, and the features at the base of the skull aligned with the frontal plane.
Figure 75: The appended Plane3D was oriented in the frontal plane by default. The features at the base of the
cranium were then used along with the reference plane to orient the cranium into anatomical position (A). A
duplicate of the first Plane3D was rotated 90° to orient it in the sagittal plane. The craniometic points nasion (a) and
rhinion (b) were then lined up with the reference plane (B).
In order to add the mandible fragments to the cranium, it is necessary to append another
subtool, which will be replaced by the imported file. It does not matter what subtool is appended,

as it is simply a placeholder for the imported file. In this instance, two subtools were appended,
one for each of the mandible fragments. Once the mandible fragments were added as subtools,
they were moved and rotated into the correct position. This proved to be a challenge using the
offset and rotate sliders in the deformation palette. Instead, the Transpose feature was used to
move and rotate the mandible fragments. The Transpose feature is accessed by clicking on the
Move, Scale or Rotate buttons in the main toolbar (or by using the Hotkeys ‘W’ ‘E’ and ‘R’,
respectively), clicking on the subtool and dragging the action line off of the model. The action
line can be conformed to a straight-line by also holding shift. The model is then moved or rotated
by clicking and dragging on one of the three rings found on the action line. The scale feature was
not used so that the actual proportions between the cranium and mandible fragments would be
maintained. After considerable effort, the mandible fragments were visibly aligned with the
cranium and placed into anatomical position (Figure 76).
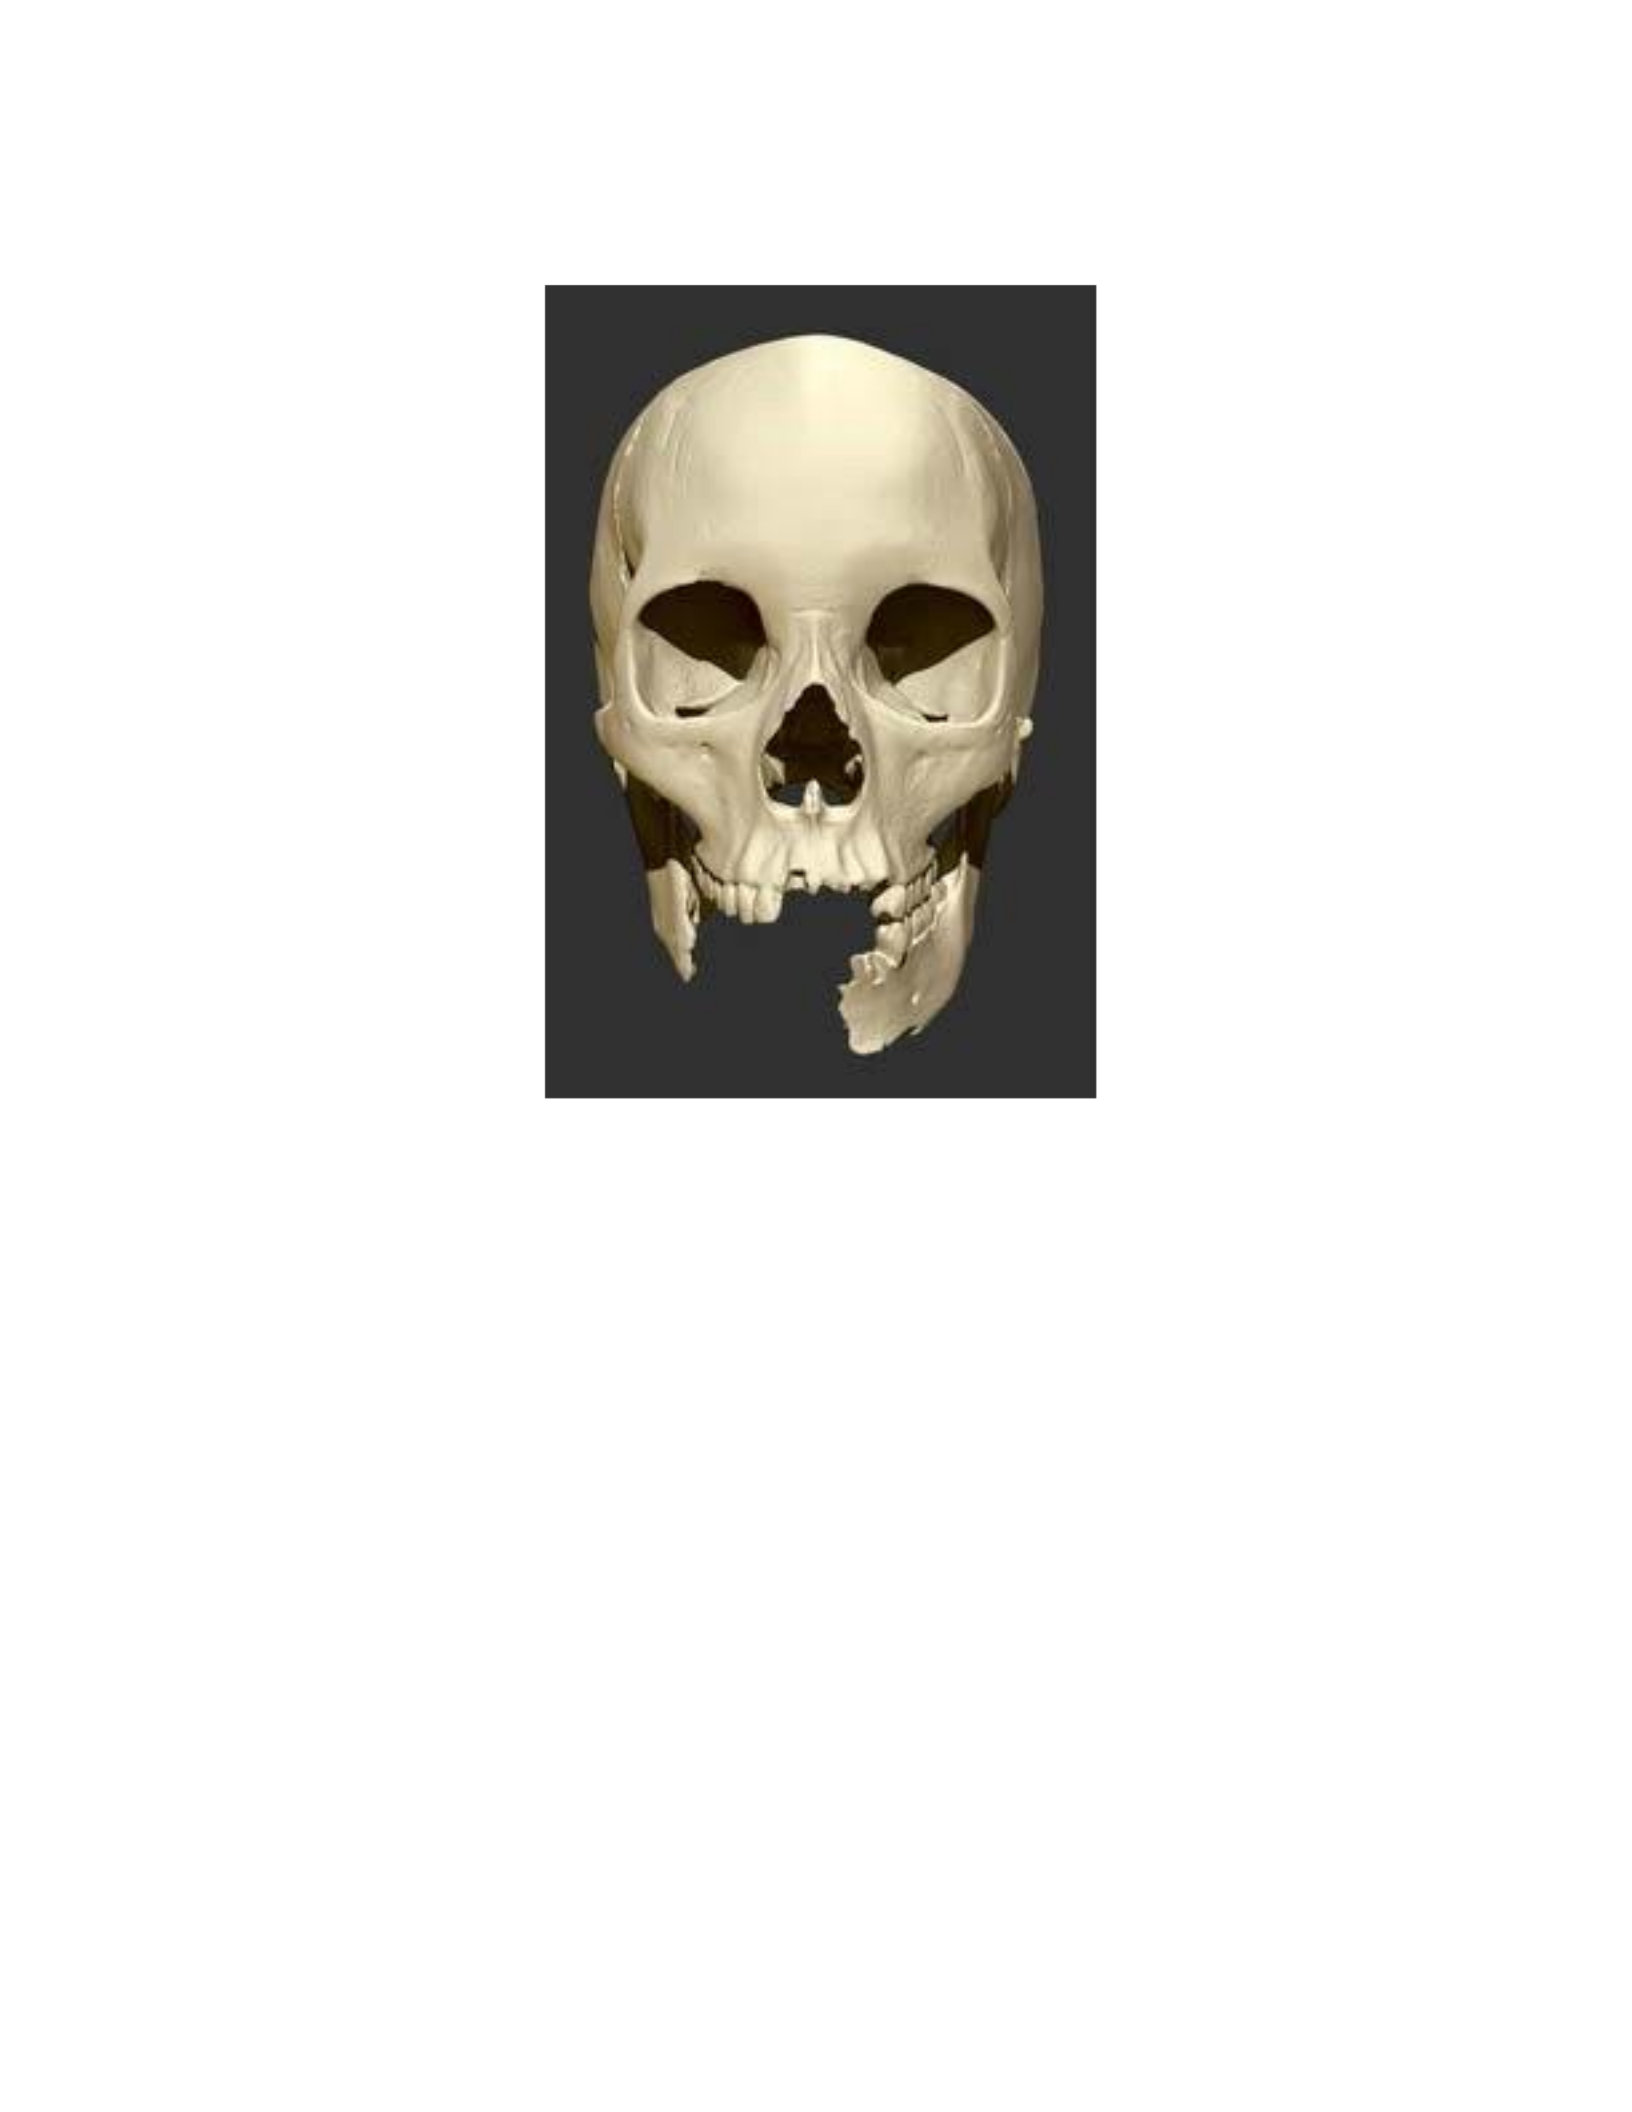
Figure 76: The cranium and mandible fragments oriented in anatomical position.
Once the cranium and mandible fragments were oriented in anatomical position, the
reconstruction of the missing areas was performed using the free-form modeling tools inside of
ZBrush™ 4r4. There are many tools inside of ZBrush™ 4r4, and therefore different ways that the
reconstruction can be performed. The method outlined here is simply the one developed and
employed by the author based on personal experience and preference with the program. Each of
the reconstructed areas was created using the Dynamesh feature inside of ZBrush™ 4r4.
Dynamesh is a unique solution for free-form modeling complex geometry without having to
worry about topological problems such as polygon stretching.

The reconstruction of the left zygomatic arch began with a Sphere3D. A Sphere3D is one
of many tools inside of ZBrush™ 4r4 known as primitives, which can be manipulated using the
Masking and Initialize functions to create complex geometric objects. However, unmodified
primitives are not very useful for creating organic shapes such as bone. Instead, the Sphere3D is
converted to a PolyMesh3D by clicking the Make PolyMesh3D icon at the top of the Tool
palette. Doing this will enable sculpting, and should be performed before appending the object to
the cranium subtool. Once converted to a PolyMesh3D, the Dynamesh feature is then activated
by clicking its respective icon in the Geometry subpalette within the main Tool palette. This will
restructure the geometry of the object to make it more uniform, and can be re-applied to the tool
as it is being modeled by pressing CTRL and then clicking and dragging within the viewport
outside of the model. The Move brush was used to roughly shape the sphere into the form of the
missing fragment. The standard Smooth brush was used in conjunction with the Move brush to
help smooth out areas during the sculpting process. It is accessed by holding Shift while using
any of the sculpting brushes. These two brushes were used until the replacement fragment looked
believable, while visually referencing the contralateral zygomatic arch which was still intact
(Figure 77).
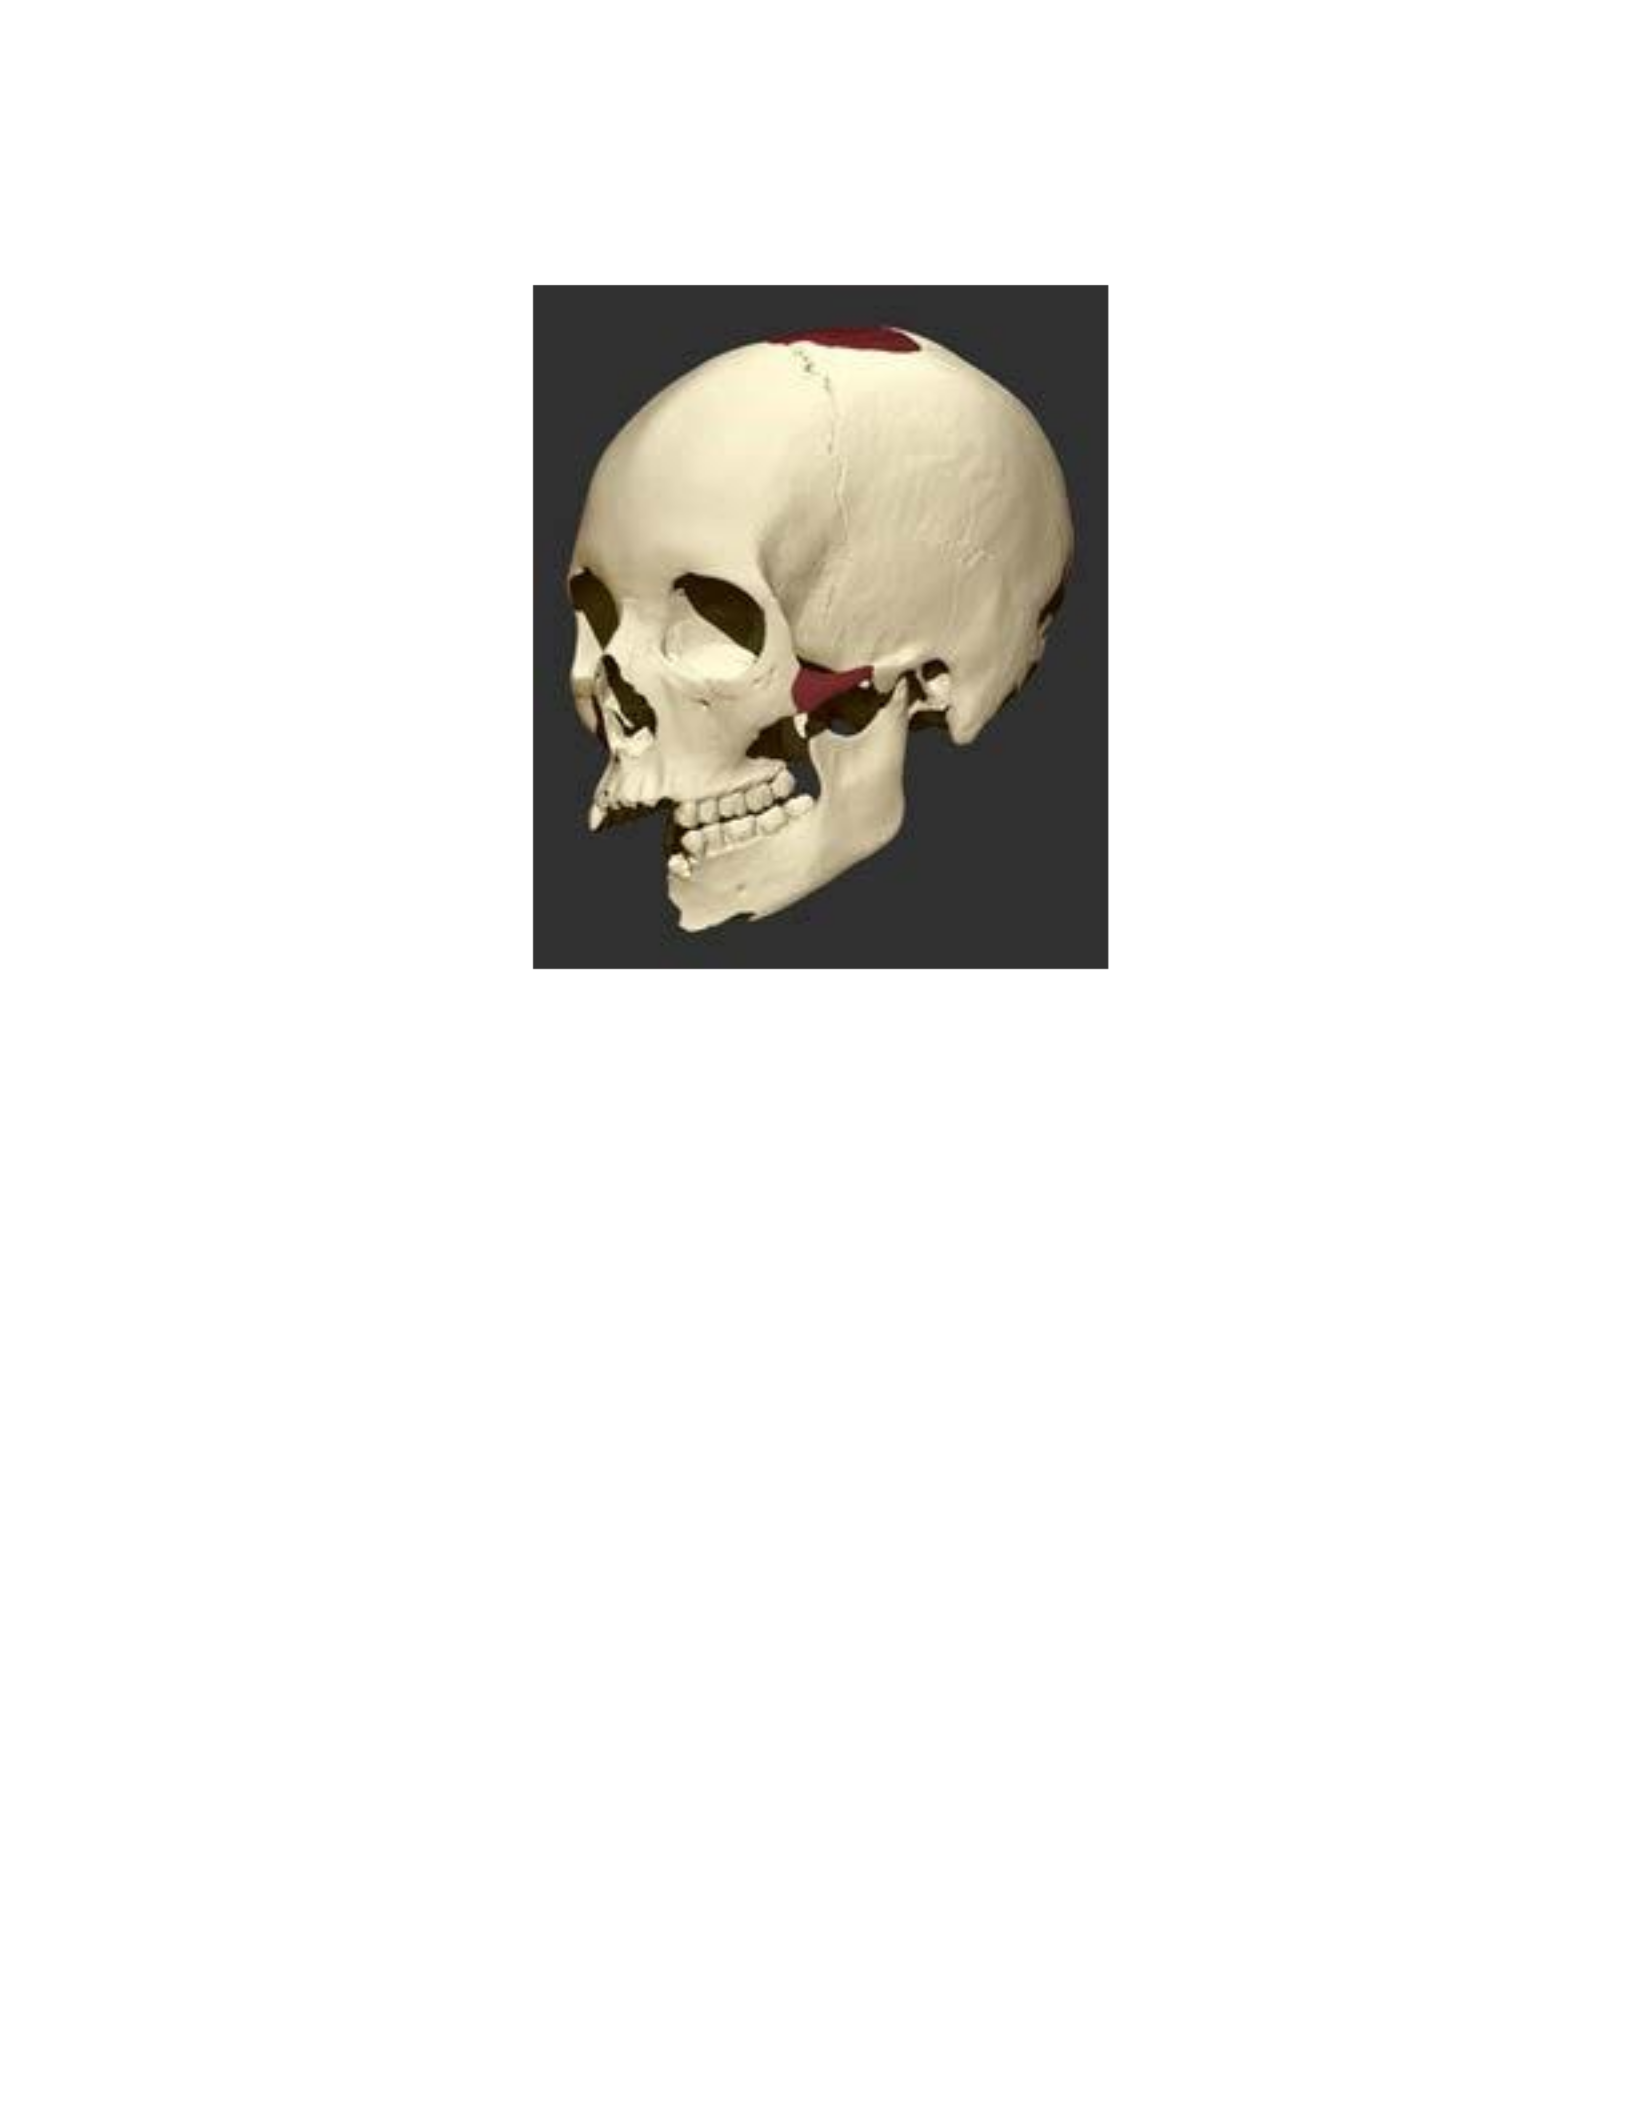
Figure 77: The zygomatic arch was reconstructed using Dynamesh, and the Move & Smooth sculpting brushes.
The holes in the occipital bone were reconstructed with a Sphere3D tool with Dynamesh
active. The spheres were then placed within the cranium and moved until the surfaces roughly
matched the borders of the cranium. The Inflate brush was then used to form the surface of the
sphere that was visible through the hole until it matched the surfaces of the skull without
appearing over-inflated or caved-in (Figure 78).
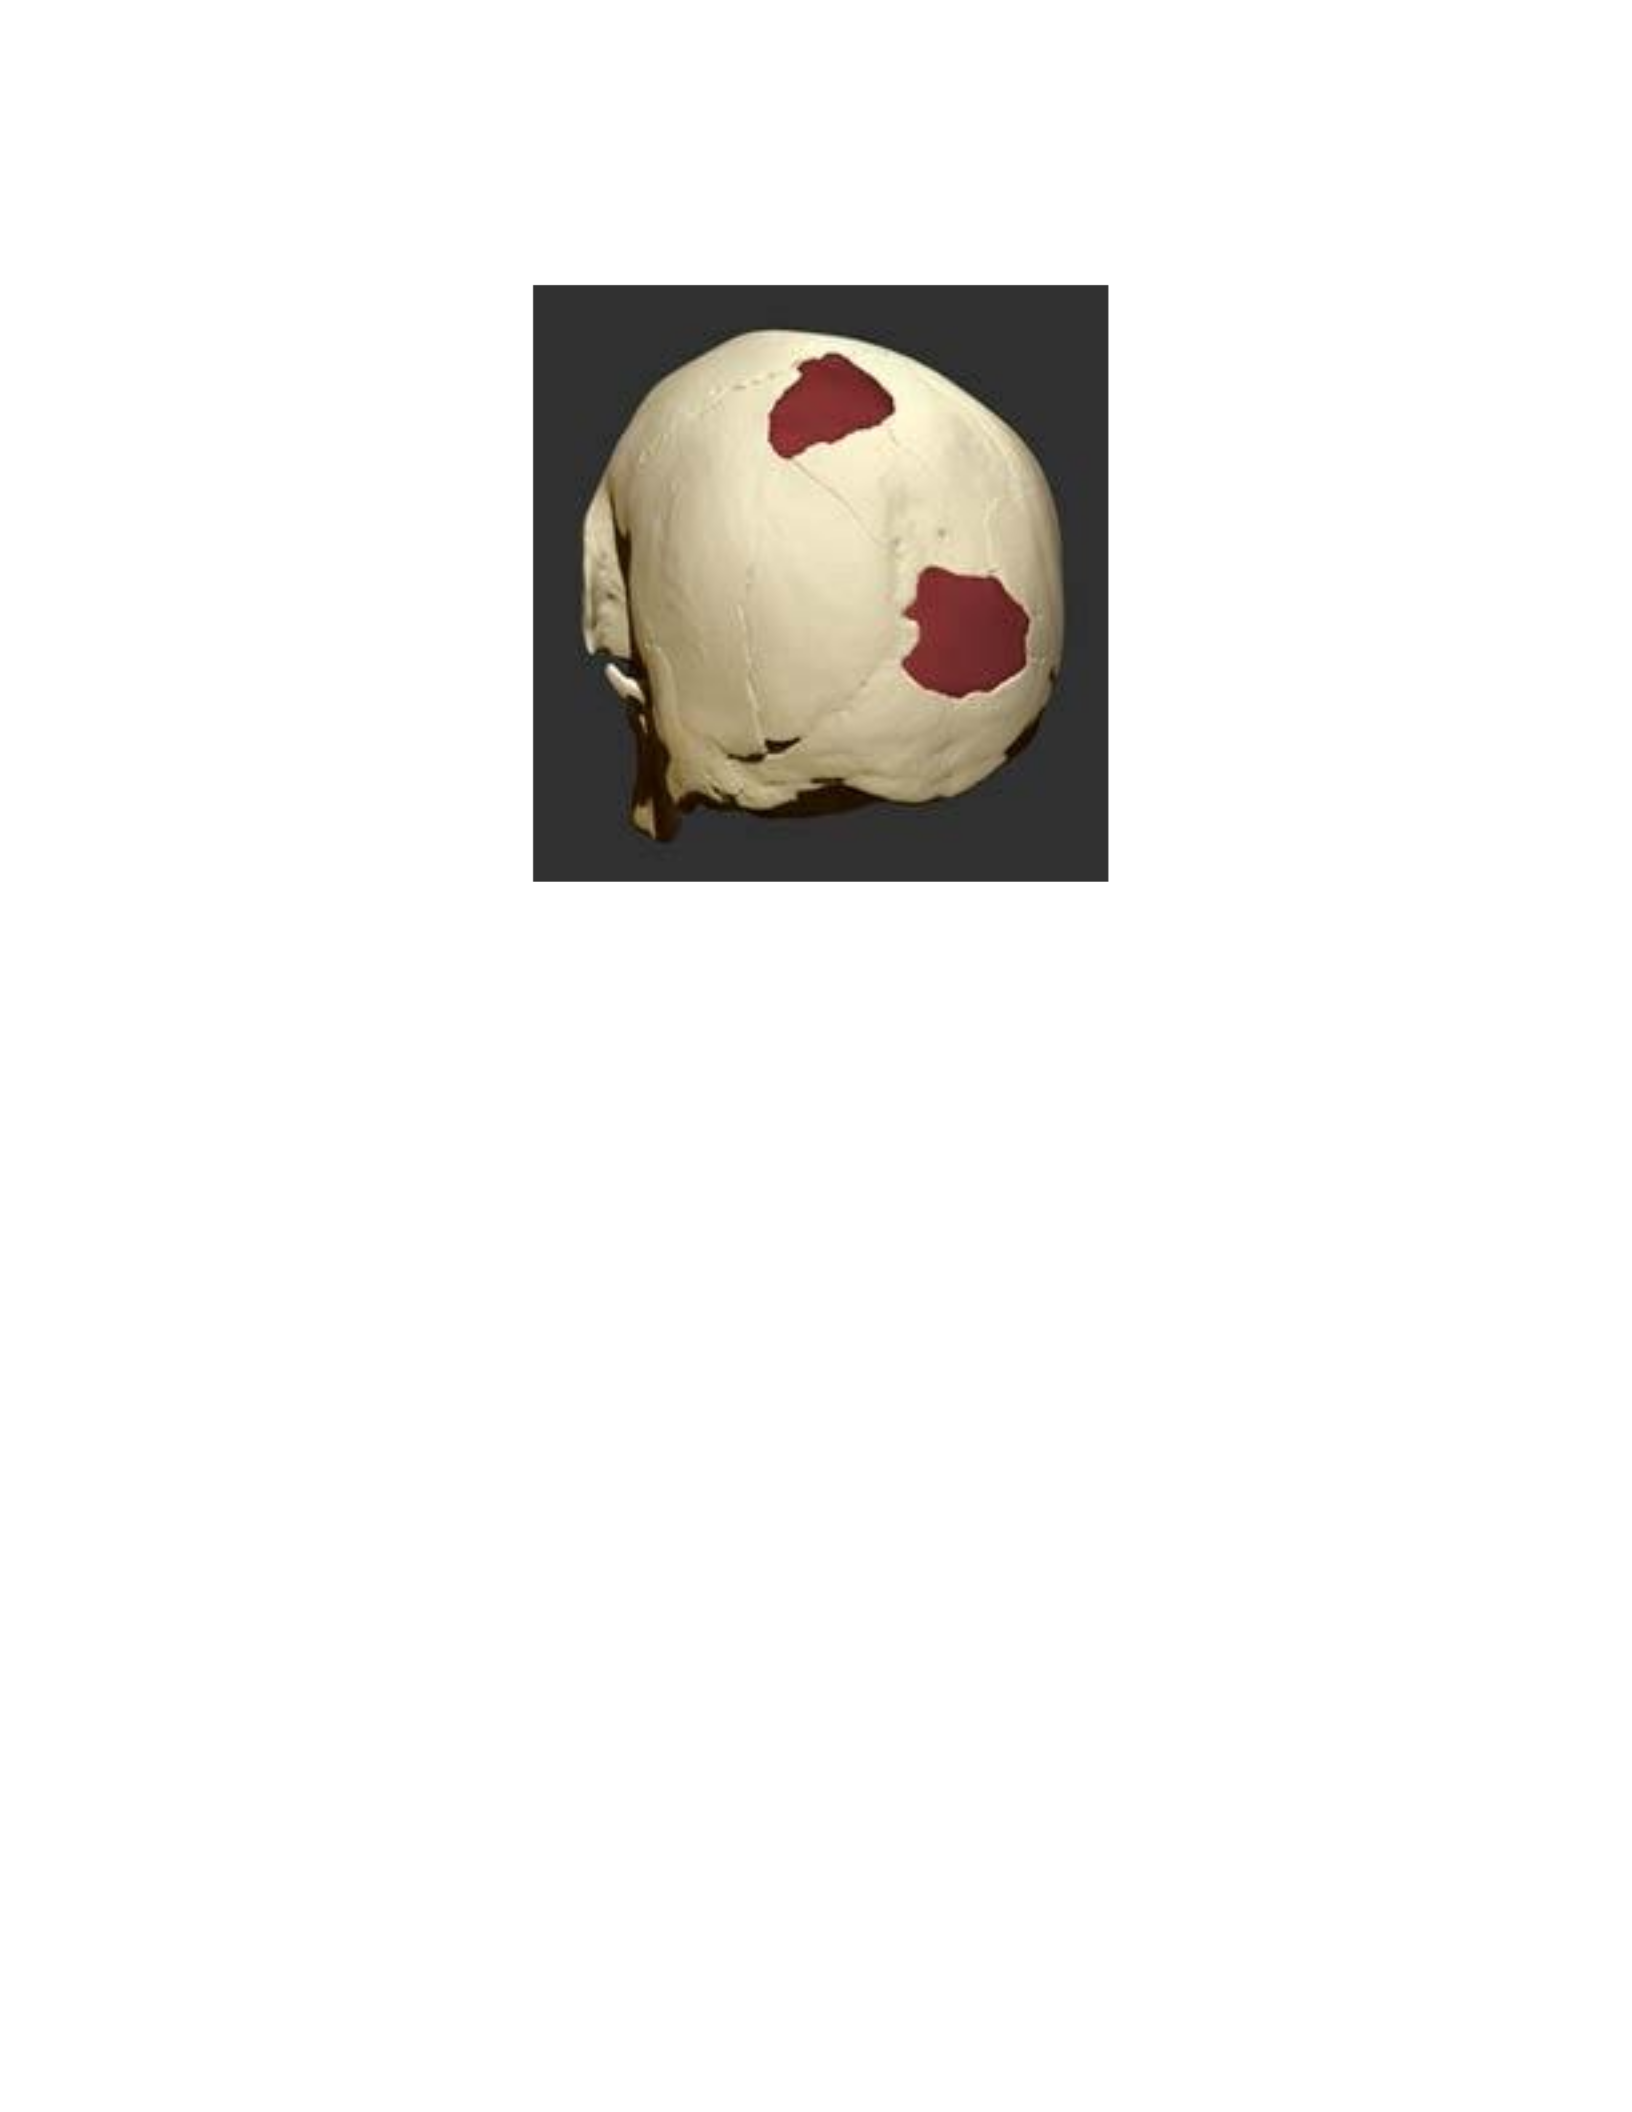
Figure 78: The missing areas that resulted from shotgun wounds to the occipital bone were filled in using Dynamesh
and the Inflate brush.
The teeth and mandible were the most difficult areas to reconstruct. Like the other
reconstructed areas, the mandible fragment was created from a Sphere3D with Dynamesh
activated, except that the symmetry feature was used. Symmetry is activated by pressing X on the
keyboard, and the axis that symmetry will be mirrored on can be changed in the Transform
palette. The default axis of symmetry in ZBrush™ 4r4 is in the X axis, and in this instance
matches the bilateral symmetry of the cranium and mandible. Using symmetry, the Dynamesh
sphere was modeled to fit the missing area while visually referencing intact mandibles during the
process (Figure 79). The teeth were modeled previously as an anatomy study, and were imported
and placed on the cranium and mandible (Figure 80 B).
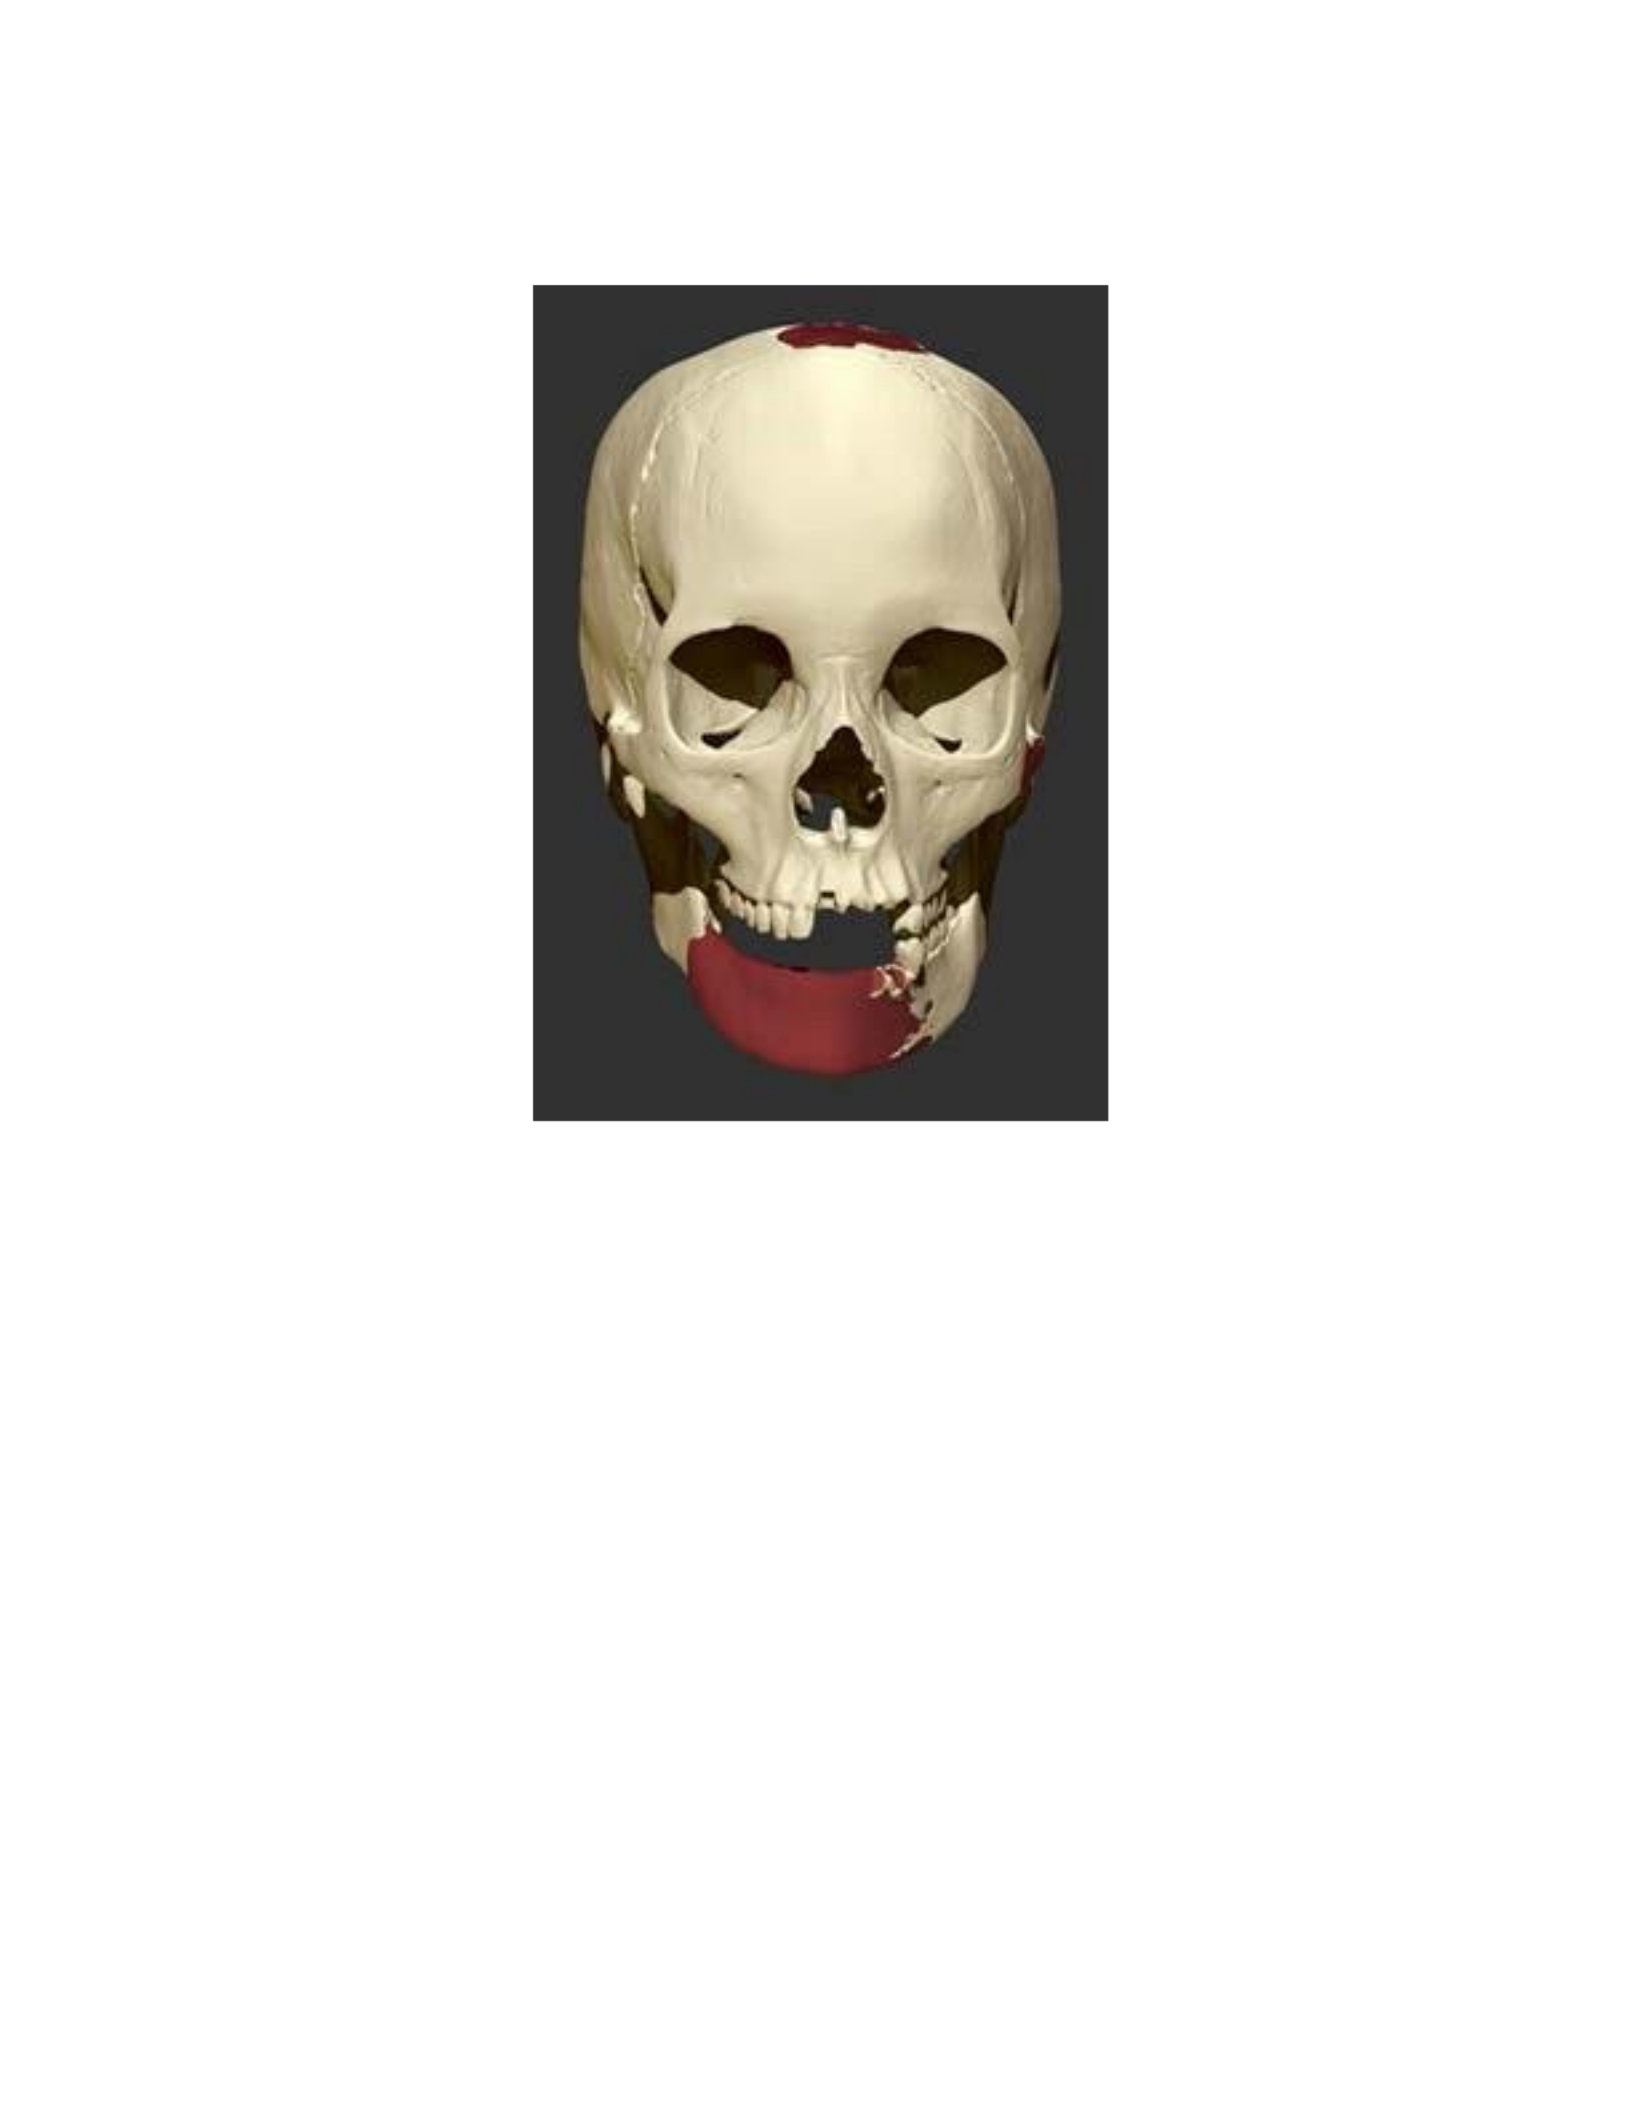
Figure 79: The mandible was reconstructed using Dynamesh with symmetry activated in the X-axis.
Once all of the missing fragments have been remodeled, they can be fused with the scan
data in order to unite the different subtools into a single part using the Remesh function. This is
especially useful if the model will be 3D printed. First, the reconstructed areas of the cranium
were fused to the bone by first toggling the visibility so that only these fragments and the
cranium were visible because the ReMesh function is applied to all visible subtools. Visibility is
toggled by clicking on the eyeball icons displayed to the right of the respective tools in the
subtool palette. The Remesh is then performed by clicking ReMesh All in the subtool palette.
This function includes a symmetry feature located on the ReMesh All icon, but it should be
turned off in this instance. The resolution of the ReMesh can be modified by changing the Res
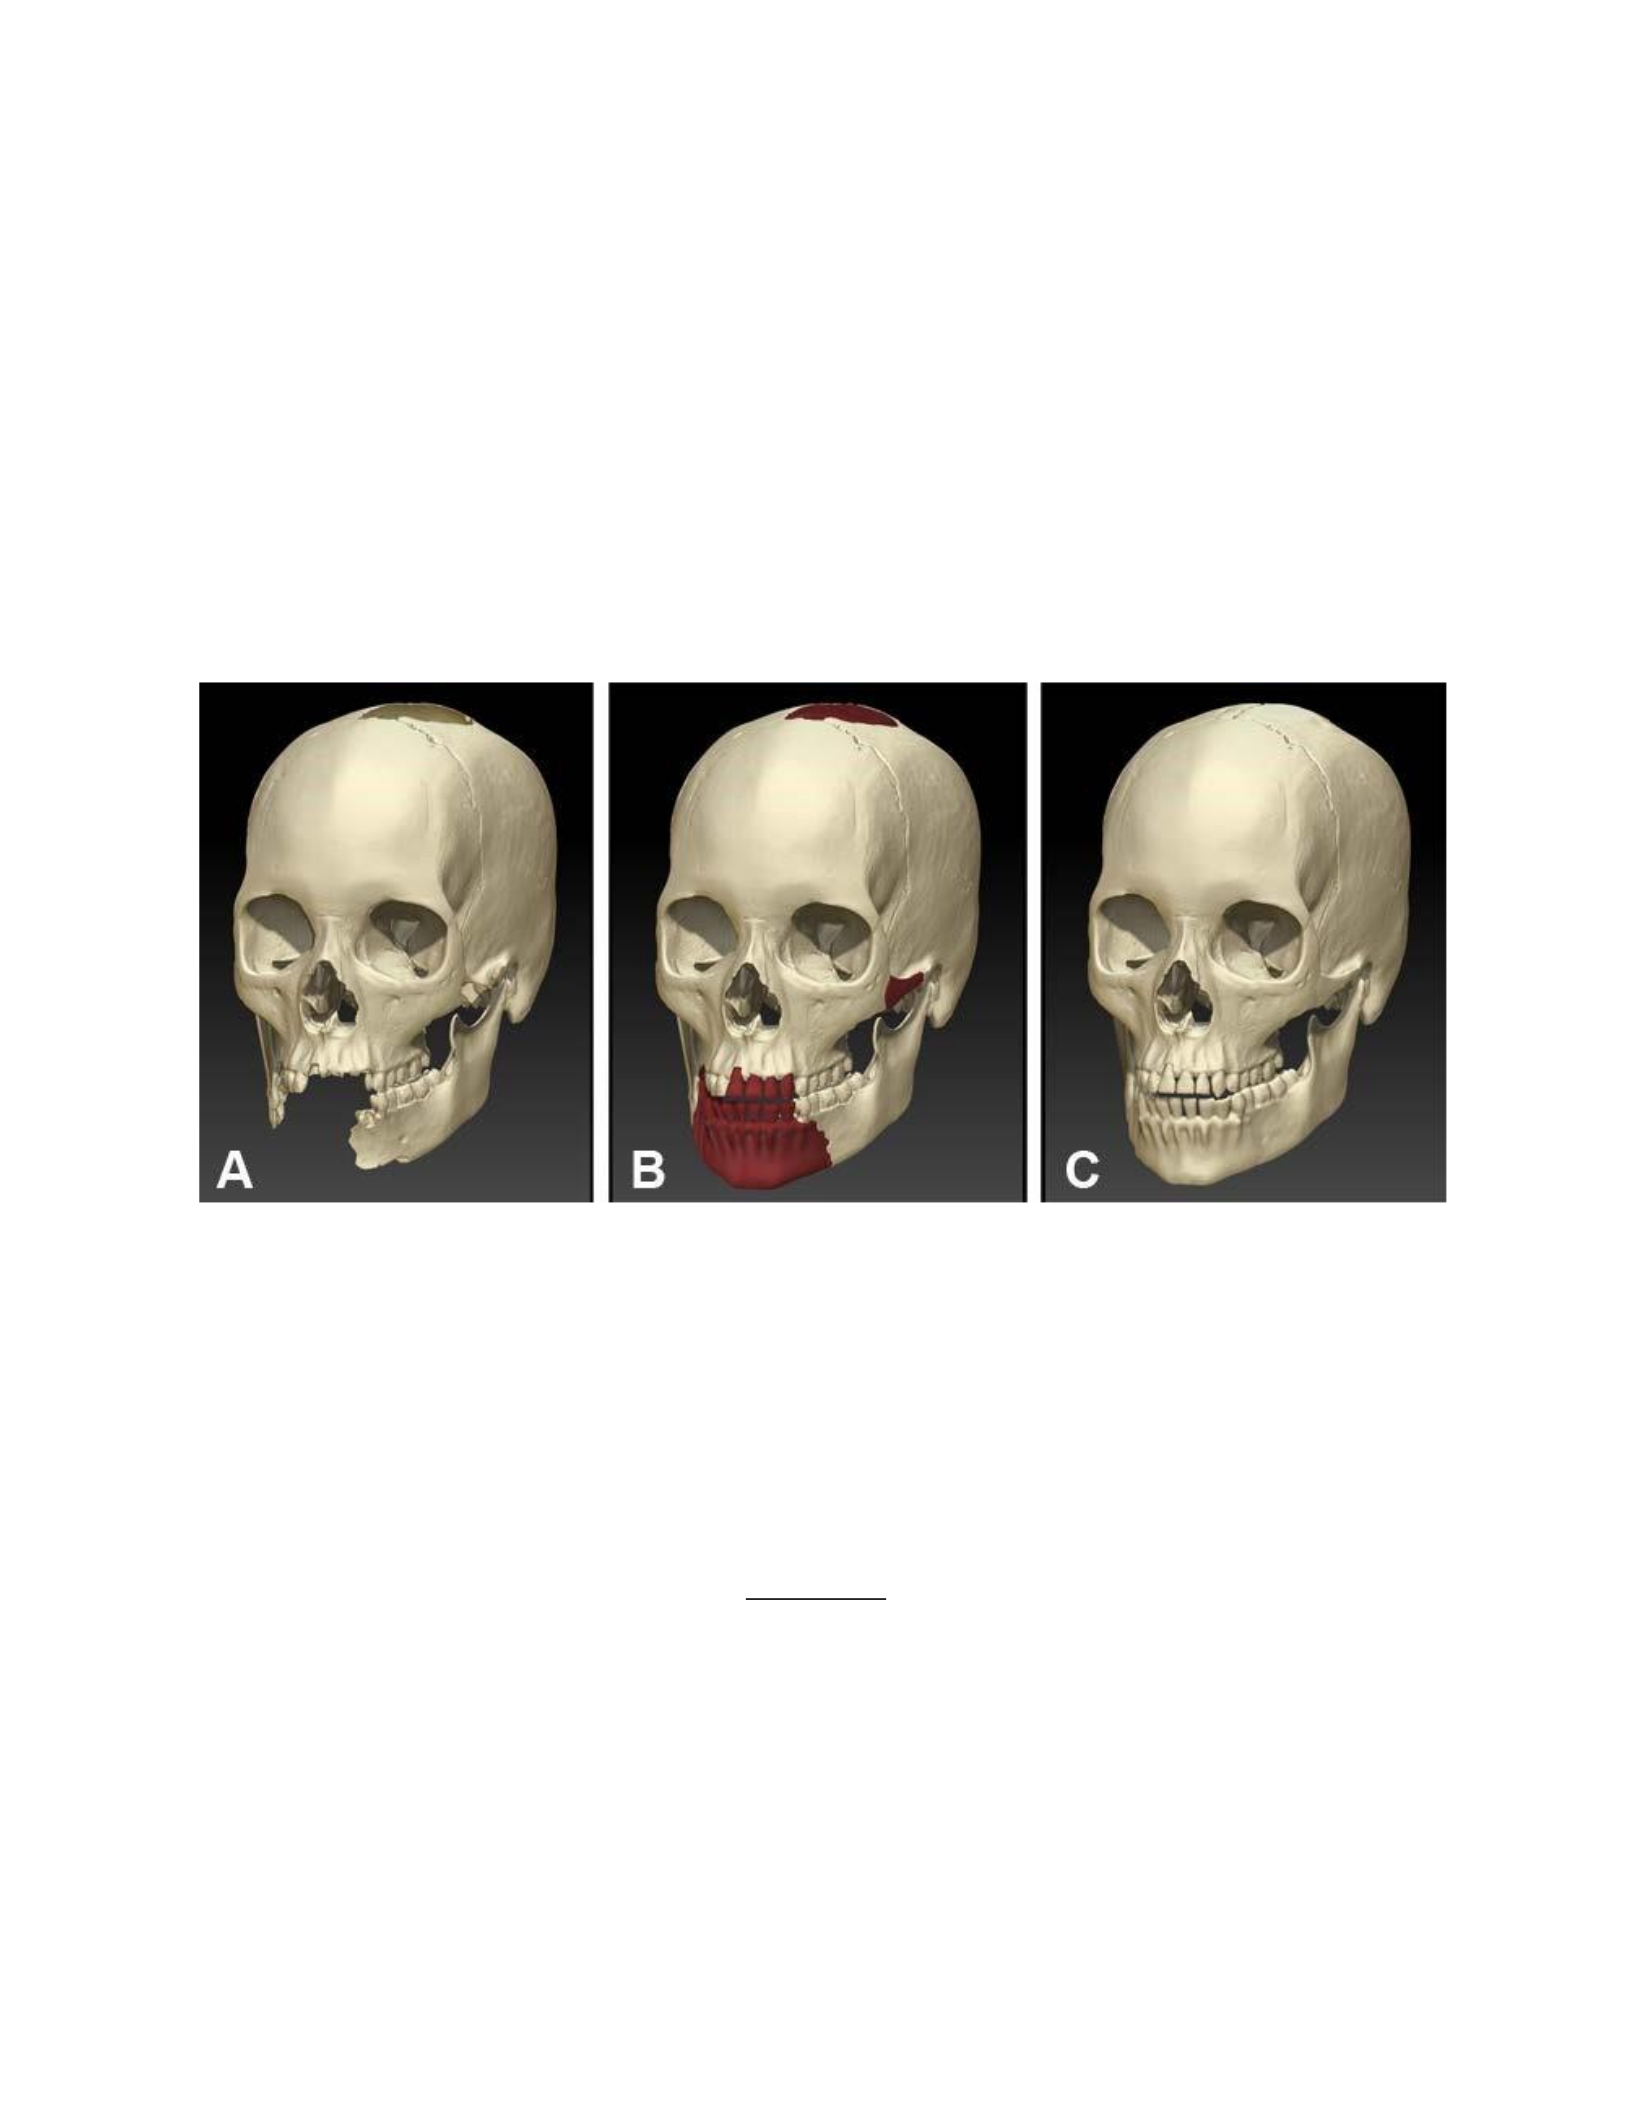
slider. Once a new subtool has been created using the ReMesh feature, the ProjectAll icon below
ReMeshAll is used to project the surface details of the previous subtools onto the new subtool.
This should be used in conjunction with the Res slider until the ReMesh function creates a high
enough resolution subtool that can capture the level of detail of the existing subtools with
ProjectAll (Figure 80 C)
Figure 80: The scan data of the fragmented cranium and mandible were imported and assembled in ZBrush™ 4r4
(A). Missing areas were then reconstructed by digitally sculpting them in (B). Once the reconstructed areas were
created, the model was remeshed (C).
CHAPTER SIX: DISCUSSION & CONCLUSION
Discussion
3D digitization has become an integral part of many disciplines within the field of
anthropology, from the use of CT scanners in paleoanthropological studies (Aiello et al., 1998;
Hardwood-Nash 1979; Seidler et al., 1992), to the application of long-range laser scanning

technology in the documentation of excavation sites in archaeology (Lambers et al., 2007). As
the advantages of 3D digitization technologies continue to be developed, more and more
researchers from a variety of subfields are becoming interested in implementing this technology
into their practice. Forensic anthropology is one such area where 3D digitization is beginning to
be implemented, albeit slowly. In consideration of this pace, this research project was pursued in
hopes of increasing the momentum at which these technologies will be adopted within this field
through an investigation of the potential applications. To investigate the practicality of
implementing 3D digitization technologies within a forensic anthropology lab, an affordable laser
scanner was chosen to conduct this study. The study was divided into two primary components.
First, an exploratory documentation of protocols for scanning different human bone types and
techniques for processing the data was constructed in an effort to standardize the process of
scanning human bone. The second section was an exploration of practical applications for using
the scan data within the field of forensic anthropology. Many challenges were encountered
during this investigation, but the advantages of using the scan data appear to be worth the effort.
The challenges in scanning the different bone types and the potential uses for the scan data are
outlined and reviewed in this chapter.
Scanning Protocols
The challenges in scanning different bone types such as the vertebra and scapula, as well
as the potential uses for the scan data are outlined and reviewed in this chapter. The issue
presented in scanning the L5 vertebra was that the borders of the vertebral foramen were
unobtainable with the laser scanner. When attempting to process the scan data that was obtained,

the software completely filled in this area when attempting to create a water-tight model with the
fuse function (Fig. X). This problem could be resolved by using a bridge function to break up the
missing data into smaller holes which could be filled individually while maintaining surface
curvatures, but this capability is not available within the ScanStudio HD Pro™ software.
The problem in laser scanning the scapula involved the thin borders of the subscapular
and infraspinous fossae. The infrared lasers of the scanner passed through the translucent
surfaces of the fossae, which appeared as the inversion of the surface normals within the Scan
Studio HD Pro™ software (Fig. X). The application of talc powder is suggested in the
NextEngine Support manual for scanning translucent and reflective surfaces. Talc power was
applied to the surfaces of the fossae using one of the powder brushes supplied with the scanner,
but this did not result in resolving the problem. Additionally, a scapula that had been painted for
teaching purposes was also scanned, but the paint also did not prevent the problem.
Both the clavicle and sternum were simple to scan and did not present any particularly
unique challenges. The ease in scanning these bones lies in their small size and relative simplicity
of form.
Despite the unique morphology of the os coxae, scanning the bone was manageable. The
only issue arose with certain areas that appeared to be damaged, where the cancellous bone was
exposed. These areas appeared as holes in the scan data, but were filled without too much
distortion of the features when fused as a water-tight model. Since damaged areas can be a sign
of trauma, these areas are particularly important during an investigation and this issue should be
considered by the forensic anthropologist. This validates the findings of Slizewski & Semal

(2009), who also mention that the distortion issue with cancellous bone also arises with CT data.
Scanning the rib was a challenge because it was difficult to secure it in place with the
part-gripper. This illustrates an issue with the scanner hardware, namely the design of the
partgripper. The part-gripper was modified by adding an additional supporting prong from
another part-gripper to increase the range of support. Despite this, it still took considerable effort
to stabilize the rib for scanning. A design feature that would enhance the ability to scan objects
that are not self-supporting could be the addition of rubberized clamps that would secure the
bone in place without damaging it.
The femur’s unique characteristic of being the longest bone in the human body is what
made it complicated to scan. Although the ScanStudio HD Pro™ software has a Wide and
Extended scan setting for digitizing larger objects, these settings result in lower resolution
models with less detailed anatomical features. Because of this, the Macro setting was maintained
and the scanner itself was raised to varying heights for capturing the entire length of the femur. It
is possible to mount the scanner on a tripod, but in this case it was simply placed on a stack of
large textbooks.
The cranium was the most difficult bone in the sample to collect. It required extensive
repositioning and scans to acquire as many surfaces as possible, yet there were still multiple
areas which could not be placed within the line of sight of the scanner, and thus could not be
acquired. These included the surfaces within the nasal aperture which include the vomer and
nasal conchae, the internal surfaces of the cranial vault, the inner medial surfaces of the
zygomatic arches, and many of the small intricate surfaces at the base of the skull. When creating

a water-tight model, the natural voids within the skull become closed. These areas include the
foramen magnum, orbital fissures and all canals, fossae and foramen. Despite the distortion of
these areas, the standard craniomentric measurements used by forensic anthropologists were
successfully applied to the digital model of the cranium. If the distortion of these areas is
considered to be too significant to ignore, the scan data can be fused without hole-filling to retain
the natural openings in the skull. However, the model with holes in the mesh will not be able to
be 3D-printed. If a 3D model of the human skull with every anatomical feature intact is required,
then CT scanning would be necessary.
Scanning the bone of the mandible did not present any particular difficulties. On the other
hand, the teeth were problematic to scan on both the mandible and cranium. This reaffirms the
findings of Slizewski & Semal (2009). The difficulty in scanning the teeth arises from the minute
intricacy of the occlusal surfaces, in addition to the interpoximal surfaces which were not within
the scanner’s line of sight. The inability to accurately acquire these surfaces is compounded by
the slight translucency of the teeth, which absorbs the laser beam (Slizewski & Semal 2009) and
results in surface noise. Even if the noise is manually removed from the scans, the missing data
that results from the inability to scan the interproximal surfaces between the teeth causes the
software to fill these areas as holes, resulting in significant distortions. Although Slizewski &
Semal (2009) point this out, there are no solutions provided other than the use of a CT scanner.
Scan Data Processing
Processing the scan data once it has been acquired is a relatively straightforward task
using the ScanStudio HD Pro™ software. Conversely, the stream-lined and user friendly

software lacks many advanced features for manual processing of the scan data. These advanced
features can aid in overcoming some of the issues that were encountered during the scanning
process. One such feature is the ability to bridge polygons to break up large holes into smaller,
more manageable holes. This would be useful in the instance of the vertebra, where the missing
data within the vertebral foramen created a large hole which was filled over by the software when
making a water-tight model using the fuse function. The bridge tool could be used in this
instance to break up the large hole into smaller holes which could be filled individually while
maintaining the surface curvature within this area.
Bridge tools are commonly available in 3D modeling software such as Autodesk® 3DS
Max® and Maya®, but these programs usually cannot handle large scan data sets. Geomagic
Studio® is a scan data processing software that contains a bridge feature, in addition to many
other features not found within ScanStudio HD Pro™. The cost of licensing this software was
prohibitive for utilizing it in this project, but it is strongly recommended for integration into a 3D
digitization workflow. If the cost of licensing the software becomes more affordable, it may be a
viable asset for processing scan data of human bone in forensic anthropology. Alternatively,
researchers and investigators interested in advanced scan data processing could seek out other
departments and institutions that have licensed this software, in collaborative efforts.
Scan Data Applications
Once the challenges of obtaining and processing the scan data have been overcome, there
are many useful applications in which the scan data can be put to use.
Documentation

Using the scan data as a form of digital documentation allows the forensic anthropologist
to review the remains at any time (Park et al., 2006). This is advantageous if the remains become
damaged or are no longer available for physical examination (Tocheri, 2009). In addition, the
digital replica of the remains can be sent to colleagues and other experts for analysis almost
instantly over the internet, without having to pay for the costs of transportation (Davy-Jow et al.,
2012). The viewing of the scan data can be standardized and made more convenient by
embedding the file into a PDF document using Adobe® Photoshop® CS5 and Acrobat® X Pro.
Measurement
In conjunction with the creation of a PDF file embedded with the scan data is the ability
to collect virtual measurement from the digital model. The reliability of collecting digital
measurements was assessed through a basic study performed in Chapter 5. Current publications
assessing the reliability of recording virtual measurements from laser scans of the human
cranium have implemented robust statistical methods (Park et al., 2006; Sholts et al., 2010), but
have not utilized the standard landmarks used in craniometry by forensic anthropologists. The
study performed in this project employed the standard landmarks and processed the results with
FORDISC 3.0 (Ousley & Jantz, 2005) using multigroup discriminant function analysis, but
unlike Park et al., (2006) and Sholts et al., (2010) it did not assess the reliability based on inter-
and intra-observer error. The sample size was also limited to a single cranium. Future studies
investigating the reliability of virtual measurements collected from laser scans of human crania
should use the standard measurements, in addition to assessing inter- and intra-observer error
with a larger sample size.

Illustration
Utilizing rendered stills can be a useful supplement to photography for creating visual
documentation of human bone. In conjunction with the ability to rotate the model to view any
surface of the bone, the rendered stills enable the user to highlight specific areas for illustration.
These images can then be used in lectures, research publications and court presentations in lieu
of exhibiting actual images which could be potentially disturbing to some audience members,
such as the victim’s family (Komar et al., 2012).
Virtual Reconstruction
Assembling and reconstructing fragmented bone through the use of a laser scanner and
3D modeling software allows the remains to be maintained in their original state (Fantini et al.,
2008). This is advantageous over traditional methods of assembly and reconstruction that use
adhesives, which can be potentially destructive and irreversible. Once the fragmented bones have
been assembled and reconstructed, the digital model can be made physical through 3D printing
(Zollikofer & Ponce de Leon, 2005).
Other Issues to Consider
In summary of the results for both scanning, processing and exploring the uses of the
scan data, a laser scanner was determined to be an important addition to a forensic anthropology
lab. Although some of the issues encountered in establishing protocols for scanning different
bone types could not be resolved, the majority of the bone types that were scanned resulted in
reliable representations of the original objects.

Some of the limitations that were encountered are inherent with the technology. Infrared
lasers will penetrate non-opaque surfaces such as teeth and the thin surfaces of the scapular
fossae. A potential solution for this would be the ability to alter the laser intensity of the scanner.
Lowering the intensity may decrease the penetration of the lasers through the thin surfaces and
allow them to be collected. The ScanStudio HD Pro™ software does not allow for user input of
laser intensity values, but there are programs that contain this feature such as Polygon Editing
Tool (PET) which is used in conjunction with the Minolta VIVID 9i non-contact 3D Digitizer.
The Minolta VIVID 9i is nearly five times the price of the NextEngine™ and may not be a
practical alternative for overcoming the issue of laser intensity when scanning non-opaque bone
surfaces. If NextEngine™ upgraded their software for more advanced features such as the ability
to input specific values for modifying laser intensity, this issue could be resolved. However, it is
possible that in the near future, other affordable laser scanners with more technical proprietary
software will surface on the market.
An additional restriction of laser scanners is the line-of-sight, which allows only the
surfaces within the visible range of the scanner to be collected. This is in contrast to CT
scanning, which will collect even the internal surfaces of an object. Due to the restricted line of
sight of the laser scanner, the internal borders of the vertebral foramen and many surface within
the cranium such those within the nasal cavity could not be acquired with the use of a laser
scanner.
Considering that many of these surfaces are not necessarily important to the forensic
anthropologist, the issue may be an acceptable compromise considering the ability to digitize

skeletal material in an affordable way. There are a few ways that the line-of-sight of the scanner
could be increased, but would be dependent on additional hardware. A new part-gripper design
that allowed more dynamic manipulation of the object being scanned, while still maintaining the
objects stability could allow for more surfaces to be captured than is allowed by the fairly limited
setup of the NextEngine™ scanner. Another method to increase line-of-sight would be to mount
the scanner on a tri-pod that allows for rotation in multiple axes.
Despite these limitations, the complete models that were obtained can be used in a variety
of useful ways. The ability to permanently curate case materials in digital form by embedding the
3D file into a PDF enables the forensic anthropologist to review them at any time and allows
them to be sent to colleagues and other experts for evaluation without involving costs and
procedures for transportation. Additionally, there are 3D measurement capabilities afforded by
the PDF. When this tool was employed to collect the standard cranial measurements used by
forensic anthropologists and compared with analogous measurements taken with calipers, the
results illustrated the reliability of using digital measurements taken from the scan data. The scan
data can also be used to create 2D illustrations analogous to photographic images, with the

