


Introduction Since the start of the severe acute
Since the start of the severe acute respiratory syndrome coronavirus-2 (SARS-CoV-2)
outbreak in December 2019 (WHO, 2020), the responses to the pandemic varied greatly from
nation to nation (Dewi et al., 2020). This observed variance in responses also occurs at the
subnational level, as evidenced by the variety of COVID-19 control measures implemented by
the various state and local governments across the United States(Hallas, Hatibie, Majumdar,
Pyarali, & Hale, 2020). The US state-level variance in responses has likely contributed to the
disparate COVID-19 infection-related outcomes such as incidence and, case fatality rates
observed across the US (Vopham et al., 2020). Other population-level factors such as
demographics (Akanbi, Rivera, Akanbi, & Shoyinka, 2020), testing rates (Pilecco et al., 2021;
Wadhera et al., 2020), and socioeconomic status (Pan, Miyazaki, Tsumura, Miyazaki, & Yang,
2020) have been found to be associated with COVID-19 transmission rates. The large variances
in national and sub-national responses to COVID-19 when combined with the abundance of
factors that influence disease transmission rates have created a number of important research
opportunities.
While there has been a large volume of research produced on the role that
governmentimplemented control measures have on COVID-19 transmission there remain many
unanswered questions as to what factors are responsible for modifying the effectiveness of
these government-implemented control measures. US state-level COVID-19 control measures
have been implemented with varying degrees of centralization of administrative control (Hallas
et al., 2020). In addition, in the US, COVID-19 control measures have been implemented in
locations with very different levels of positive and negative local public sentiment towards the
SARS-CoV-2 pandemic with very different levels of positive and negative local public sentiment
towards the SARS-CoV-2 pandemic (Samuel, Ali, Rahman, Esawi, & Samuel, 2020).

Our research aims to describe the relationship that exists between public health
governance structure, public sentiment on Twitter, and COVID-19 control measure effectiveness
in the US. Overall, this study holds the hypothesis that centralized COVID-19 responses have a
greater impact on disease transmission and mortality rates than de-centralized responses.
Furthermore, the author expects that negative public sentiments towards COVID-19 control
measures will negatively impact the stringency of control measures themselves. In order to
evaluate the accuracy of these hypotheses, this project focused on addressing three related
aims. AIM 1 Compare the effects that state-level and county-level COVID-19 control measures
had on disease transmission and human mobility, by using generalized linear modeling. This
study expects to find that state-level control measures have a larger and more immediate impact
on COVID-19 transmission, driving rates downward with greater efficiency than the
implementation of county-level control measures. AIM 2 Determine if there is a relationship
between public sentiment and the state-level implementation of COVID-19 control measures, by
utilizing natural language understanding and sentiment analysis. A preliminary research study
has found that at the national-level, longer duration and more stringent control measures have
been found to delay the onset of peak COVID-19 morbidity rates (Chacreton, Reina Ortiz,
Hoare, Le, & Izurieta, 2021). The current study holds the hypothesis that states with observed
negative public sentiments towards COVID-19 control measures are associated with less
stringent control measures. AIM 3 Finally, this study also evaluated the inclusion of emojis, the
addition of hashtags, and the modifying of the threshold for classifying sentiment to determine
which of the text preprocessing steps are most effective when attempting to improve pre-trained
language (PLM) model accuracy.
Methods Specific Aim One
Research question and hypothesis
This study aims to answer the research question, from March 1, 2020 through October

25, 2020, have Florida state-level COVID-19 control measures had a larger impact on COVID19
community transmission than Florida county-level control measures? This study holds the
hypothesis that state-level control measures have a larger impact on COVID-19 community
transmission than county-level control measures. Additionally, this study aims to answer the
secondary research question, from March 1, 2020 through October 25, 2020, have Florida state-
level COVID-19 control measures had a larger impact on population mobility than Florida
county-level control measures? In this, the author expects to find that state-level COVID-19
control measures have a larger impact on population mobility than county-level COVID-19
control measures. If this hypothesis is proven correct it will indicate that more centralized
responses to infectious disease epidemics should be prioritized over decentralized responses.
Study design and study population
This study used a longitudinal design. The study period March 1, 2020 through October
25, 2020 was selected due to the fact that it covers the time period from the first reported cases
of COVID-19 in Florida through four weeks following the removal of all state-level COVID-19
control-related restrictions on population movement and business operations (September 25,
2020; Desantis (2020)). Florida counties were selected as the unit of analysis. The selected
measurement interval was a week.
Data collection and study variables
Primary research question.
This study utilized secondary data in the analysis. The outcome variable in the model
addressing the primary research question is the weekly county-level COVID-19 basic
reproductive rate. The county-level income inequality ratio, population, average daily level of
airborne particulate matter less than 2.5 micrometers (PM2.5) in size, income inequality ratio, and
the one-week lagged holiday week were included to control for confounding in this model. The
holiday week indicator was lagged by one week as previous research has found this to be an
effective methodology when modeling COVID-19 transmission (Q. Li et al., 2020; J. T. Wu,

Leung, & Leung, 2020; Zhang et al., 2021). The variables of interest in this study were the
weekly county-level and state-level composite social distancing policy stringency index
calculated using the methodology outlined by Thomas Hale, Atav, et al. (2020). This process is
described in greater detail below.
Daily COVID-19 data was collected for each county in Florida from the Florida
Department of Health's open data repository (FDOH, 2021). Data on the socio-demographic and
economic covariates were retrieved from the Robert Wood Johnson County Health Rankings
database (RWJ, 2021). The Oxford COVID-19 Government Response Tracker database was
utilized for the collection of state-level data on COVID-19 control measures (T. Hale et al.,
2021). The COVID-19 Government Response Tracker database contains daily state and limited
county-level ordinal measures which represent government policy towards COVID19 social
distancing enforcement. As a result, only limited data on county-level control measures could be
retrieved from the Oxford COVID-19 Government Response Tracker database. To address the
limitations in the county-level data in the Oxford SARS-COV-2 database, control measures data
was also supplemented with from the Yale School of Management State and Local COVID
Restriction Database (Spiegel, 2022).
Using the weekly case report totals the county-level weekly COVID-19 basic
reproductive rate was then calculated using the Robert Koch Institute method (Heiden &
Hamouda, 2020). The Oxford COVID-19 Government Response Tracker database contains
eight measures used to summarize a jurisdiction's social distancing and COVID-19 policy. These
measures include school closure, workplace closure, cancellation of public events, restrictions
on large gatherings, restrictions on public transportation, stay-at-home orders, restrictions on
internal movement, and restrictions on international travel. Each of these measures are ordinal
variables with a minimum value of zero and maximum values ranging from two to four. Lower
values are associated with less stringent control measures. At the state-level, each measure is
associated with an accompanying indicator that flags days with control measures that were not

implemented state-wide. For days with only regional or county-level implementation of control
measures, the state-level implementation score was set to zero. This was deemed appropriate
as the regional and county-level implementations are captured in the county-level composite
stringency index.
Secondary research question.
For the model exploring the effect of social distancing policy on population movement the
county-level change in the amount of time spent at home was used. As control variables county-
level population, the proportion of the population over 18, median household income,
unemployment rate, and population density were used. As with the model described above, the
variables of interest in this second model are the weekly county-level and state-level composite
social distancing policy stringency indices. Mobility data was collected from Google (Google,
2022). Population socio-demographic data was collected from the US Census Bureau (US
Census Bureau, 2019). Population socio-economic data was collected from the US Bureau of
Labor Statistics (Bureau of Labor Statistics, 2021).
Analysis and statistical methods
The selected model for this analysis is a mixed-effects Poisson model. This model is
used to answer the primary research question. A second model was also specified using the
change in the amount of time spent at home as the outcome variable. This model is used to
answer the secondary research question. The variables of interest in both models are the county
and state-level COVID-19 social distancing order stringency level. The social distancing order
stringency level variable is a continuous variable ranging from 0-100. All analysis in this is
conducted using SAS 9.4.
The aim of both models is to determine whether county-level or state-level COVID-19
social distancing measures had a larger impact on the outcome variable. Two methods are used
to compare the relative impact of the county and state-level control measures in this study. The
first is the change in the log-likelihood associated with the model which provides a measure that

is comparable to the change in R2 (Harrell, 2015; Knaus et al., 1991) in ordinary linear
regression. The second method of comparing the relative importance is the calculation of
standardized regression coefficients. Standardized regression coefficients were calculated using
the process outlined by Neter, Wasserman, and Kutner (2004), which is shown below. In the
formula, ßi is the standardized beta coefficient, ß is the beta estimate, 𝜎𝑥𝑖 is the standard error
for the beta estimate, 𝜎𝑌 is the standard deviation for the response variable.
𝜎𝑥𝑖
ß𝑖 = ß
𝜎𝑌
To address potential concerns about the limitations of using standardized regression coefficients
(Bring, 1994) a sensitivity analysis was also conducted using partial standard deviations in the
calculation of the standardized regression coefficients.
Methods Specific Aim Two
Research question and hypothesis
The second aim of this study is to determine if state-level public sentiment on Twitter
towards COVID-19 control measures be used to predict the stringency of COVID-19 social
distancing measures at the US state-level between April 1, 2020 through January 9th, 2021. This
study holds the hypothesis that states with public sentiment levels that tend towards negative
values are associated with less stringent COVID-19 social distancing requirements. If public
sentiment on social media is found to be predictive of control measures stringency then
sentiment could be used to identify regions where added public health focus should be placed
on building community buy-in on prevention methods along with enhancing vaccine outreach
and education.
Study design and study population
Social distancing.

This study utilized a mixed-effects cumulative logistic regression model to explore the
relationship between public sentiment and social distancing measure stringency. The unit of
analysis in this model is US states. The study was restricted to English-language tweets in order
to limit the amount of variance and potential error when conducting sentiment analysis. The
study period of April 1, 2020 through January 9th, 2021 was selected in order to include the
entire first and second wave of COVID-19 transmission in the US (Ioannidis, Axfors, &
Contopoulos-Ioannidis, 2021).
Data collection and study variables
Social distancing.
The outcome of interest in this study was the state-level COVID-19 social distancing
stringency index as calculated by Hallas et al. (2020). Data on state-level COVID-19 social
distancing stringency was retrieved from the Oxford COVID-19 Government Response Tracker
database (T. Hale et al., 2021). To calculate the covariate of interest (monthly state-level
sentiment towards COVID-19 control measures), Twitter data was retrieved from the SARSCOV-
2 Twitter Chatter repository (Banda et al., 2021). The repository contains tweet identification
numbers for over 1.12 billion SARS-COV-2-related tweets. The methodology for tweet collection
is described by Banda et al. (2021). As such, a description of the methodology used to create
the repository is omitted here. The covariates include state-level population density and the
political affiliation of the state's governor (Khubchandani et al., 2021; G. Wang,
Devine, & Molina-Sieiro, 2021).
Analysis and statistical methods
Sentiment analysis.
Sentiment analysis was conducted using the Python programming language and the
Spark natural language processing (NLP) library. Embeddings were generated utilizing the
pretrained language model (PLM) universal sentence encoder (Cer et al., 2018).
Social distancing.
All analysis was conducted in SAS 9.4 (SAS, ND). Mixed-effect cumulative logistic
regression was used to describe the relationship between the outcome variables and the
covariates. The cumulative Oxford Government Response Tracker Social Distancing Stringency
Index was utilized as the outcome variable. The state-level population density and the political
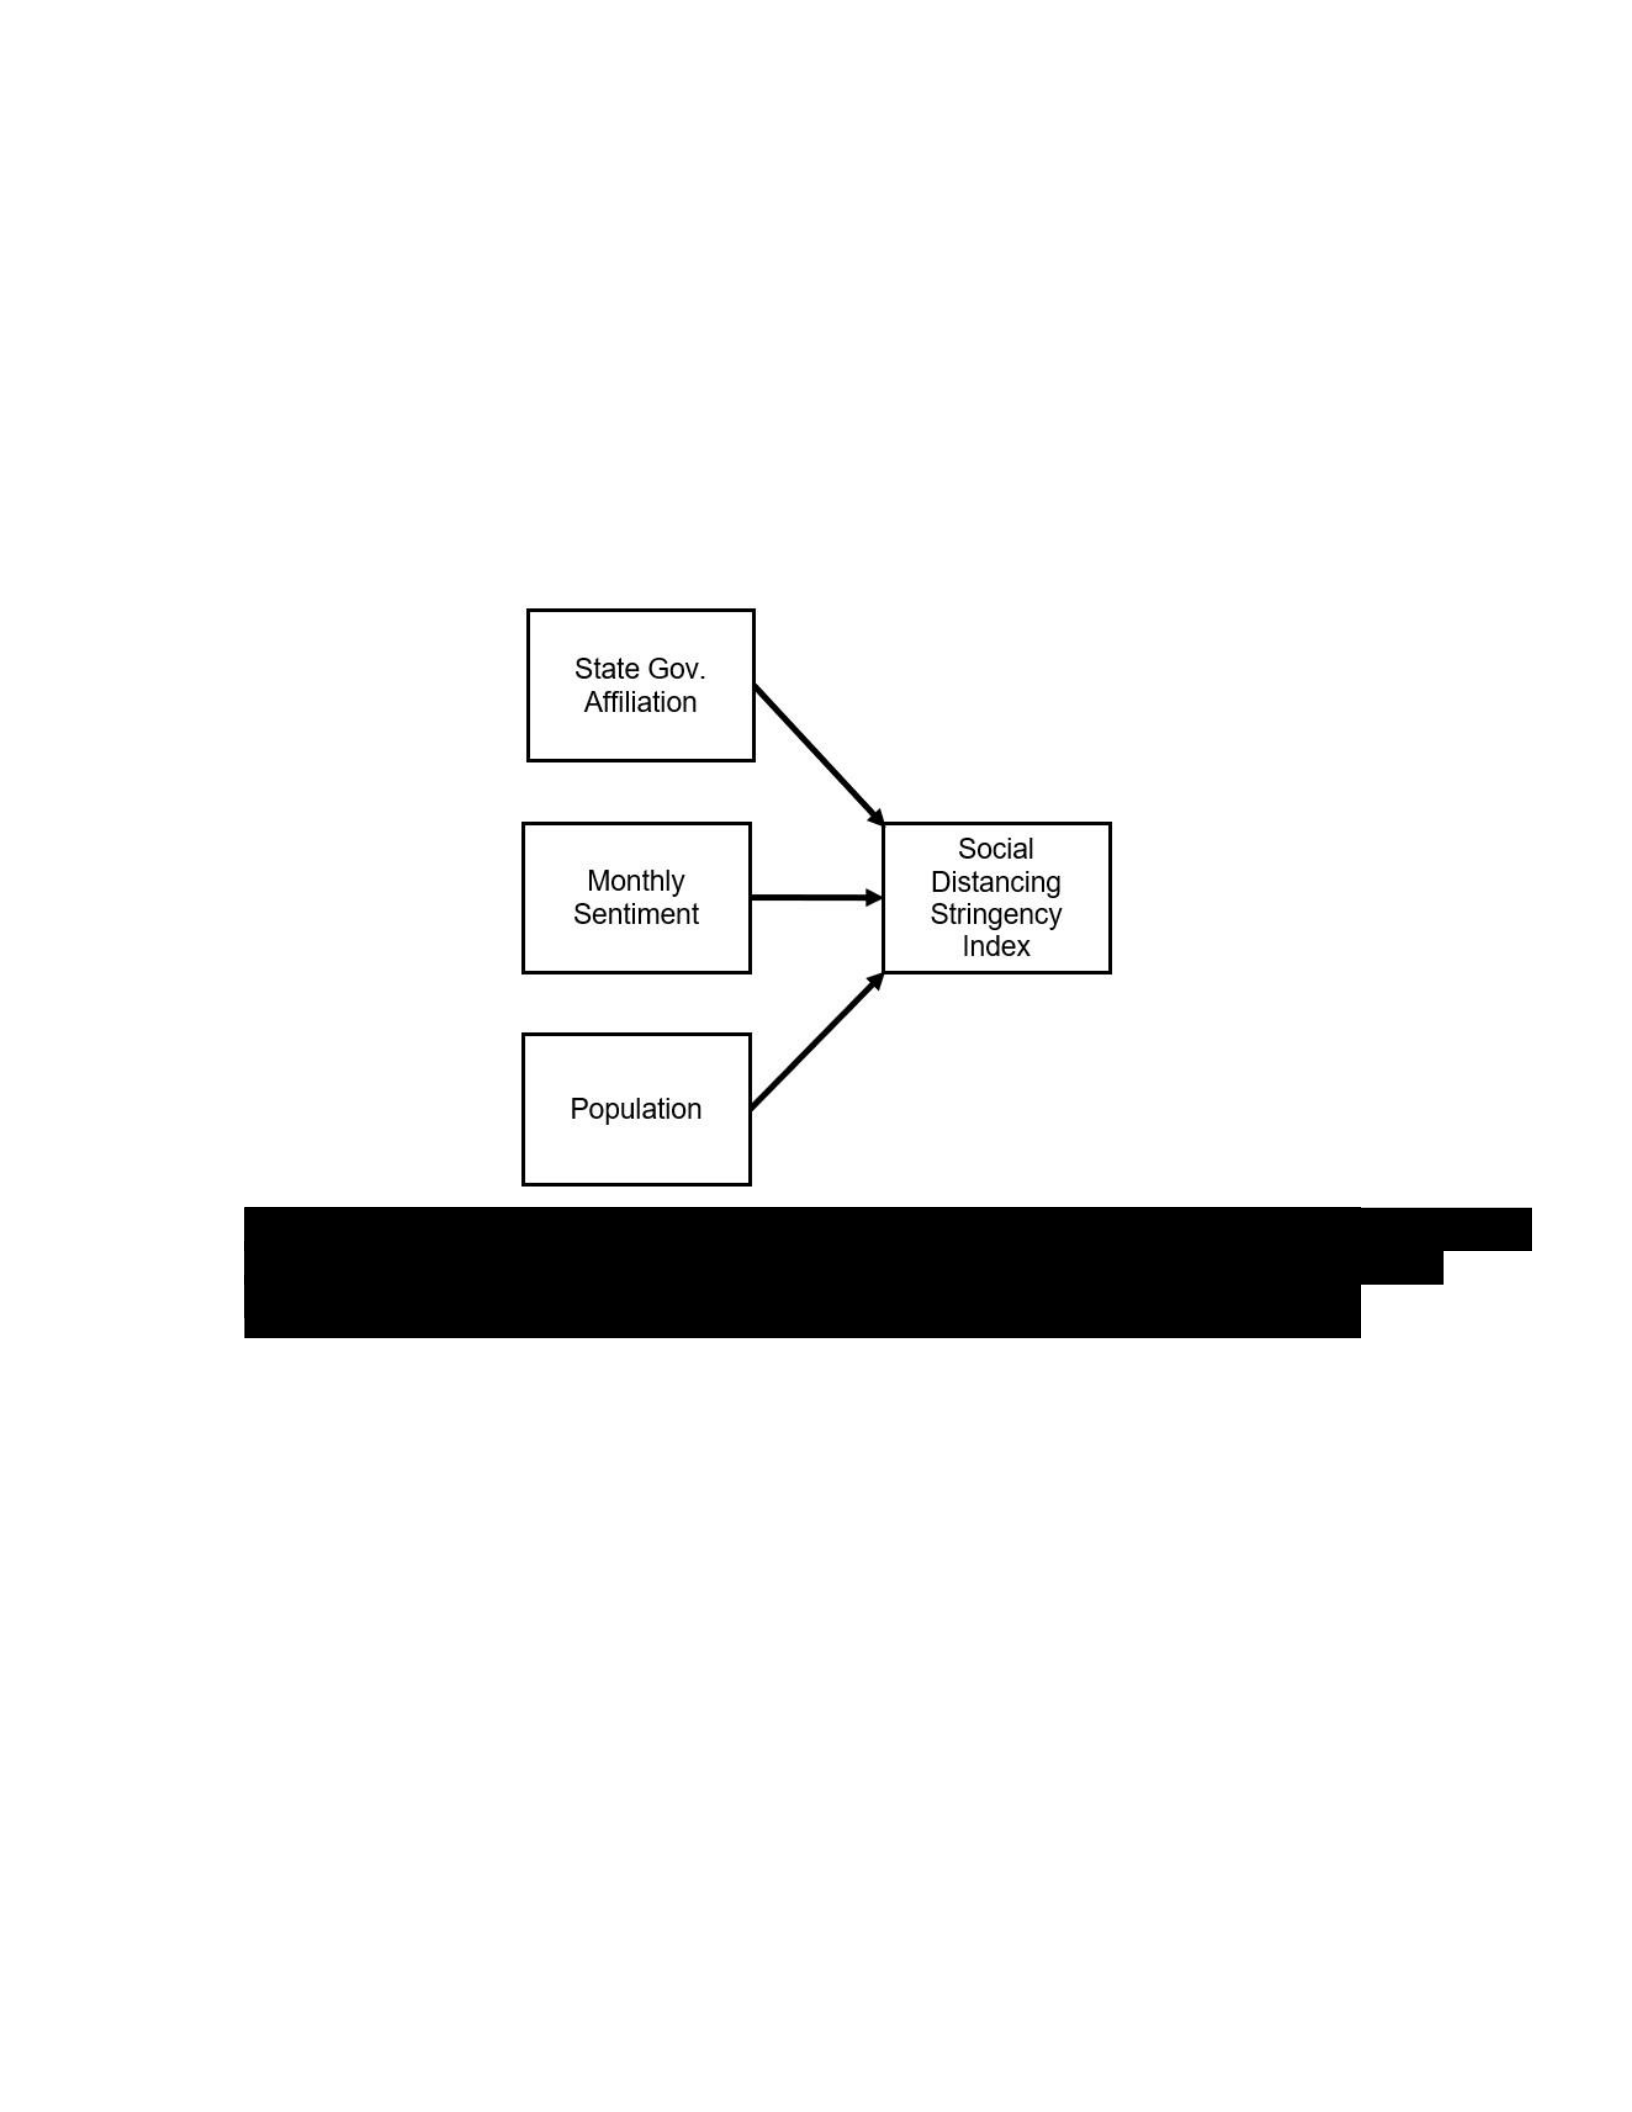
affiliation of the state's governor were included as covariates. Figure 1.4 displays the
hypothesized relationship between the variables included in this study.
Methods Specific Aim Three
Research question and hypothesis
The third aim of this study is to determine which text pre-processing steps are most
effective when attempting to improve the accuracy of transformer-based sentiment analysis
models on COVID-19-related Twitter data. The preprocessing steps being evaluated include the
calculation of emojis emotional polarity, converting hashtags to text, and varying the thresholds
for sentiment classification on model accuracy. This study holds the hypothesis that the inclusion
of emojis will have the largest effect on improving model accuracy.
Figure
1.
1
.
Visual representation of the model used in the completion of
a
im 2
.
Monthly sentiment and social distancing
stringency
index are the only time variant
variable included in the model.

Study design, study population, and data collection
An observational study design was utilized to address the third aim. The approximate
randomization test was used to evaluate the effect of data preprocessing on sentiment analysis
model accuracy measured by F1 scores (Noreen, 1989). This state-level analysis utilizes tweets
about COVID-19 control measures. The study period covers April 1, 2020 through January 9th,
2021. The COVID-19 Twitter Chatter repository was used to collect COVID-19-related tweets
(Banda et al., 2021). The study is restricted to English-language original tweets that contained
COVID-19 control measure-related keywords.
Analysis and statistical methods
Sentiment analysis.
Universal sentence encoder (USE) embeddings and this sentimentdl_use_twitter
classifier were utilized in sentiment analysis (Cer et al., 2018; JSL, 2021). Sentiment values
ranging from -1 and +1 were classified as either negative, neutral, or positive sentiments.
Squared semipartial spearman correlation coefficients were used to describe the relationships
between sentiment estimation methods used in this study. To evaluate the effect of the emoji
and hashtag-based sentiment estimates these values were compared to models which did not
include emojis or hashtags. Finally, variable thresholds for sentiment classification were set and
compared against one another to evaluate their effect on model accuracy. Differences in F1
scores and model accuracy statistics were calculated for each of the preprocessing steps
included in this study. The approximate randomization test was used to evaluate the
significance of the F1 score and model accuracy differences (Noreen, 1989).

Chapter Two: Manuscript One - Impact of Government-imposed Social Distancing
Measures on COVID-19 Morbidity, Mortality, and the Movement of People in Florida
Introduction
A variety of social distancing-based government-imposed non-pharmaceutical
interventions (NPI) have been implemented throughout the response to the SARS-CoV-2
pandemic. These include non-essential business closures, school closures, stay-at-home
orders, and restrictions on international travel (Hallas et al., 2020). The effect of COVID-19 NPI
such as non-essential business closures and stay-at-home orders on curbing disease
transmission has been well studied. Non-essential business closures are associated with the
largest impact on COVID-19 transmission when compared to the other social distancing-based
NPIs (Liu, Morgenstern, Kelly, Lowe, & Jit, 2021; Wibbens, Koo, & McGahan, 2020). When
compared to school closures, business closures, and travel restrictions, stay-at-home orders
have been found to be the second most effective COVID-19 NPI (Wibbens et al., 2020).
Research shows that stay-at-home orders have a larger impact on human mobility than other
NPI (Abouk & Heydari, 2021). However, not all NPIs are equally effective. School closures and
travel international travel restrictions have been associated with limited and short-lived effects
on COVID-19 transmission(Adekunle, Meehan, Rojas‐Alvarez, Trauer, & McBryde, 2020;
Askitas, Tatsiramos, & Verheyden, 2021; Chang, Harding, Zachreson, Cliff, & Prokopenko,
2020; Fukumoto, McClean, & Nakagawa, 2021; Liu et al., 2021). The fact that not all COVID-19
NPI are identical in their impact on disease transmission highlights the need to develop a clear
picture of the conditions that influence the effect of these social distancing-based NPIs.

Despite the fact that the effect of COVID-19 NPIs is clearly understood, the factors that
modify this effect have not been explored as thoroughly. One factor that warrants further
exploration is the public health governance structure in which these interventions are
implemented. Public health governance structures are commonly described as
standardcentralized, mixed-centralized, and decentralized (Blackwood et al., 2021). Historically,
decentralized structures have suffered reduced effectiveness due to an inability to implement
new policies that require legal authority or modification of existing public health policing powers
(Wilson, McDougall, & Upshur, 2005). Furthermore, it has been noted that excess
decentralization during public health responses has resulted in a lack of coordination during
national-level responses to SARS-CoV-1 and bioterrorist attacks (Campbell, 2004; Fidler, 2001).
Despite the clear importance of the topic, public health governance structure is often ignored in
epidemiologic research (Blackwood et al., 2021). To the knowledge of the author, only a single
research study has aimed to examine the effect that governance structure plays in modifying
COVID-19 transmission rates (Blackwood et al., 2021). However, this simulation-based study
explores the effect of governance structures when implementing international travel restrictions.
As has been discussed, travel restrictions are of limited utility in controlling disease transmission
in the real world.
The gaps in the current literature present an important opportunity to examine the role
that public health governance structure played in the response to the SARS-CoV-2 pandemic.
As a result, this study aims to determine if Florida state-level COVID-19 control measures had a
larger impact on COVID-19 community transmission than Florida county-level control measures.
Furthermore, this study aims to determine if Florida state-level COVID-19 control measures had
a larger impact on population mobility than Florida county-level control measures. In both
instances, this study holds the hypothesis that interventions implemented at the state-level

(centrally planned) have a larger impact. Should this hypothesis be borne out it would indicate
that more centralized responses to infectious disease epidemics should be prioritized over
decentralized responses.
Methods
Study design
This longitudinal observational study covers the period of March 1, 2020 through
October 25, 2020. The study period begins slightly before the first COVID-19 case was reported
in Florida and ended four weeks following the removal of all state-level COVID-19 controlrelated
restrictions on population movement and business operations (September 25, 2020; Desantis
(2020). Weeks were utilized as the measurement interval in the study. As a result, the study
covers weeks 9 through week 39 of 2020. Florida counties are the unit of analysis. Secondary
data was collected from a number of sources and compiled to complete this analysis. Given the
two research questions being explored, this study focused on two outcome variables 1.) the
weekly county-level basic reproductive rate (R0) and 2.) the county-level weekly percentage
change in the amount of time spent at home (mobility rate). All data analysis was conducted
using SAS 9.4 (SAS, ND).
Data collection
Change in R0.
To address the first research question, individual-level COVID-19 data was collected
from the Florida Department of Health (FDOH, 2021). State-level data on the variable of
interest, COVID-19 NPIs, were collected from the Oxford COVID-19 Government Response
Tracker Database (T. Hale et al., 2021). Additional data on county-level COVID-19 NPI were
collected from the Yale School of Management State and Local COVID Restriction Database
(Spiegel, 2022). To control for confounding, county-level population data was collected from the
US Census Bureau (USCB) (USCB, 2019). Furthermore, income inequality and air pollution
data were collected from the Robert Wood Johnson Foundation (RWJ, 2021). Finally, data

indicating weeks in which a national holiday occurred was also included in the model. This final
variable was included to account for potential changes in exposure rates caused by
holidayassociated variations in movement patterns contact during holidays.
Change in mobility rate.
Data on county-level change in mobility patterns from baseline were collected from
Google (Google, 2022). The baseline period was defined as January 3, 2020 - Feb 6, 2020. This
second research question retains the same variable of interest, namely state and countylevel
COVID-19 NPI. However, data on the county-level proportion of rural residents county was
collected from the RWJ Foundation (RWJ, 2021). Furthermore, RWJ Foundation county-level
data on income inequality, race, and the proportion of rural residents were also collected to
control for confounding. Finally, the indicator variable for weeks in which a US national holiday
occurred was also included in the dataset to account for changes in movement patterns caused
by holidays.
Data manipulation
Change in R0.
The county-level 14-day rolling average COVID-19 case counts were first calculated for
each county to account for the association between the number of COVID-19 daily case report
numbers and the day of the week (Bergman, Sella, Agre, Casadevall, & Rawls, 2020;
Zamaninasab, Sharifi, Mostafavi, Mounesan, & Haghdoost, 2021). The daily county-level R0 was
then calculated for each county utilizing the Robert Koch Institute method (Heiden &
Hamouda, 2020). In this calculation, the generation time of five days was used (M. Li, Liu, Song,
Wang, & Wu, 2021). Once the daily R0 estimates were calculated, the median weekly R0 was
identified and utilized as the weekly R0 value for each county.

The state and county-level NPI data were used to calculate the respective social
distancing indexes (SDI). As noted above, non-essential business closure and stay-at-home
orders were the only two interventions consistently found to reduce disease transmission.
Accordingly, each level SDI value was calculated by summing the weekly ordinal values for
nonessential business closure and stay-at-home orders. The weekly summed values were then
rescaled to range from 0-100 by dividing the observed weekly sum by the maximum weekly
summed value for the respective intervention level (ie, county or state-level). According to this
new scale, weekly SDI values of 100 would correspond to a week with the most stringent
implementation of social distancing measures. Following practices outlined in previous research
(Leffler et al., 2020; Liu et al., 2021; Thu, Ngoc, Hai, & Tuan, 2020; C. H. Wagner, 1982; Xiao,
2020), the one-five week lagged effect of COVID-19 NPI were each tested for inclusion in the
model by evaluating their association with the weekly county-level R0 using Pearson’s
correlation coefficient. The two-week lagged SDI was determined to fit the R0 data best.
Similarly, the holiday week indicator lagged by one week was identified as the best fit for the
data.
Change in mobility rates.
This study expects to find that the effect of SDI on county-level mobility rates is more
immediate than the effect on disease transmission. As a result of this hypothesized relationship,
no covariates were lagged when modeling the change in mobility rates.
Data analysis
Model specification.
Model one utilizes the weekly county-level R0 as the outcome variable. As stated above
the variables of interest were the county and state-level weekly SDI. The estimated county-level
population, average daily level of airborne particulate matter less than 2.5 micrometers (PM2.5) in
size, income inequality ratio, and the one-week lagged holiday week indicator were included to

control for confounding. For model one, a linear model with repeated county-level mixedeffects
was specified in SAS. In model two, the county-level change in the amount of time spent at
home was the outcome variable. Model two retained the same variables of interest as model
one. However, the income inequality ratio, the holiday week indicator, the proportion of
nonHispanic White residents, and the proportion of residents living in rural areas were included
to control for potentially confounding effects on mobility. In model two a linear mixed-effects
regression model was also utilized.
In both models, the comparisons of the relative influence of the state and county-level
control measures were carried out utilizing standardized regression coefficients. The
standardized regression coefficients were calculated performing z-score transformations on the
data set.
Results
Descriptive summary
The first state and county-level control measures were implemented in week 12 (week of
March 22, 2020). The median weekly state-level SDI period was 1.03 (interquartile range[IQR] =
.311). Using the Kruskal-Wallis test, both the state-level (p <.0001) and county-level (p <.0001)
SDIs were found to have changed significantly across the study period. The state-level SDI
reached its peak in weeks 15-18 of the year. When comparing county-level SDIs, a significant
difference was found in the cross-county comparisons (p<.001).
Change in R0.
The median R0 for the study period is 1.03 (interquartile range[IQR] = .311). The weekly
county-level R0 did change significantly across the study period, with peaks identified during
weeks 11 through 13 (week starts of March 15th and March 29th) and 24 through 27 (week starts
of June 14th and July 5th ). The highest single-week R0 values were reported in Hamilton,
Holmes, Lafayette, and Orange counties. These R0 values ranged from 3.60 to 5.55 and were
recorded in weeks 20 through 32 of the study period. However, using the Kruskal-Wallis test,
there was no significant difference in weekly R0 between the counties included in the study
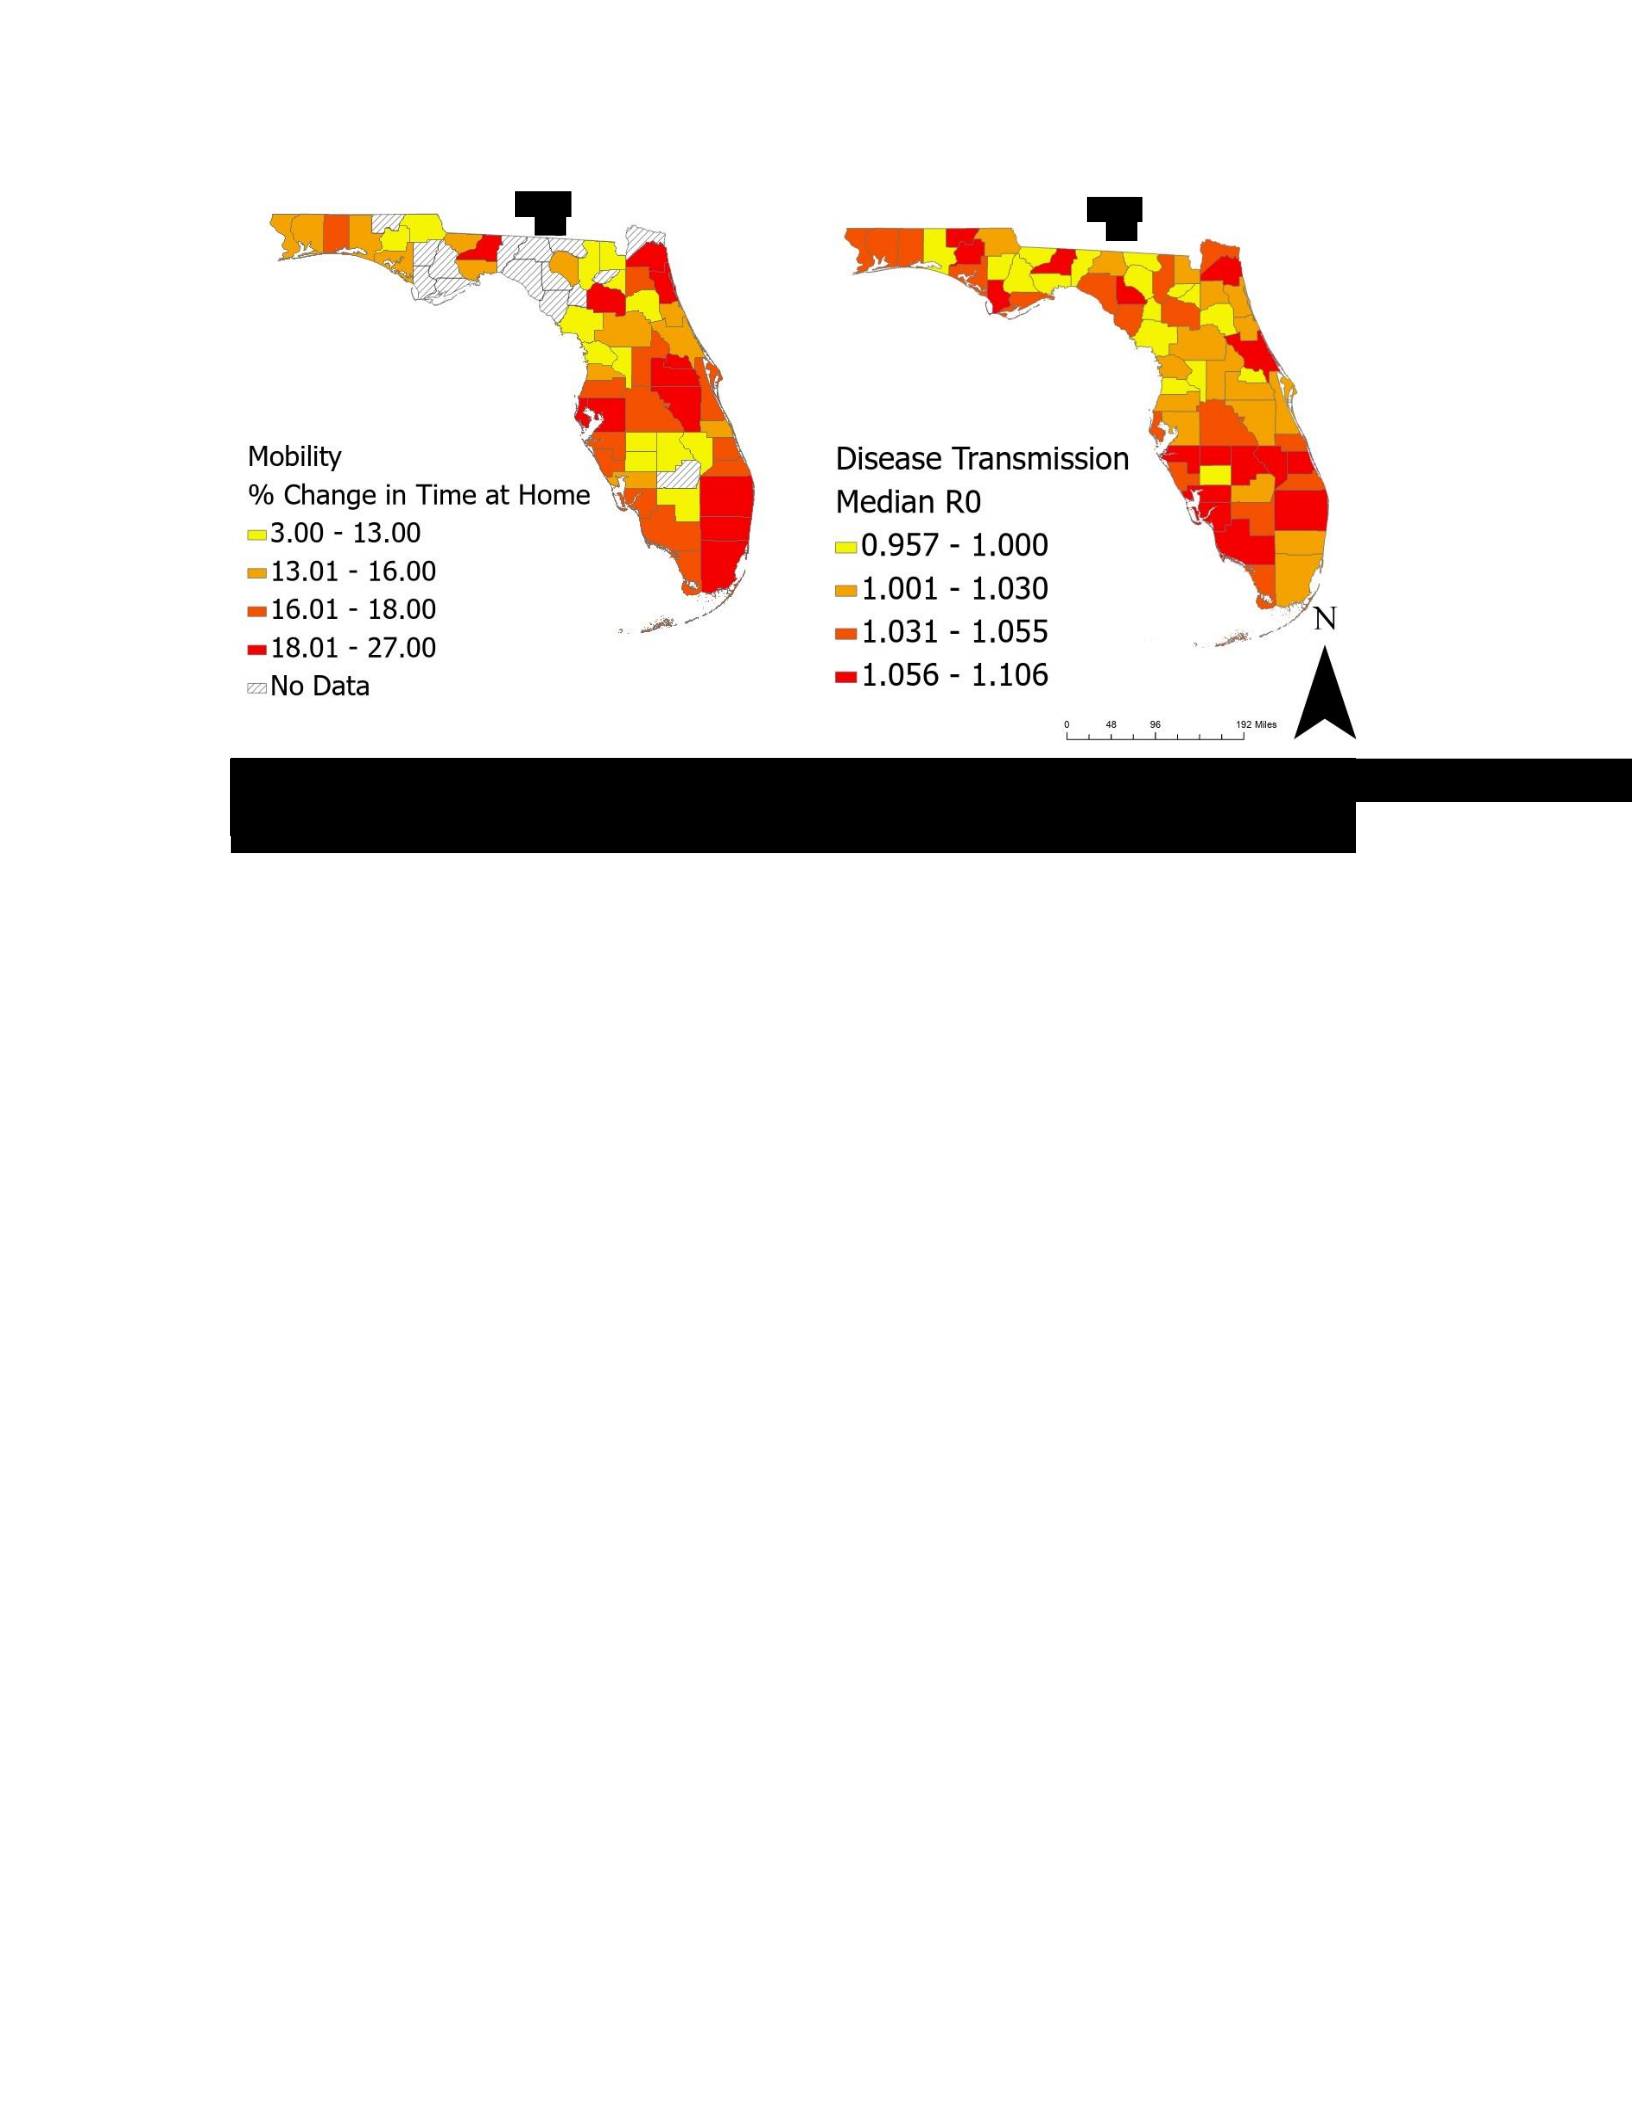
(p=.99). In Figure 2.1, map panel B displays the median county-level R0 values for the entire
study period. The total range between minimum and maximum county-level R0 values was .104.
Change in mobility rate.
The median change in time spent at home from baseline for the study period is 8% (IQR
= 7%). The weekly county-level change in the time spent at home did vary significantly across
the study period (p <.0001) and peaked during weeks 14-18. The largest increase in weekly
median change in mobility rates was seen in Broward (15%), Miami-Dade (15%), Leon (15%),
Figure
2.
2
.
County
-
level map of weekly median percent change (A) in time spent
at home and R
0
(
B
)
B
A
Seminole (14%), and Orange (14%) (See Figure 2.1). A moderate negative correlation was
observed between changes in mobility rate and the county-level proportion of non-Hispanic
White residents (r = -.348, p <0.001) and the proportion of residents living in rural areas (r =
.307, p <.001). As shown in Figure 2.1, data on the change in mobility patterns were not
available for all counties in Florida. For a full list of counties that were not included in the mobility
analysis see Table B.1 in the Supplemental Analysis section.
Model results
Research question one.
According to regression analysis results, an increase in state-level and county-level SDIs
were associated with decreases in the weekly county-level R0. State-level SDI was found to be
the second most influential predictor of the weekly county-level R0 (ß=-.210, p <.001). As a
result, a one standard deviation increase in state-level SDI (24) was associated with a .081
decrease in the expected county-level weekly R0. The one week lagged holiday indicator
variable was associated with the largest effect size (ß=-.213, p <.001). The county-level
population estimate was found to have a stronger association with the weekly R0 than the
county-level SDI (ß=-.160, p <.001). County-level SDI was the fourth most important predictor of
weekly R0 (ß=-.150, p <.001). An increase of 11.18 in the county-level SDI was associated with
a decrease of .058 in the expected weekly R0. The remaining predictors included in the model
had significant, but smaller, impacts than the state-level SDI, county-level population, and
county-level SDI. See Table 2.1 for a complete summary of the model parameter estimates.
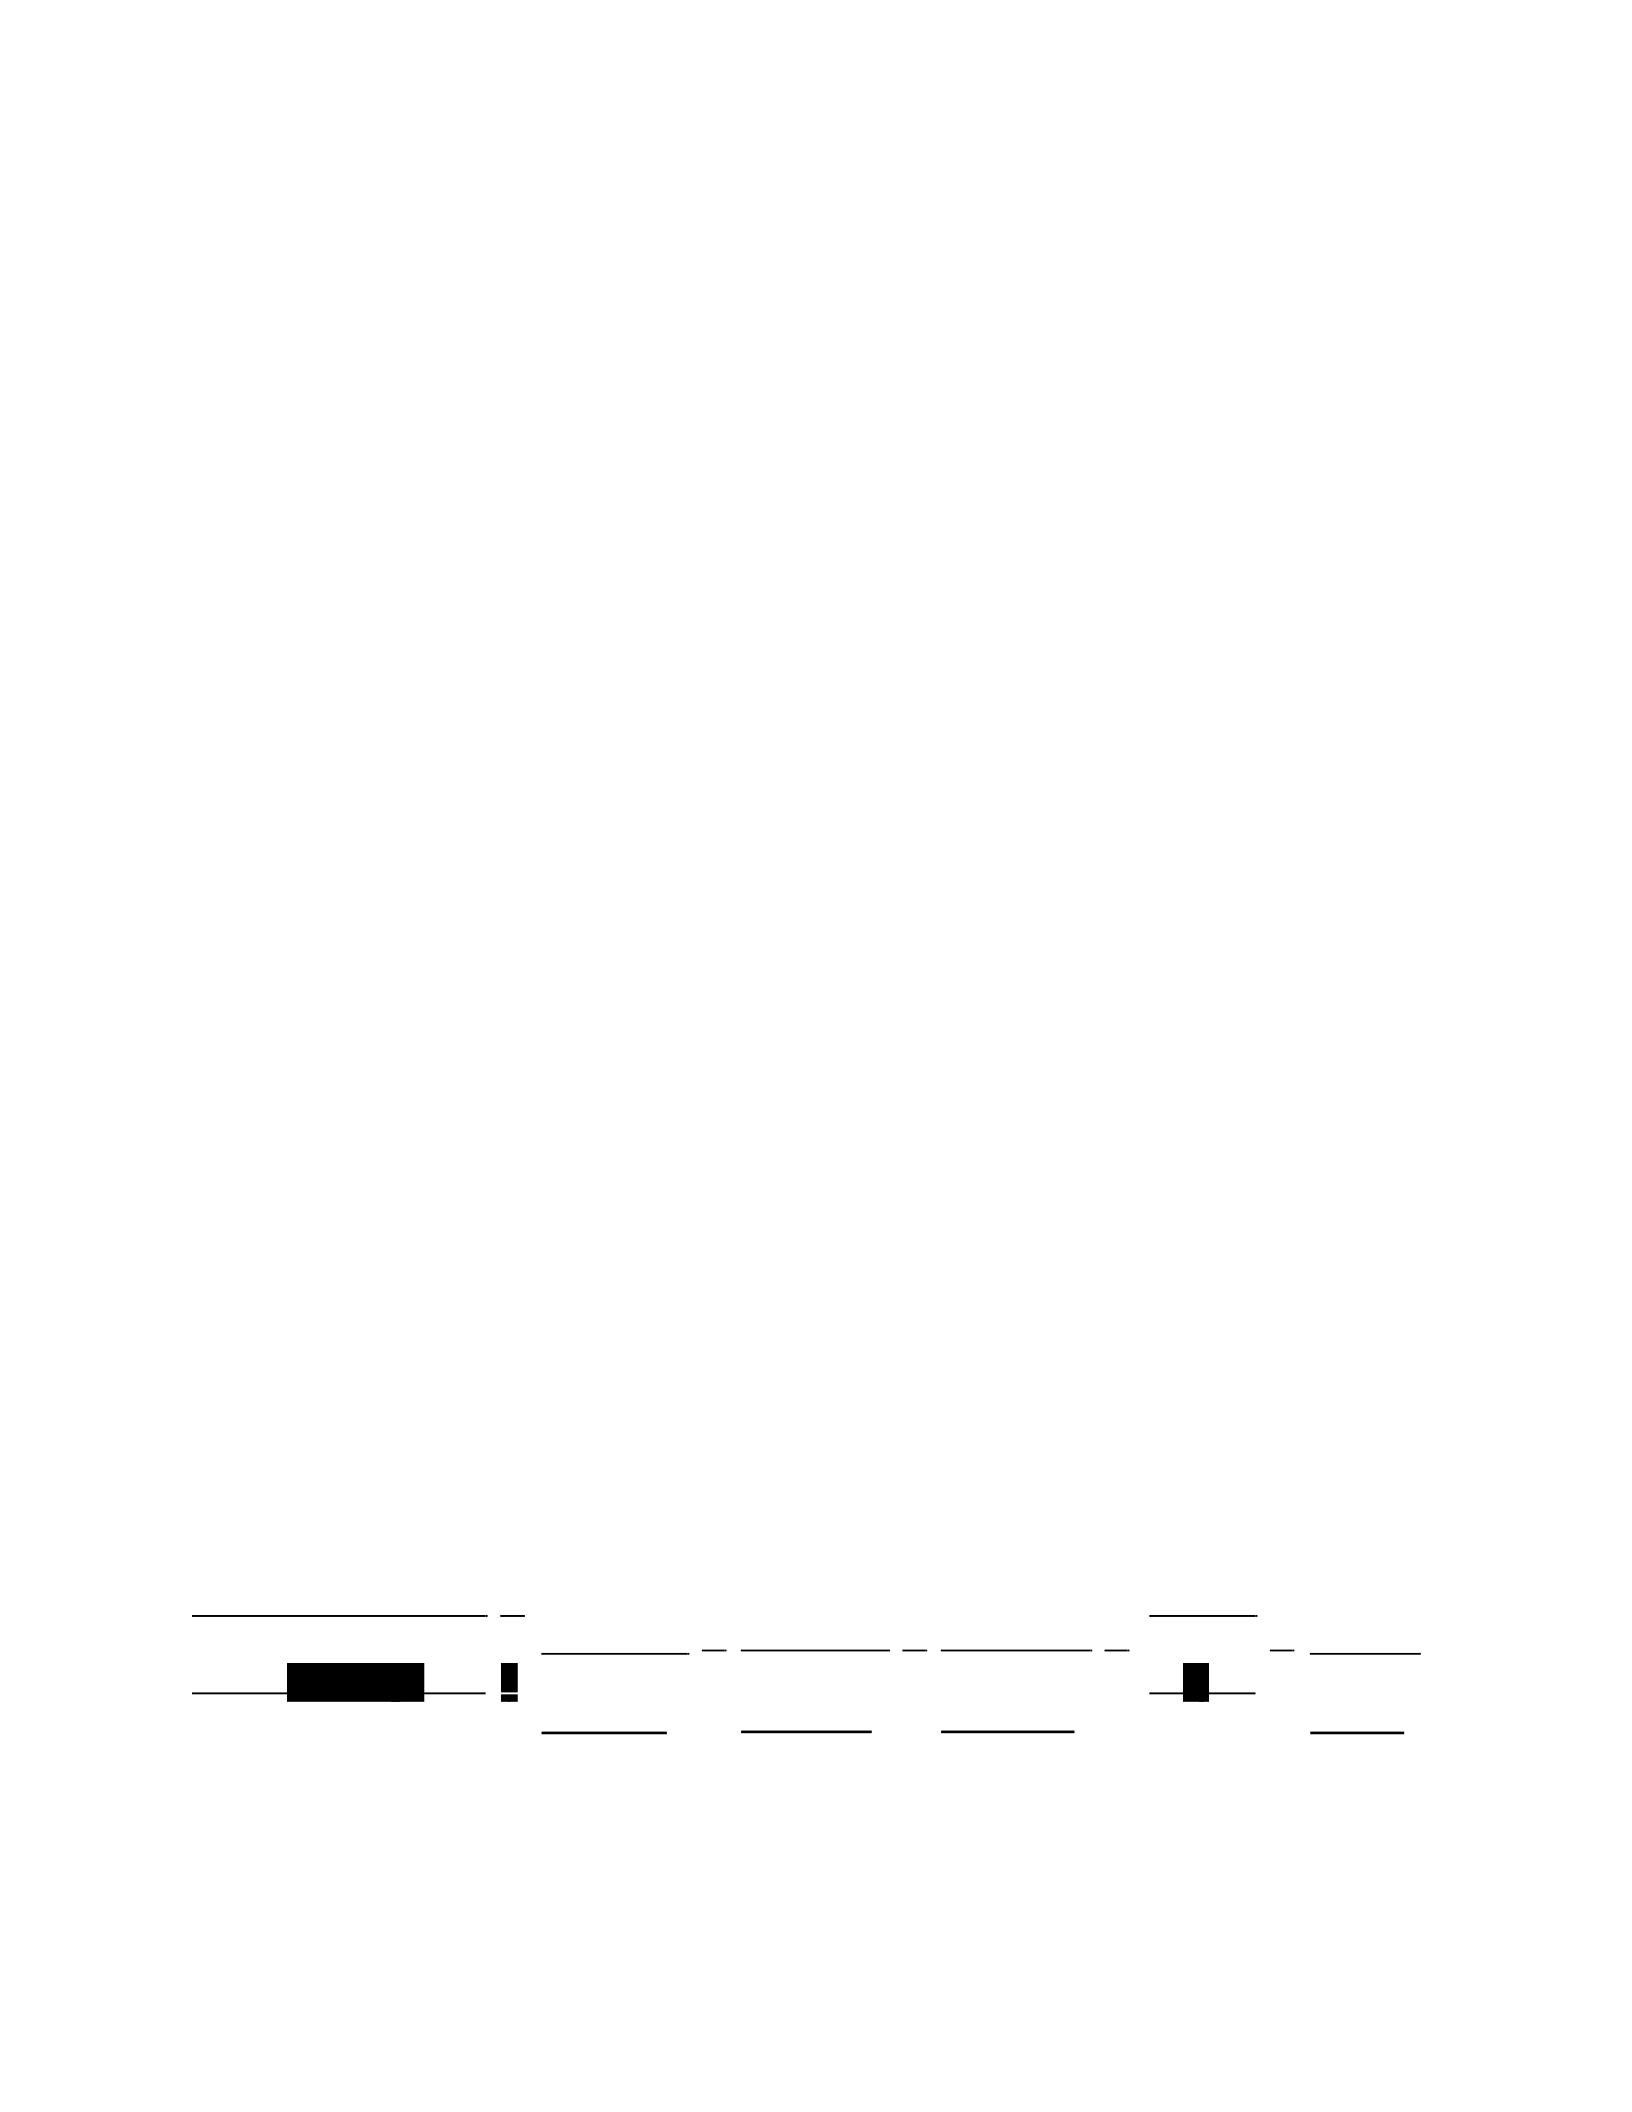
Table 2.1. Model one R0 outcome standardized regression coefficients
STD. EST.
STD. EST.
95% CI LB
STD. EST.
95% CI UB
p-value
State-level SDI
-.210
-.286
-.134
-5.570
<.0001
County-level SDI
-.150
-.210
-.090
-5.350
<.0001
Population
.160
.084
.237
4.810
<.0001
Variable
Z

Avg. Daily PM2.5
.036
.006
.066
2.460
<.05
Income Inequality
Ratio
.048
.011
.084
2.650
<.05
One Week Lagged
-.213
-.294
-.132
-5.110
<.0001
Holiday
STD. EST.: Standardized regression coefficient, CI: confidence interval, LB: lower bound, UB:
upper bound.
Research question two.
Conversely, to the relationship seen with the R0, increases in the state and county-level
SDIs were associated with subsequent increases in the weekly county-level change in the
amount of time spent at home. Just as with the R0, the state-level SDI was found to be the most
influential predictor of the county-level change in the amount of time spent at home (ß=.571, p
<.001). This equates to an additional 2.94 percentage point increase in the amount of time spent
at home for every one standard deviation increase in state-level SDI (25). The countylevel SDI
was the second most influential predictor of weekly change in time spent at home. The nature of
this association (ß=.367, p <.001) was similar to the association seen between the state-level
SDI and the change in the time spent at home. A one standard deviation increase
(11.18) in the county-level SDI was associated with a 1.90 percentage point increase in the time
spent at home. The county-level proportion of rural residents was the third strongest predictor of
the change in time spent at home (ß=-.155, p <.001). See Table 2.2 for a complete summary of
the model parameter estimates associated with model two.
Table 2.2. Model two change in mobility patterns standardized regression coefficients
STD. STD. EST. STD. EST.
Variable EST. 95% CI LB 95% CI UB Z p-value
State-level SDI
.571
.540
.603
34.840
<.0001
County-level SDI
.367
.228
.505
4.070
<.0001
Income Inequality
Ratio
.024
-.064
.111
1.550
.595
One Week Lagged
Holiday
.018
-.005
.041
2.920
.119

% of White Residents
-.068
-.173
.038
-2.530
.210
% of Residents in
-.155
-.220
-.089
-4.930
<.0001
Rural Areas
STD EST: Standardized regression coefficient, CI: confidence interval, LB: lower bound, UB:
upper bound.
Discussion
In reference to the county-level R0 and the change in the amount of time spent at home,
this study found that state-level control measures were more influential than county-level control
measures. There was little observed variation in the R0 values in the cross-county comparison.
Furthermore, the effect of decreasing the R0 associated state-level SDI was 39.59% larger than
effect seen in county-level SDI. In combination, these facts support the interpretation that
statelevel control measures were more effective at reducing disease transmission. By showing
that state-level SDI had a larger effect on mobility, this study also helped to shed light on the
mechanism by which state-level control measures influence disease transmission. Additionally,
the state-level SDI was the most influential variable on the weekly amount of time spent at
home. These finding underscore the importance of state-level social distancing-based NPIs. As
a result, public health governance structures with limited decentralization appear to be
preferable during the response to complex emergencies, such as pandemics.
To the knowledge of the author, this is the first study to evaluate the effect of public
health governance structure on real-world COVID-19 disease transmission. Furthermore, the
study is the first to provide evidence that state-level COVID-19 control measures have a larger
effect on disease transmission than county-level control measures. Ecological studies are
subject to a number of limitations including limited ability to control for confounding and temporal
ambiguity in relationships (Morgenstern, 1995; Thiese, 2014). However, this study accounted for
the latter limitation by lagging the independent variables of interest. Thus establishing an
appropriate temporal association. Furthermore, previous research has established that a

temporal relationship exists between the implementation of social distancing-based
interventions and changes in disease transmission rates (Leffler et al., 2020; Liu et al., 2021;
Thu et al., 2020; C. H. Wagner, 1982; Xiao, 2020). It should also be noted that ecological
studies have been found to be ideal when exploring the effect of societal-level public health
policies and interventions (Morgenstern, 1995; Schoenbach & Rosamond, 2000).
A few key limitations should be noted. The R0 assumes that the infection generation time
remains constant (Heiden & Hamouda, 2020). It is likely that newly emerging COVID-19 variants
and other novel viruses will be associated with generation times that differ from the fiveday
assumption used in this study. As a result, the R0-related finding may not be directly
generalizable to future pandemics. A potential limitation of this study is that the basic R0 does
not account for the protective effect of previous infection with SARS-CoV-2 or the effect of
vaccination (Delamater, Street, Leslie, Yang, & Jacobsen, 2019). However, vaccines were not
available during the time period included in this study. As a result, the inability to account for the
effect of vaccinations is not a concern for this research study. Finally, this study did not explore
the effect of social distancing measure implantation duration or timing. Previous research has
found that the point during the epidemic cycle at which social distancing measures start is
important (Medline et al., 2020). Additionally, the duration, or the number of consecutive time
periods that a social distancing measure is in place, is likely to play an important role in the
observed effect on disease transmission and associated risk of poor outcomes (Casares &
Khan, 2020; Matrajt & Leung, 2020; Neuwirth, Gruber, & Murphy, 2020). Future studies should
seek to account for the impact of intervention timing.
Conclusion
The bivariate and regression analysis results indicate that Florida counties with larger
proportions of rural residents saw smaller increases in the amount of time spent at home when
compared to less rural counties. Furthermore, the standardized regression coefficients show

that the proportion of rural residents was the third most influential predictor of changes in
mobility patterns, behind only state and county-level SDI. Future research should seek to
describe the factors that cause the proportion of rural residents to be such an influential
predictor of changes in mobility patterns. These findings indicate that rural areas may be
associated with lower levels of compliance and subsequently higher levels of exposure and
subsequent disease transmission. Should social distancing measures be required in the future,
gaining insight into the factors contributing to this phenomenon is imperative if efforts to ensure
equitable disease control-related outcomes across all regions are to succeed.
Our findings show that an overly decentralized response to the COVID-19 pandemic has
the potential to be ineffective. Nonetheless, future research should aim to determine the optimal
public health governance structure when responding to widespread respiratory disease
outbreaks such as COVID-19. Despite the results of this study, it is still unclear where the
threshold between an effective centralized response and an ineffective decentralized response
lies. Furthermore, efforts should be made to standardize the metrics used to classify public
health governance structures. This will allow for more effective comparisons and evaluations of
public health responses. COVID-19 is unlikely to be the last pandemic the national and
international public health systems are required to respond to. A thorough comparative analysis
of the disease control effectiveness of the various public health governance structures would
greatly benefit future efforts to design optimal intervention planning and implementation
frameworks.

Chapter Three: Manuscript Two Evaluation of the Relationship Between Public Sentiment
and US state-level COVID-19 Social Distancing Policy
Introduction
Since its initial detection in 2019, the SARS-CoV-2 virus has disrupted societies and
economies, while also causing physiological and psychological harm throughout the world
(Ammar et al., 2020; M. P. Hossain et al., 2020; Ramgobin et al., 2020; WHO, 2020; B. Wu,
2020). The distribution of SARS-CoV-2 mRNA vaccines has been found to be an effective
method of reducing some of the negative effects of the pandemic (Bajema et al., 2021; Victor,
Mathews, Paul, Mammen, & Murugesan, 2021). However, during the early phases of the
pandemic, non-pharmaceutical interventions (NPI) such as social distancing were the primary
disease control intervention (CDC, 2021a). Social distancing-based NPIs are effective methods
of reducing COVID-19 transmission and mortality (Vopham et al., 2020). Research has shown
that social distancing-based NPI effectiveness can be influenced by compliance rates,
stringency levels, and duration of implementation (Auger et al., 2020; Chang et al., 2020;
Wibbens et al., 2020). As a result, an exploration of the factors associated with these three
variables is critical to the effort to prepare for future pandemic threats.
Social-distancing-based compliance rates have been found to be associated with age,
occupation, and education attainment (Carlucci, D'Ambrosio, & Balsamo, 2020). Research on
factors that influence social distancing-based NPI stringency and duration has explored the
associated effect of political affiliation. For example, states with Republican leadership have
been found to be associated with less stringent and shorter duration social distancing-based

NPIs (Hallas et al., 2020; G. Wang et al., 2021). It should be noted that the COVID-19 response
in the US was reported to have become politicization (Fischer et al., 2021; J. C. Lyu, Han, & Luli,
2021). While the politicization of the COVID-19 response has caused political affiliation to be a
useful predictor of COVID-19 disease control intervention implementations, this relationship may
not hold true for future pandemics. To this point, further research is warranted to identify additional
predictors of COVID-19 social distancing-based NPI policies related to stringency levels and
duration.
Public opinion has often been found to influence policy (Page & Shapiro, 1983).
Evaluations of public opinion are often conducted through surveys and focus groups. However,
these methods are often costly or time-consuming. Social media data and modern analysis
methods such as sentiment analysis (SA) provide a near-real-time alternative to studying public
opinion. Sentiment Analysis (SA) is the process of utilizing text data in the study of attitudes,
opinions, or emotions (Medhat, Hassan, & Korashy, 2014). SA methods can be grouped into
three broad categories that include linguistic, lexicon, and machine learning-based methods
(Thelwall, Buckley, & Paltoglou, 2011). Lexicon-based methods utilize dictionaries of pre-scored
opinion-related terms which can then be used to assign emotion or sentiment categories to a
piece of text. Linguistic-based methods make use of the word context in making predictions
about the emotional content of the text (sentiment) (Thelwall et al., 2011). Finally, machine
learning-based approaches to SA utilize supervised or unsupervised models of varying
complexity to generate sentiment predictions based on the supplied text.
Older lexicon and linguistic-based methods suffer from many limitations including being
subject to the sparsity problem and an inability to account for rare and new words (Turian,
Ratinov, Bengio, & Assoc Computat, 2010). Many SA methodologies produce sentiment
predictions with accuracy levels below 70% (Hassan, Abbasi, & Zeng, 2013). These facts are
particularly important given that a number of COVID-19-related SA studies utilize older
lexiconbased methods (Kamiński, Szymańska, & Nowak, 2021; Massaad & Cherfan, 2020;

Rahman et al., 2021; Saleh, Lehmann, McDonald, Basit, & Medford, 2021; Samuel et al., 2020).
These limitations call into question the external and internal validity of much of the available
COVID-19 SA-related research. Fortunately, the utilization of more modern transformer-based
methods has been found to improve SA model accuracy (J. Zheng, Chen, Du, Li, & Zhang,
2020). Importantly, research has also found this to be true when using Twitter data (W. Wang,
Liu, Zhang, Xiang, & Mao, 2019).
In an effort to address some of the gaps in the current COVID-19-related SA research,
utilizing Twitter data and state-of-the-art SA methods this research study aims to explore two
primary research questions. First, this study aims to describe the nature of the relationship
between online public sentiment towards COVID-19 disease control measures and the
statelevel social distancing measure stringency as measured by the social distancing index
(SDI). This study holds the hypothesis that there is a positive association between state-level
public sentiment towards COVID-19 disease control measures and the state-level SDI.
Methods
Study design
This observational study utilizes a longitudinal design, with mixed-effects ordinal logistic
regression modeling to explore the relationship between public sentiment and social distancing
measure stringency. The study period includes tweets generated between April 1, 2020 and
January 9th, 2021 in order to include the entire first and second wave of COVID-19 transmission
in the US (Ioannidis et al., 2021). In this study, the state-level public sentiment towards
COVID19 control measures was the variable of interest. while the state-level SDI is utilized as
the outcome variable. In this longitudinal model months were the measurement interval.
Data collection
Data on state-level COVID-19 control measure stringency was retrieved from the Oxford
COVID-19 Government Response Tracker database (T. Hale et al., 2021). COVID-19-related
tweets posted on Twitter were retrieved from the publicly available COVID-19 Twitter Chatter

repository (Banda et al., 2021). The COVID-19 Twitter Chatter repository contains over 1.3
billion English, French, Spanish, and German language COVID-19-related tweets. Data on the
daily state-level of COVID-19 case count was retrieved from the COVID Tracking Project’s
(CTP) SARS-CoV-2 database (CTP, 2021). State-level population data was retrieved from the
US Census Bureau (USCB) (USCB, 2019).
The study is restricted to English-language tweets in order to limit the amount of variance
and potential error when conducting sentiment analysis. Furthermore, only original
COVID-19-related tweets containing the words ‘mask’, lockdown, ‘stay-at-home’, ‘business
closure’, ‘school closure’, ‘vaccine’, ‘Pfizer’, ‘Moderna’, or ‘mandate’ were retained in the data
set. Tweets that could not be linked to an individual state with the United States were excluded
from the analysis. Finally, states with at least three months' worth of data were excluded from
the analysis.
Retrieved tweets were classified by user type by using the public Twitter username. The
user type classifications included person, organization, and political figure. This classification
was conducted in four steps. First, the users were classified using keyword searches for terms
such as ‘news’, ‘governor’, or organization abbreviations such as ‘MSNBC’, or ‘NYT’. Next,
usernames were matched against a preconstructed list of US politician Twitter usernames
(Samoshyn, 2020). Next, named entity recognition (NER) using the ner_dl_bert model was
conducted (JSL, 2020). Finally, discordant results using the NER-based and keyword/political
username match methods were individually evaluated for manual assignment into one of the
three user-type categories. Tweets generated by organizations and political figures were
excluded from the study.
Data analysis
Sentiment analysis.
Using methods established in a number of studies, prior to the calculation of sentiment,
the original tweet text was cleaned to remove hashtags, URLs, and emojis (Garcia & Berton,

2021; Shi et al., 2020; Su et al., 2020). Sentiment analysis was conducted using Google’s
Universal Sentence Encoder sentence embeddings and the open-source
sentimentdl_use_twitter model (Cer et al., 2018; JSL, 2021). Sentiment analysis and topic
modeling was conducted using the Spark NLP library version 4.2.0 in Python 3.7. Sentence
detection was completed using the pre-trained sentence_detector_dl model (Shchweter &
Ahmed, 2019). During sentiment analysis, each sentence in each tweet was passed through the
pre-trained model. Possible values of sentiment scores ranged from -1 to +1. Sentence
sentiment scores were then averaged to derive the overall sentiment score for each tweet.
Model validation was conducted by comparing the result of the pre-trained model to a
randomly selected, manually labeled sample of tweets. A sample of 10% of the user-generated
tweets was manually labeled with either positive, negative, or neutral sentiments. To gauge
intra-rater reliability, 20% of the manually labeled tweets were randomly selected and manually
labeled again. The initial rating and the follow-up rating on the 200 randomly selected tweets
were compared using Cohen’s Kappa. All labeling was conducted by the author. For model
validation purposes sentences from the study sample were also classified as positive, negative,
or neutral sentiment. This process was done by calculating, the 25th and 75th percentile
sentiment scores, excluding the bounding -1 and +1. Sentiment scores that fell at or below the
25th percentile were labeled as negative sentiment. Scores above the 75th percentile were
labeled positive sentiments. All other scores were labeled neutral. The calculated and manually
labeled sentiment categories were compared using the F1 score and overall model accuracy.
Regression analysis.
The longitudinal mixed-effect model utilized the time-variant monthly state-level
sentiment towards COVID-19 control measures as the variable of interest. The state-level
population and political affiliation of the governor were also included in the model to control for
confounding. The outcome variable was the monthly median state-level SDI. In the model,

states served as the study units. Observations were repeated across months, which were
nested within each year.
Results
Data set.
The control measure keyword search returned 130,210 tweets generated during the
study period. After excluding retweets, tweets with no state information, and duplicate tweets
from the same user 19,364 (14.87%) of the tweets were retained in the dataset. Of the
remaining tweets, 7,593 were generated during the study period. The user type classification
process determined that 3,965 of the tweets generated during the study period were created by
a non-organizational or political figure user. From this final set of tweets, 9,388 sentences were
detected. As a result, 938 sentences were randomly selected for manual sentiment labeling and
Descriptive
r
esults
Figure
3.
1
.
Map of US state
-
level med
ian sentiment overlayed with the median social
distancing index (SDI)
94 of those tweets were randomly selected for re-labeling in order to validate the manual
labeling process.
Twitter data from 42 states were included in the study. In total, 754 (19.57%) and 228
(5.91%) of the tweets received sentiment scores of -1 and 1 respectively. Excluding the
bounding 1 and -1 scores, the median tweet sentiment score was -0.15 (interquartile range: .84,
.33). Table C.1 in the supplemental analysis section contains a detailed summary of the
sentiment scores for each state. The five lowest median sentiment values were seen in Hawaii,
Alabama, Missouri, New Jersey, and Georgia. However, when comparing the state-level
sentiments using the Kruskal-Wallis test these differences were not found to be significant.
(p=0.093). Figure 3.1 displays a map of the overall median sentiment values for each state
included in the study.
The monthly state-level SDI took ordinal values included 0 (1.65%), 20 (12.40%), 40
(27.57%), 50 (0.41%), 60 (41.56%), 80 (9.05%) and 100 (5.35%). See Figure C.1 in the
Supplemental Analysis section for a visualization of the monthly SDI distribution. As shown in
Figure
3.
2
Trend for US
-
level
monthly median sentiment and median social distancing
index (April 2020
–
Jan 2021)

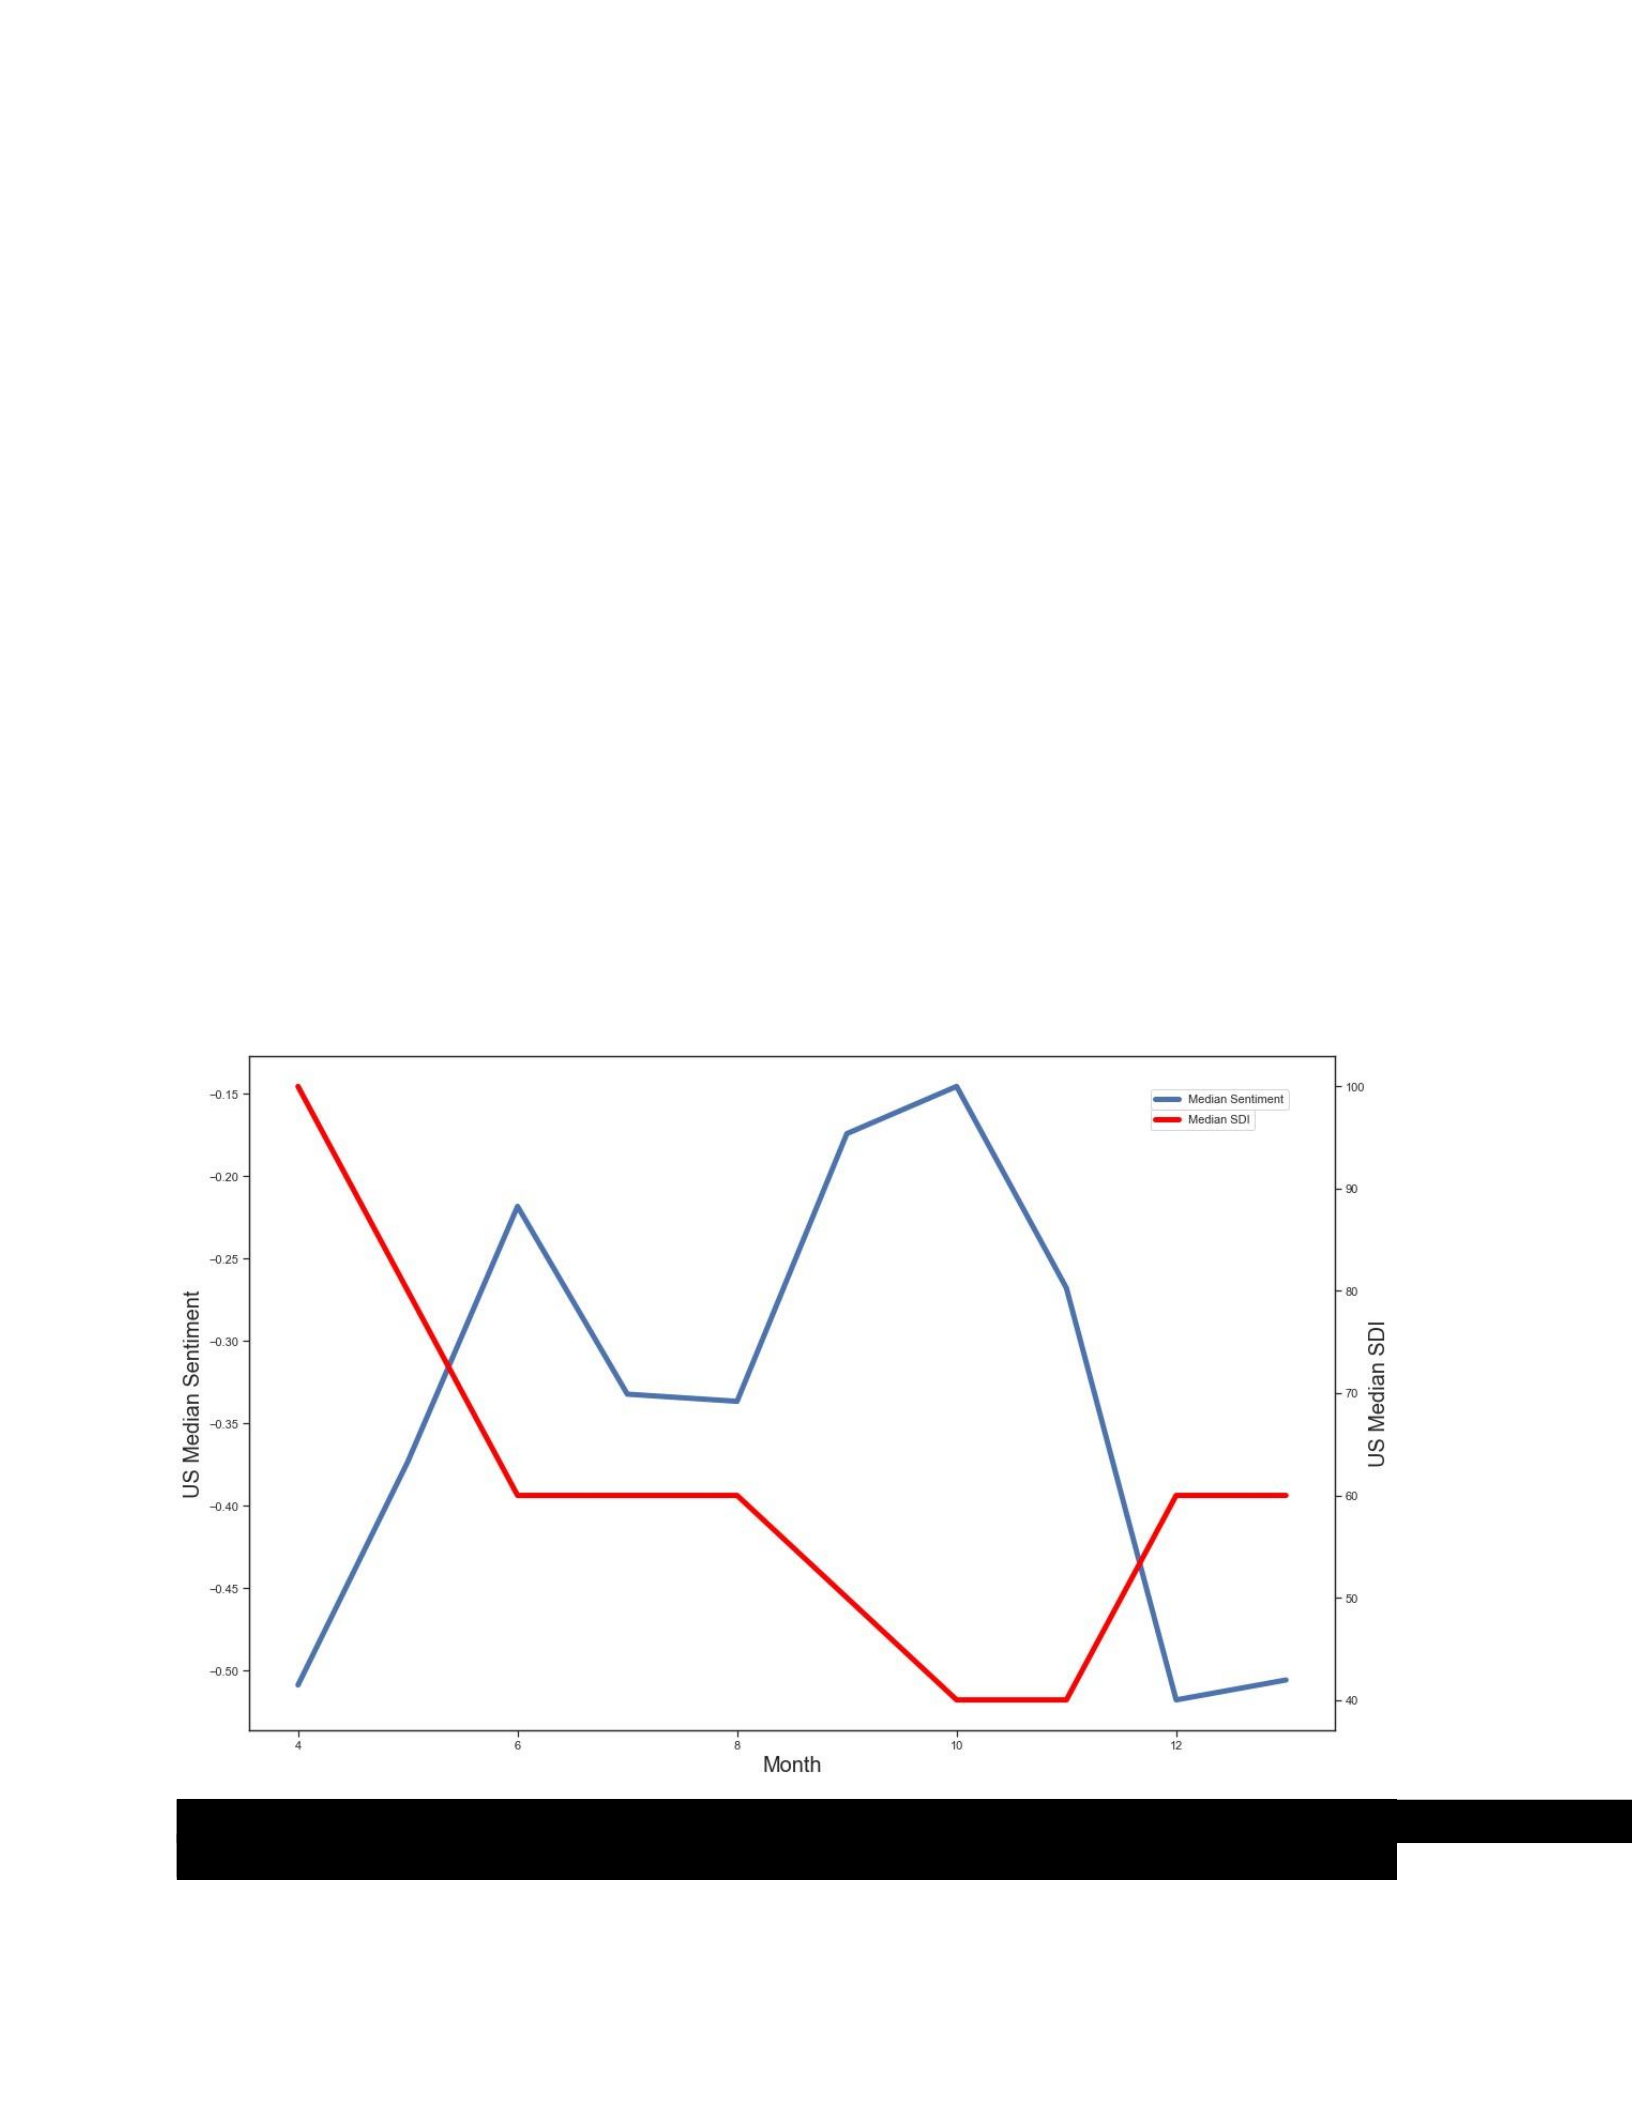
Figure 3.2, the overall national-level median SDI peaked for the US in April 2020. However, the
SDI fell continually until reaching its lowest point between October and November 2020. The
monthly state-level SDI was found to differ significantly with the highest values being recorded in
Florida, New York, Washington, and California (p<0.001). At the state-level, the monthly SDI was
found to have a non-significant correlation with monthly sentiment towards control measures (r=-
0.08, p=0.21) or population density (r=-0.07, p=0.25).
Model results
Less than 2% of the months included in the study recorded median SDI levels of 0 or 50.
As a result, the SDI was collapsed into four ordinal values one (0 and 20), two (40 and 50),
three (60), and four (80 and 100). When compared to the Republican reference group, states
with non-partisan governors were associated with lower odds of observing less stringent SDI
levels (odds ratio [OR]: 0.09, 95% CI: 0.04, 0.23). Likewise, Democratic affiliation was
associated with lower odds of less stringent SDI levels. However, this difference was not
significant (OR: 0.52, 95% CI: 0.22, 1.20). Overall, adding the state governor's political affiliation
did not improve the model significantly (p=0.20). On the other hand, the addition of state
nontime varying state population to the model was beneficial (p<0.01). For every one-million
Table 3.1. Model parameter estimates associated with cumulative logistic regression,
Outcome: social distancing index (SDI)
OR 95% CI LB
OR 95% CI UB
p-value
State Governor
Affiliation (D)
0.52
0.22
1.20
0.13
State Governor
Affiliation (NP)
0.09
0.04
0.23
<0.001
Population 1M units
0.91
0.86
0.97
<0.001
Median Monthly
1.35
0.85
2.14
0.21
Sentiment
OR: Odds ratio, CI: confidence interval, LB: lower-bound, UB: upper-bound, D: Democrat, NP:
Non-partisan, M: Million.
Note: odds ratios indicate the effects on the odds of observing a lower and not higher value of
SDI given the identified value of the variable.
Variable
OR

residents of a state the odds of observing lower SDI values decreased by 8.8% (OR: 0.91, 95%
CI: 0.86, 0.97). Finally, the study did not find the median monthly sentiment to contribute
meaningfully to the model (OR: 1.35, 95% CI: 0.85, 2.14). See Table 3.1 for a complete
summary of the model estimates.
Discussion
The ordinal logistic regression model produced for this study was associated with a QIC
that was lower than that of the null model (606 vs. 644). The model was successfully able to
predict the observed SDI value in 42.80 % of the sample and was associated with Kendall’s Tau-
b of 0.37 (p<0.001). These metrics indicate that the specified model was a better fit for the data
than the null model with no predictor variables included. However, the state-level population was
the only variable found to improve the fit of the model.
While the selected ordinal logistic regression model was found to be a better fit for the
data than the null model, this study is associated with one important limitation. During model
evaluation, the pre-trained Universal Sentence Encoder and Bidirectional Encoder
Representation from Transformers (BERT) sentence embeddings along with the lexicon-based
Textblob sentiment analysis tool were compared using F1 scores to evaluate model accuracy.
The inter-rater reliability when comparing tweets that were labeled twice was substantial (Kappa
= 0.83). It should be noted that the selected sentiment analysis model for this study was
associated with an overall accuracy rate of 41.91%. The F1 scores for this model varied by
sentiment label negative (0.52), neutral (0.31), and positive (0.38). See Table C.2 for a full
summary of the model evaluation statistics. The potential role of the low observed level of
sentiment analysis model accuracy cannot be ignored as a possible explanation for the study's
inability to detect an association between state-level sentiment and SDI.
A number of factors could have contributed to the low level of sentiment analysis model
accuracy and the non-significant association between sentiment and SDI. First, the NLP
methodologies utilized in this paper may not have been implemented in accordance with stateof-

the-art standards. Additionally, keyword searching does return tweets containing words of
interest. However, these tweets are often not about the topic of interest. For example, the tweet,
“Trump coronavirus adviser Scott Atlas undermines importance of masks as cases spike” was
clearly written to convey a negative opinion and contains one of the keywords used in the study
(masks). However, the subject of the tweet is Scott Atlas and not facemasks. Similarly, the
tweet, “The man or woman or child who will not wear a mask now is a dangerous slacker”
expresses a negative opinion, but towards those who do not use facemasks. Both of these
examples express negative sentiments but imply that the tweets’ authors are in support of the
use of facemasks to prevent COVID-19 infections. These tweets indicate that keyword
searching alone might not be sufficient when conducting sentiment analysis on social media
data for public health research. It is important to accurately identify the subject of social media
posts prior to attempting to make inferences about the effect of online sentiment on real-world
outcomes.
Nearly six percent of the tweets included in this study contained emojis. Following
established methods, during tweet preprocessing, hashtags and emojis were removed from the
text (Garcia & Berton, 2021; Shi et al., 2020). However, emojis give social media users the
ability to express a variety of emotions without the use of text (Hao, Cai, Yang, Wen, & Liang).
As a result, dropping emojis could remove valuable information from the data set. Researchers
have found that using emojis to automatically produce emotional labels for Twitter data can be
more accurate than manually labeling by a human (Hussien, Al-Ayyoub, Tashtoush, & Al-Kabi,
2019). More research is needed to determine the utility of emojis in public health sentiment
analysis-based research.
While this study only focused on tweets generated by non-organizational and nonpolitical
figure users it is important to note that researchers should be mindful of the differences between
the posting habits of the various user types on social media. This study found that tweet
sentiment differed significantly by user type (p<0.001). Tweets generated by organizations were

the most negative followed by users then political figures. The NER methods used in this study
modified the assigned user type for over one percent of the users in the sample. The use of
NER in identifying user types should be further explored as a best practice in public health
sentiment analysis-based research.
Conclusion
Future researchers interested in utilizing social media data for exploring the opinions
towards disease protective behaviors should keep a number of facts in mind. First, public health
researchers interested in natural language processing should be aware that while pre-trained
machine learning models offer many advantages, the external validity of these tools should not
be assumed without model validation. Next, according to Sun et al. (2020) transformer-based
models such as BERT are not always robust to issues associated with typos and non-standard
word spelling. Typos, the use of slang, short forms, and acronyms are a well-established
concern with social media data (Clark, Roberts, & Araki, 2010). However, the nature of social
media data can make it difficult for automated spelling correction algorithms to address errors
while preserving the intent of the writer (Clark & Araki, 2011). More focus needs to be placed on
evaluating the effect of spelling correction in the context of social media-focused public health
research.
Future research should also explore the applicability of topic modeling and semantic role
labeling in efforts to address the limitations of keyword searching with social media data. Topic
modeling alone may not be sufficient. As shown in the two tweets below there can be a great
deal of overlap in the words used in a tweet about a single topic, but expressing opposing views.
Tweet One: ‘Wear a mask, practice social distancing, wash your hands.’
Tweet Two: ‘Scott Atlas a neuroradiologist, who has won Trump's favor while asserting
that social distancing and masks don't work.’

As shown in this study, a post expressing negative emotions about individuals who fail to use a
protective behavior should be treated differently from a post that indicates negative emotions
about the protective behavior itself. Understanding this fact is particularly important when
studying sentiment toward health-protective behaviors. As a result, it is crucial that reliable and
generalizable methods be developed to determine if a post is about using versus not using a
protective behavior if sentiment analysis is to gain greater utility in public health research.
Special characters and symbols frequently appear in Twitter data (Keerthi Kumar & Harish,
2018). In this study emojis and hashtags were removed from the tweets during the datacleaning
process. More research is needed to identify and evaluate methods of retaining this data in
user-generated social media data.
This study has shown that sentiment analysis has the potential to be utilized in public
health research. However, there is still a great need for the establishment of best practices in
addressing the limitations outlined in this paper.
Chapter Four: Manuscript Three Evaluation of methods to improve Neural Network Based
Sentiment Analysis Models when used on COVID-19 Related Twitter Data.
Introduction
Recent years have seen the rise of pre-trained language models (PLMs) such as BERT,
GPT, XLNET, and the Universal Sentence Encoder (Cer et al., 2018; Devlin, Chang, Lee, &
Toutanova, 2018; Kalyan, Rajasekharan, & Sangeetha, 2021). PLMs are typically used in a
pretrain finetune paradigm (Elazar et al., 2021). PLMs are first trained on a large dataset in an
often unsupervised task (Edunov, Baevski, & Auli, 2019). PLMs such as BERT are associated
with a number of advantages. One major advantage is that these models allow researchers to

conduct natural language processing without the costly model training step (Petroni et al.,
2019). Additionally, language models (LMs) which utilize distributed word representations
capture the semantic and syntactic qualities of the term more effectively than those that do not
(Mikolov, Sutskever, Chen, Corrado, & Dean, 2013; Nozaki, Hochin, & Nomiya, 2019). The
increases in the semantic and syntactic information capture result in improved model accuracy
when compared to older language modeling methods (Hill, Reichart, & Korhonen, 2015).
These models can have their parameters or model weights modified to better suit
downstream tasks that are related, but not identical to the problems that the models were
originally trained on (T. Gao, Fisch, & Chen, 2020; Mathew & Bindu, 2020). This process is
known as finetuning. Pre-trained models such as BERT can be fine-tuned by adding or
modifying the output layer alone (Devlin et al., 2018; Merchant, Rahimtoroghi, Pavlick, &
Tenney, 2020). Fine-tuning has been found to work well when the new data falls within the same
domain as the original pre-training data (Merchant et al., 2020). PLMs have been known to
struggle to produce consistent results when there is a large amount of variation in word tense,
word-order, or syntax between the training data set and the data sets used for downstream
tasks (Elazar et al., 2021). The reasons behind the low levels of consistency following finetuning
PLMs are not well understood, but optimization difficulties and variation in the loss functions
used during the training process are thought to contribute to the problem (Elazar et al., 2021;
Mosbach, Andriushchenko, & Klakow, 2020). The use of small datasets is also thought to
contribute to the risk of observing poor model performance following fine-tuning (Mosbach et al.,
2020).
Given the challenges associated with improving PLMs during downstream analysis,
identifying tools that can be used to increase PLM accuracy could increase the utility of these
models. This is especially true for non-finetuning-based models of increasing model accuracy.
Preprocessing is a broad term that can include stop-word removal, letter case normalization,
abbreviation expansion, stemming, N-gram creation, lemmatization, spelling correction, and

removing web addresses and hashtags (Hacohen-Kerner, Miller, & Yigal, 2020). When using
lexicon-based NLP methods, text preprocessing can improve model accuracy by reducing the
number of unique words present in a corpus (Uysal & Gunal, 2014).
Many modern machine learning-based methods have made certain preprocessing sets
obsolete. For example, N-gram creation and stop-word removal have proven ineffective when
using neural network-based models or transformer-based methods (Jurafsky & Martin, 2019;
Qiao, Xiong, Liu, & Liu, 2019). Research has shown non-standard text such as emojis can be
used successfully to identify emotions such as joy, sadness, fear, anger, and disgust in Twitter
posts (Hussien et al., 2019). Similarly, Z. Chen et al. (2021), found that the use of emoji-based
sentiment analysis (SA) tools such as Sentimoji has been found to produce sentiment analysis
models with F1 scores that range from 0.67-0.90 when used on user-generated text posts
online. Incorporating Twitter hashtags have also been found to increase sentiment analysis
model accuracy (Koto & Adriani, 2015; Xiaolong Wang, Wei, Liu, Zhou, & Zhang, 2011). Despite
these facts, text preprocessing steps designed to remove these data elements are common
practice even when using PLM with Twitter data. For example, when using PLMs with social
media data it is common practice to remove hashtags, mentions, URLs, and emojis (Garcia &
Berton, 2021; Shi et al., 2020; Su et al., 2020).
Given that a large amount of data along with expertise in coding and machine learning is
required to train and finetune an LM, identifying alternative methods for improving model
accuracy would greatly increase access to and potential utilization of these state-of-the-art LMs.
Additionally, to the knowledge of the author, there have been no studies that explored the
relative importance of hashtags and emojis in improving model accuracy. This study intends to
address these gaps by evaluating three PLM preprocessing steps to determine if they are
associated with improved PLM performance when conducting sentiment analysis on Twitter
data. Specifically, this study will evaluate the effect of the preprocessing steps of calculating
emojis emotional polarity, converting hashtags to text, and varying the thresholds for sentiment

classification on model accuracy. The primary focus of this study is to determine which of these
preprocessing has the largest impact on model accuracy. This study holds the hypothesis that
the inclusion of emojis will have the largest effect on improving model accuracy. However,
should any of the preprocessing steps being evaluated in this study prove to be effective it
would identify an easy-to-use tool capable of improving PLM accuracy.
Methods
Study design and data collection
This observational study utilizes the approximate randomization test to evaluate the
effect of data preprocessing on sentiment analysis model accuracy, measured by F1 scores
(Noreen, 1989). This state-level analysis utilizes tweets about COVID-19 control measures. The
study includes tweets generated during the study period which covers April 1, 2020 through
January 9th, 2021. The publicly available COVID-19 Twitter Chatter repository was used to
retrieve COVID-19-related tweets (Banda et al., 2021). The study is restricted to
Englishlanguage original tweets that contained COVID-19-related tweets containing keywords.
The keywords used included terms such as ‘mask’, lockdown, ‘stay-at-home’, ‘business closure’,
‘school closure’, ‘vaccine’, ‘Pfizer’, ‘Moderna’, and ‘mandate’. Tweets without a documented
location within the United States were excluded from the analysis.
Data manipulation and analysis
Sentiment analysis.
Pre-trained universal sentence encoder (USE) embeddings were used to create the
sentence embeddings (Cer et al., 2018). The John Snow Labs’ (JSL) sentimentdl_use_twitter
model was used to generate sentiment predictions (JSL, 2021). Sentence embeddings in the
USE model are created with a deep averaging network (DAN) feed-forward neural network
(Iyyer, Manjunatha, Boyd-Graber, & Daumé III, 2015). Tweets in the study were classified as
either negative, neutral, or positive sentiments. The classification was done by first excluding the

bounding -1 and +1 sentiment scores. Then the 25th and 75th percentile sentiment scores were
calculated for the sample. Finally, scores above the 75th percentile were labeled positive
sentiments. Scores that fell at or below the 25th percentile received a label of negative
sentiment. Scores that did not fall within these two ranges were classified as neutral. Moving
forward this method of classifying sentiment shall be referred to as the quartile method. The
quartile method was used as the baseline for all model comparisons involving sentiment
classification threshold variations. Squared semipartial spearman correlation coeffients were
used describe the relationships between sentiment estimation methods used in this study.
Emojis.
To evaluate the effect of emojis on model accuracy, unique emojis were matched to the
emoji-emotion repository which assigns a sentiment polarity value to emojis (Wormer, 2014).
Using a method adapted from Hussien et al. (2019) The polarity values for each emoji in a tweet
were summed to calculate a tweet sentiment score. Sentiment scores for each tweet were
classified as positive, neutral, and negative using the same process outlined above. However, with
the emoji subset, only emoji data was used in the classification. Each tweet containing an emoji
was also reviewed by the author and manually assigned a sentiment label for the purposes of
model validation. Finally, sentiment analysis was also conducted on each emojicontaining tweet,
excluding the emojis themselves. This model will be referred to as the nonemoji model moving
forward.
Hashtags.
In a similar fashion to that outlined for tweets containing emojis, those containing
hashtags were isolated from the study sample. However, the hashtags were then put through an
automated standardization and editing process that converted the hashtag into normal written
text. Sentiment analysis was then conducted using the converted text of the hashtag using the
USE-based model. The tweets containing hashtags were each manually assigned a sentiment
label based on the sentence text, excluding hashtags. Additionally, sentiment analysis was

conducted on the tweets containing hashtags, excluding the hashtag. This model will be referred
to as the non-hashtag model moving forward.
Sentiment threshold manipulation.
To explore the effect of selecting variable thresholds when classifying the sentiment
groups two methods were used. In the first method, the threshold values for each sentiment
were systematically altered through 84 modification iterations. The iterations started with an
upper threshold value of -1.0 and -0.9 for negative and positive sentiments. The values between
these two thresholds were classified as neutral sentiment. In the first phase, each of the
thresholds were monotonically increased by 0.1 until the lower threshold of +1 was reached for
the positive sentiment. In the second phase, the probability of predicting a neutral sentiment was
maximized by decreasing the upper threshold for negative sentiments while holding the lower
threshold for positive sentiment at +1. The decrease in the upper limit of the negative sentiment
continued until the threshold reached -1 again. At that point, the lower threshold for the positive
sentiment was decreased by 0.1 per iteration until the limit reached -0.9.
In the final phase, the threshold values were set at -0.33 and 0.33 for the negative and
positive sentiments respectively. The thresholds were then increased and decreased in a similar
fashion to that outlined above. The systematically reached sentiment thresholds were
considered for further evaluation if the following criteria were met:
1. The overall model accuracy statistic associated with the thresholds were significantly
better than the quartile method of threshold setting.
2. The systematically derived threshold was not associated with a decrease in the F1
score for any of the sentiment classifications when compared to the quartile method
of threshold setting.
See Figure D.1 in the supplemental analysis section for a visualization of the sentiment
threshold modification process. The second method of selecting sentiment thresholds involved,
using the calculated sentiment proportions in a manually labeled sample of tweets to set the

sentiment threshold values to match the sample probabilities. Moving forward the sentiment
threshold values that were derived in this fashion shall be referred to as the probability-based
sentiment thresholds.
Model evaluation.
To evaluate the utility of emoji-based sentiment estimates these values were compared
to the non-emoji-based predicted sentiments derived from tweet text. Similarly, hashtag-based
sentiments were compared to tweet text-based sentiments. In both cases, tweets were manually
labeled to identify the true sentiments. Differences in F1 scores and model accuracy statistics
were calculated by subtracting the calculated evaluation statistics for the emoji or hashtagbased
models from the models that did not include emojis or hashtags. Significance testing was
conducted using the approximate randomization test and 10,000 iterations (Noreen, 1989). The
approximate randomization test was used due to its non-parametric nature and the ability to use
this test with heteroscedastic and non-randomly sampled data (R. S. Chen & Dunlap, 1993;
Hayes, 1998).
The process used to carry out the approximate randomization test included multiple
steps. First, the difference between the F1 scores for two models (model A and model B) was
calculated. Next, each observation in a matched pair of sentiments were randomly assigned to
either model A or model B. The model evaluation statistics were recalculated for the two
randomly assigned dataset and the subsequent difference between the model evaluation
statistics were also calculated. This process was repeated for 10,000 iterations for each pair of
models being compared. P-values for each randomization test were calculated using the
formula below.
𝑘
𝑃 𝐼 {𝐷𝑖 < 𝐷∗}
𝑖=1

Where 𝑃(𝐷 < 𝐷∗) is the probability of observing an F1 score difference that is lower than 𝐷∗ the
calculated difference. 𝐼 {𝐷𝑖 < 𝐷∗} represents the count of all difference values lower than 𝐷∗. The
formula can be reversed to calculate the p-value in instances when the calculated difference is
positive.
Results
Descriptive summary
A total of 3,965 user-generated tweets were included during the study period. There
were 237 (5.98%) tweets that included emojis. This included 468 emojis for an average of 0.12
emojis per tweet. When considering only posts that included emojis there 1.97 emojis were used
per tweet. As shown in Figure 4.1, the emoji-based sentiment values were correlated with the
true sentiment values (squared semipartial correlation[sr2]=0.04). The non-emoji-based model
was associated with a larger sr2 of 0.08. Hashtags were included in 1,342 (33.85%) of the tweets
in the sample. A total of 5,580 hashtags (1.41 hashtags per tweet) were included in the sample.
Of the tweets that included hashtags an average of 4.16 hashtags were used per post.
The hashtag-based sentiment values were correlated with the true sentiments (sr2=0.09).
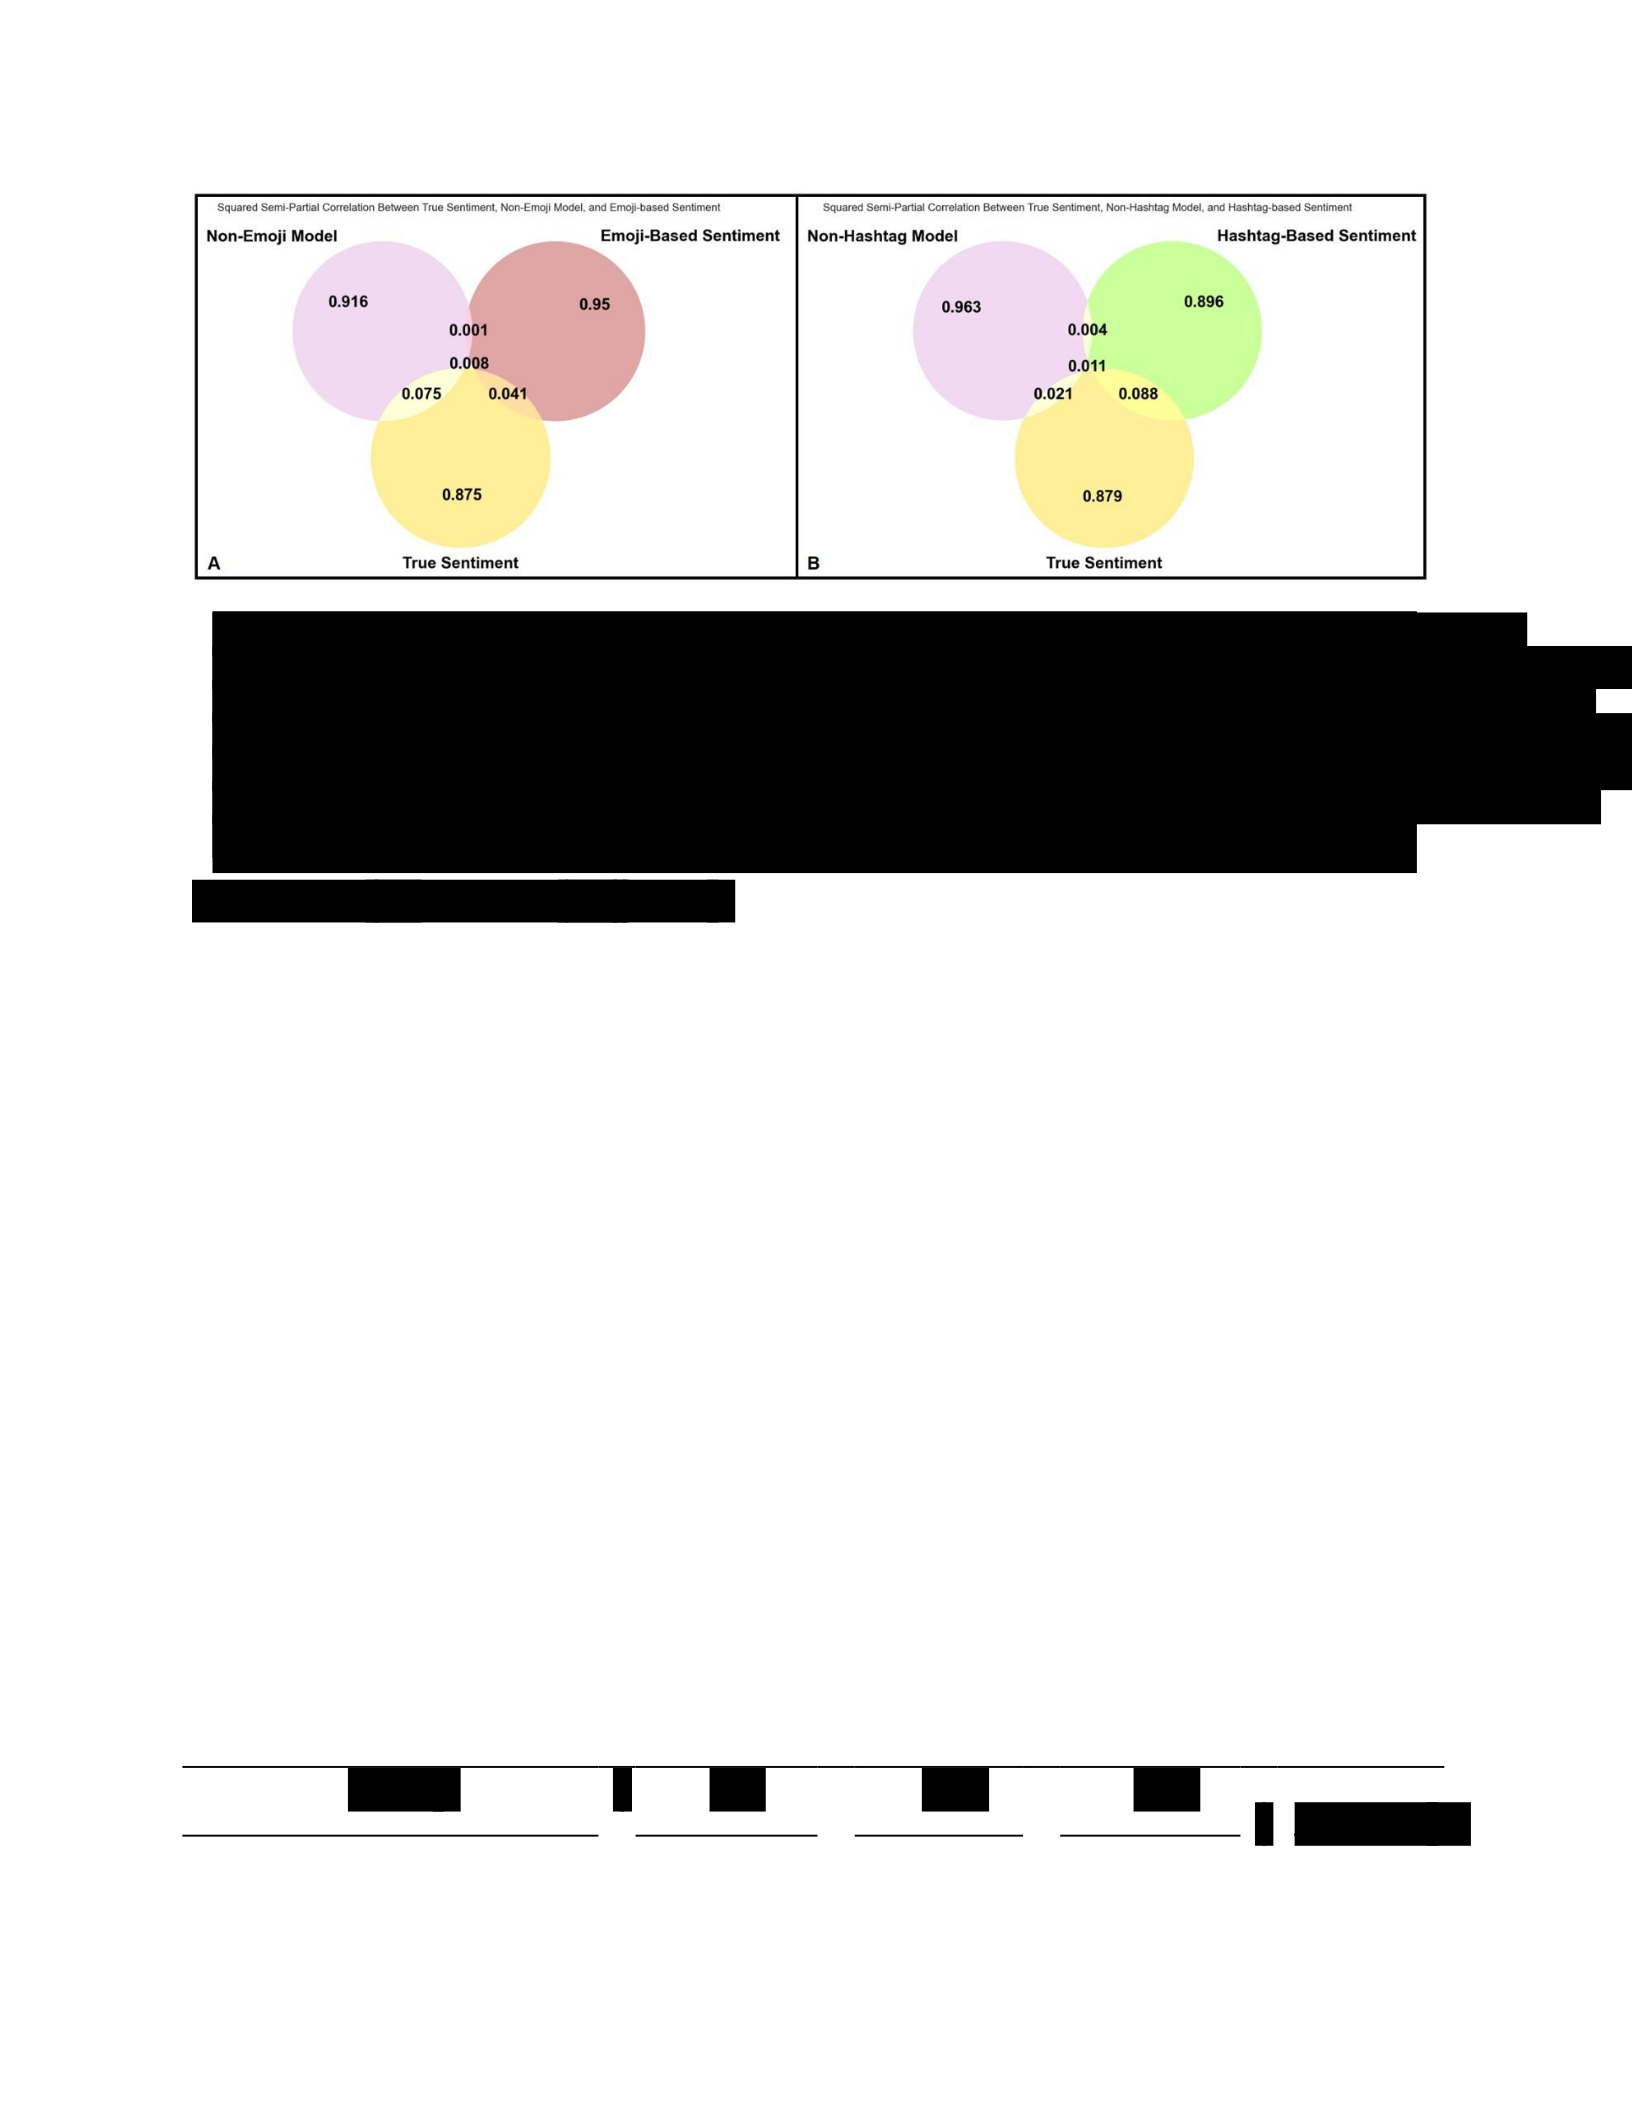
Emoji.
In predicting negative sentiment, the emoji-based model achieved an F1 score of 0.44.
Similarly, the model produced F1 scores of 0.5 and 0.47 when predicting neutral and positive
sentiment, respectively. The overall emoji model accuracy was 0.47. The model which excluded
emojis was associated with an overall model accuracy of 0.46. This non-emoji model was also
associated with F1 scores of 0.44, 0.34, and 0.58 for negative, neutral, and positive sentiment,
respectively. The difference in model accuracy comparing the non-emoji to the emoji model was
-0.009 (p=0.39). Neutral sentiment was the only classification where the models performed
differently, with the emoji-based model outperforming the non-emoji model (difference=-0.16,
p=0.01). See Table 4.1 for a summary of the difference in F1 scores and model accuracy
differences.
Table 4.1. Approximate randomization test results for model evaluation statistic
difference
Negative Neutral Positive
Approximate
r
andomization
t
est
r
esults
Figure
4.
1
. Squared semipartial spearman’s correlations.
Panel A displays the squared
semipartial correlation relationships between the manually labeled sentiment (True
Sentiment), the emoji
-
based
sentiment model(Emoji
-
Based Sentiment), and the model which
excluded emojis (Non
-
Emoji Model). Panel B displays the squared semipartial correlation
relationships between the manually labeled sentiment (True Sentiment), the hashtag
-
based
sentiment model (H
ashtag
-
Based Sentiment), and the model which excluded hashtags
(
Non
-
Hashtag Model)
Model
F1
F1
F1
Accuracy

Hashtags Difference** -0.20* -0.10* -0.15* -0.13*
Emoji Difference** -0.01 -0.16* 0.10 -0.01
Probability-based Sentiment
-0.04* 0.02 0.03* -0.02
Threshold
Best Systematic Sentiment
-0.02* 0.003 0.007 -0.01*
Threshold***
*: Significant at alpha <.05, universal sentence encoder-based sentiment analysis model using
tweet text excluding hashtags and emojis used as the reference model
** Comparison carried out by subtracting model evaluation statistics for the model listed in the
table from the text-based alternative model.
***The best threshold is defined at the negative and positive sentiment classification threshold
values that were associated with the largest significant improvement in overall model accuracy,
without significantly reducing the model F1 score values for any classification. With a possible
sentiment range of -1 to +1, the selected negative sentiment upper limit was -0.33. The
selected positive sentiment lower limit was 0.33.
Hashtags.
The hashtag-based model achieved consistent F1 scores across the three sentiment
classes. The F1 scores for negative (0.454), neutral (0.446), and positive (0.452) sentiments
were associated with a range of 0.008. Similarly, the calculated model accuracy value was 0.45.
The hashtag-based model consistently outperformed the non-hashtag model. When comparing
the non-hashtag model to the hashtag-based model the difference in F1 score was -0.20
(p<0.001). The same relationship was seen when comparing model performance with predicting
neutral (difference=-0.10, p=0.03) and positive sentiment (difference=-0.14, p<0.01) along with
overall model accuracy (difference=-0.16, p=0.01).
Systematic sentiment thresholds.
The quartile method of sentiment classification was associated with an upper limit for the
negative sentiment of -0.84 and a lower limit for the positive sentiment of 0.33. The systematic
sentiment threshold process included 84 iterations. The only iteration to meet the criteria for
consideration was a negative sentiment upper threshold of -0.33 and positive sentiment lower
threshold of 0.33 (Iteration 64 in Figure D.1). When compared to the quartile method of setting
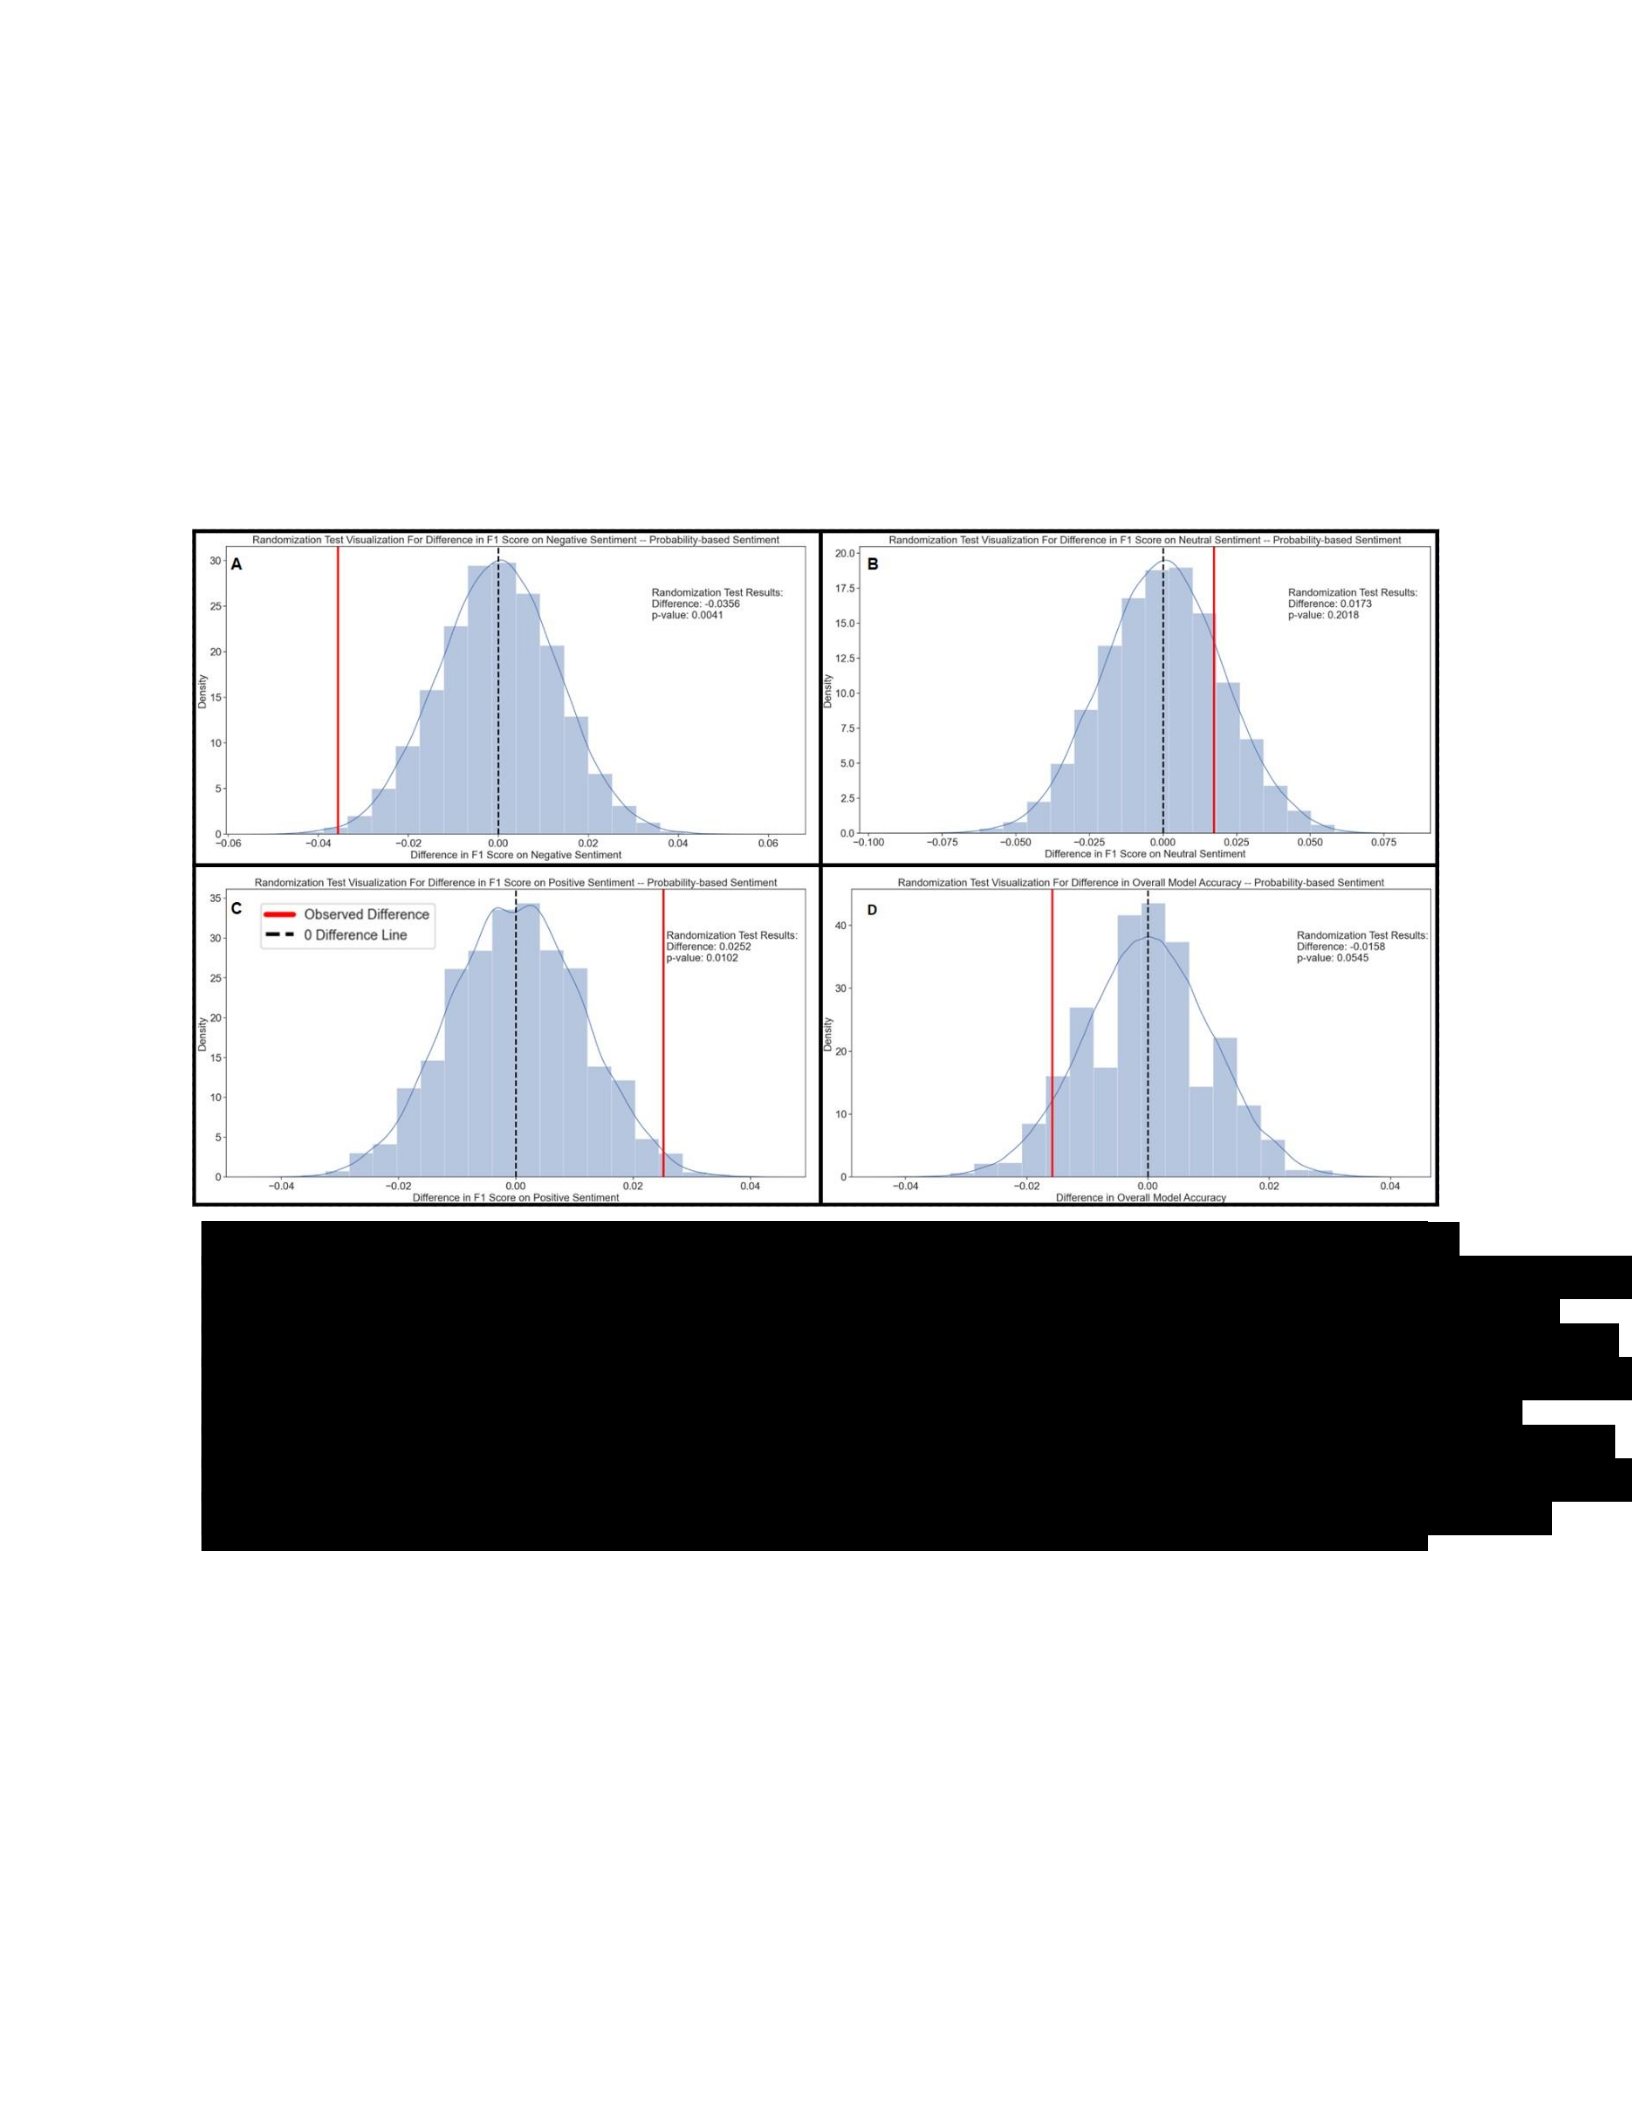
sentiment, iteration 64 was associated with improvements in the F1 score associated with
negative sentiment (difference=-0.02, p=0.03) and model accuracy (difference=-0.01, p=0.01).
When evaluating neutral (difference=0.003, p=0.34) and positive sentiment (difference=0.007,
p=0.26) there was no meaningful difference between the two methods of classifying tweets. See
figure 4.2 for a visualization of the approximate randomization test results associated with the
probability-based method for setting the sentiment classification thresholds
Probability-based sentiment thresholds.
As shown in Figure 4.3 panel A, the results of the approximate randomization test
showed that the probability-based method of setting the sentiment thresholds was associated
with a higher F1 score when predicting negative sentiment (difference= -0.04, p<0.01).
Figure
4.
2
. Visualization of the
probability distributions associated with the
approximate randomization test results comparing the quartile method to the
probability
-
based method for setting the sentiment classification thresholds
. The red
line indicates the observed difference between t
he model evaluation statistics associated with
the probability
-
based method subtracted from the statistics associated with the quartile
method.
Test results based on 10,000 randomization iterations.
Panel A: The randomization
test results for predicting ne
gative sentiment. Panel B: The randomization test results for
predicting neutral sentiment. Panel C: The randomization test results for predicting positive
sentiment. Panel D: The randomization test results for overall model accuracy.
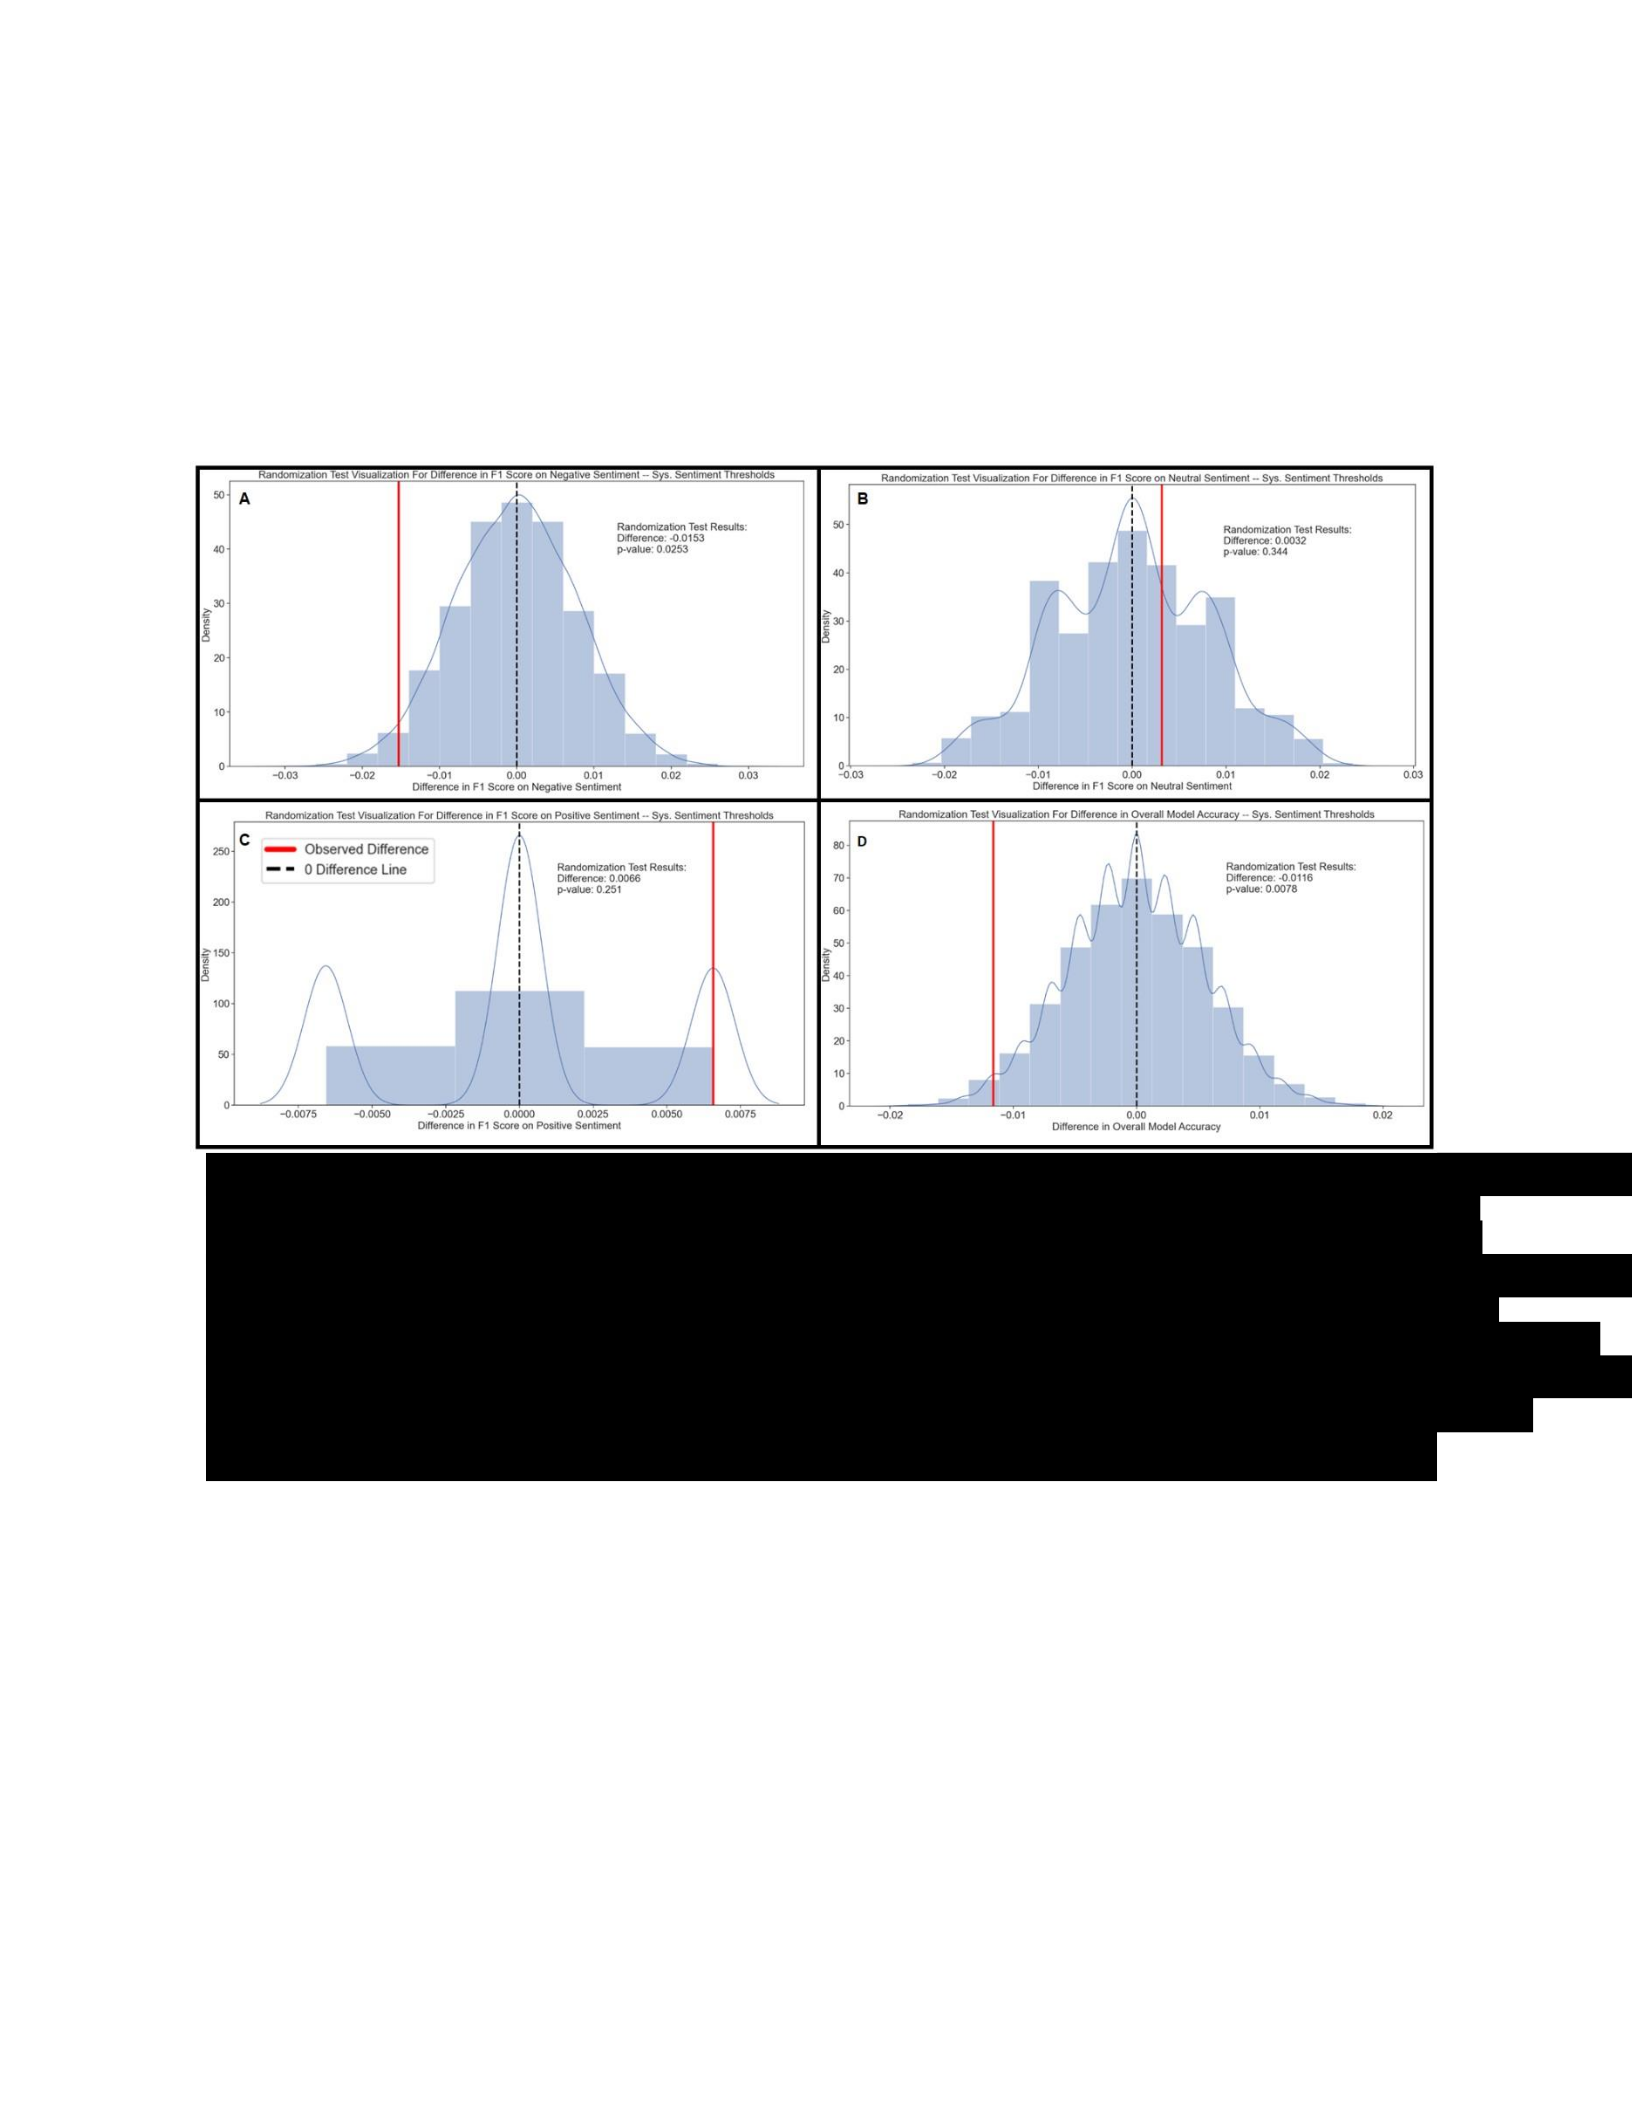
However, this probability-based method was also associated with a lower F1 score when
identifying tweets with a positive sentiment (difference= 0.03, p=0.01). No meaningful difference
was observed in the two methods when comparing their abilities to identify neutral sentiment
(difference= 0.02, p=0.20) or overall model accuracy (difference= 0.02, p=0.05).
Discussion
This study found the use of hashtag-based sentiments resulted in the greatest overall
improvement in model accuracy of all of the preprocessing steps that were evaluated. The
emoji-based estimates were not associated with improvements in overall model accuracy.
Nearly 34% of the tweets included in this study included hashtags. Whereas, only about 6% of
the tweets utilized emojis. Given that the use of hashtags seems to be more prevalent on Twitter
Figure
4.
3
.
Visualization of the probability distributions associated with the approximate
randomization test results comparing the quartile method to the syst
ematic (Sys.)
method for setting the sentiment classification thresholds
. The red line indicates the
observed difference between the model evaluation statistics associated with the systematic
method subtracted from the statistics associated with the quarti
le method.
Test results based
on 10,000 randomization iterations.
Panel A: The randomization test results for predicting
negative sentiment. Panel B: The randomization test results for predicting neutral sentiment.
Panel C: The randomization test results f
or predicting positive sentiment. Panel D: The
randomization test results for overall model accuracy.

along with the large overall increase in model accuracy (+0.13) associated with the hashtag-
based model, including hashtags as text in sentiment analysis appears to be the most beneficial
preprocessing step evaluated in this study.
The probability-based method of setting the sentiment classification did not improve
model predictions over the quartile method. There was borderline significance in the increase in
overall model accuracy associated with the probability-based method (p=0.05). However, this
method was also associated with a significant reduction of the F1 score in classifying positive
sentiments (p=0.01). Finally, the systematically identified sentiment thresholds of -0.33 and 0.33
were associated with a smaller absolute increase in model accuracy when compared to the
probability-based method (0.012 versus 0.016). However, these values were not associated with
the negative impact on the model accuracy associated with positive sentiment classifications
seen in the probability-based method. These findings indicate that in the current context,
systematically identified sentiment thresholds of -0.33 and 0.33 are preferred.
Identifying the emotional intent of emojis can be a challenging endeavor, in certain
cases. The identification and proper classification of sarcasm and irony is a persistent challenge
for sentiment research (Pang & Lee, 2008; Zimbra, Abbasi, Zeng, & Chen, 2018). In contrast to
text, which can include sarcasm and jokes, emojis are thought to provide an unambiguous
expression of the writer's emotions (Z. Chen et al., 2021). However, this is not universally true.
For example, the emoji could imply a negative or positive emotion. To highlight this point, the
fire emoji appears in the real tweets two below:
Tweet one:
“8/3: #COVID19 is airborne & that changes everything!
Consumers can't be fired so if you see customers violating a store’s #mask
requirement, track down the manager.
Thank your essential workers for keeping us safe.
#Indivisible #DemCast”
Tweet two:
“@thehill Donald J. #Trump
#Republicans in Congress HAVE
FAILED

More than 293,350 Americans have DIED of #COVID19
NO GOOD DEAL on #COVID19 #Vaccine
NO $1,200 Stimulus Checks
NO HELP for #SmallBusiness
NO HELP for #Healthcare Workers”
In Tweet One the writer seems to indent to communicate a positive emotion and
camaraderie by using the emoji. In the second tweet, the writer is communicating negative
feelings toward the state of the COVID-19 response and the associated death toll by using the
emoji. The emoji-emotion repository assigns negative polarity to the emoji. However, the
examples above highlight the fact that context is important with words, and the same seems to
be true with emojis. It should be noted that the USE sentence embeddings used in this study
based on DAN neural networks do not capture syntactic relationships. As a result, is not able to
capture the relationships between words in a sentence (Iyyer et al., 2015). This is important
when attempting to capture a word's context. Future research should evaluate the relative effect
of emojis and hashtags while using context-aware models.
Conclusion
Overall, the findings of this study support the idea hashtags should and emojis can be
included when conducting NLP tasks. However, this study only compared sentiments based on
hashtags and emojis to sentiments based on text to see if the different methods were associated
with different levels of model accuracy and F1 scores. Future research should explore the effect
that the interaction between emojis, hashtag, and written text have on model accuracy. Finally,
the systematically derived sentiment thresholds of -0.33 and 0.33 warrant further evaluation to
determine if these values are generalizable to other sentiment analysis studies. It should be
determined if these values are generalizable to other research contexts. This is due to the fact
that recall and precision are often used to evaluate sentiment analysisbased LMs (He, Liu, Gao,
& Chen, 2020; Mishev, Gjorgjevikj, Vodenska, Chitkushev, & Trajanov, 2020; Pandian, 2021).
Recall and precision are synonymous with sensitivity and positive predictive value (PPV)

respectively. Sensitivity and PPV can be used to evaluate the predictive power of classifier
models or models based on binomial or multinomial distributions (Xie et al., 2019). However,
doing so relies on the selection of arbitrary classification cutoff values for predicted probabilities
(Pearce & Ferrier, 2000). For this reason, when evaluating classifier models metrics such as the
receiver operating characteristic (ROC) is considered more informative than sensitivity alone
(Agresti, 2018). As a result, -0.33 and 0.33 threshold values prove not to be generalizable this
could indicate the need for the development or selection of alternative methods for evaluating
sentiment analysis-based LMs. Additionally, it could be argued that utilizing a modified version of
ROC curve for three classes would be more appropriate for model evaluation than the F1 score
and accuracy statistic utilized in this study.
The use of special characters and symbols on Twitter is common (Keerthi Kumar &
Harish, 2018). Developing best practices on how to manage these characters while retaining as
much usable data as possible would likely facilitate efforts to increase the accuracy of PLM the
impact of preprocessing in the context of social media data is particularly important. Machine
learning (ML)-based methods are a powerful tool for conducting data analysis. However, these
methods have not been widely adopted in public health research. LM-based models alone are
highly applicable in epidemiologic, community health, maternal and child health, and any other
field that utilizes qualitative data. Increasing access to and the utilization of ML-based tools will
likely benefit the public health research field and subsequently, public health practice. The
preprocessing steps covered in this paper could be used in combination to improve PLM
accuracy, without finetuning. Having additional effective pre-processing steps that can improve
pre-trained models could increase access to these important tools.

Chapter Five: Conclusions and Recommendations
Aim 1 Conclusion
This dissertation aimed to describe the relationship between public health governance
structure and public sentiment and COVID-19 control measure effectiveness in the US. This
undertaking focused on addressing three primary aims. The first was to compare the effects that
state-level and county-level COVID-19 control measures had on disease transmission and
human mobility, by using generalized linear modeling. In this effort, the study found that
statelevel control measures were associated with a larger effect on the county-level R0 in
Florida. Compared state-level social distancing measures, county-level measures had little
impact on disease transmission. Supporting this conclusion was the fact that state-level social
distancing measures were also associated with a larger increase in the amount of time that
Florida residents spent at home. In terms of governance structure, these findings indicate that
decentralized public health responses may not be ideal when responding to complex public
health emergencies.
Aim 1 Future Direction
This study also found that the proportion of rural residents was an influential predictor of
changes in mobility patterns. As the proportion of rural residents in Florida counties increased,
the amount of time spent at home decreased. Future research is warranted to confirm and
further explore this phenomenon. Should this finding prove to be consistent, then this could
point toward important health equity-related concerns. If rural residents are less likely to stay
home due to socio-economic factors then identifying and addressing this barrier could be crucial
to the future success of future large-scale social distancing efforts. Additionally, more work is
needed to define and determine the optimal public health governance structure needed when
responding to large-scale public health emergencies. Despite the finding that state-level social

distancing measures had a larger impact on disease transmission and mobility, it is still unclear
if and when local social distancing measures can be effective.
Aim 2 Conclusion
The second goal of this study was to determine if there is a relationship between public
opinion and the state-level the stringency of COVID-19 control measures. However, the study
was unable to detect a meaningful relationship between median monthly sentiment and social
distancing measure stringency levels. This could have been caused by a number of factors.
First, while the methods used to identify tweets for the study were successful in targeting
COVID-19-related keywords, not all of the posts were about social distancing measures.
Additionally, the PLM used in the study did not achieve state-of-the-art levels of model accuracy.
This latter limitation is important as it likely introduced non-differential misclassification bias to
the study.
Aim 2 Future Direction
Researchers interested in utilizing PLM with social media data to explore COVID-19
related should be aware of and seek to address a number of limitations. First, the results of
PLMs should not be assumed accurate without model validation being conducted with the
downstream data set. Second, reliable and automated methods of identifying the subject of a
social media post are required. Keyword searching can be used for initial filtering. However,
more specific methods such as topic modeling or semantic role labeling should be evaluated for
their effectiveness in the context of social media-based COVID-19 LM research. Finally, more
research is needed to identify non-finetuning-based methods of improving sentiment analysis
model accuracy.
Aim 3 Conclusion
The final aim of this dissertation was to evaluate the effect that the inclusion of emojis,
the addition of hashtags, and modifying the threshold for classifying sentiment have on

sentiment analysis model accuracy. The purpose of this evaluation was to determine which of
preprocessing steps was most effective at improving PLM accuracy. In this analysis, the
inclusion of hashtags as text proved to be the most effective method of increasing PLM model
accuracy. By systematically varying sentiment classification thresholds it was determined that a
negative sentiment upper limit of -0.33 and a positive sentiment lower limit of 0.33 were
associated with the highest levels of model accuracy. Finally, the study also found that the use
of emoji-based polarity values did not significantly improve model accuracy.
Aim 3 Future Direction
The inclusion of emojis and hashtags is common with Twitter data (Keerthi Kumar &
Harish, 2018). Within this study 6% of tweets contained emojis and 34% included hashtags.
Given the high prevalence of these elements and their efficacy in improving model accuracy,
establishing best practices for incorporating them into LMs is warranted. Future research should
also be conducted to evaluate the interaction between emojis and hashtags in LMs. Finally,
sentiment thresholds of -0.33 and 0.33 warrant further study. If these values are not
generalizable to other studies then this would point to a potential need for more informative
methods of evaluating sentiment analysis-based LMs. Despite the limitations of this study, a
number of important public health findings have been identified. Importantly, the findings
associated with each aim included in this paper have helped to highlight key avenues of future
research.
References
Abouk, R., & Heydari, B. (2021). The immediate effect of covid-19 policies on social-distancing
behavior in the united states. Public Health Reports, 136(2), 245-252.
doi:10.1177/0033354920976575
Adekunle, A., Meehan, M., Rojas‐Alvarez, D., Trauer, J., & McBryde, E. (2020). Delaying the
covid‐19 epidemic in australia: Evaluating the effectiveness of international travel bans.

Australian and New Zealand Journal of Public Health, 44(4), 257-259.
doi:10.1111/17536405.13016
Adhanom, T. (2020). Who director-general's opening remarks at the media briefing on covid-19
- 13 march 2020 [Press release]. Retrieved from
https://www.who.int/dg/speeches/detail/who-director-general-s-opening-remarks-at-
themission-briefing-on-covid-19---13-march-2020 Agresti, A. (2018). Building and applying
logistic
regression models. In An introduction to categorical data analysis (2 ed., pp. 137-172): John
Wiley & Sons.
Akanbi, M. O., Rivera, A. S., Akanbi, F. O., & Shoyinka, A. (2020). An ecologic study of
disparities in covid-19 incidence and case fatality in oakland county, mi, USA, during a
state-mandated shutdown. Journal of racial and ethnic health disparities.
doi:10.1007/s40615-020-00909-1
Albert, P. S. (1999). Longitudinal data analysis (repeated measures) in clinical trials. Statistics in
Medicine, 18(13), 1707-1732. doi:10.1002/(sici)1097-
0258(19990715)18:13<1707::Aidsim138>3.0.Co;2-h
Ammar, A., Chtourou, H., Boukhris, O., Trabelsi, K., Masmoudi, L., Brach, M., . . . Hoekelmann,
A. (2020). Covid-19 home confinement negatively impacts social participation and life
satisfaction: A worldwide multicenter study. Int J Environ Res Public Health, 17(17),
6237. doi:10.3390/ijerph17176237
Anderson, D., & Burnham, K. (2004). Summary. In D. Anderson & K. Burnham (Eds.), Model
selection and multimodel inference: A practial information-theoretic approach (pp.
437454). New York: Springer.
Angelopoulos, A. N., Pathak, R., Varma, R., & Jordan, M. I. (2020). On identifying and mitigating
bias in the estimation of the covid-19 case fatality rate. Harvard Data Science Review.
doi:10.1162/99608f92.f01ee285
Askitas, N., Tatsiramos, K., & Verheyden, B. (2021). Estimating worldwide effects of
nonpharmaceutical interventions on covid-19 incidence and population mobility patterns
using a multiple-event study. Sci Rep, 11(1). doi:10.1038/s41598-021-81442-x
Auger, K. A., Shah, S. S., Richardson, T., Hartley, D., Hall, M., Warniment, A., . . . Thomson, J.
E. (2020). Association between statewide school closure and covid-19 incidence and
mortality in the us. Journal of the American Medical Association, 324(9), 859.
doi:10.1001/jama.2020.14348
Bajema, K. L., Dahl, R. M., Prill, M. M., Meites, E., Rodriguez-Barradas, M. C., Marconi, V. C., . .
. Tao, Y. (2021). Effectiveness of covid-19 mrna vaccines against covid-19–associated
hospitalization — five veterans affairs medical centers, united states, february 1–august
6, 2021. MMWR Morb Mortal Wkly Rep, 70(37), 1294-1299.
doi:10.15585/mmwr.mm7037e3
Banda, J. M., Tekumalla, R., Wang, G., Yu, J., Liu, T., Ding, Y., . . . Chowell, G. (2021). A
largescale covid-19 twitter chatter dataset for open scientific research—an international
collaboration. Epidemiologia, 2(3), 315--324. doi:10.3390/epidemiologia2030024
Barberia, L. G., Cantarelli, L. G. R., Oliveira, M. L. C. D. F., Moreira, N. D. P., & Rosa, I. S. C.
(2021). The effect of state-level social distancing policy stringency on mobility in the
states of brazil. Revista de Administração Pública, 55(1), 27-49.
doi:10.1590/0034761220200549

Bartholomew, L. K., Parcel, G. S., Kok, G., Gottlieb, N., & Fernandez, M. (2006). Planning
health promotion programs: An intervention mapping approach.
Bates, M. (1995). Models of natural language understanding. Proceedings of the National
Academy of Sciences, 92(22), 9977-9982.
Bergman, A., Sella, Y., Agre, P., Casadevall, A., & Rawls, J. F. (2020). Oscillations in u.S.
Covid-19 incidence and mortality data reflect diagnostic and reporting factors.
mSystems, 5(4), e00544-00520. doi:doi:10.1128/mSystems.00544-20
Betsch, C., Böhm, R., Korn, L., & Holtmann, C. (2017). On the benefits of explaining herd
immunity in vaccine advocacy. Nature Human Behaviour, 1(3), 0056.
doi:10.1038/s41562-017-0056
Bielecki, M., Züst, R., Siegrist, D., Meyerhofer, D., Crameri, G. A. G., Stanga, Z., . . . Deuel, J.
W. (2021). Social distancing alters the clinical course of covid-19 in young adults: A
comparative cohort study. Clinical Infectious Diseases, 72(4), 598-603.
doi:10.1093/cid/ciaa889
Bisanzio, D., Kraemer, M. U. G., Brewer, T., Brownstein, J. S., & Reithinger, R. (2020).
Geolocated twitter social media data to describe the geographic spread of sars-cov-2. J
Travel Med, 27(5). doi:10.1093/jtm/taaa120
Blackwood, J. C., Malakhov, M. M., Duan, J., Pellett, J. J., Phadke, I. S., Lenhart, S., . . . Shea,
K. (2021). Governance structure affects transboundary disease management under
alternative objectives. BMC public health, 21(1). doi:10.1186/s12889-021-11797-3
Boomsma, A., & Hoogland, J. (2001). The robustness of lisrel modeling revisited. In r. Cudeck,
s. Du toit & d. Sörbom (eds.), structural equation modeling: Present and future. A
festschrift in honor of karl jöreskog [preliminary version with references].
Bou-Karroum, L., Khabsa, J., Jabbour, M., Hilal, N., Haidar, Z., Khalil, P. A., . . . El Bcheraoui, C.
(2021). Public health effects of travel-related policies on the covid-19 pandemic: A
mixed-methods systematic review. Journal of Infection, 83(4), 413-423.
doi:10.1016/j.jinf.2021.07.017
Bring, J. (1994). How to standardize regression coefficients. The American Statistician, 48(3),
209. doi:10.2307/2684719
Broniatowski, D. A., Jamison, A. M., Qi, S., Alkulaib, L., Chen, T., Benton, A., . . . Dredze, M.
(2018). Weaponized health communication: Twitter bots and russian trolls amplify the vaccine
debate. Am J Public Health, 108(10), 1378-1384. doi:10.2105/ajph.2018.304567 Bureau of
Labor Statistics. (2021). Bls data finder 1.1. Retrieved from:
https://beta.bls.gov/dataQuery/search
Byrne, B. M., & Crombie, G. (2003). Modeling and testing change: An introduction to the latent
growth curve model. Understanding Statistics, 2(3), 177-203.
Camacho-Collados, J., & Mohammad. (2018). On the role of text preprocessing in neural
network architectures: An evaluation study on text categorization and sentiment analysis.
arXiv pre-print server. doi:arxiv:1707.01780
Campbell, A. (2004). The sars commission interim report: Sars and public health in ontario -
executive summary. Biosecurity and Bioterrorism-Biodefense Strategy Practice and
Science, 2(2), 118-126. doi:10.1089/153871304323146423
Carlucci, L., D'Ambrosio, I., & Balsamo, M. (2020). Demographic and attitudinal factors of
adherence to quarantine guidelines during covid-19: The italian model. Frontiers in
Psychology, 11, 13. doi:10.3389/fpsyg.2020.559288
Carroll, C., Patterson, M., Wood, S., Booth, A., Rick, J., & Balain, S. (2007). A conceptual
framework for implementation fidelity. Implementation Science, 2(1), 40.
doi:10.1186/1748-5908-2-40

Caruana, E. J., Roman, M., Hernández-Sánchez, J., & Solli, P. (2015). Longitudinal studies.
Journal of thoracic disease, 7(11), E537-E540. doi:10.3978/j.issn.2072-1439.2015.10.63
Casares, M., & Khan, H. (2020). The timing and intensity of social distancing to flatten the
covid19 curve: The case of spain. Int J Environ Res Public Health, 17(19), 7283.
doi:10.3390/ijerph17197283
CDC. (2020). Coronavirus disease 2019 (covid-19). Recommendation for cloth face covers. In.
CDC. (2021a). How to protect yourself & others. Retrieved from
https://www.cdc.gov/coronavirus/2019-ncov/prevent-getting-sick/prevention.html
CDC. (2021b). People with certain medical conditions. Retrieved from
https://www.cdc.gov/coronavirus/2019-ncov/need-extra-precautions/people-withmedical-
conditions.html
Cer, D., Yang, Y., Kong, S.-y., Hua, N., Limtiaco, N., John, R. S., . . . Tar, C. (2018). Universal
sentence encoder. arXiv preprint arXiv:1803.11175.
Chacreton, D., Reina Ortiz, M., Hoare, I., Le, N. K., & Izurieta, R. (2021). Evaluating the effect of
national-level social distancing on the onset of peak sars-cov-2 daily case incidence
Paper presented at the America Public Health Association Annual Expo, Denver,
Colorado.
Chakraborty, K., Bhatia, S., Bhattacharyya, S., Platos, J., Bag, R., & Hassanien, A. E. (2020).
Sentiment analysis of covid-19 tweets by deep learning classifiers-a study to show how
popularity is affecting accuracy in social media. Appl Soft Comput, 97, 106754.
doi:10.1016/j.asoc.2020.106754
Chang, S. L., Harding, N., Zachreson, C., Cliff, O. M., & Prokopenko, M. (2020). Modelling
transmission and control of the covid-19 pandemic in australia. Nature communications,
11(1). doi:10.1038/s41467-020-19393-6
Chen, R. S., & Dunlap, W. P. (1993). Sas procedures for approximate randomization tests.
Behavior Research Methods, Instruments, & Computers, 25(3), 406-409.
doi:10.3758/bf03204532
Chen, Z., Cao, Y., Yao, H., Lu, X., Peng, X., Mei, H., & Liu, X. (2021). Emoji-powered sentiment
and emotion detection from software developers’ communication data. ACM
Transactions on Software Engineering and Methodology, 30(2), 1-48.
doi:10.1145/3424308
Chinazzi, M., Davis, J. T., Ajelli, M., Gioannini, C., Litvinova, M., Merler, S., . . . Vespignani, A.
(2020). The effect of travel restrictions on the spread of the 2019 novel coronavirus
(covid-19) outbreak. Science, 368(6489), 395-+. doi:10.1126/science.aba9757
Chokshi, A., Dallapiazza, M., Zhang, W. W., & Sifri, Z. (2021). Proximity to international airports
and early transmission of covid-19 in the united states—an epidemiological assessment
of the geographic distribution of 490,000 cases. Travel Medicine and Infectious Disease,
40, 102004. doi:10.1016/j.tmaid.2021.102004
Chopra, S., & Bangalore, S. (2011, 2011). Non-linear tagging models with localist and distributed
word representations.
Chowdhury, G. G. (2005). Natural language processing. Annual Review of Information Science
and Technology, 37(1), 51-89. doi:10.1002/aris.1440370103
Clark, E., & Araki, K. (2011). Text normalization in social media: Progress, problems and
applications for a pre-processing system of casual english. Procedia - Social and
Behavioral Sciences, 27, 2-11. doi:https://doi.org/10.1016/j.sbspro.2011.10.577
Clark, E., Roberts, T., & Araki, K. (2010). Towards a pre-processing system for casual english
annotated with linguistic and cultural information. Paper presented at the Proceedings of
the Fifth IASTED International Conference.

Courtemanche, C., Garuccio, J., Le, A., Pinkston, J., & Yelowitz, A. (2020). Strong social
distancing measures in the united states reduced the covid-19 growth rate: Study
evaluates the impact of social distancing measures on the growth rate of confirmed
covid-19 cases across the united states. Health Affairs, 39(7), 1237-1246.
CTP. (2021). National data: State data. Retrieved 2/21/2021, from The atlantic
https://covidtracking.com/data/download
Curran, P. J. (2003). Have multilevel models been structural equation models all along?
Multivariate Behavioral Research, 38(4), 529-569.
Cutler, D. M., & Summers, L. H. (2020). The covid-19 pandemic and the $16 trillion virus.
Journal of the American Medical Association, 324(15), 1495.
doi:10.1001/jama.2020.19759
Czeisler, M. É., Tynan, M. A., Howard, M. E., Honeycutt, S., Fulmer, E. B., Kidder, D. P., . . .
Czeisler, C. A. (2020). Public attitudes, behaviors, and beliefs related to covid-19, stayat-
home orders, nonessential business closures, and public health guidance — united
states, new york city, and los angeles, may 5–12, 2020. MMWR Morb Mortal Wkly Rep,
69(24), 751-758. doi:10.15585/mmwr.mm6924e1
Delamater, P. L., Street, E. J., Leslie, T. F., Yang, Y. T., & Jacobsen, K. H. (2019). Complexity of
the basic reproduction number (r(0)). Emerg Infect Dis, 25(1), 1-4.
doi:10.3201/eid2501.171901
Desantis, R. (2020). Executive order 20-244: Phase 3; right to work; business certainty;
suspension of fines. Retrieved from
https://www.flgov.com/wpcontent/uploads/orders/2020/EO_20-244.pdf.
Devlin, J., Chang, M.-W., Lee, K., & Toutanova, K. (2018). Bert: Pre-training of deep bidirectional
transformers for language understanding. arXiv preprint arXiv:1810.04805.
Dewi, A., Nurmandi, A., Rochmawati, E., Purnomo, E. P., Dimas Rizqi, M., Azzahra, A., . . . Tri
Kusuma Dewi, D. (2020). Global policy responses to the covid-19 pandemic:
Proportionate adaptation and policy experimentation: A study of country policy response
variation to the covid-19 pandemic. Health Promotion Perspectives, 10(4), 359-365.
doi:10.34172/hpp.2020.54
Di Gennaro, G., Buonanno, A., Di Girolamo, A., Ospedale, A., Palmieri, F. A. N., & Fedele, G.
(2021). An analysis of word2vec for the italian language. In (pp. 137-146): Springer
Singapore.
Dusenbury, L. (2003). A review of research on fidelity of implementation: Implications for drug
abuse prevention in school settings. Health Education Research, 18(2), 237-256.
doi:10.1093/her/18.2.237
Edunov, S., Baevski, A., & Auli, M. (2019). Pre-trained language model representations for
language generation. arXiv preprint arXiv:1903.09722.
Elazar, Y., Kassner, N., Ravfogel, S., Ravichander, A., Hovy, E., Schütze, H., & Goldberg, Y.
(2021). Measuring and improving consistency in pretrained language models.
Transactions of the Association for Computational Linguistics, 9, 1012-1031.
Evans, S. J. W., & Jewell, N. P. (2021). Vaccine effectiveness studies in the field. New England
Journal of Medicine, 385(7), 650-651. doi:10.1056/nejme2110605
FDOH. (2021). Florida department of health open data.
https://openfdoh.hub.arcgis.com/search?collection=Dataset
Fenlon, J., Cormier, K., & Schembri, A. (2015). Building bsl signbank: The lemma dilemma
revisited. International Journal of Lexicography, 28(2), 169-206. doi:10.1093/ijl/ecv008
Fidler, D. P. (2001). Legal issues surrounding public health emergencies. Public Health Reports,
116, 79-86. doi:10.1016/s0033-3549(04)50148-6

Firth, J. R. (1957). A synopsis of linguistic theory, 1930-1955. In B. Dodd (Ed.), Selected papers
of j. R. Firth 1952-59 (pp. 1-39). Birmingham: University of Birmingham Press.
Fischer, C. B., Adrien, N., Silguero, J. J., Hopper, J. J., Chowdhury, A. I., & Werler, M. M. (2021).
Mask adherence and rate of covid-19 across the united states. PLoS One, 16(4),
e0249891. doi:10.1371/journal.pone.0249891
Fisher, K. A., Barile, J. P., Guerin, R. J., Vanden Esschert, K. L., Jeffers, A., Tian, L. H., . . . Prue,
C. E. (2020). Factors associated with cloth face covering use among adults during the
covid-19 pandemic — united states, april and may 2020. MMWR Morb Mortal Wkly
Rep, 69(28), 933-937. doi:10.15585/mmwr.mm6928e3
Fisher, M. (1997). Decline in the juniper woodlands of raydah reserve in southwestern saudi
arabia: A response to climate changes? Global Ecology and Biogeography Letters,
379386.
Fitzmaurice, G. M., Laird, N. M., & Ware, J. H. (2012). Applied longitudinal analysis (2 ed. Vol.
998): John Wiley & Sons.
Fitzmaurice, G. M., & Ravichandran, C. (2008). A primer in longitudinal data analysis.
Circulation, 118(19), 2005-2010. doi:10.1161/circulationaha.107.714618
Fukumoto, K., McClean, C. T., & Nakagawa, K. (2021). No causal effect of school closures in
japan on the spread of covid-19 in spring 2020. Nature Medicine, 27(12), 2111-2119.
doi:10.1038/s41591-021-01571-8
Gao, S., Rao, J., Kang, Y., Liang, Y., & Kruse, J. (2020). Mapping county-level mobility pattern
changes in the united states in response to covid-19. SIGSpatial Special, 12(1), 16-26.
Gao, S., Rao, J., Kang, Y., Liang, Y., Kruse, J., Dopfer, D., . . . Patz, J. A. (2020). Association of
mobile phone location data indications of travel and stay-at-home mandates with covid19
infection rates in the us. JAMA Network Open, 3(9), e2020485.
doi:10.1001/jamanetworkopen.2020.20485
Gao, T., Fisch, A., & Chen, D. (2020). Making pre-trained language models better few-shot
learners. arXiv preprint arXiv:2012.15723.
Garcia, K., & Berton, L. (2021). Topic detection and sentiment analysis in twitter content related
to covid-19 from brazil and the USA. Appl Soft Comput, 101, 107057.
doi:10.1016/j.asoc.2020.107057
Glaesser, D., Kester, J., Paulose, H., Alizadeh, A., & Valentin, B. (2017). Global travel patterns:
An overview. Journal of travel medicine, 24(4). doi:10.1093/jtm/tax007
Glanz, K., Rimer, B. K., & Viswanath, K. (2008). Health behavior and health education: Theory,
research, and practice: John Wiley & Sons.
Glaziev, S. Y., & Kaniovski, Y. M. (1991). Diffusion of innovations under conditions of uncertainty:
A stochastic approach. In Diffusion of technologies and social behavior (pp. 231-246):
Springer.
Golden, S. D., McLeroy, K. R., Green, L. W., Earp, J. A. L., & Lieberman, L. D. (2015).
Upending the social ecological model to guide health promotion efforts toward policy and
environmental change. Health Education & Behavior, 42(1_suppl), 8S-14S.
doi:10.1177/1090198115575098
Goldewijk, K. K. (2005). Three centuries of global population growth: A spatial referenced
population (density) database for 1700?2000. Population and Environment, 26(4),
343367. doi:10.1007/s11111-005-3346-7
Goldstein, H., & McDonald, R. P. (1988). A general model for the analysis of multilevel data.
Psychometrika, 53(4), 455-467.
Goldstein, N. D., & Burstyn, I. (2020). On the importance of early testing even when imperfect in
a pandemic such as covid-19. Global Epidemiology, 2, 100031.

doi:https://doi.org/10.1016/j.gloepi.2020.100031
Google. (2022). Community mobility reports. Retrieved from:
https://www.google.com/covid19/mobility/
Gore, J., Fray, L., Miller, A., Harris, J., & Taggart, W. (2021). The impact of covid-19 on student
learning in new south wales primary schools: An empirical study. The Australian
Educational Researcher, 48(4), 605-637. doi:10.1007/s13384-021-00436-w
Grace, J. B., & Irvine, K. M. (2020). Scientist’s guide to developing explanatory statistical models
using causal analysis principles. Ecology, 101(4). doi:10.1002/ecy.2962
Graham, S., Weingart, S., & Milligan, I. (2012). Getting started with topic modeling and mallet.
Retrieved from http://hdl.handle.net/10012/11751
Guerstein, S., Romeo-Aznar, V., Dekel, M. A., Miron, O., Davidovitch, N., Puzis, R., & Pilosof, S.
(2021). The interplay between vaccination and social distancing strategies affects
covid19 population-level outcomes. PLoS Comput Biol, 17(8), e1009319.
doi:10.1371/journal.pcbi.1009319
Habicht, J. P., Victora, C. G., & Vaughan, J. P. (1999). Evaluation designs for adequacy,
plausibility and probability of public health programme performance and impact. Int J
Epidemiol, 28(1), 10-18. doi:10.1093/ije/28.1.10
Hacohen-Kerner, Y., Miller, D., & Yigal, Y. (2020). The influence of preprocessing on text
classification using a bag-of-words representation. PLoS One, 15(5), e0232525.
doi:10.1371/journal.pone.0232525
Hale, T., Angrist, N., Goldszmidt, R., Kira, B., Petherick, A., Phillips, T., . . . Tatlow, H. (2021). A
global panel database of pandemic policies (oxford covid-19 government response
tracker). Retrieved from https://doi.org/10.1038/s41562-021-01079-8
Hale, T., Atav, T., Hallas, L., Kira, B., Phillips, T., Petherick, A., & Pott, A. (2020). Variation in us
states responses to covid-19. Blavatnik School of Government.
Hale, T., Petherick, A., Phillips, T., & Webster, S. (2020). Variation in government responses to
covid-19. Blavatnik school of government working paper, 31, 2020-2011.
Hallas, L., Hatibie, A., Majumdar, S., Pyarali, M., & Hale, T. (2020). Variation in us states’
responses to covid-19. Retrieved from
Hammerstein, S., Konig, C., Dreisorner, T., & Frey, A. (2021). Effects of covid-19-related school
closures on student achievement-a systematic review. Frontiers in Psychology, 12.
doi:10.3389/fpsyg.2021.746289
Hao, Z., Cai, R., Yang, Y., Wen, W., & Liang, L. (2017). A dynamic conditional random field
based framework for sentence-level sentiment analysis of chinese microblog.
Harrell, F. E. (2015). Overview of maximum likelihood estimation. In Regression modeling
strategies: With applications to linear models, logistic and ordinal regression, and survival
analysis (Vol. 3, pp. 205): Springer.
Hassan, A., Abbasi, A., & Zeng, D. (2013, 2013). Twitter sentiment analysis: A bootstrap
ensemble framework.
Hastie, T., Tibshirani, R., & Friedman, J. (2009). Random forests. In Springer series in statistics
(pp. 587-604): Springer New York.
Haverkamp, N., & Beauducel, A. (2017). Violation of the sphericity assumption and its effect on
type-i error rates in repeated measures anova and multi-level linear models (mlm).
Frontiers in Psychology, 8. doi:10.3389/fpsyg.2017.01841
Hayes, A. F. (1998). Spss procedures for approximate randomization tests. Behavior Research
Methods, Instruments, & Computers, 30(3), 536-543. doi:10.3758/bf03200687
He, P., Liu, X., Gao, J., & Chen, W. (2020). Deberta: Decoding-enhanced bert with disentangled
attention. arXiv preprint arXiv:2006.03654.

Heiden, M., & Hamouda, O. (2020). Schätzung der aktuellen entwicklung der sars-cov-
2epidemie in deutschland–nowcasting. Epidemiological bulletin(17), 10-15.
doi:10.25646/6692
Hill, F., Reichart, R., & Korhonen, A. (2015). Simlex-999: Evaluating semantic models with
(genuine) similarity estimation. Computational Linguistics, 41(4), 665-695.
doi:10.1162/COLI_a_00237
Hong, L., & Davison, B. D. (2010, 2010). Empirical study of topic modeling in twitter.
Hossain, M. M., Tasnim, S., Sultana, A., Faizah, F., Mazumder, H., Zou, L., . . . Ma, P. (2020).
Epidemiology of mental health problems in covid-19: A review. F1000Research, 9, 636.
doi:10.12688/f1000research.24457.1
Hossain, M. P., Junus, A., Zhu, X. L., Jia, P. F., Wen, T. H., Pfeiffer, D., & Yuan, H. Y. (2020).
The effects of border control and quarantine measures on the spread of covid-19.
Epidemics, 32, 8. doi:10.1016/j.epidem.2020.100397
Howse, G. (2004). Managing emerging infectious diseases: Is a federal system an impediment
to effective laws? Australia and New Zealand Health Policy, 1(1).
Hox, J. (1998). Multilevel modeling: When and why. In Classification, data analysis, and data
highways (pp. 147-154): Springer.
Hurley, J., Birch, S., & Eyles, J. (1995). Geographically-decentralized planning and management
in health-care - some informational issues and their implications for efficiency. Social
Science & Medicine, 41(1), 3-11. doi:10.1016/0277-9536(94)00283-y
Hussien, W., Al-Ayyoub, M., Tashtoush, Y., & Al-Kabi, M. (2019). On the use of emojis to train
emotion classifiers. arXiv preprint arXiv:1902.08906.
Ioannidis, J. P. A., Axfors, C., & Contopoulos-Ioannidis, D. G. (2021). Second versus first wave
of covid-19 deaths: Shifts in age distribution and in nursing home fatalities.
Environmental Research, 195, 110856-110856. doi:10.1016/j.envres.2021.110856
Islam, N., Sharp, S. J., Chowell, G., Shabnam, S., Kawachi, I., Lacey, B., . . . White, M. (2020).
Physical distancing interventions and incidence of coronavirus disease 2019: Natural
experiment in 149 countries. Bmj-British Medical Journal, 370, 10.
doi:10.1136/bmj.m2743
Iyyer, M., Manjunatha, V., Boyd-Graber, J., & Daumé III, H. (2015). Deep unordered composition
rivals syntactic methods for text classification. Paper presented at the Proceedings of the
53rd annual meeting of the association for computational linguistics and the 7th
international joint conference on natural language processing (volume 1: Long papers).
Jacobsen, G. D., & Jacobsen, K. H. (2020). Statewide covid‐19 stay‐at‐home orders and
population mobility in the united states. World Medical & Health Policy, 12(4), 347-356.
doi:10.1002/wmh3.350
Jansen, S. (2017). Word and phrase translation with word2vec. arXiv preprint arXiv:1705.03127.
JHU. (2021). Covid-19 dashboard.
Jimenez-Mavillard, A., & Suarez, J. L. (2020). Diffusion of elbulli’s innovation: Rate of adoption
in allrecipes and epicurious. International Journal of Gastronomy and Food Science, 22,
100243. doi:https://doi.org/10.1016/j.ijgfs.2020.100243
Jones, K. S. (1972). A statistical interpretation of term specificity and its application in retrieval.
Journal of documentation.
JSL. (2020). Detect entities (bert). Retrieved from:
https://nlp.johnsnowlabs.com/2021/01/18/sentimentdl_use_twitter_en.html
JSL. (2021). Sentiment analysis of tweets (sentimentdl_use_twitter). Retrieved from:
https://nlp.johnsnowlabs.com/2021/01/18/sentimentdl_use_twitter_en.html
Jurafsky, D., & Martin, J. H. (2019). Speech and language processing. URL https://web.

stanford. edu/~ jurafsky/slp3.
Ka-Wai Hui, E. (2006). Reasons for the increase in emerging and re-emerging viral infectious
diseases. Microbes and Infection, 8(3), 905-916. doi:10.1016/j.micinf.2005.06.032
Kadris, S. S., Suns, J., Lawandis, A., Strichs, J. R., Buschs, L. M., Kellers, M., . . . Warner, S.
(2021). Association between caseload surge and covid-19 survival in 558 u.S. Hospitals,
march to august 2020. Ann Intern Med, 174(9), 1240-1251. doi:10.7326/m21-1213 %m
34224257
Kalyan, K. S., Rajasekharan, A., & Sangeetha, S. (2021). Ammus: A survey of transformerbased
pretrained models in natural language processing. arXiv preprint arXiv:2108.05542.
Kamiński, M., Szymańska, C., & Nowak, J. K. (2021). Whose tweets on covid-19 gain the most
attention: Celebrities, political, or scientific authorities? Cyberpsychol Behav Soc Netw,
24(2), 123-128. doi:10.1089/cyber.2020.0336
Kawchuk, G., Hartvigsen, J., Harsted, S., Nim, C. G., & Nyirö, L. (2020). Misinformation about
spinal manipulation and boosting immunity: An analysis of twitter activity during the
covid-19 crisis. Chiropr Man Therap, 28(1), 34. doi:10.1186/s12998-020-00319-4
Keerthi Kumar, H. M., & Harish, B. S. (2018). Classification of short text using various
preprocessing techniques: An empirical evaluation. In (pp. 19-30): Springer Singapore.
Keyes, K. M., Utz, R. L., Robinson, W., & Li, G. (2010). What is a cohort effect? Comparison of
three statistical methods for modeling cohort effects in obesity prevalence in the united
states, 1971–2006. Social Science & Medicine, 70(7), 1100-1108.
doi:10.1016/j.socscimed.2009.12.018
Khubchandani, J., Sharma, S., Price, J. H., Wiblishauser, M. J., Sharma, M., & Webb, F. J.
(2021). Covid-19 vaccination hesitancy in the united states: A rapid national assessment.
J Community Health, 1-8.
Knaus, W. A., Wagner, D. P., Draper, E. A., Zimmerman, J. E., Bergner, M., Bastos, P. G., . . .
et al. (1991). The apache iii prognostic system. Risk prediction of hospital mortality for
critically ill hospitalized adults. Chest, 100(6), 1619-1636. doi:10.1378/chest.100.6.1619
Koto, F., & Adriani, M. (2015). Hbe: Hashtag-based emotion lexicons for twitter sentiment
analysis. Paper presented at the Proceedings of the 7th Forum for Information Retrieval
Evaluation.
Kuhfeld, M., Soland, J., Tarasawa, B., Johnson, A., Ruzek, E., & Liu, J. (2020). Projecting the
potential impact of covid-19 school closures on academic achievement. Educational
Researcher, 49(8), 549-565. doi:10.3102/0013189x20965918
Kuhn, M., & Johnson, K. (2013). Applied predictive modeling (Vol. 26): Springer.
Kundrick, A., Huang, Z., Carran, S., Kagoli, M., Grais, R. F., Hurtado, N., & Ferrari, M. (2018).
Sub-national variation in measles vaccine coverage and outbreak risk: A case study from
a 2010 outbreak in malawi. BMC public health, 18(1). doi:10.1186/s12889-0185628-x
Lai, S., Liu, K., He, S., & Zhao, J. (2016). How to generate a good word embedding. IEEE
Intelligent Systems, 31(6), 5-14. doi:10.1109/mis.2016.45
Lampert, A. (2020). Decentralized governance may lead to higher infection levels and
suboptimal releases of quarantines amid the covid-19 pandemic. medRxiv.
Langille, J.-L. D., & Rodgers, W. M. (2010). Exploring the influence of a social ecological model
on school-based physical activity. Health Education & Behavior, 37(6), 879-894.
doi:10.1177/1090198110367877
Lavizzari, A., Klingenberg, C., Profit, J., Zupancic, J. A. F., Davis, A. S., Mosca, F., . . . Zangen,
S. (2021). International comparison of guidelines for managing neonates at the early
phase of the sars-cov-2 pandemic. Pediatric Research, 89(4), 940-951.
doi:10.1038/s41390-020-0976-5

Lee, J. (2020). Mental health effects of school closures during covid-19. The Lancet Child &
Adolescent Health, 4(6), 421. doi:10.1016/s2352-4642(20)30109-7
Leffler, C. T., Ing, E., Lykins, J. D., Hogan, M. C., McKeown, C. A., & Grzybowski, A. (2020).
Association of country-wide coronavirus mortality with demographics, testing, lockdowns,
and public wearing of masks. Am J Trop Med Hyg, 103(6), 2400-2411.
doi:10.4269/ajtmh.20-1015
Li, C., Chen, L. J., Chen, X., Zhang, M., Pang, C. P., & Chen, H. (2020). Retrospective analysis
of the possibility of predicting the covid-19 outbreak from internet searches and social
media data, china, 2020. Euro Surveill, 25(10). doi:10.2807/1560-
7917.Es.2020.25.10.2000199
Li, M., Liu, K., Song, Y., Wang, M., & Wu, J. (2021). Serial interval and generation interval for
imported and local infectors, respectively, estimated using reported contact-tracing data
of covid-19 in china. Front Public Health, 8, 577431-577431.
doi:10.3389/fpubh.2020.577431
Li, Q., Guan, X., Wu, P., Wang, X., Zhou, L., Tong, Y., . . . Wong, J. Y. (2020). Early transmission
dynamics in wuhan, china, of novel coronavirus–infected pneumonia. New England
Journal of Medicine.
Li, W., Yin, Y., Quan, X., & Zhang, H. (2019). Gene expression value prediction based on
xgboost algorithm. Frontiers in genetics, 10, 1077.
Li, X., Li, C., Chi, J., & Ouyang, J. (2018). Short text topic modeling by exploring original
documents. Knowledge and Information Systems, 56(2), 443-462.
doi:10.1007/s10115017-1099-0
Liddy, E. D. (2001). Natural language processing. In 2nd (Ed.), Encyclopedia of library and
information science. New York, New York: Marcel Decker, Inc.
Liebig, J., Najeebullah, K., Jurdak, R., Shoghri, A. E., & Paini, D. (2021). Should international
borders re-open? The impact of travel restrictions on covid-19 importation risk. BMC
public health, 21(1). doi:10.1186/s12889-021-11616-9
Ling, W., Dyer, C., Black, A. W., & Trancoso, I. (2015). Two/too simple adaptations of word2vec
for syntax problems. Paper presented at the Proceedings of the 2015 Conference of the
North American Chapter of the Association for Computational Linguistics: Human
Language Technologies.
Little, C., Alsen, M., Barlow, J., Naymagon, L., Tremblay, D., Genden, E., . . . Van Gerwen, M.
(2021). The impact of socioeconomic status on the clinical outcomes of covid-19; a
retrospective cohort study. J Community Health. doi:10.1007/s10900-020-00944-3
Liu, Y., Morgenstern, C., Kelly, J., Lowe, R., & Jit, M. (2021). The impact of non-pharmaceutical
interventions on sars-cov-2 transmission across 130 countries and territories. BMC Med,
19(1). doi:10.1186/s12916-020-01872-8
Lu, T.-Y., Poon, W.-Y., & Tsang, Y.-F. (2011). Latent growth curve modeling for longitudinal
ordinal responses with applications. Computational Statistics & Data Analysis, 55(3),
1488-1497. doi:https://doi.org/10.1016/j.csda.2010.10.014
Lu, Z., Sim, J.-A., Wang, J. X., Forrest, C. B., Krull, K. R., Srivastava, D., . . . Huang, I. C.
(2021). Natural language processing and machine learning methods to characterize
unstructured patient-reported outcomes: Validation study. J Med Internet Res, 23(11),
e26777. doi:10.2196/26777
Lyu, J. C., Han, E. L., & Luli, G. K. (2021). Covid-19 vaccine–related discussion on twitter: Topic
modeling and sentiment analysis. J Med Internet Res, 23(6), e24435. doi:10.2196/24435
Lyu, W., & Wehby, G. L. (2020). Community use of face masks and covid-19: Evidence from a
natural experiment of state mandates in the us. Health Affairs, 39(8), 1419-1425.
doi:10.1377/hlthaff.2020.00818

Magiorkinis, G., Angelis, K., Mamais, I., Katzourakis, A., Hatzakis, A., Albert, J., . . . Program, S.
(2016). The global spread of hiv-1 subtype b epidemic. Infection Genetics and Evolution,
46, 169-179. doi:10.1016/j.meegid.2016.05.041
Mair, C., Kadoda, G., Lefley, M., Phalp, K., Schofield, C., Shepperd, M., & Webster, S. (2000).
An investigation of machine learning based prediction systems. Journal of systems and
software, 53(1), 23-29.
Martínez-Cámara, E., Martín-Valdivia, M. T., Ureña-López, L. A., & Montejo-Ráez, A. R. (2014).
Sentiment analysis in twitter. Natural Language Engineering, 20(1), 1-28.
doi:10.1017/s1351324912000332
Mascha, E. J., & Sessler, D. I. (2011). Equivalence and noninferiority testing in regression
models and repeated-measures designs. Anesthesia & Analgesia, 112(3).
Massaad, E., & Cherfan, P. (2020). Social media data analytics on telehealth during the covid-
19 pandemic. Cureus, 12(4), e7838. doi:10.7759/cureus.7838
Mathew, L., & Bindu, V. (2020). A review of natural language processing techniques for
sentiment analysis using pre-trained models. Paper presented at the 2020 Fourth
International Conference on Computing Methodologies and Communication (ICCMC).
Matrajt, L., & Leung, T. (2020). Evaluating the effectiveness of social distancing interventions to
delay or flatten the epidemic curve of coronavirus disease. Emerg Infect Dis, 26(8),
1740-1748. doi:10.3201/eid2608.201093
Mauchly, J. W. (1940). Significance test for sphericity of a normal n-variate distribution. The
Annals of mathematical statistics, 11(2), 204-209. doi:10.2307/2235878
Medhat, W., Hassan, A., & Korashy, H. (2014). Sentiment analysis algorithms and applications:
A survey. Ain Shams Engineering Journal, 5(4), 1093-1113.
doi:10.1016/j.asej.2014.04.011
Medline, A., Hayes, L., Valdez, K., Hayashi, A., Vahedi, F., Capell, W., . . . Klausner, J. D. (2020).
Evaluating the impact of stay-at-home orders on the time to reach the peak burden of
covid-19 cases and deaths: Does timing matter? BMC public health, 20(1).
doi:10.1186/s12889-020-09817-9
Méndez, J. R., Iglesias, E. L., Fdez-Riverola, F., Díaz, F., & Corchado, J. M. (2006). Tokenising,
stemming and stopword removal on anti-spam filtering domain. In (pp. 449-458):
Springer Berlin Heidelberg.
Merchant, A., Rahimtoroghi, E., Pavlick, E., & Tenney, I. (2020). What happens to bert
embeddings during fine-tuning? arXiv preprint arXiv:2004.14448.
Mikolov, T., Chen, K., Corrado, G., & Dean, J. (2013). Efficient estimation of word
representations in vector space. arXiv preprint arXiv:1301.3781.
Mikolov, T., Sutskever, I., Chen, K., Corrado, G. S., & Dean, J. (2013). Distributed
representations of words and phrases and their compositionality. Paper presented at the
Advances in neural information processing systems.
Millett, G. A., Jones, A. T., Benkeser, D., Baral, S., Mercer, L., Beyrer, C., . . . Sullivan, P. S.
(2020). Assessing differential impacts of covid-19 on black communities. Ann Epidemiol,
47, 37-44. doi:10.1016/j.annepidem.2020.05.003
Mishev, K., Gjorgjevikj, A., Vodenska, I., Chitkushev, L. T., & Trajanov, D. (2020). Evaluation of
sentiment analysis in finance: From lexicons to transformers. IEEE Access, 8,
131662131682.
Mollalo, A., Vahedi, B., & Rivera, K. M. (2020). Gis-based spatial modeling of covid-19 incidence
rate in the continental united states. Science of the Total Environment, 728, 138884.
doi:10.1016/j.scitotenv.2020.138884
Morgenstern, H. (1995). Ecologic studies in epidemiology: Concepts, principles, and methods.
Annu Rev Public Health, 16(1), 61-81.

Mosbach, M., Andriushchenko, M., & Klakow, D. (2020). On the stability of fine-tuning bert:
Misconceptions, explanations, and strong baselines. arXiv preprint arXiv:2006.04884.
Mullen, L., Potter, C., Gostin, L. O., Cicero, A., & Nuzzo, J. B. (2020). An analysis of
international health regulations emergency committees and public health emergency of
international concern designations. BMJ Global Health, 5(6), e002502.
doi:10.1136/bmjgh-2020-002502
Nally, R. M. (2000). Regression and model-building in conservation biology, biogeography and
ecology: The distinction between–and reconciliation of–‘predictive’and
‘explanatory’models. Biodiversity & Conservation, 9(5), 655-671.
Naylor-Wardle, J., Rowland, B., & Kunadian, V. (2021). Socioeconomic status and
cardiovascular health in the covid-19 pandemic. Heart.
Neter, J., Wasserman, W., & Kutner, M. H. (2004). Applied linear regression models (4 ed.):
McGraw-Hill Education.
Neuwirth, C., Gruber, C., & Murphy, T. (2020). Investigating duration and intensity of covid-19
social-distancing strategies. Sci Rep, 10(1). doi:10.1038/s41598-020-76392-9
Newman, M. E. (2002). Spread of epidemic disease on networks. Phys Rev E Stat Nonlin Soft
Matter Phys, 66(1 Pt 2), 016128. doi:10.1103/PhysRevE.66.016128
NLTK. (2022). Nltk.Stem.Wordnet module. Retrieved from
https://www.nltk.org/api/nltk.stem.wordnet.html?highlight=lemmatize#nltk.stem.wordnet.
WordNetLemmatizer
Noreen, E. W. (1989). Computer-intensive methods for testing hypotheses : An introduction.
New York: Wiley.
Nozaki, K., Hochin, T., & Nomiya, H. (2019, 2019). Semantic schema matching for string
attribute with word vectors.
Oaks, S. C., Shope, R. E., & Lederberg, J. (1992). Emerging infections: Microbial threats to
health in the united states. Washington, DC, USA: National Academies Press.
Organization, W. H. (2019). Who mers global summary and assessment of risk, july 2019.
Retrieved from
Ozer, M., Suna, H. E., Celik, Z., & Askar, P. (2020). The impact covid-19 school closures on
educational inequalities. Insan & Toplum-the Journal of Humanity & Society, 10(4),
217246. doi:10.12658/m0611
Ozili, P. K., & Arun, T. (2020). Spillover of covid-19: Impact on the global economy. Available at
SSRN 3562570.
Page, B. I., & Shapiro, R. Y. (1983). Effects of public opinion on policy. American political
science review, 77(1), 175-190.
Pan, W., Miyazaki, Y., Tsumura, H., Miyazaki, E., & Yang, W. (2020). Identification of countylevel
health factors associated with covid-19 mortality in the united states. J Biomed Res,
34(6), 437-445. doi:10.7555/jbr.34.20200129
Pandian, A. P. (2021). Performance evaluation and comparison using deep learning techniques
in sentiment analysis. Journal of Soft Computing Paradigm (JSCP), 3(02), 123-134.
Pang, B., & Lee, L. (2008). Opinion mining and sentiment analysis. Foundations and trends in
information retrieval, 2(1-2), 1-135.
Parmet, W. E. (2002). After september 11: Rethinking public health federalism. Journal of Law
Medicine & Ethics, 30(2), 201-+. doi:10.1111/j.1748-720X.2002.tb00387.x
Pearce, J., & Ferrier, S. (2000). Evaluating the predictive performance of habitat models
developed using logistic regression. Ecological modelling, 133(3), 225-245.

Peng, H., & Bai, X. (2018). Artificial neural network–based machine learning approach to
improve orbit prediction accuracy. Journal of Spacecraft and Rockets, 55(5), 1248-1260.
Pérez, D., Van Der Stuyft, P., Zabala, M. D. C., Castro, M., & Lefèvre, P. (2015). A modified
theoretical framework to assess implementation fidelity of adaptive public health
interventions. Implementation Science, 11(1). doi:10.1186/s13012-016-0457-8
Petroni, F., Rocktäschel, T., Lewis, P., Bakhtin, A., Wu, Y., Miller, A. H., & Riedel, S. (2019).
Language models as knowledge bases? arXiv preprint arXiv:1909.01066.
Pilecco, F. B., Coelho, C. G., Fernandes, Q. H. R. F., Silveira, I. H., Pescarini, J. M., Ortelan, N.,
. . . Barreto, M. L. (2021). The effect of laboratory testing on covid-19 monitoring
indicators: An analysis of the 50 countries with the highest number of cases.
Epidemiologia e Serviços de Saúde, 30(2). doi:10.1590/s1679-49742021000200002
Polack, F. P., Thomas, S. J., Kitchin, N., Absalon, J., Gurtman, A., Lockhart, S., . . . Gruber, W.
C. (2020). Safety and efficacy of the bnt162b2 mrna covid-19 vaccine. New England
Journal of Medicine, 383(27), 2603-2615. doi:10.1056/nejmoa2034577
Pomikalek, J., & Rehurek, R. (2007). The influence of preprocessing parameters on text
categorization. Paper presented at the PROCEEDINGS OF WORLD ACADEMY OF
SCIENCE, ENGINEERING AND TECHNOLOGY, VOL 19.
Porter, M. F. (1980). An algorithm for suffix stripping. Program, 14(3), 130-137.
Pouwels, K. B., Pritchard, E., Matthews, P. C., Stoesser, N., Eyre, D. W., Vihta, K.-D., . . .
Walker, A. S. (2021). Effect of delta variant on viral burden and vaccine effectiveness
against new sars-cov-2 infections in the uk. Nature Medicine. doi:10.1038/s41591-
02101548-7
Qiao, Y., Xiong, C., Liu, Z., & Liu, Z. (2019). Understanding the behaviors of bert in ranking.
Qiu, D., Jiang, H., & Chen, S. (2020). Fuzzy information retrieval based on continuous bag-
ofwords model. Symmetry, 12(2), 225. doi:10.3390/sym12020225
Rabe-Hesketh, S., Skrondal, A., & Zheng, X. (2007). 10 - multilevel structural equation
modeling. In S.-Y. Lee (Ed.), Handbook of latent variable and related models (pp.
209227). Amsterdam: North-Holland.
Rader, B., White, L. F., Burns, M. R., Chen, J., Brilliant, J., Cohen, J., . . . Brownstein, J. S.
(2021). Mask-wearing and control of sars-cov-2 transmission in the USA: A
crosssectional study. The Lancet Digital Health, 3(3), e148-e157.
doi:10.1016/s25897500(20)30293-4
Rahman, M. M., Ali, G., Li, X. J., Samuel, J., Paul, K. C., Chong, P. H. J., & Yakubov, M. (2021).
Socioeconomic factors analysis for covid-19 us reopening sentiment with twitter and
census data. Heliyon, 7(2), e06200. doi:10.1016/j.heliyon.2021.e06200
Ramgobin, D., Benson, J., Kalayanamitra, R., Shahid, Z., Cai, A., McClafferty, B., . . . Jain, R.
(2020). The economic implications of covid-19 in the united states. S D Med, 73(5),
218222.
Riley, S., Fraser, C., Donnelly, C. A., Ghani, A. C., Abu-Raddad, L. J., Hedley, A. J., . . .
Anderson, R. M. (2003). Transmission dynamics of the etiological agent of sars in hong
kong: Impact of public health interventions. Science, 300(5627), 1961-1966.
doi:10.1126/science.1086478
Rogers, E. M. (1995). Diffusion of innovations. In (fifth ed.). New York, NY: Simon and Schuster.
Rulli, M. C., Santini, M., Hayman, D. T. S., & D’Odorico, P. (2017). The nexus between forest
fragmentation in africa and ebola virus disease outbreaks. Sci Rep, 7(1), 41613.
doi:10.1038/srep41613
Rundle, A. G., Park, Y., Herbstman, J. B., Kinsey, E. W., & Wang, Y. C. (2020). Covid‐19–
related school closings and risk of weight gain among children. Obesity, 28(6),
10081009. doi:10.1002/oby.22813

RWJ. (2021). County health rankings.
Saleh, S. N., Lehmann, C. U., McDonald, S. A., Basit, M. A., & Medford, R. J. (2021).
Understanding public perception of coronavirus disease 2019 (covid-19) social
distancing on twitter. Infect Control Hosp Epidemiol, 42(2), 131-138.
doi:10.1017/ice.2020.406
Sallis, J. F., & Owen, N. (2015). Ecological models of health behavior. In K. Glanz, B. K. Rimer,
& K. Viswanath (Eds.), Health behavior: Theory, research and practice (3 ed., pp. 4364).
San Francisco: Jossey-Bass.
Salton, G., & Buckley, C. (1988). Term-weighting approaches in automatic text retrieval.
Information Processing & Management, 24(5), 513-523.
doi:10.1016/03064573(88)90021-0
Samoshyn, A. (2020). Us politicians twitter dataset. Retrieved from:
https://www.kaggle.com/datasets/mrmorj/us-politicians-
twitterdataset?resource=download
Samuel, J., Ali, G., Rahman, M., Esawi, E., & Samuel, Y. (2020). Covid-19 public sentiment
insights and machine learning for tweets classification. Information, 11(6), 314.
SAS. (ND). Sas® software. Cary, NC, USA: SAS Institute Inc. Retrieved from
https://www.sas.com/
Savytska, L., Vnukova, N., Bezugla, I., Pyvovarov, V., & Sübay, T. (2021). Using word2vec
technique to determine semantic and morphologic similarity in embedded words of the
ukrainian language. Paper presented at the 5th International Conference on
Computational Linguistics and Intelligent Systems, Kharkiv, Ukraine.
Schauer, S. G., Naylor, J. F., April, M. D., Carius, B. M., & Hudson, I. L. (2021). Analysis of the
effects of covid-19 mask mandates on hospital resource consumption and mortality at
the county level. Southern Medical Journal, 114(9), 597-602.
doi:10.14423/smj.0000000000001294
Schmolke, A., Thorbek, P., DeAngelis, D. L., & Grimm, V. (2010). Ecological models supporting
environmental decision making: A strategy for the future. Trends in ecology & evolution,
25(8), 479-486.
Schmutz, J. A., Ward, D. H., Sedinger, J. S., & Rexstad, E. A. (1995). Survival estimation and
the effects of dependency among animals. Journal of Applied Statistics, 22(5-6), 673682.
doi:10.1080/02664769524531
Schober, P., & Vetter, T. R. (2018). Repeated measures designs and analysis of longitudinal
data: If at first you do not succeed-try, try again. Anesthesia and analgesia, 127(2),
569575. doi:10.1213/ANE.0000000000003511
Schoenbach, V. J., & Rosamond, W. D. (2000). Analytic study designs. Understanding the
fundamentals of epidemiology: An evolving text, 209-251.
Sehra, S. T., Salciccioli, J. D., Wiebe, D. J., Fundin, S., & Baker, J. F. (2020). Maximum daily
temperature, precipitation, ultraviolet light, and rates of transmission of severe acute
respiratory syndrome coronavirus 2 in the united states. Clinical Infectious Diseases.
doi:10.1093/cid/ciaa681
Setti, L., Passarini, F., De Gennaro, G., Barbieri, P., Licen, S., Perrone, M. G., . . . Miani, A.
(2020). Potential role of particulate matter in the spreading of covid-19 in northern italy:
First observational study based on initial epidemic diffusion. BMJ Open, 10(9), e039338.
doi:10.1136/bmjopen-2020-039338
Shchweter, S., & Ahmed, S. (2019). Deep-eos: General-purpose neural networks for sentence
boundary detection. In. Erlangen, Germany.

Shi, W., Liu, D., Yang, J., Zhang, J., Wen, S., & Su, J. (2020). Social bots' sentiment
engagement in health emergencies: A topic-based analysis of the covid-19 pandemic
discussions on twitter. Int J Environ Res Public Health, 17(22).
doi:10.3390/ijerph17228701
Siedner, M. J., Harling, G., Reynolds, Z., Gilbert, R. F., Haneuse, S., Venkataramani, A. S., &
Tsai, A. C. (2020). Social distancing to slow the us covid-19 epidemic: Longitudinal
pretest–posttest comparison group study. PLoS Med, 17(8), e1003244.
doi:10.1371/journal.pmed.1003244
Snowden, F. M. (2008). Emerging and reemerging diseases: A historical perspective.
Immunological Reviews, 225(1), 9-26. doi:10.1111/j.1600-065x.2008.00677.x
Song, H., McKenna, R., Chen, A. T., David, G., & Smith-Mclallen, A. (2021). The impact of the
non-essential business closure policy on covid-19 infection rates. International Journal of
Health Economics and Management. doi:10.1007/s10754-021-09302-9 spaCy.
(2022). Linguistic features: Lemmatization. Retrieved from
https://spacy.io/usage/linguistic-features#lemmatization
Spiegel, M. (2022). Yale school of management state and local covid restriction database.
https://som.yale.edu/covid-restrictions
Spiegel, M., & Tookes, H. (2021). Business restrictions and covid-19 fatalities. The Review of
Financial Studies, 34(11), 5266-5308. doi:10.1093/rfs/hhab069
Staguhn, E. D., Weston-Farber, E., & Castillo, R. C. (2021). The impact of statewide school
closures on covid-19 infection rates. Am J Infect Control, 49(4), 503-505.
doi:10.1016/j.ajic.2021.01.002
Stamatakis, K. A., Lewis, M., Khoong, E. C., & LaSee, C. (2014). State practitioner insights into
local public health challenges and opportunities in obesity prevention: A qualitative study.
Preventing Chronic Disease, 11, 8. doi:10.5888/pcd11.130260
Su, Y., Xue, J., Liu, X., Wu, P., Chen, J., Chen, C., . . . Zhu, T. (2020). Examining the impact of
covid-19 lockdown in wuhan and lombardy: A psycholinguistic analysis on weibo and
twitter. Int J Environ Res Public Health, 17(12). doi:10.3390/ijerph17124552
Sun, L., Hashimoto, K., Yin, W., Asai, A., Li, J., Yu, P., & Xiong, C. (2020). Adv-bert: Bert is not
robust on misspellings! Generating nature adversarial samples on bert. arXiv preprint
arXiv:2003.04985.
Sweeney, S., Capeding, T. P. J., Eggo, R., Huda, M., Jit, M., Mudzengi, D., . . . Vassall, A.
(2021). Exploring equity in health and poverty impacts of control measures for sars-cov-
2 in six countries. BMJ Global Health, 6(5), e005521. doi:10.1136/bmjgh-2021-005521
Tabatabaeizadeh, S.-A. (2021). Airborne transmission of covid-19 and the role of face mask to
prevent it: A systematic review and meta-analysis. European Journal of Medical
Research, 26(1). doi:10.1186/s40001-020-00475-6
Tan, W. (2021). School closures were over-weighted against the mitigation of covid-19
transmission: A literature review on the impact of school closures in the united states.
Medicine (Baltimore), 100(30), e26709-e26709. doi:10.1097/MD.0000000000026709
Tang, E. (2016). Assessing the effectiveness of corpus-based methods in solving sat sentence
completion questions. Journal of Computers, 266-279. doi:10.17706/jcp.11.4.266-279
Thelwall, M., Buckley, K., & Paltoglou, G. (2011). Sentiment in twitter events. Journal of the
American Society for Information Science and Technology, 62(2), 406-418.
doi:10.1002/asi.21462
Thiese, M. S. (2014). Observational and interventional study design types; an overview.
Biochemia Medica, 24(2), 199-210. doi:10.11613/bm.2014.022

Thu, T. P. B., Ngoc, P. N. H., Hai, N. M., & Tuan, L. A. (2020). Effect of the social distancing
measures on the spread of covid-19 in 10 highly infected countries. Science of the Total
Environment, 742, 140430. doi:10.1016/j.scitotenv.2020.140430
Tofighi, D., Hsiao, Y., Kruger, E. S., Mackinnon, D. P., Lee Van Horn, M., & Witkiewitz, K. (2019).
Sensitivity analysis of the no-omitted confounder assumption in latent growth curve
mediation models. Structural Equation Modeling: A Multidisciplinary Journal, 26(1), 94-
109. doi:10.1080/10705511.2018.1506925
Toman, M., Tesar, R., & Jezek, K. (2006). Influence of word normalization on text classification.
Proceedings of InSciT, 4, 354-358.
Tomasik, M. J., Helbling, L. A., & Moser, U. (2021). Educational gains of in‐person vs. Distance
learning in primary and secondary schools: A natural experiment during the covid ‐19
pandemic school closures in switzerland. International Journal of Psychology, 56(4),
566-576. doi:10.1002/ijop.12728
Travaglio, M., Yu, Y., Popovic, R., Selley, L., Leal, N. S., & Martins, L. M. (2021). Links between
air pollution and covid-19 in england. Environmental Pollution, 268, 115859.
doi:10.1016/j.envpol.2020.115859
Turian, J., Ratinov, L., Bengio, Y., & Assoc Computat, L. (2010, Jul 11-16). Word
representations: A simple and general method for semi-supervised learning. Paper
presented at the 48th Annual Meeting of the Association-for-Computational-Linguistics
(ACL), Uppsala, SWEDEN.
Turney, P. D., & Pantel, P. (2010). From frequency to meaning: Vector space models of
semantics. Journal of Artificial Intelligence Research, 37, 141-188. doi:10.1613/jair.2934
Ullman, J. B., & Bentler, P. M. (2012). Structural equation modeling. Handbook of Psychology,
Second Edition. doi:10.1002/9781118133880.hop202023
US Census Bureau. (2019). Annual estimates of the resident population for incorporated places
of 50,000 or more, ranked by july 1, 2018 population: April 1, 2010 to july 1, 2018 USCB.
(2019). Annual estimates of the resident population: April 1, 2010 to july 1, 2019
(pepannres). Retrieved 3/10/2021
https://data.census.gov/cedsci/table?q=state%20population&g=0100000US.04000.001&
y=2019&tid=PEPPOP2019.PEPANNRES&hidePreview=true
Uysal, A. K., & Gunal, S. (2014). The impact of preprocessing on text classification. Information
Processing & Management, 50(1), 104-112. doi:10.1016/j.ipm.2013.08.006
Van Nguyen, T., Nguyen, A. T., Phan, H. D., Nguyen, T. D., & Nguyen, T. N. (2017). Combining
word2vec with revised vector space model for better code retrieval.
Vaswani, A., Shazeer, N., Parmar, N., Uszkoreit, J., Jones, L., Gomez, A. N., . . . Polosukhin, I.
(2017, Dec 04-09). Attention is all you need. Paper presented at the 31st Annual
Conference on Neural Information Processing Systems (NIPS), Long Beach, CA.
Victor, P. J., Mathews, P. K., Paul, H., Mammen, J. J., & Murugesan, M. (2021). Protective effect
of covid-19 vaccine among health care workers during the second wave of the pandemic
in india. Mayo Clinic Proceedings, 96(9), 2493-2494.
doi:10.1016/j.mayocp.2021.06.003
von Thiele Schwarz, U., Hasson, H., & Lindfors, P. (2015). Applying a fidelity framework to
understand adaptations in an occupational health intervention. Work, 51, 195-203.
doi:10.3233/WOR-141840
Vopham, T., Weaver, M. D., Hart, J. E., Ton, M., White, E., & Newcomb, P. A. (2020). Effect of
social distancing on covid-19 incidence and mortality in the us. Cold Spring Harbor
Laboratory. Retrieved from https://dx.doi.org/10.1101/2020.06.10.20127589

Wadhera, R. K., Wadhera, P., Gaba, P., Figueroa, J. F., Joynt Maddox, K. E., Yeh, R. W., &
Shen, C. (2020). Variation in covid-19 hospitalizations and deaths across new york city
boroughs. Journal of the American Medical Association, 323(21), 2192.
doi:10.1001/jama.2020.7197
Wagner, A. B., Hill, E. L., Ryan, S. E., Sun, Z., Deng, G., Bhadane, S., . . . Matteson, D. S.
(2020). Social distancing has merely stabilized covid-19 in the us. Cold Spring Harbor
Laboratory. Retrieved from https://dx.doi.org/10.1101/2020.04.27.20081836
Wagner, C. H. (1982). Simpson's paradox in real life. The American Statistician, 36(1), 46-48.
Wang, G., Devine, R. A., & Molina-Sieiro, G. (2021). Democratic governors quicker to issue
stay-at-home orders in response to covid-19. The Leadership Quarterly, 101542.
doi:10.1016/j.leaqua.2021.101542
Wang, J., Tang, K., Feng, K., Lin, X., Lv, W., Chen, K., & Wang, F. (2021). Impact of temperature
and relative humidity on the transmission of covid-19: A modelling study in china and the
united states. BMJ Open, 11(2), e043863. doi:10.1136/bmjopen-2020043863
Wang, L., Zhang, S., Yang, Z., Zhao, Z., Moudon, A. V., Feng, H., . . . Cao, B. (2021). What
county-level factors influence covid-19 incidence in the united states? Findings from the
first wave of the pandemic. Cities, 118, 103396.
doi:https://doi.org/10.1016/j.cities.2021.103396
Wang, W., Liu, M., Zhang, Y., Xiang, J., & Mao, R. (2019). Financial numeral classification model
based on bert. In (pp. 193-204): Springer International Publishing.
Wang, X., Ferro, E. G., Zhou, G., Hashimoto, D., & Bhatt, D. L. (2020). Association between
universal masking in a health care system and sars-cov-2 positivity among health care
workers. Journal of the American Medical Association, 324(7), 703.
doi:10.1001/jama.2020.12897
Wang, X., Wei, F., Liu, X., Zhou, M., & Zhang, M. (2011). Topic sentiment analysis in twitter: A
graph-based hashtag sentiment classification approach. Paper presented at the
Proceedings of the 20th ACM international conference on Information and knowledge
management.
Wang, X., Zou, C., Xie, Z., & Li, D. (2020). Public opinions towards covid-19 in california and
new york on twitter. medRxiv. doi:10.1101/2020.07.12.20151936
Wang, Z., & Zhang, Y. (2016). A text information retrieval method by integrating global and local
textual information.
Weisz, G., & Olszynko-Gryn, J. (2010). The theory of epidemiologic transition: The origins of a
citation classic. Journal of the History of Medicine and Allied Sciences, 65(3), 287-326.
doi:10.1093/jhmas/jrp058
WHO. (2020). Pneumonia of unknown cause – china. Disease outbreak news. Retrieved from
https://www.who.int/csr/don/05-january-2020-pneumonia-of-unkown-cause-china/en/
Wibbens, P. D., Koo, W. W.-Y., & McGahan, A. M. (2020). Which covid policies are most
effective? A bayesian analysis of covid-19 by jurisdiction. PLoS One, 15(12), e0244177.
doi:10.1371/journal.pone.0244177
Wilder-Smith, A., & Osman, S. (2020). Public health emergencies of international concern: A
historic overview. Journal of travel medicine, 27(8). doi:10.1093/jtm/taaa227
Wilkinson, D. A., Marshall, J. C., French, N. P., & Hayman, D. T. S. (2018). Habitat
fragmentation, biodiversity loss and the risk of novel infectious disease emergence.
Journal of The Royal Society Interface, 15(149), 20180403. doi:10.1098/rsif.2018.0403
Wilson, K., McDougall, C., & Upshur, R. (2005). The new international health regulations and the
federalism dilemma. PLoS Med, 3(1), e1. doi:10.1371/journal.pmed.0030001

Woods, A. M. (2016, Aug 07-12). Exploiting linguistic features for sentence completion. Paper
presented at the 54th Annual Meeting of the Association-for-Computational-Linguistics
(ACL), Berlin, GERMANY.
Worby, C. J., & Chang, H.-H. (2020). Face mask use in the general population and optimal
resource allocation during the covid-19 pandemic. Nature communications, 11(1).
doi:10.1038/s41467-020-17922-x
Wormer, T. (2014). Emoji-emotion. Retrieved from:
https://github.com/words/emojiemotion/tree/7f555ba155156499949fa210d5ffd40a5e2e9b
1e#license
Wu, B. (2020). Social isolation and loneliness among older adults in the context of covid-19: A
global challenge. Global Health Research and Policy, 5(1). doi:10.1186/s41256-
02000154-3
Wu, J. T., Leung, K., & Leung, G. M. (2020). Nowcasting and forecasting the potential domestic
and international spread of the 2019-ncov outbreak originating in wuhan, china: A
modelling study. The Lancet, 395(10225), 689-697. doi:10.1016/s0140-6736(20)30260-9
Wu, J. T., Mei, S., Luo, S., Leung, K., Liu, D., Lv, Q., . . . Leung, G. M. (2022). A global
assessment of the impact of school closure in reducing covid-19 spread. Philosophical
Transactions of the Royal Society A: Mathematical, Physical and Engineering Sciences,
380(2214). doi:10.1098/rsta.2021.0124
Wu, T., Perrings, C., Kinzig, A., Collins, J. P., Minteer, B. A., & Daszak, P. (2017). Economic
growth, urbanization, globalization, and the risks of emerging infectious diseases in
china: A review. Ambio, 46(1), 18-29. doi:10.1007/s13280-016-0809-2
Xiang, X., Lu, X., Halavanau, A., Xue, J., Sun, Y., Lai, P. H. L., & Wu, Z. (2020). Modern senicide
in the face of a pandemic: An examination of public discourse and sentiment about older
adults and covid-19 using machine learning. J Gerontol B Psychol Sci Soc Sci.
doi:10.1093/geronb/gbaa128
Xiao, Y. (2020). Predicting spatial and temporal responses to non-pharmaceutical interventions
on covid-19 growth rates across 58 counties in new york state: A prospective eventbased
modeling study on county-level sociological predictors.
Xie, Y., Yi, W., Zhang, L., Lu, Y., Hao, H. X., Gao, Y. J., . . . Li, M. H. (2019). Evaluation of a
logistic regression model for predicting liver necroinflammation in hepatitis b e
antigennegative chronic hepatitis b patients with normal and minimally increased alanine
aminotransferase levels. Journal of Viral Hepatitis, 26(S1), 42-49. doi:10.1111/jvh.13163
Xue, J., Chen, J., Chen, C., Zheng, C., Li, S., & Zhu, T. (2020). Public discourse and sentiment
during the covid 19 pandemic: Using latent dirichlet allocation for topic modeling on
twitter. PLoS One, 15(9), e0239441. doi:10.1371/journal.pone.0239441
Yé, Y., Eisele, T. P., Eckert, E., Korenromp, E., Shah, J. A., Hershey, C. L., . . . Bhattarai, A.
(2017). Framework for evaluating the health impact of the scale-up of malaria control
interventions on all-cause child mortality in sub-saharan africa. Am J Trop Med Hyg,
97(3_Suppl), 9-19. doi:10.4269/ajtmh.15-0363
Yung, Y.-F. (2008). Structural equation modeling and path analysis using proc tcalis in sas 9.2.
Paper presented at the SAS Global Forum: Statistics and Data Analysis, Paper.
Zamaninasab, Z., Sharifi, H., Mostafavi, E., Mounesan, L., & Haghdoost, A. A. (2021). Modeling
of the weekly variation of the reported covid-19 cases as a potential indicator of the
surveillance system accuracy.
Zeger, S. L., & Liang, K.-Y. (1992). An overview of methods for the analysis of longitudinal data.
Statistics in Medicine, 11(14-15), 1825-1839. doi:10.1002/sim.4780111406

Zhang, C., Liao, H., Strobl, E., Li, H., Li, R., Jensen, S. S., & Zhang, Y. (2021). The role of
weather conditions in covid-19 transmission: A study of a global panel of 1236 regions.
Journal of Cleaner Production, 292, 125987. doi:10.1016/j.jclepro.2021.125987
Zhao, S. Z., Wong, J. Y. H., Wu, Y., Choi, E. P. H., Wang, M. P., & Lam, T. H. (2020). Social
distancing compliance under covid-19 pandemic and mental health impacts: A
population-based study. Int J Environ Res Public Health, 17(18).
doi:10.3390/ijerph17186692
Zhao, W. X., Jiang, J., Weng, J., He, J., Lim, E.-P., Yan, H., & Li, X. (2011). Comparing twitter
and traditional media using topic models. In (pp. 338-349): Springer Berlin Heidelberg.
Zheng, J., Chen, X., Du, Y., Li, X., & Zhang, J. (2020). Short text sentiment analysis of microblog
based on bert. In (pp. 390-396): Springer Singapore.
Zheng, Z., & Qian, D. (2016). An improved focused crawler based on text keyword extraction.
Zhu, Y., Xie, J., Huang, F., & Cao, L. (2020). Association between short-term exposure to air
pollution and covid-19 infection: Evidence from china. Science of the Total Environment,
727, 138704. doi:10.1016/j.scitotenv.2020.138704
Zimbra, D., Abbasi, A., Zeng, D., & Chen, H. (2018). The state-of-the-art in twitter sentiment
analysis. ACM Transactions on Management Information Systems, 9(2), 1-29.
doi:10.1145/3185045
Zimmermann, M., Frey, K., Hagedorn, B., Oteri, A. J., Yahya, A., Hamisu, M., . . .
ChabotCouture, G. (2019). Optimization of frequency and targeting of measles
supplemental
immunization activities in nigeria: A cost-effectiveness analysis. Vaccine, 37(41), 6039-
6047. doi:10.1016/j.vaccine.2019.08.050
Appendix A: Literature Review COVID-19 Control Measures & Disease Transmission
Background
The SARS-CoV-2 pandemic has clearly been one of the most significant events in recent
human history. At the time of writing, SARS-CoV-2 has been responsible for over 261 million
infections and nearly 5.2 deaths (JHU, 2021). COVID-19 infection disproportionately impacts
certain demographic groups including pregnant women, those with immune compromising
conditions, African and Hispanic Americans, older adults, lower-income groups, and individuals
with certain preexisting conditions including chronic kidney and lung disease (CDC, 2021b; Little
et al., 2021; Naylor-Wardle, Rowland, & Kunadian, 2021). The SARS-CoV-2 pandemic has also
caused widespread disruption and harm to social structures, the economic health of nations

around the world, and the mental health of many of the citizens of those nations (Ammar et al.,
2020; M. M. Hossain et al., 2020; Ramgobin et al., 2020; B. Wu, 2020). In 2020, the total
estimated cost of the SAR-CoV-2 pandemic in the US alone was over $16 trillion dollars (Cutler
& Summers, 2020).
By the early 1980s, many individuals in academia and health policy circles began to
adopt the ideas presented in the epidemiologic transition theory, which was first presented by
Abdel R. Omran. Omran’s theory was primarily focused on discussing the ongoing shift in
demographic patterns and the importance of population control (Weisz & Olszynko-Gryn, 2010).
Despite this fact, Oman’s theory is often understood to promote the idea that humans in the
developed west are no longer at risk from infectious diseases and only need to be concerned
with chronic diseases (Snowden, 2008). However, the rapid global spread of the human
immunodeficiency virus (HIV) and the more recent emergence of SAR-CoV-2 have shown that
this is not the case (JHU, 2021; Magiorkinis et al., 2016).
The World Health Organization (WHO) defines a Public Health Emergency of
International Concern (PHEIC) as an event that is of an extraordinary nature, poses a serious
risk to public health, and requires a concerted international response in order to control (Mullen,
Potter, Gostin, Cicero, & Nuzzo, 2020). Between 2007 and 2020 six events were declared to be
PHEICs with all of those events being related to infectious disease outbreaks (Wilder-Smith &
Osman, 2020). Interestingly all of the pathogens that have triggered PHEIC declarations have
been RNA viruses [H1N1 (Negative-sense RNA), Polio (Positive-sense RNA), Ebola
(Negativesense RNA), Zika (Positive-sense RNA), SARS-CoV-2 (Positive-sense RNA)]. The
rapid rate of mutations seen in viral pathogens, especially RNA viruses, allows the organisms to
develop adaptive pathways to circumvent the host’s immune (Oaks, Shope, & Lederberg, 1992).
However, viral mutation alone may not be the most significant cause of novel disease
emergence or re-emergence events. Over the past three centuries, the global population has
been continually increasing in size (Goldewijk, 2005). This growth in population results in

increasing demands for residential and agricultural land (T. Wu et al., 2017). As a result, humans
are increasingly impinging on forested and other areas that serve as reservoirs for many
infectious disease threats which heightens the risk of spillover events (Rulli, Santini,
Hayman, & D’Odorico, 2017; Wilkinson, Marshall, French, & Hayman, 2018). Population growth
and human infringement on natural habitats seem to play an outsized role in the emergence
process (Ka-Wai Hui, 2006). To make matter worse, the accelerating rate of travel has created
an environment where diseases can spread from infectious individuals within and across
international borders overnight (Glaesser, Kester, Paulose, Alizadeh, & Valentin, 2017).
Infectious disease threats do not seem to be easily conquered, despite what many
followers of Oman’s epidemiologic transition theory might have believed. Given the increasing
rate of novel infectious disease emergence understanding the effect of these diseases on
society and more importantly how these diseases can best be mitigated is now more important
than ever. Doing so will better prepare future public health practitioners, policymakers, and
elected officials to make more effective and data-driven decisions to protect public health.
Current non-pharmaceutical SARS-CoV-2 interventions
During the early phases of the response to the SARS-CoV-2 pandemic, public health
officials had access to a limited and blunt set of non-pharmaceutical inventions (NPI) to reduce
the transmission of disease. Despite this restricted number of options, a wide range of
SARSCoV-2 containment and control methodologies were implemented by the various local,
national, and regional governance bodies of the world (Thomas Hale, Petherick, Phillips, &
Webster, 2020; Hallas et al., 2020; Lavizzari et al., 2021). The fairly recent severe acute
respiratory syndrome coronavirus-1 (SARS-CoV-1) and Middle East respiratory syndrome
coronavirus (MERS-CoV) epidemics have given a limited number of counties some degree of
experience in responding to outbreaks caused by coronaviruses (Organization, 2019; Riley et
al., 2003). It is difficult to determine to what degree these previous experiences have influenced

the national responses seen during the course of the current SARS-CoV-2 pandemic. Despite
these complications, this section of the paper aims to provide an understanding of what impact
COVID-19-related NPIs have had on disease transmission and mortality. In addition, this section
will also the unintended consequences of COVID-19-related NPIs.
Social distancing.
Social distancing was first recommended by the WHO International Health Regulations
(2005) Emergency Committee on January 30, 2020. (Adhanom, 2020) Prior to the availability of
SARS-CoV-2 vaccines government-imposed social distancing interventions were one of the few
tools available to public policymakers in the fight against the pandemic. Social distancing
interventions come in many forms and can target a variety of environments where susceptible
hosts and infectious individuals could potentially interact. According to Hallas et al. (2020),
government-imposed social distancing interventions can be categorized as non-essential
business closures, school closures, stay-at-home orders, and restrictions on domestic and
international travel. While there are other types of social distancing measures that focus on
domestic travel including restrictions on large gathers, public transportation, and public events,
much of their effect on COVID-19 transmission is thought to be driven by business closures,
school closures, and stay-at-home orders (Askitas et al., 2021). As a result, interventions
focused on restricting domestic travel are not discussed in this paper. Governments around the
globe have implemented many combinations of the previously mentioned social distancing
interventions, with variable levels of stringency, duration, and geographic targeting (Thomas
Hale, Atav, et al., 2020). Fortunately, there exists a preponderance of research on this topic that
can be used to help determine what effect these interventions have had.
The effectiveness of government-imposed social distancing in reducing disease
transmission is clear, despite the fact there has been a great deal of variance in the methods
selected by governing bodies around the globe when implementing social distancing inventions.
The mechanism by which social distancing interventions reduce disease transmission is well

understood. The SARS-CoV-2 pandemic, even in the absence of government-imposed social
distancing interventions has led to reductions in human mobility (Jacobsen & Jacobsen, 2020).
Government-imposed social distancing interventions have been found to increase the
amount of time individuals spend at home even after accounting for the effects of the pandemic
(S. Gao, Rao, Kang, Liang, & Kruse, 2020; Jacobsen & Jacobsen, 2020; Vopham et al., 2020;
Wibbens et al., 2020). As research into the modeling of disease transmission has shown, the
size of an epidemic is controlled by the probability of disease transmission during contact
between a susceptible host and an infectious individual and how often these interactions take
place (Newman, 2002). Government-imposed social distancing interventions work by reducing
the number of opportunities for disease transmission. Reducing contact between infectious
individuals and susceptible hosts is an essential step in the effort to break the disease
transmission cycle.
The implementation of social distancing measures has been estimated to decrease
COVID-19 transmission by as much as 95% (Wibbens et al., 2020). These findings are
supported by research conducted by S. Gao, J. Rao, Y. Kang, Y. Liang, J. Kruse, et al. (2020)
which found the implementation of social distancing measures to be associated with a 100%
increase in the estimated COVID-19 cumulative case count doubling time. Furthermore,
Courtemanche, Garuccio, Le, Pinkston, and Yelowitz (2020) found that periods in the US when
government-imposed social distancing measures were in place were associated with COVID-19
growth rates that were 35 times longer than comparable periods without social distancing
measures. Similarly, A. B. Wagner et al. (2020) found that in the US, the implementation of
social distancing measures was associated with a 2921.15% increase in the doubling time of
COVID-19 infections. This indicates that social distancing slows disease transmission. The
effect that social distancing measures have on the growth rate and the timing of the peak of
COVID-19 transmission highlights the critical importance of this control measure. Previous
research has shown that healthcare utilization surges caused by uncontrolled COVID-19

transmission are associated with adjusted odds of death for COVID-19 patients that are 2 [95%
CI: 1.69,2.38] times higher than the odds of death seen during non-surge periods (Kadris et al.,
2021).
The evidence for the impact of government-imposed social distancing measures is very
strong. Importantly, the current research on this topic shows that changes in disease
transmission indicators are detectable in one-four weeks following the implementation of social
distancing measures (Courtemanche et al., 2020; Thu et al., 2020). Furthermore, there is
extensive research that shows that the implementation of government-imposed social distancing
measures preceded reductions in COVID-19 transmission by between one-two weeks (Bielecki
et al., 2021; Courtemanche et al., 2020; S. Gao, J. Rao, Y. Kang, Y. Liang, & J. Kruse, 2020;
Siedner et al., 2020; Thu et al., 2020). This temporal relationship supports arguments that social
distancing interventions are responsible for subsequently observed changes in disease
transmission patterns.
Side-effects of social distancing.
It must be noted that social distancing interventions are associated with a number of
negative consequences. It is well understood that lower-income individuals have been
associated with higher risks of poor outcomes from COVID-19 infection such as hospitalization
(Little et al., 2021; Naylor-Wardle et al., 2021). However, low-income communities house
individuals who also suffer at the hands of some of the unforeseen consequences associated
with key disease control interventions designed to protect those and other communities. As
stated earlier, the SARS-CoV-2 pandemic has been associated with significant economic
disruptions in the US. Research has shown that lower-income individuals were more likely to
report a loss of income as a result of COVID-19-related social distancing interventions
(Sweeney et al., 2021). Social distancing interventions have also been linked to decreases in life
satisfaction and slight increases in the reported odds of depressive symptoms (Ammar et al.,
2020; S. Z. Zhao et al., 2020).

Some researchers posit that targeted social distancing efforts such as school closures
are associated with increased anxiety, sleep disruption, weight gain, and self-harm (Rundle,
Park, Herbstman, Kinsey, & Wang, 2020; Tan, 2021). However, there is limited evidence to
support directly support many of these theories or that has linked school closures to lasting
harm in children (Lee, 2020). The short-term effects of school closures on student academic
achievement have been well studied. Kuhfeld et al. (2020) predicted that the 2019-2020 school
year would be associated with a 32% decrease in reading and a 50% decrease in math learning
gains for US students. However, at the time of writing the authors have not published a followup
study to evaluate how well their projections fit the observed data for that school year. A
systematic literature review on the effect that school closures had on academic achievement
found mixed results with included studies reporting standard deviation changes in achievement
scores that ranged from -0.37 to + 0.25 (Hammerstein, Konig, Dreisorner, & Frey, 2021).
While the general effect of school closures on academic achievement is not clear, some
authors present the idea that school closures will result in the exacerbation of existing academic
achievement inequities (Ozer, Suna, Celik, & Askar, 2020). The available literature does seem to
support this hypothesis. When focusing on younger children there seems to be a clear
association between school closures and harmful academic effects. Tomasik, Helbling, and
Moser (2021) found that younger children were associated 0.37 standard deviation decrease in
achievement scores, which is 0.27 standard deviations lower than the decrease seen in older
children. Furthermore, income appears to play an important role in mediating the negative
effects of school closures. Gore, Fray, Miller, Harris, and Taggart (2021) found that school
closures were associated with a 0.16 standard deviation decrease in achievement scores for
low SES children and a 0.15 standard deviation increase in children with moderate levels of
SES.
The available literature shows that there are still many questions to be answered about
the negative effects of social distancing, particularly surrounding the long-term consequences.

Nonetheless, the harmful and potentially harmful effects of social distancing interventions should
not be ignored. These side-effects mentioned above show that decisions to institute social
distancing interventions should be made after careful deliberation, planning, and resource
allocation aimed at reducing the impact on vulnerable populations. Furthermore, the side-effects
of social distancing have created many research opportunities to identify and evaluate methods
of mitigating the detrimental consequences of social distancing interventions. Addressing this
later gap in the available literature will have substantial public health implications. Especially
given the effectiveness of social distancing in controlling disease transmission and that SARS-
CoV-2.
Facemask utilization.
A government’s policies towards COVID-19 control measures can not only influence the
behavior of its citizens in terms of their decisions on social distancing, but it can also impact
other important disease control behaviors. In April 2020, the Centers for Disease Control and
Prevention (CDC) for the first time recommended universal masking for all Americans while in
close proximity to other individuals to prevent COVID-19 transmission (CDC, 2020). Research
has shown that following the announcement of this recommendation the utilization of facemasks
by US adults increased by 23.42% (K. A. Fisher et al., 2020). While this study had a limited
sample size, their finders were supported by Rader et al. (2021) who reported a 10% increase in
facemask utilization among the 374,021 Americans included in their survey. While it is not
possible to ascribe all of the credit for the increases in mask utilization to the CDC
recommendation, it is reasonable to assume that the recommendation did influence facemask
utilization to some degree. This is especially true in light of the influence that public health
messaging is known to have on other protective behaviors such as vaccination intention
(Betsch, Böhm, Korn, & Holtmann, 2017).
The ability of government policy to impact this particular protective behavior is important.
Modeling studies have found that the use of facemasks by the general population has been

associated with reductions in the number of new COVID-19 infections and related mortality
along with a delay in the time to peak transmission (Worby & Chang, 2020). Analysis of
realworld ecological data has resulted in similar findings. Globally, during the initial phases of the
pandemic and at the national-level a week of widespread facemask usage was associated with
a 12.6% increase in per capita COVID-19-associated mortality versus a 50.7% increase during
weeks without facemask usage (Leffler et al., 2020). However, in these types of studies
ecological fallacy and issues such as Simpson’s paradox are persistent concerns. As a result, it
is essential that ecological findings be examined at multiple levels.
When studied at the county-level conflicting results have been found. Schauer, Naylor,
April, Carius, and Hudson (2021) found that in Bexar County, Texas neither a state-level nor
county-level facemask order was associated with a county-level reduction in cases. Public
compliance is essential to the success of any intervention. However, the proportion of
individuals in the Bexar County region who reported that they would be very likely to wear a
mask is estimated to be between 15 – 45% (Rader et al., 2021). Given that fact, this finding is
not surprising that a mask order did significantly alter disease transmission in Bexar County. In a
larger study including all US states, Washington D.C., and 2,930 US counties, W. Lyu and
Wehby (2020) found that state-level facemask mandates were associated with a two percentage
point decrease in the daily county-level COVID-19 case rate. Furthermore, Spiegel and Tookes
(2021) report that US counties with mask mandates saw a 15.3% decrease in COVID-19-related
mortality rates six weeks after the implementation of the intervention. However, in both of the
previously referenced studies the researchers were unable to account for actual facemask
mandate compliance.
In the health care setting, X. Wang, Ferro, Zhou, Hashimoto, and Bhatt (2020) periods
with universal masking in place have been associated with exponential increases in
occupationally acquired COVID-19 in health care workers from a 0% prevalence to a 21.32%
prevalence rate. However, the researchers also found that following the implementation of

universal masking the prevalence of SARS-CoV-2 among health care workers decreased by
0.49% (X. Wang, Ferro, et al., 2020). Similar findings were reported in a meta-analysis
conducted by Tabatabaeizadeh (2021) and included 7,688 participants where the researchers
reported an 88% reduction [95% CI: 73%, 94%] in the relative risk of COVID-19 infection when
comparing those who wore a facemask to those who did not. While this particular public health
recommendation has not been in effect long in the US, universal masking has quickly become
an essential tool in the effort to prevent the transmission of disease during epidemics of
respiratory pathogen etiology.
Vaccination.
While this section is primarily focused on non-pharmaceutical interventions is should be
noted that one of the most highly effective methods of reducing the COVID-19 growth and
hospitalization rate is vaccination (Guerstein et al., 2021). Vaccination against SARS-CoV-2 has
been found to be up to 95% effective in preventing infection (Polack et al., 2020). However, it
should be noted that recently emergent variants such as B.1.1589, also known as the Delta
variant, have been found to reduce the effectiveness of the currently available vaccine by as
much as 16% (Pouwels et al., 2021). Furthermore, it is difficult to predict how the emergence of
future variants could impact vaccine efficacy (Evans & Jewell, 2021). Despite these facts,
vaccination remains an important tool in the effort to reduce the harmful consequences of
COVID-19 infection.
Factors known to influence the effectiveness of COVID-19 interventions
Intervention design.
Early SARS-CoV-2 researchers have hypothesized that the stringency and level of
enforcement of social distancing measures would impact their effectiveness at curbing disease
transmission (Thu et al., 2020). This idea was shown to have merit, as later researchers found
that areas with government-enforced social distancing measures were associated with greater

reductions in human mobility and larger reductions in disease transmission than areas without
the same level of government-enforcement power (Courtemanche et al., 2020; S. Gao, J. Rao,
Y. Kang, Y. Liang, & J. Kruse, 2020; Jacobsen & Jacobsen, 2020; Wibbens et al., 2020).
Furthermore, the four categories of social distancing interventions do not appear to be equally
effective in reducing disease transmission rates.
School closures.
As stated above, young children are at lower risk of poor outcomes as a result of
SARSCoV-2 and school closures have been linked to a number of negative societal outcomes.
Given these facts, it is important to understand what benefit school closures have to the disease
control effort. In a fairly large study conducted on US states, researchers found that 17-42 days
after a school closure was instituted the incidence of COVID-19 cases decreased an by
estimated 61.5% (95%CI: 49.4%, 70.7%) (Auger et al., 2020). Auger et al. (2020) also found
that school closures were associated with a 58.3% decrease in COVID-19 mortality rates
(95%CI: 46.4%, 67.5%). However, in a comparably large study on data from 1,741 Japanese
municipalities, researchers found no significant difference in COVID-19 transmission between
municipalities with and without school closures (Fukumoto et al., 2021). Courtemanche et al.
(2020) similarly found that school closures had no significant effect on the COVID-19 case
growth rate. The findings of the Auger et al. study are supported by (Staguhn, Weston-Farber, &
Castillo, 2021) who found that in the US school closures were associated with an average
decrease of 0.44 95% C.I.:0.24, 0.65; p<.0001) in the COVID-19 infection rate. However, the
authors did not make any attempt to control for confounding or account for random variations in
this analysis. Simulation studies have estimated that school closures would result in a delay of
peak transmission by about 27 days, however, these studies have also found that closures
would not significantly alter the magnitude of the peak once it arrived or the COVID-19 infection
rate (Chang et al., 2020; J. T. Wu et al., 2022). As a result of these findings, the available

literature does not lend much support for incorporating school closures in COVID-19 disease
control interventions.
Stay-at-home orders.
The evidence in support of stay-at-home orders being effective methods to control the
transmission of COVID-19 is strong. As stated above, stay-at-home orders function by reducing
opportunities for disease transmission. When social distancing was conceptualized using a
composite variable including the change individual-level average distance traveled and
nonessential venue visitation, along with the probability that any two individuals would be in
close proximity, the implementation of stay-at-home orders in the US was associated with an
estimated 35% increase in social distancing, (Vopham et al., 2020). While Wibbens et al. (2020)
found that stay-at-home orders were the second most effective method of controlling COVID-19
transmission when considering school closures, business closures, stay-at-home orders, and
travel restrictions. Similarly, Liu et al. (2021) found that stay-at-home orders had a moderate but
negative effect on the COVID-19 reproductive number. This finding highlights the importance of
understanding the effect size of stay-at-home orders on disease transmission along with the
moderating effect of compliance. Simulation studies have estimated that ending COVID-19
disease transmission would necessitate that between 80-90% of a jurisdiction's population
rigidly comply with stay-at-home orders for a period of at least 17 weeks (Chang et al., 2020;
Wibbens et al., 2020). This high level of required compliance could explain the negative results
seen in some studies that aimed to evaluate the relationship between stay-at-home orders and
disease transmission (Auger et al., 2020).
Business closures.
Non-essential business closures can impact a large number of individuals in a
community. In the available literature, business closures are often, but not always,
conceptualized in the subcategories of non-essential business closures or restaurant and bar
closures (Abouk & Heydari, 2021; Spiegel & Tookes, 2021). Of the four categories of social

distancing measures included in this paper, multiple researchers have found that business
closures were one of the most effective methods of controlling COVID-19 transmission (Askitas
et al., 2021; Liu et al., 2021; Wibbens et al., 2020). In fact, using US county-level data, Spiegel
and Tookes (2021) state that their findings represent strong evidence that restaurant closures
alone are associated with a 36.45 decrease in weekly COVID-related mortality growth rates.
Importantly there is also support for the positive effects of business closures when the
data is examined at the individual-level. Research conducted on essential and non-essential
workers in Pennsylvania found that essential workers and their household contacts were 55%
and 17% more likely to be infected with COVID-19 than their non-essential worker counterparts
(Song, McKenna, Chen, David, & Smith-Mclallen, 2021). The available literature shows that
business closures have proven to have a significant effect on COVID-19 transmission and
mortality, despite the fact that the various conceptualization of the control measure complicates
the process of synthesizing the research on this topic.
Restrictions on international travel.
Social distancing-based international travel restrictions come in the form of isolation and
quarantine of travelers and partial or total border closures (Bou-Karroum et al., 2021).
International travel restrictions have proven to be a widely adopted NPI in the early phases of
the pandemic. It is estimated that around 95% of nations implemented some form of
international travel restrictions during the response to the SARS-CoV-2 pandemic (Bou-Karroum
et al., 2021). This fact is particularly important given that COVID-19-related international travel
restrictions have been found to have a significant negative impact on national economies and
stock markets (Ozili & Arun, 2020). As a result of this wide adoption and negative side-effects
highlight the need to develop a thorough understanding of the effect that international travel
restrictions have on the risk of disease transmission.
As with the other forms of NPI covered in this paper, the national adoption of
international travel restrictions varied greatly across the globe. Australia demonstrated some of

the most restrictive national-level policies toward international travelers (Bou-Karroum et al.,
2021). This high level of international travel restriction resulted in an estimated 79 – 87%
decrease in imported cases, during the early phases of the pandemic (Adekunle et al., 2020;
Liebig, Najeebullah, Jurdak, Shoghri, & Paini, 2021). However, other non-island nations did not
see any benefit from implementing international travel restrictions. International travel
restrictions did not prove to be effective in reducing imported cases for Iran, Italy, or South
Korea (Askitas et al., 2021). Regardless, preventing imported cases does not prevent local
transmission when there is a suitable reservoir for the pathogen in local communities. In the
case of SARS-CoV-2, every nation on earth is populated by suitable reservoirs for the pathogen.
This point is driven home by the fact that Liu et al. (2021) in their study of 130 countries found
that international travel restrictions had no effect on a nation’s observed COVID19 Rt.
Even when effective at preventing imported cases, the benefits of international travel
restrictions are short-lived (Askitas et al., 2021). In modeling studies, during the early phases of
the pandemic restricting travel from Wuhan to mainland China alone was associated with a
10day delay in the epidemiological trend of transmission in the mainland (Chinazzi et al., 2020).
Other modeling studies have found similar results with predicted delays ranging from 10 to 44
days (Adekunle et al., 2020; M. P. Hossain et al., 2020). According to the current literature,
reducing international travel is not a long-term solution to reducing the transmission of
respiratory viruses such as SARS-CoV-2.
Centralized versus decentralized planning and implementation.
The governance and decision-making structure of public health interventions is often
conceptualized into three categories that include standard-centralized, customizablecentralized,
and decentralized (Blackwood et al., 2021). A standard-centralized structure does not allow for
the consideration of local variations in demographics, geography, economic, or any other
relevant variable. This could be thought of as a one-size-fits-all approach. In these structures,
the central node of the governance network creates the intervention and distributes it to the

peripheral nodes (i.e local jurisdictions) for adoption. On the other hand,
customizablecentralized governance structures provide an interventional framework that
peripheral nodes can adopt to meet local needs. However, in decentralized governance
structures, each peripheral node is given complete or near-complete autonomy to design and
implement a public health intervention as local authorities deem appropriate. Each of these
governance structures comes with its own benefits and drawbacks, as shall be discussed in the
next few passages.
In certain circumstances, decentralized governance structures are preferable to
centralized structures. This is particularly true when peripheral node decisions are unlikely to
have a negative impact on neighboring nodes, limited central coordination of communication is
required, and when there is a large amount of variability in the conditions that can impact the
success of intervention between the peripheral nodes in the governance network (Blackwood et
al., 2021; Campbell, 2004; Hurley, Birch, & Eyles, 1995; Lampert, 2020; Zimmermann et al.,
2019). Decentralized governance structures in public health interventions allow for flexibility in
the design along with allowing local officials to identify, prioritize, and respond to the needs of
their jurisdiction more efficiently than a more centralized structure could (Blackwood et al., 2021;
Hurley et al., 1995).
While decentralized governance structures are associated with greater flexibility, the
trade-off of this increased ability to customize an intervention is an increased risk of coordination
failure especially when diseases can effectively transmit across jurisdictional boundaries
(Blackwood et al., 2021). In their study of the comparative impact of centralized standardized,
centralized customizable, and decentralized public health responses to SARS-CoV-2 utilizing an
SIR model (Blackwood et al., 2021) found that if local jurisdictions implement policies that only
consider local priorities then it may be difficult to accomplish global disease control. This is a
crucial limitation when considering highly infectious pathogens such as SAR-CoV-2.

More decentralized administrative approaches also suffer from a reduced ability to
implement new policies that may require some baseline level of public health policing power.
For example, Wilson et al. (2005) state that decentralized public health administrative
approaches may struggle to systematically collect surveillance data due to variability in
reporting, data collection, and data sharing laws. This hypothesis is supported by an analysis of
the response to SARS-CoV-1 in Canada where Campbell (2004) found that a lack of
coordinated communications, along with a lack of data collection and sharing, and central
coordination hampered the nation's response to the epidemic. Furthermore, Fidler (2001) raises
the concern that too much decentralization can result in an excessive amount of variations in
local jurisdictions' ability to respond to complex public health emergencies such as bioterrorist
attacks. Parmet (2002) goes on to note that, while partnerships and collaboration between
central peripheral nodes in a governance structure are essential in responses to largescale
public health and public safety-related emergencies, a rigid effort to retain complete local control
of responses can increase the threat that these events present.
The central node in the public health governance structure serves an important purpose
in intervention planning and implementation. Hurley et al. (1995) note that central authorities
play a key supporting role, particularly in the development and maintenance of the information
systems needed to facilitate health responses. Qualitative studies have been utilized to give a
practical voice to many of the theories outlined above. In a series of 28 semi-structured
interviews Stamatakis, Lewis, Khoong, and LaSee (2014) found that participants reported
access to state-level resources and technical assistance was a facilitator to the success of a
public health obesity intervention. While studies such as the one previously mentioned show
that the involvement of central authorities is clearly essential, public health policymakers who
ignore the context in which their interventions are to be implemented do so at their own peril.
Two examples from the African continent both Kundrick et al. (2018) and Zimmermann et al.
(2019) found that when, implementing measles vaccination campaigns in Nigeria and Malawi,

accounting for variations in local factors such as the level of urbanization, population density,
healthcare infrastructure, and the local security situation would result in increased programmatic
spending and vaccine delivery efficiency. In other words, a customizable-centralized approach is
preferable over a standard-centralized approach.
Blackwood et al. (2021) provide an analytical study of the effect of public health
governance structures where far too few examples of this type of research exist. However, it
should be noted in their model the researchers assume that vaccination, isolation, medication,
border closure, and a travel ban on infected individuals are all effective methods of preventing
disease transmission. It is well established that border closures and international travel bans are
of limited utility in COVID-19 control (Askitas et al., 2021; Chinazzi et al., 2020; Liu et al., 2021).
Furthermore, the researchers assume that vaccination removes individuals from the pool of
susceptible hosts. However, research shows that during the Delta wave of the pandemic
SARSCoV-2 vaccine effectiveness (VE) was just ranged from 40-97% depending on the number
of doses and type of vaccine received (Pouwels et al., 2021). Finally, the researchers assumed
perfect compliance with isolation requirements. As has already been discussed, compliance
plays a large role in the effectiveness of SARS-CoV-2 interventions, and in practice levels of
COVID-19 NPI compliance across the globe have not been found to be extremely high. Given
these facts, the external validity of the researcher's model is called into question.
The appropriate balance between central and peripheral node authority in responding to
public health crises is a topic that has been debated and discussed around the globe for years
(Fidler, 2001; Howse, 2004). Furthermore, the current literature on this topic shows that the
public health governance structure surrounding an intervention plays a large role in the success
or failure of the effort. Despite this fact, governance structures are often ignored in public health
and epidemiologic research the limitations of this study (Blackwood et al., 2021). As a result,
there is a limited amount of research that analytically explores the effect that governance
structure has on disease transmission. This is especially true for COVID-19 transmission.

Further research on this topic is warranted.
Population-level factors associated with COVID-19 transmission
In studying SARS-CoV-2 at the ecological researchers should be mindful of the fact that
a number of population-level variables have been found to be significantly associated with
COVID-19 transmission and mortality indicators. Population-level factors such as gender
makeup, age, ethnic makeup, socioeconomic status, income inequality, and air pollution levels
have been found to be associated with COVID-19 transmission (J. Wang et al., 2021; L. Wang
et al., 2021). Positive associations between the county-level proportion of African American
residents, the proportion of female African American residents, and COVID-19 transmission
(Millett et al., 2020; Mollalo, Vahedi, & Rivera, 2020; Sehra, Salciccioli, Wiebe, Fundin, & Baker,
2020). However, the effect of age does not appear to be as consistent. At the US county-level, L.
Wang et al. (2021) found a positive association between transmission and the percent of the
county 65 years or older. However, both J. Wang et al. (2021) and Auger et al. (2020) found
negative associations between COVID-19 transmission and the percentage of 65 years or older
residents at the US county and state-level, respectively. While the proportion of residents 65 years
of age or older seems to be positively associated with COVID-19 mortality (Millett et al., 2020).
A number of variables related to access to healthcare have been found to be associated
with SARS-CoV-2 indicators. At the US county-level the patient-provider ratio, the number of
licensed hospital and ICU beds, number of nurse practitioners have each been found to be
positively associated with COVID-19 transmission (Mollalo et al., 2020; J. Wang et al., 2021; L.
Wang et al., 2021). However, these associations are likely an artifact of other more probable
relationships. For example, jurisdictions with better access to health care might also have better
access to COVID-19 testing services. It is well known that COVID-19 case counts are positively
associated with testing rates (Auger et al., 2020; Pilecco et al., 2021). As a result, SARS-CoV-2
indicators derived from case numbers are biased by testing rates (Angelopoulos, Pathak,

Varma, & Jordan, 2020; N. D. Goldstein & Burstyn, 2020). This phenomenon likely explains
observed positive associations between access to health care and COVID-19 transmission.
Economic, geographic, environmental, and other factors.
A number of studies have found associations between economic indicators and
COVID19 transmission. For example, household overcrowding, the income inequality ratio, and
the median household income have all been found to be positively associated with COVID-19
transmission at the US county-level (Millett et al., 2020; Mollalo et al., 2020). However,
also at the US county-level unemployment was found to be negatively associated with
transmission (Mollalo et al., 2020). Environmental factors such as ambient air temperature and
relative humidity appear to be negatively associated with COVID-19 transmission at the state,
county, and national levels (Sehra et al., 2020; Travaglio et al., 2021; J. Wang et al., 2021;
Zhang et al., 2021). Multiple studies have found a positive association between COVID-19
transmission and air pollution measured in ambient concentrations of particulate matter particles
less than 2.5 micrometers (PM2.5) or 10 micrometers (PM10) in diameter, along with
concentrations of nitrogen oxides and dioxide (Setti et al., 2020; Travaglio et al., 2021; Zhu, Xie,
Huang, & Cao, 2020).
However, the mechanism that is responsible for this association has not been well studied.
Finally, other county-level factors such as the rural versus urban nature of the jurisdiction,
having an international airport within the county boundaries, and population density have also
been found to be independent predictors of disease transmission (Auger et al., 2020; Chokshi,
Dallapiazza, Zhang, & Sifri, 2021; Q. Li et al., 2020).
Importantly, social distancing researchers posit that the timing of the implementation in
the course of the epidemic curve will impact the level of intervention effectiveness (Thu et al.,
2020). This hypothesis appears to be valid as later research has shown that at the US
countylevel and global national-level earlier implementation of social distancing measures is
associated with lower rates of COVID-19 transmission (Islam et al., 2020; L. Wang et al., 2021).

It has also been theorized that the level of stringency impacts the speed at which the
intervention can take begin to alter transmission rates (Thu et al., 2020). Other researchers
have noted that time itself plays a role in how effective a social distancing intervention is (Liu et
al., 2021). These findings indicate that time is an important variable to account for when
attempting to model COVID-19 transmission.
Methodologies for statistical modeling of repeated measures data
In attempting to explain the relationship between repeated measurements of a SARCoV-
2 transmission indicator and a set of explanatory variables there are a number of statistical
models that could be used. Repeated measures studies assume that the repeated
measurements of the outcome variable for an individual unit are not independent of one another
(Mascha & Sessler, 2011). This is accomplished by modeling the covariance structure seen
within the linked observations of a study subject. A subject’s observations covary when a
researcher is able to infer information about later measurements by evaluating an early
measurement on that same subject (Garrett M. Fitzmaurice & Ravichandran, 2008). Historically,
univariate repeated measures ANOVA, repeated measures multivariate ANOVA (MANOVA), and
the analysis of a summary statistic created by aggregating observation across time have been
used to analyze these types of data (Garrett M Fitzmaurice, Laird, & Ware, 2012). However,
these methods suffer from a number of limitations, many of which are discussed further in the
following section.
There are a number of relatively more modern and sophisticated methods of analyzing
repeated or clustered data. An expansive description of every possible model that could be used
to accomplish this aim is beyond the scope of this paper, largely due to the numerous
conceptualization of COVID-19 transmission indicators. However, the following sections focus
on three methods that are suitable for modeling SAR-CoV-2 infection rates when transmission is
conceptualized as a continuous variable and repeated measures are accounted for. These

methods include repeated measures AVONA or MANOVA, latent growth curve modeling, and
longitudinal mixed-effects modeling.
Repeated measures ANOVA and MANOVA.
Repeated measures ANOVA and MANOVA models allow researchers to study the effect
of between and within-subject variables, along with the interaction between those variables and
time. These methods have many utilities in the fields of social, behavioral, and biomedical
science. However, knowing when these methods can be properly used is critical if valid
inferences are to be made. Both repeated measures ANOVA and MANOVA assume that there is
balanced data for all subjects included within the study, that they were followed for the same
period of time, no measurements are missing, and are measured at the same frequency
(Mascha & Sessler, 2011). The assumptions that study subjects have an equal number of
measurements, spaced at common intervals, and with no missing observation is also known as
the balanced data assumption (Garrett M. Fitzmaurice & Ravichandran, 2008).
Repeated measures ANOVA require that compound symmetry working covariance
structure be an accurate representation of the relationship within all study subjects’ observations
and that the differences in variances of each paired measurement are equal (Garrett M.
Fitzmaurice & Ravichandran, 2008). This latter assumption is also known as the assumption of
sphericity. The simple example of an individual being measured at three time points (t1, t2, and
t3) will be used to further provide an explanation of sphericity. The sphericity assumption would
likely be violated if the covariance between (t1, t2) = 10.20, (t1, t3) = 50.21, (t2, t3) = 5.63.
Sphericity is a critical assumption in repeated measures ANOVA models, as the ANOVA formula
pools the covariances between paired measurements when calculating the test statistic and
subsequent p values. Violations of this assumption, particularly when sample sizes are small,
can result in biased results (Haverkamp & Beauducel, 2017). While failing to address problems
with sphericity can call into question the results of a study, fortunately, the Greenhouse and
Geisser correction can be applied to the ANOVA models when sphericity is violated (Mauchly,

1940). Furthermore, the sphericity assumption is not a concern for MANOVA models as these
models do not assume a specific covariance structure (Garrett M. Fitzmaurice & Ravichandran,
2008; Schober & Vetter, 2018).
There are a few factors that make repeated measures ANOVA and MANOVA appealing
methods for analysis. Repeated measures ANOVA and MANOVA models are relatively simple to
implement and interpret (Garrett M. Fitzmaurice & Ravichandran, 2008). MANOVA models do
not assume a working correlation structure which reduces the risk of the introduction of bias
through model misspecification (Garrett M. Fitzmaurice & Ravichandran, 2008; Schober &
Vetter, 2018). Finally, a number of statistical packages including SAS and SPSS have allowed
for the specification of ANOVA and MANOVA models making the analysis methods readily
available. However, the large number of limitations associated with these methods cannot be
ignored.
Furthermore, repeated measures ANOVA are incapable of accounting for the effect of
time and only allow the researcher to study the effect of a single variable at a time (Garrett M
Fitzmaurice et al., 2012; Garrett M. Fitzmaurice & Ravichandran, 2008). ANOVA and MANOVA
models can only accommodate continuous outcome variables and categorical independent
variables. Finally, any significant results from ANOVA or MANOVA models would need to be
further explored using follow-up posthoc tests in order to draw meaningful insights from the
analysis. While ANOVA and MANOVA models provided early researchers interested in repeated
measures analysis with an important tool to examine their data, these methods have not
withstood the test of time. The limitation outlined in this section seriously reduces the utility of
repeated measures ANOVA and MANOVA when attempting to model real-world phenomena that
often have complex causal chains and unbalanced observations.
Latent growth curve modeling.
Latent growth models (LGM) allow researchers to model changes in an outcome over
time and across repeated observations. LGMs have a number of important assumptions. These

assumptions include a continuous scale outcome variable, balanced measurement intervals
across all subjects in the study, there exist at least three repeated measurements on all subjects
included within the study (Byrne & Crombie, 2003), and that the underlying distribution of the
outcome variable normal (T.-Y. Lu, Poon, & Tsang, 2011). There are two other assumptions that
should be considered when utilizing most regression models. The first is that the sample size is
sufficiently large to allow for model convergence (n>=200) (Boomsma & Hoogland, 2001). The
final assumption is that no confounding covariate is omitted from the regression model (Tofighi
et al., 2019).
One major advantage of LGMs is that they are a special case of a broader type of
analysis known as structural equation modeling (SEM) (T.-Y. Lu et al., 2011). SEMs allow
researchers to model the complex and unique effects of model covariates, while also evaluating
the relative influence of each of the independent variables of interest in terms of their influence
on the outcome variable (Ullman & Bentler, 2012). When combined with the creation of a path
diagram SEM has the added benefit of providing an easy-to-understand graphical
representation of the complex relationships being explored (Yung, 2008). However, SEM is not
ideal in the context of the current research study. SEM has the assumption that your
observations are independent. According to Schmutz, Ward, Sedinger, and Rexstad (1995)
violations of this assumption can artificially deflate the variance and estimated standard error of
the model, thus inflating the risk of type I errors. A number of researchers have described
methods to overcome this restriction. However, the modern methods of doing so, such as the
use of the Muthen maximum likelihood estimator (MUML), do not allow for the calculation of
random slopes at all levels of the model (Rabe-Hesketh, Skrondal, & Zheng, 2007). In another
example, H. Goldstein and McDonald (1988) developed a method of conducting multilevel SEM
analyses through the use of full information maximum likelihood estimation (FIML). However,
their proposed method is computationally costly and is not readily available in most software

packages (Curran, 2003). Furthermore, the random-effect level variance components are often
underestimated when calculated using FIML-based estimation (Hox, 1998).
Longitudinal mixed-effects modeling.
Longitudinal studies are research designs that utilize repeated measurements. These
types of studies are often conducted to evaluate the effect of some exposure over time through
the use of repeated measurements on the same set of individuals (Albert, 1999). Importantly
modern longitudinal analysis methods allow researchers to adjust their studies for the "cohort
effect" (Caruana, Roman, Hernández-Sánchez, & Solli, 2015). The cohort effect is a
phenomenon where individuals in a common birth cohort exhibit a clustering effect in the
observed level of risk of a certain health outcome. Put more simply, the individuals within the
cohort will have observations that are more similar to one another than to individuals not
included in their cohort (Keyes, Utz, Robinson, & Li, 2010). In longitudinal studies, cohorts are
often referred to as clusters. Furthermore, a subject within a cluster is referred to as a unit
(Garrett M Fitzmaurice et al., 2012). As described above there are a number of accepted
methods of accounting for repeated measures data. However, longitudinal mixed-effects models
have many advantages over some of the other methods discussed in this paper up to this point.
One of the primary factors that drive researchers to use longitudinal mixed-effects
models is the need to develop an understanding of the unique mean trajectory that each unit in
a study displays on the response variable (Garrett M. Fitzmaurice & Ravichandran, 2008).
Longitudinal mixed-effects models lend themselves well to the study of change over time at the
individual and group level (Caruana et al., 2015). These models can also account for the
clustering effects associated with variations in observer measurements, place of residence, and
sampling methodologies (Garrett M Fitzmaurice et al., 2012). Importantly, these models can be
implemented with both continuous and discrete response and or predictor variables (Albert,
1999; Garrett M. Fitzmaurice & Ravichandran, 2008). Furthermore, when compared to
nonrepeated measures models, repeated measure methods such as longitudinal mixed-effects

models have the benefit of allowing for increased power through the reduction of the standard
error on the parameter estimates of the covariates included in the study (Mascha & Sessler,
2011; Zeger & Liang, 1992). Mixed effect models allow researchers to model both the fixed
effects in a study such as treatment effects, along with the within-unit factors (random-effects)
that impact the outcome variable in random and typically difficult to model fashions (Mascha &
Sessler, 2011). Finally, mixed-effects models can be used with unbalanced that are missing at
random (Mascha & Sessler, 2011).
This paper has thus far discussed numerous studies that have examined the effect of
COVID-19-related NPIs on disease transmission. However, many of the studies that have
explored this relationship at the ecological level utilize a cross-sectional study design that does
not account for the effect time (L. Wang et al., 2021). Furthermore, very few studies have
explored how the public health governance structure surrounding these interventions has
affected the ability of these interventions to alter disease transmission trajectories. As a result of
these gaps in the current literature, longitudinal mixed-effects models can be used to account for
the effect of time to address the first aim of this study.
Conceptual framework
Potential models.
There are a number of theoretical frameworks that lend themselves to the study of
government policy. Two notable examples include the social ecological model (SEcM) and the
diffusion of innovation (DOI) theory. The SEcM posits that individual health behaviors are driven
by a combination of intrapersonal, interpersonal, organizational, community, and societal
influences Glanz, Rimer, and Viswanath (2008). One of the strengths of the SEcM is that it
readily lends itself to efforts aimed at designing effective health interventions. This is true
because the SEcM allows health policymakers to simplify the complex interactions and
interrelationships seen in all ecological systems resulting in more easily reached predictions of
potential outcomes as the variables of the system are manipulated (Schmolke, Thorbek,

DeAngelis, & Grimm, 2010). Given that the SEcM is designed to model complex systems, its
inherent flexibility allows it to incorporate constructs from any number of competing and
complementary theoretical frameworks (Sallis & Owen, 2015). However, this flexibility also
complicates efforts to validate models as little instar-study or inter-study standardization is
possible when using the SEcM (Sallis & Owen, 2015). Furthermore, in application SEcM
frameworks often focus on the top-down influences on individual behavior and ignore the factors
that influence the formation and effectiveness of policy from the bottom up (Golden, McLeroy,
Green, Earp, & Lieberman, 2015).
Unlike the SEcM, DOI theory focuses on the process by which individuals become aware
of ideas and behaviors, adopt the ideas or behaviors, and how the ideas are then propagated
through society (Bartholomew, Parcel, Kok, Gottlieb, & Fernandez, 2006). A key construct in the
DOI is the rate of innovation adoption or the speed at which a behavior is adopted (Jimenez-
Mavillard & Suarez, 2020). The rate of adoption is influenced by the nature of the innovation, the
origin of the impetus to adopt the innovation (internal, collective, or external authority), the
method by which information on the innovation is communicated, the nature of the social
system, and the resources that the change agent allocates towards driving change (Rogers,
1995). The DOI has the major advantage over the SEcM of having constructs that can easily be
standardized. As a result, the DOI readily lends itself to mathematical modeling the prediction
generation (Glaziev & Kaniovski, 1991). However, the nature of DOI limits its utilization toward
modeling disease processes, which is the primary aim of this research study.
The Habicht, Victora, and Vaughan Model for Evaluation of the adequacy, plausibility,
and probability of a public health program combines many of the key features seen in the SEcM
while allowing for the study of ecological level public health outcomes while controlling for
potential confounders (Yé et al., 2017). The plausibility component of the model aims to make
claims about the likelihood of an intervention influencing an outcome by assigning an
appropriate comparison group, including confounding variables, in the analysis and defining the

process by which the intervention is thought to drive a change in the outcome beforehand
(Habicht, Victora, & Vaughan, 1999). This model is ideal for studies aiming to conduct statistical
modeling on a disease process while accounting for the influence of confounders and
government policy. As a result, this model has been selected as the most appropriate theoretical
framework to explain the model created to address Aim 1.
Predictive versus explanatory modeling
Predictive modeling.
Statistical modeling generally has two broad aims. These include the predictions or
forecasting and explanation of real-world phenomena. Predictive models aim to develop a
model that optimizes the researcher's ability to make accurate projections about future values of
the predictor variable (Kuhn & Johnson, 2013). Recommendations for predictive models often
include restricting the number of model covariates included in the model due to concerns about
multicollinearity (M. Fisher, 1997) and increasing the predictive power of the model when
applied to future observations (Nally, 2000). However, many state-of-the-art predictive models
especially those that utilize machine learning such as random forest (Hastie, Tibshirani, &
Friedman, 2009) and XGBoost models (W. Li, Yin, Quan, & Zhang, 2019) are able to
successfully accommodate many covariates without reductions in prediction power with new
data. These models are often capable of producing highly accurate projections (Mair et al.,
2000; Peng & Bai, 2018). However, the trade-off for high accuracy is that these models are often
difficult or impossible to explain in terms of the relationship between the covariates and the
outcome (Kuhn & Johnson, 2013).
Explanatory modeling.
Conversely to predictive modeling, explanatory models aim to produce a mathematical
formula that explains the relationship between an outcome and a set of covariates (Nally, 2000).
Unlike predictive models, explanatory models do not sacrifice interpretability for the sake of

more accurate predictions (Kuhn & Johnson, 2013). An underpinning of explanatory models is
that a meaningful a priori relationship exists between the outcome variable and the covariates
that justifies their testing for inclusion in the model (Grace & Irvine, 2020). However, it is often
the case that this idea is ignored by researchers during the model selection process (Anderson
& Burnham, 2004). The current research on explanatory modeling shows that explanatory
models allow for easy interpretation and explanation of observed relationships. However, careful
consideration must be used during the study design process to ensure that valid conclusions
can be drawn from the results.
Social Media COVID-19 Sentiment
Background
Social media has provided public health researchers with a wealth of data that has been
utilized to enhance surveillance systems, study the impact of misinformation, and understand
the impact of novel health inventions (Bisanzio, Kraemer, Brewer, Brownstein, & Reithinger,
2020; Kawchuk, Hartvigsen, Harsted, Nim, & Nyirö, 2020; C. Li et al., 2020; Massaad &
Cherfan, 2020). These studies often utilize a class of artificial intelligence-based methods known
a natural language processing (NLP). NLP is a process that utilizes computers to manipulate
and analyze text data (Chowdhury, 2005; Liddy, 2001). Natural language understanding is a
subcomponent of NLP that aims to extract meaning and context from text documents (Bates,
1995; Chowdhury, 2005). Sentiment analysis (SA) is a specific class of NLU tasks that focuses
on the classification of segments of text based on their polarity (Pang & Lee, 2008).
Furthermore, the polarity of a text can be conceptualized as its tendency to express positive,
negative, or neutral emotions (Zimbra et al., 2018). Another important class of NLU tasks is topic
modeling. Topic modeling aims to algorithmically evaluate a piece of text and attempt to identify
recurring themes by which segments of the text can be grouped or classified (Graham,
Weingart, & Milligan, 2012). These two components (SA and topic modeling) of NLU tasks are
the main focus of the following section of this paper.

SA is a research methodology that has been widely applied to the study of SARS-CoV-2.
This is largely due to the fact that social media applications such as Twitter are a readily
accessible and plentiful source of opinion-related text data. Xiang et al. (2020) found that of the
82,893 tweets in their sample, the majority of them (66.2%) were designed to share a personal
opinion. There are a number of studies that describe public sentiment in relation to SARS-CoV2,
especially during the early phases of the pandemic. In one such example, a of study 574,903
English language tweets generated between March 27th and April 10th of 2020, found that tweets
about social distancing and stay-at-home requirements were more likely to have positive
sentiment than negative (Saleh et al., 2021). This latter finding is supported by actual survey
data. In a study conducted in early May 2020 with 2,402 adults living in New York City and Los
Angeles, researchers found that 79.5% of participants supported the implementation of
nonessential business closures and stay-at-home orders (Czeisler et al., 2020). These studies
indicate that the results of SA research utilizing social media potentially have external validity
and thus could have relevant implications for public health policymakers. However, the authors
of the articles reviewed in this passage fail to highlight this potential relationship.
It is important to note that COVID-19 tweet sentiment is not static in time or in relation to
geography. X. Wang, Zou, Xie, and Li (2020) in their study of COVID-19-related tweets in
California tended to be more negative than tweets generated in New York. Other researchers
have also found geographic variations in sentiment. A descriptive analysis found that Oklahoma,
South Dakota, Tennessee, Minnesota, Wisconsin, Montana, and Missouri were associated with
the highest average positive sentiment rating toward ending COVID-19-related stay-at-home
orders and business closures (Rahman et al., 2021). On the other hand, according to Rahman
et al. (2021), the US states of Nebraska, Vermont, Utah, New Hampshire, Illinois, Maine, and
Rhode Island recorded the highest levels of negative sentiment toward ending the two COVID19
NPIs. Furthermore, public sentiment in the US states of California and New York has been found
to change over time (X. Wang, Zou, et al., 2020). However, the location and timing of tweet

generation are not the only factors to consider when conducting COVID-19-related SA. The type
of tweet being generated is also an important variable to evaluate. In a study of tweets and
retweets, Chakraborty et al. (2020) found that unique tweets tended to be associated with
positive sentiments, while retweets had a tendency to be more negative in sentiments.
The available literature seems to indicate that real-world COVID-19-related events
influence online sentiment and activity. Researchers have reported that there exists a positive
correlation between the number of confirmed cases in a state and the number of COVID-19
tweets about telehealth (Massaad & Cherfan, 2020). However, the researchers used the raw
counts for both variables in this analysis. As a result, the reported correlation is most likely
attributable to differences in each state’s population numbers. Despite these limitations, other
researchers lend support to the conclusion of these authors. In their study of COVID-19-related
tweet sentiment, X. Wang, Zou, et al. (2020) noted that significant political and news events,
along with major disease transmission milestones tended to co-occur with US state-level
changes in sentiment. While the overall evidence in support of the influence that SARS-CoV-2
events have on online sentiment is not strong, it is reasonable for researchers to assume that
the relationship exists. As a result, accounting for the potential of real-world events to influence
online sentiment is essential when attempting to explore the effect that online sentiment has on
real-world events.
While there is an abundance of COVID-19-related SA research available there are a
number of important limitations with the current state of this literature. The first issue that is
apparent in the available literature pertains to the methods used. A number of these studies
utilize older lexicon-based methods when conducting SA (Kamiński et al., 2021; Massaad &
Cherfan, 2020; Rahman et al., 2021; Saleh et al., 2021; Samuel et al., 2020). Lexicon-based
methods utilize dictionaries of terms that have assigned an emotional weight so they can be
matched to words included in the text being studied to associate those words with an emotion
(Thelwall et al., 2011). Lexicon-based methods are relatively easy to implement and interpret but

are associated with low levels of accuracy largely due to their inability to account for words not
included in their dictionary (Zimbra et al., 2018). Another important limitation is that the available
studies often fail to account for many of the key limitations of Twitter data namely frequent
misspellings, use of special characters, and incomplete data (Keerthi Kumar & Harish,
2018).
It has been understood for some time that Latent Dirichlet Allocation (LDA) was designed
to be used with longer text documents (Hong & Davison, 2010; X. Li, Li, Chi, &
Ouyang, 2018; Martínez-Cámara, Martín-Valdivia, Ureña-López, & Montejo-Ráez, 2014; W. X.
Zhao et al., 2011). Standard LDA topic models have been found to not be ideal for use with
Twitter data due to the short nature of tweets (W. X. Zhao et al., 2011). As a result, researchers
interested in conducting topic modeling or SA with microblog data, such as Twitter, need to
utilize a methodology that can accommodate the shorter nature of tweets. Despite this fact, the
majority of articles included in this literature review utilized the LDA algorithm when conducting
topic modeling on Twitter data (Saleh et al., 2021; Shi et al., 2020; X. Wang, Zou, et al., 2020;
Xiang et al., 2020; Xue et al., 2020). The methodological limitations seen in the literature raise a
number of serious concerns about both the internal and external validity of the results.
Finally, perhaps the most significant limitation found in the current COVID-19-related SA
research is a lack of discussion on the public health significance of reported research findings
and a lack of focus on how or if online sentiment is relevant in relation to public health. Only a
single article reviewed for this portion of the literature review described how their research could
be used to direct public health decision-making (Broniatowski et al., 2018). The limitations
outlined above demonstrate the need for further research which not only addresses the
described methodological limitations but also attempts to determine if SARS-CoV-2 SA research
can have public health significance. It is for these reasons that this study aims to conduct a
study on COVID-19-related SA study using Twitter data to address the second aim of this
research project.

Analysis methodology
Preprocessing.
Text preprocessing is designed to reduce the number of unique words present in a
corpus (Uysal & Gunal, 2014). Preprocessing can include letter case normalization, stop-word
removal, N-gram creation, abbreviation expansion, stemming, lemmatization, removing web
addresses and hashtags, and spelling correction (Hacohen-Kerner et al., 2020). In NLP a stop
word is any word that commonly appears in high frequency in any body of texts (e.g., a, the,
you, and, is, for) (Jurafsky & Martin, 2019). An N-gram is a grouping of single words to form an
important compound term that provides more meaning than the single words do independently
(Camacho-Collados & Mohammad, 2018). For example, the words ‘New’ and ’York’, or ’hole’,
’in’ and ‘one’ provide less information about the intent or meaning of the writer on their own than
the compound terms “New-York” (bi-gram) and “hole-in-one” (tri-gram) do.
Stemming and lemmatization are two preprocessing steps that are very similar, but
distinct nonetheless (Toman, Tesar, & Jezek, 2006). Stemming is a blunt method of reducing the
number of unique words in a text by removing all suffixes and being left with the central
morpheme of a word (Jurafsky & Martin, 2019). Lemmatization, on the other hand, is the
process of taking a word and reducing it to its common root word (Jurafsky & Martin, 2019;
Toman et al., 2006). A lexeme is any set of words that share meaning and can be altered to take
the form of a common root term or lemma (Fenlon, Cormier, & Schembri, 2015). For example,
when utilizing the Natural Language Toolkit (NLTK) WordNet lemmatizer the nouns contracting
and contracts are a lexeme that shares the lemma contract. Lemmatization and stemming have
their own benefits and drawbacks. Stemming is often considered a simple process to
implement, but this simplicity can also lead to the over-generalization of stemmed terms
(Jurafsky & Martin, 2019; Porter, 1980). On the other hand, lemmatization algorithms can be
fairly complex accounting for factors such as part of speech, morphology, or context (NLTK,

2022; spaCy, 2022). However, neither method has been found to be universally beneficial to all
NLP tasks (Toman et al., 2006). NLP researchers need to understand when these methods are
appropriate in order to produce the most accurate models.
Stemming and lemmatization are widely utilized methods of preprocessing when
conducting sentiment analysis and topic modeling (Chakraborty et al., 2020; Massaad &
Cherfan, 2020; Rahman et al., 2021; Samuel et al., 2020; X. Wang, Zou, et al., 2020).
Nonetheless, when conducting text classification, stemming and lemmatization have actually
been found to hurt model accuracy (Toman et al., 2006). A number of researchers have found
similar null effects of stemming on improving classification models (Méndez, Iglesias,
FdezRiverola, Díaz, & Corchado, 2006; Pomikalek & Rehurek, 2007). When used in sentiment
analysis, lemmatization has consistently been found to be one of the least beneficial
preprocessing steps researchers have used (Camacho-Collados & Mohammad, 2018). Certain
researchers have found that stop word removal did not significantly improve model accuracy, but
did reduce the processing time (Hacohen-Kerner et al., 2020; Toman et al., 2006). On the other
hand, N-gram creation has consistently been found to be one of the most beneficial
preprocessing steps when attempting to improve model accuracy (Camacho-Collados &
Mohammad, 2018). While not all methods of preprocessing improve NLP model accuracy,
certain preprocessing steps (i.e., case normalization, URL removal, N-gram creation, and
spelling correction) have been reliably found to be beneficial (Camacho-Collados & Mohammad,
2018; Hacohen-Kerner et al., 2020; Jurafsky & Martin, 2019; Toman et al., 2006). However, it
should be noted that many modern machine learning based methods have made certain
preprocessing sets obsolete. This is true for neural network-based models and N-gram creation
along with transformer-based methods such as the BERT and stop-word removal (Jurafsky &
Martin, 2019; Qiao et al., 2019).
Sentence and word embeddings.

The creation of embeddings, also known as vector transformation or vectorization, is a
required step for any NLP project. Embedding can represent an entire document (embedding), a
sentence (sentence embedding), and a word (word embedding). An embedding is simply a
collection of sentence or word embeddings. A sentence embedding is a mathematical
representation of a text string or sentence (Lai, Liu, He, & Zhao, 2016). Sentence embeddings
can capture varying levels of details about the sentences they represent. The selection of an
embedding methodology is one of the most critical steps in any NLP project as the
sophistication of the embedding has a large impact on the quality of the model results and the
types of questions that can be answered with the data (Turian et al., 2010).
Bag of words encoding is a simple embedding method that represents words in a string
as ones and zeros (Jurafsky & Martin, 2019; Pang & Lee, 2008; Qiu, Jiang, & Chen, 2020). For
example, if a researcher were attempting to transform the sentence, “I live in New York” into a
bag of words vector results are represented in Table A.1. Now, if the same researcher wanted to
add a transformation of the sentences, “I visited New york last year while on vacation” and “I
love New York” those results are represented in Table A.2. Note that a sentence in this NLP
example is referred to as a document.
Table A.1. Representation of a bag of words sentence embedding.
I
live
in
New
York
Doc 1
1
1
1
1
1
Table A.2. Representation of a bag of words embedding.
I
live
in
New
York
visited
york
last
year
while
on
vacation
love
Doc 1
1
1
1
1
1
0
0
0
0
0
0
0
0
Doc 2
1
0
0
1
0
1
1
1
1
1
1
1
0
Doc 3
1
0
0
1
1
0
0
0
0
0
0
0
1
Note. Doc = Document
As can be seen in the tables above as more documents are transformed bag of words
encoding can produce extremely large and sparse matrixes. The sparsity problem is
represented in Table 2 where nearly 70% of the cells for Document 3 are zeros and thus add to
the required size of the matrix without providing any additional information. Also, in the example

above stop-words such as “I”, “on”, and “in” were not removed. Furthermore, the letter case of
the words was not standardized. As a result, “York” and “york” are treated as two different words
requiring two different entries in the matrix. These facts highlight the need for careful
preprocessing of text when utilizing bag of words encoding. However, it is well established that
this method in general is subject to the sparsity problem and poor model results when rare or
new words are encountered (Turian et al., 2010).
It should also be noted that words are added to a bag of words matrix in the order in
which they are encountered and the presence or absence of a word in a document is the only
information captured about the word. This means that all of the information about the context in
which the word is used will be lost. As a result, bag of words encoding is unable to make
important distinctions in word meaning that are context-dependent. For example, in the
sentences, “I like to cook” and “I am a cook” bag of words encoding would determine that the
word “cook” serves the same purpose in both examples, even though this is clearly not the
case. The continuous bag of words (CBOW) model addresses many of the limitations of
standard bag of words models by accounting for the context in which words occur (Mikolov,
Chen, Corrado, & Dean, 2013) Fortunately, like the CBOW other more advanced methodologies
have been developed that address many of the limitations associated with bag of words
encoding.
Term frequency times inverse document frequency (TF-IDF) encoding addresses one of
the major limitations of bag of words encoding by reducing the influence that high-frequency,
low-information words have on the model results (Jones, 1972). The term frequency (TF)
component of TF-IDF encoding is the number of times a word or term t appears in a document d
(Jurafsky & Martin, 2019). Inverse document frequency (IDF) is the inverse of the number of
documents in which a word t is present across the entire dataset (Salton & Buckley, 1988). For
each word being encoded the TF and IDF are multiplied to determine the weight that will be
assigned to the word, within the matrix. As a result, a word will be assigned a high weight if it is

very common in a particular document (high TF), but uncommon across the dataset (high IDF)
(Turney & Pantel, 2010).
The TF-IDF weighting scheme reduces the importance of words that are common in a
document and across the entire data set. Despite this advantage, similar to bag of words
encoding TF-IDF encoding is often associated with the creation of very large, sparse matrixes
(Jurafsky & Martin, 2019). Also, TF-IDF matrixes are not able to capture information about the
syntactic context in which words are used (Z. Zheng & Qian). Both bag of words and TF-IDF
embeddings utilize a localist representation in which, within each sentence embedding each
term is represented by a single cell, as is shown in Tables A.1 and A.2 above (Liddy, 2001). As
shall be discussed, localist representations have many disadvantages when compared to
distributed representations.
Alternatives to TF-IDF encoding which do account for context do exist, such as pointwise
mutual information (PMI). PMI encoding utilizes the ratio of the observed joint probability of two
words appearing next to one another in a text over the expected joint probability if the words
appeared independently of one another (Jurafsky & Martin, 2019). PMI embeddings are
important in sentence completion, information retrieval, and semantic similarity-related tasks
(Turney & Pantel, 2010; Woods, 2016). Word2vec is a neural-network-based embedding
methodology that utilizes a distributed representation of a word in order to capture the semantic
and syntactic qualities of the term (Mikolov, Sutskever, et al., 2013; Nozaki et al., 2019). The
importance of the syntactic context of a word is best captured by the Firth (1957) quote, “You
shall know a word by the company it keeps”. In simple terms, Word2vec embeddings function by
ensuring that words that are used in similar contexts have numerically similar vector
representations. For example, in the sentences, “I enjoy petting my dog” and “I enjoy petting my
cat” the words cat and dog are used in similar contexts. That is, they appear in the same place
in both sentences in relation to the words, “I”, “enjoy”, “petting, and “my”. If cat and dog
appeared in similar contexts throughout a dataset then, when encoding these two words

Word2vec will assign them vectors with values that are more similar than vectors for words that
do not appear in similar contexts.
Word2vec encoding utilizes two algorithms skip-gram or continuous bag of words
embeddings to represent the words in a document initially. Continuous bag of words embedding
is used when the NLP task is designed to predict a word, based on the context (Qiu et al.,
2020). However, skip-gram encoding is ideal in the opposite situation, or when a prediction of
the context words around the initial input word is the desired output (Mikolov, Chen, et al., 2013).
Both encoding strategies can then be improved by using either a hierarchical softmax, negative
sampling, or naïve softmax optimization routines. The optimization process begins by assigning
random weights to a researcher-defined number of nodes within the neural network. For each
document vector being transformed, the cells are all passed through a node in order to assign
them a weight and ultimately generate model predictions. During optimization, the algorithm
evaluates the difference between the predicted values and the actual data. The algorithm then
alters the weights of each node in the neural network with the goal of reducing the difference
between the prediction and observed values through a process called back propagation of error
(Savytska, Vnukova, Bezugla, Pyvovarov, & Sübay, 2021).
Word2vec models produce matrices that store information in an efficient manner. The
final matrices created by the Word2vec algorithm are always dense. That is, every cell of a
Word2vec matrix will include some information about the text it was created to represent. This is
a major advantage over both bag of words and TD-IDF encoding. The Word2vec optimization
routine also allows for the capture of important information about the context in which the word
occurs. This addresses one of the major limitations associated with localist word representation
embeddings (Chopra & Bangalore, 2011). Furthermore, Word2vec embeddings allow
researchers to use distributional similarities by evaluating the cosine distance between the
transformed representation of two terms on an n-dimensional vector (Jurafsky & Martin, 2019).

This application is important for tasks such as information retrieval, sentence completion, and
sentiment analysis (Hao et al.; Tang, 2016; Van Nguyen, Nguyen, Phan, Nguyen, & Nguyen; Z.
Wang & Zhang).
One of the main limitations of Word2vec models is that they can be computationally
costly to train (Di Gennaro et al., 2021; Jansen, 2017). Furthermore, Word2vec embeddings
ignore word order, which is important when attempting to complete syntactic tasks (Ling, Dyer,
Black, & Trancoso, 2015). The final encoding methodology that will be covered in this paper is
BERT which outperforms many other encoding methodologies on a variety of NLP tasks (J.
Zheng et al., 2020). Like Word2vec, BERT was created by developers at Google (Devlin et al.,
2018). BERT is an attention-based encoder-decoder transformer (Vaswani et al., 2017). The
encoder component of BERT is responsible for producing the mathematical representations of
the input. In the context of the current research project, this input would be text. However, BERT
transformers could be used with images also. The encoder also captures information about the
context of words by incorporating positional encoding vectors. The vectors are then passed
through an encoder layer, which applies a relational factor (attention), scaling, and
standardization to the output vectors. Attention is a mathematical representation of how
important words are in the context in which they appear (Vaswani et al., 2017).
BERT takes into consideration both the spelling and context of a word when creating
embeddings. This leads to larger embedding, but better accuracy than spelling-only
embeddings. This makes computations using BERT more computer resource-intensive, but the
trade-off inaccuracy is often worth the increased runtimes. BERT has been found to improve
language models that aim to extract information from medical records (Z. Lu et al., 2021). The
utilization of BERT has been found to improve SA model accuracy, recall, and F1 by over 2% on
average (J. Zheng et al., 2020). Importantly, BERT has also been associated with higher levels
of model accuracy when conducting text classification with Twitter data (W. Wang et al., 2019).
BERT is a state-of-the-art transformer that is ideal for conducting SA tasks using Twitter data.

Conceptual Framework
Two theoretical frameworks can be used to explain the hypothesized relationships
proposed in this study. In the first relationship, this study expects to find that state-level
sentiment will influence the stringency level of implemented COVID-19 NPIs. There are a
number of frameworks that could be used to describe the connection between individual-level
opinions and societal-level policy decisions including the SEM. However, ecological models
such as the SEM are often understood to have a top-down directionality of influence (Langille &
Rodgers, 2010). A model which allows for interventions to be adapted based on information that
is received from the individual-level would be more appropriate to direct this research study. As
a result, the Pérez et al. (2015) fidelity-adaptation framework for adaptive interventions is
appropriate for use in the context of this study.
In 2007 Carroll et al. (2007) first presented the implementation fidelity framework. The
framework originally described by Carroll et al. was designed to allow researchers to explain
and gain an understanding of how and why interventions work or don’t (Carroll et al., 2007).
Carroll and colleagues believe that evaluating an intervention based on the observed level of
fidelity is the only way to identify potential problems with implementation. Fidelity in this context
applies to how closely the implementation of an intervention matches the design of the
intervention planners (Carroll et al., 2007; Dusenbury, 2003). The fidelity-adaptation framework
focuses on evaluating the effectiveness of intervention implementation. This framework also
recognizes that while the implementation can influence the intervention outcome there are also
other non-fidelity-related factors that also influence the outcome. This relationship is represented
by the dashed line in Figure A.1. The framework as defined by Carroll et al. (2007) includes the
invention content, potential modifying factors, the fidelity or adherence level, outcomes, outcome
evaluation, fidelity evaluation, and essential component analysis as constructs. In this
framework, the essential component analysis and the potential modifying
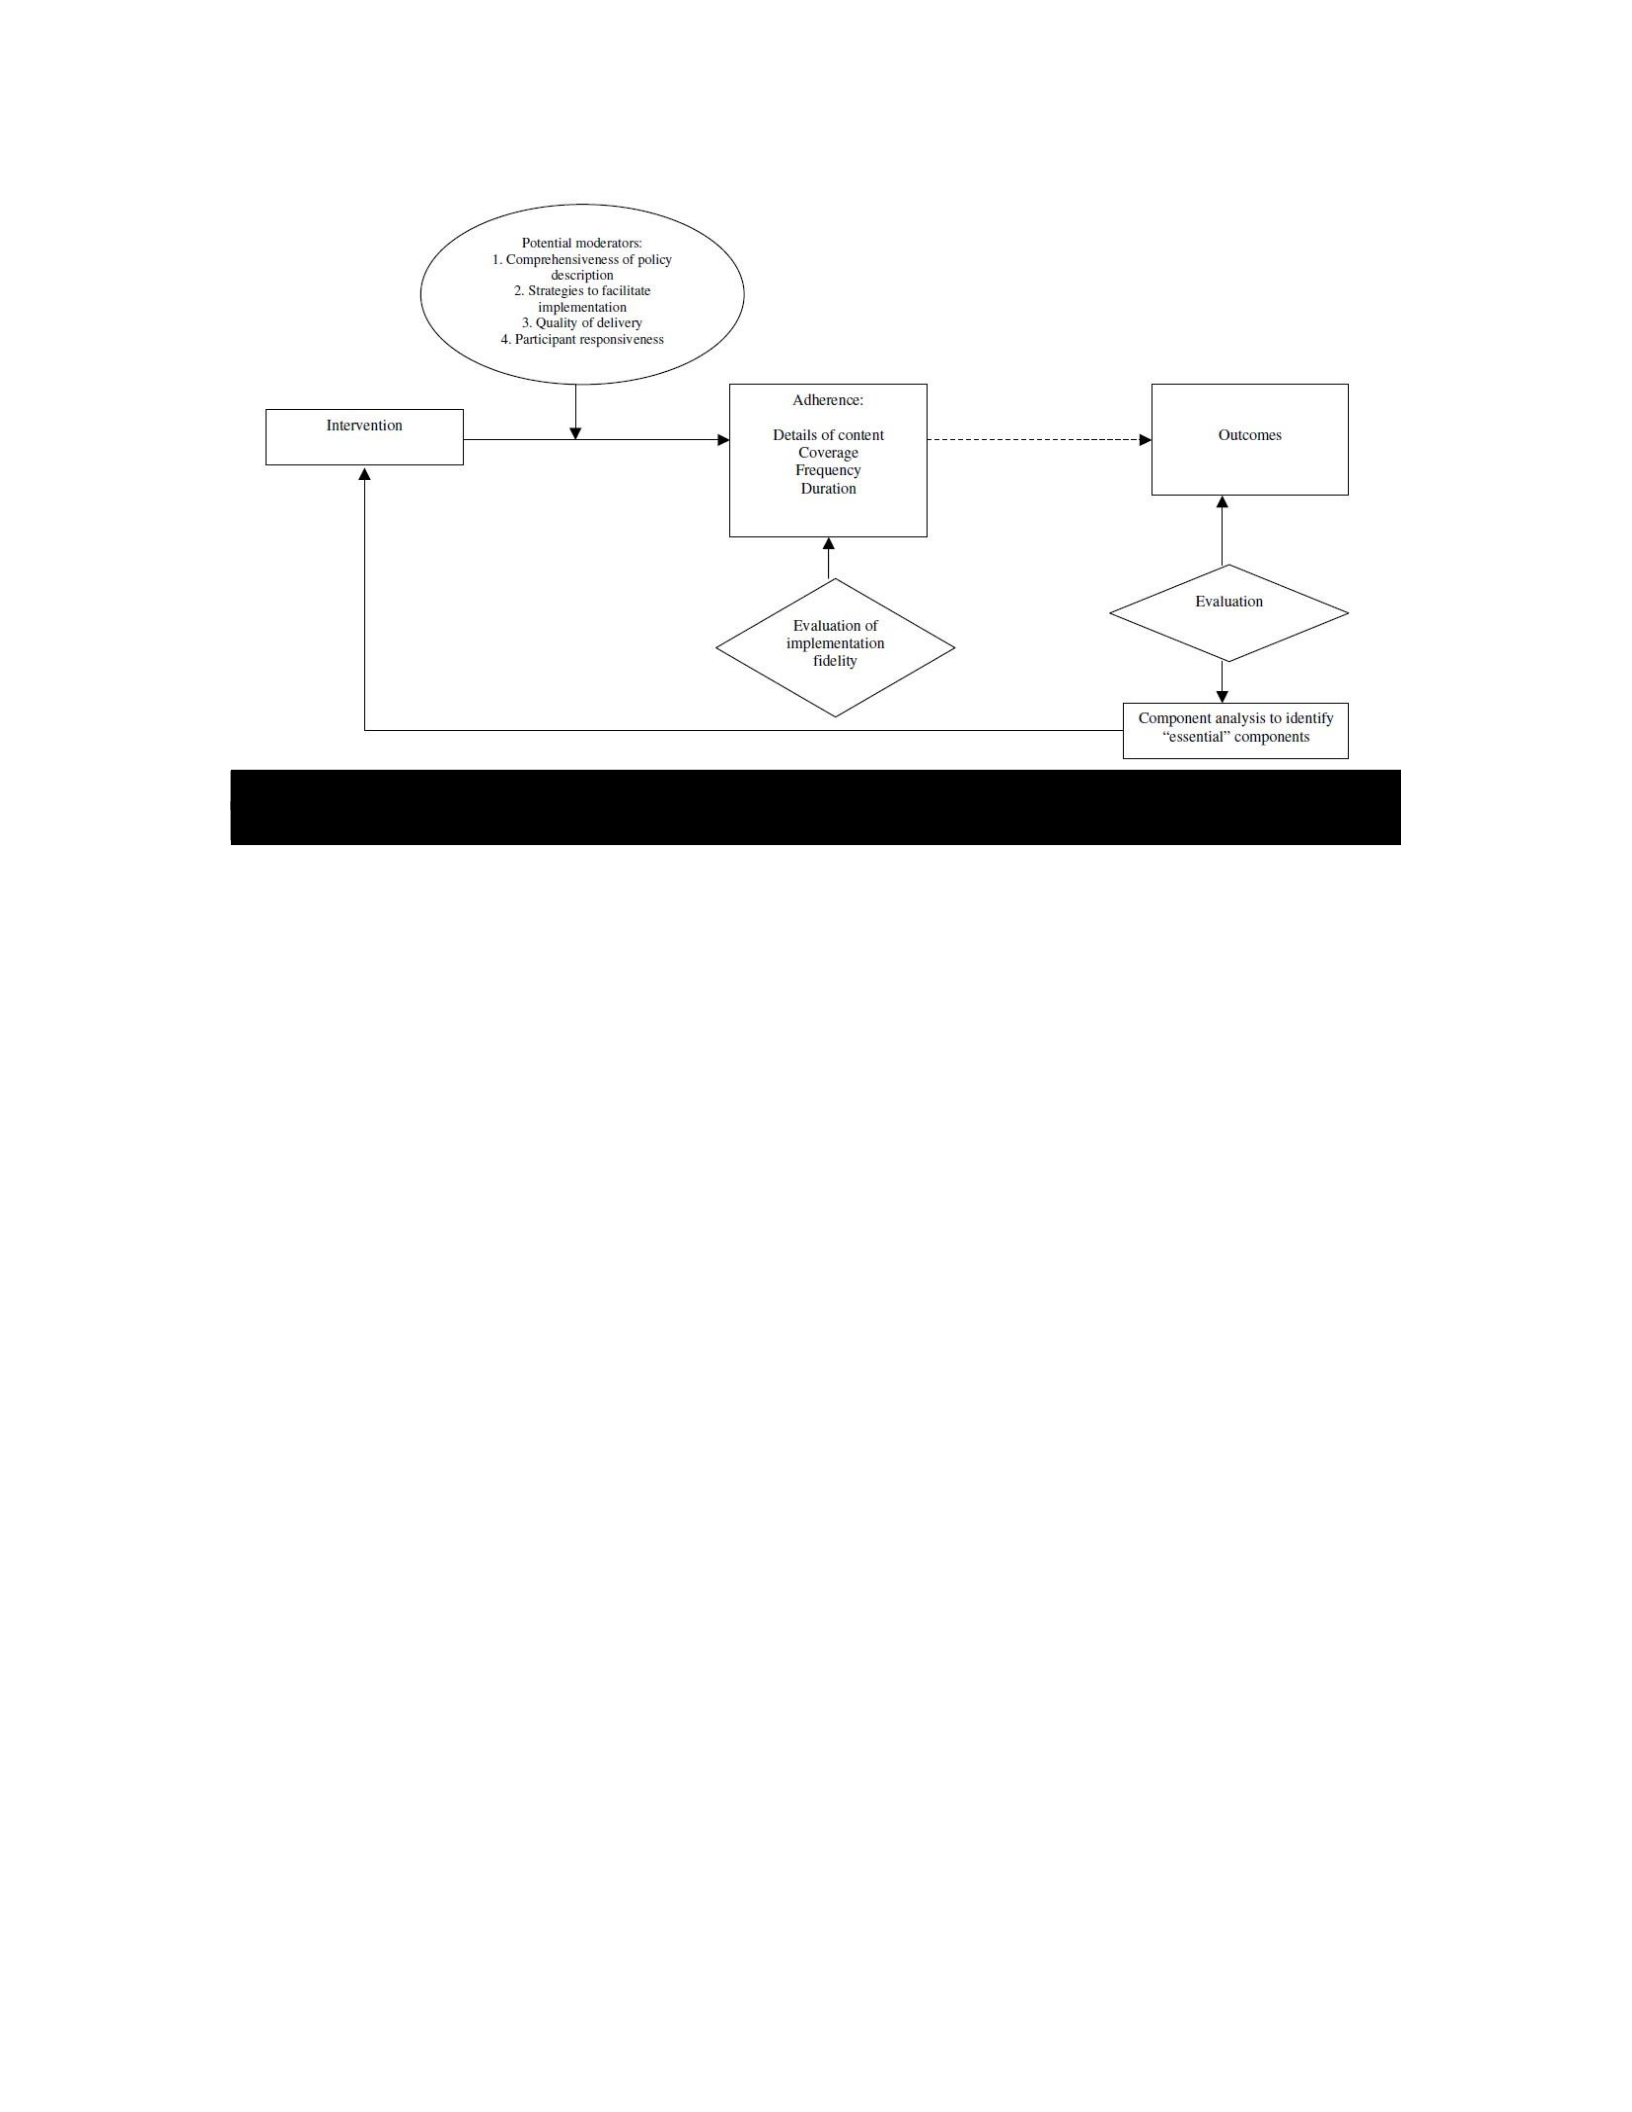
factors are the only constructs capable of influencing the fidelity of the intervention. This
restricted list of influential factors is likely to exclude important elements.
Fortunately, a number of researchers have continued to build on the work presented by
Carroll et al. (2007) in an effort to address some of the limitations of the framework (Pérez et al.,
2015; von Thiele Schwarz et al., 2015). Pérez et al. (2015) propose the utilization of the
fidelityadaptation framework for adaptive interventions as a modified version of the
implementation fidelity framework presented by Carroll et al. (2007). Pérez et al. (2015) expand
on the implementation fidelity framework by allowing the interventions to be modified to better fit
conditions on the ground as interventions are in operation. Importantly, Pérez et al. (2015) note
that adaptions of the invention do not always positively impact the effectiveness of the
intervention. A major strength of the fidelity-adaptation framework is that it differentiates between
implementation and intervention effectiveness. This is an important distinction to make in the
context of COVID-19 NPIs. As there this paper has shown, there is an abundance of research
that shows certain COVID-19-related NPI control measures are effective in reducing disease
transmission (e.g stay-at-home orders and non-essential business closures). However, the
impact of these interventions has been shown to be affected by the method in which they are
Figure
A.1
diagram of the Implementation fidelity framework.
Source:(Carroll et al., 2007)

implemented (Barberia, Cantarelli, Oliveira, Moreira, & Rosa, 2021). As a result, utilizing a
model such as the fidelity-adaptation framework which can account for this observed effect
along with the hypothesized bottom-up effect of public opinion is ideal.
Appendix B: Supplemental Content for Manuscript One
Table B.1. List of counties missing mobility data.
Holmes
Hamilton
Glades
Gulf
Calhoun
Union
Franklin
Jefferson Dixie
Madison
Lafayette
Gilchrist

