


CHAPTER 1
INTRODUCTION
Since the founding of the Public Company Accounting Oversight Board (PCAOB)
in 2002, audit firm inspection reports have shown that audit quality is inconsistent at the
firm level, office level, and engagement team level (PCAOB, 2015). In light of these
inconsistencies, the PCAOB established a project in 2013 involving regulators,
professionals, and academics to “identify a portfolio of quantitative measures of public
company auditing (called indicators), whose consistent use may enhance dialogue about
and understanding of audits and ways to evaluate their quality; and to explore how and by
whom the portfolio of indicators can best be used” (PCAOB, 2015, 2). The resulting
portfolio identified 28 potential audit quality indicators (AQIs), grouped by audit
professionals, audit processes, and audit results (See Table 1). The
PCAOB’s feedback from regulators, professionals, and academics showed that key areas
for future discussion on audit quality should include experience (AQI 6), workload (AQI
2-3), and human capital (AQI 1, 4-5, 8), all of which focus on the professionals
conducting the audit engagement.
The PCAOB places a high level of scrutiny on audit engagement quality to ensure
that users have the best possible financial information with which to make better and more
confident decisions (Fellner & Maciejovsky, 2007; Nelson, 1970; Akerlof, 1970).
However, the PCAOB commonly focuses on auditor reporting, client characteristics, and

audit firm internal quality control systems in its evaluation of audit quality, rather than the
characteristics and backgrounds of the audit professionals at the firm.
TABLE 1
PCAOB Audit Quality Indicators (PCAOB, 2015, p. 13)
1
2
3
4
5
6
7
8
9
10
Staffing Leverage
Partner Workload
Manager and Staff Workload
Technical Accounting and Auditing Resources
Persons with Specialized Skill and Knowledge
Experience of Audit Personnel
Industry Expertise of Audit Personnel
Turnover of Audit Personnel
Amount of Audit Work Centralized at Service Centers
Training Hours per Audit Professional
11
Audit hours and Risk Areas
12
Allocation of Audit Hours to Phases of the Audit
13
14
15
16
17
18
19
Results of Independent Survey of Firm Personnel
Quality Ratings and Compensation
Audit Fees, Effort, and Client Risk
Compliance with Independence Requirements
Investment in Infrastructure Supporting Quality Auditing
Audit Firms' Internal Quality Review Results
PCAOB Inspection Results
20
Technical Competency Testing
21
22
23
24
25
26
27
Frequency and Impact of Financial Statement Restatements for Errors
Fraud and Financial Reporting Misconduct
Inferring Audit Quality from Measures of Financial Reporting Quality
Timely Reporting of Internal Control Weaknesses
Timely Reporting of Going Concern Issues
Results of Independent Surveys of Audit Committee Members
Trends in PCAOB and SER Enforcement Proceedings
28
Trends in Private Litigation

U.S. studies often attempt to measure audit quality using Big 4 office fees, client
characteristics including financial reporting and audit outcomes, and audit engagement
problems (Knechel, Pevzner, Shefchik, & Velury, 2013; DeFond & Zhang, 2014).
Knechel et al. (2013), in addition to the PCAOB, also called for extended research
on audit quality by uncovering new sources of data inputs for audit department personnel
that might better evaluate why audit quality is inconsistent. Historically, archival studies
have had difficulty in peeling back the layers of the Big 4 office to delve further into its
individual auditor characteristics as information about audit department personnel is not
publicly disclosed by Big 4 firms in the U.S (Knechel et al., 2013; Francis, 2011).
Utilizing a uniquely compiled data source, the overarching purpose of this study is to
investigate the following question: what is the impact of Big 4 office auditor human
capital, auditor experience, and auditor workload compression on audit quality? This
study addresses the question in a fashion that heretofore has been limited in the U.S.
Rather than solely using external office characteristics such as the number of
clients or total fees, this study includes audit department personnel inputs. Typically, Big
4 office personnel have been examined using experimental methods or by using available
partner information in non-U.S. countries (Cahan & Sun, 2015; Gul, Wu, & Yang, 2013).
While these studies provide some insights, they are often limited to either partner level
analysis or the internal validity of experimental studies trades-off for external validity.
That is, from these studies, we are unable to draw implications about how audit
department level personnel influence audit quality. Therefore, using established measures
of audit quality that are discussed in detail in Chapter 3, and a unique dataset, Big 4 office
personnel are examined at the audit department level, described below.

Audit Human Capital. Human capital refers to the human resources available to
each Big 4 office. This study will examine the relationship between audit human capital
available at each office and audit quality, based on the total audit department headcount
compared to the total office headcount; the headcount of partners, principals, senior
managers, managers, senior associates, and associates compared to the total audit
department headcount; and the influence of education on the quantity and quality of
partners, principals, senior managers, managers, senior associates, and associates available
in each audit department.
Experience. Experience refers to the personal tenure of each Big 4 professional.
This study will examine the relationship between audit personnel experience in each
office and audit quality, based on audit partner, principal, senior manager, manager, senior
associate, and associate experience in years at the audit office; at the audit firm; and as an
auditor regardless of the audit firm.
Workload. Workload refers to the volume of audit engagements at each Big 4
office. This study will examine the relationship between auditor workload and audit
quality, based on the number of audit clients compared to the total audit department
headcount for each office, and the fiscal year-end groupings of audit clients compared to
the headcount of audit partners, principals, senior managers, managers, senior associates,
and associates for each office.
The models for this study include numerous control variables to mitigate the
indirect effects of client engagement and auditor risk factors. The study is limited by the
data source for audit department-level auditor characteristics. The Big 4 audit
department-level data comes from LinkedIn (using a Premium version which provides
advanced search options and more complete profile information) with profiles populated
by individual employees of the Big 4. The assumption is made that individuals placing

their information on LinkedIn have incentives to ensure the information is accurate and
credible as the hosting organization provides networks and career opportunities to both
employees and employers, and serves as a reference check site for human resource
managers (Brown & Vaughn, 2011; Zide, Elman, & Shahani-Denning, 2014). In addition,
the Big 4 encourages their current employees and alumni to establish and maintain
LinkedIn profiles connected to the official LinkedIn Big 4 groups, knowing that these
individuals often go on to achieve influential positions at companies that have the
potential to become future clients2. To provide some validity to the data extracted, the
LinkedIn personnel data is compared to data provided by a Big 4 office, Form AP data,
and headcount information listed on a Big 4 firm website. The study is also limited by the
sample year as the data provided in LinkedIn is at a point in time and the data is extracted
for this study in 2018.
This study adds to the body of literature analyzing Big 4 audit quality. Academic
research continues to present a tension surrounding Big 4 audit procedures and
inconsistent audit quality among audit offices in each Big 4 firm (Reynolds & Francis,
2000; Choi, Kim, Kim & Zang, 2010). The PCAOB requires registered audit firms to
maintain a system of quality controls relative to the audit function, to ensure that proper
professional and ethical standards are being followed (PCAOB CQ Section 20), and to
ensure that firm practices, procedures, and reporting standards are consistently applied at
each audit office in accordance with firm audit methodology (Our System of Audit
Quality Controls, 2015; Our Commitment to Audit Quality, 2017; Our Focus on Audit
Quality, 2017; U.S. Audit Quality Report, 2016). Yet, academic research findings and
PCAOB inspections indicate that firm practices, procedures, and reporting standards are
not consistently applied to all offices due to the sharing of information and experiences
among peers, and because organizational leaders will develop personal best practices that

may differ by location (Diaz, Martin & Thomas, 2017; Francis & Yu, 2009; Francis,
Michas, & Yu, 2013; Hambrick & Mason, 1984). The result is that higher audit quality is
purported to occur at offices with the most audit human capital and/or the most auditor
experience. This study extends the academic research on audit quality by being among
the first to examine in detail the audit human capital characteristics at the Big 4 office
level and audit staff personnel level.
This study makes a significant contribution to the profession and to regulators by
providing information about audit staff that can form audit engagement teams. The Wall
Street Journal recently expressed concerns that “high-profile cases keep emerging in
which significant issues or fraud get past an auditor” (Rapoport, 2018). The PCAOB firm
inspection reports support these concerns, showing that uneven audit quality is occurring
among audit firms; offices within the same firm; and engagement teams within the same
office. Past-PCAOB member Steven Harris recently stated that he believed uneven audit
quality occurred largely because of the individuals performing the audit due to “poor
supervision, failure to exercise appropriate professional skepticism, ignoring contradictory
evidence, poor audit planning, lack of training or knowledge of audit personnel, and tight
deadlines” (Harris, 2016). In public practice, audit quality is typically measured directly
through annual external inspections (PCAOB, 2004). In these inspections, members of
the PCAOB organization examine the workpapers, reports, and methodologies of the firm
to determine if the audit was conducted properly in accordance with the applicable
auditing standards. While the overall findings of the inspections are made public, certain
information regarding the specific firm office is not released. The PCAOB has indicated
that they have incorporated the 28 AQIs into their programs to make their inspections
more robust (PCAOB, 2017). The results of this study may be helpful to the PCAOB as it
considers its recommendations for enhancing the quality of the audit.

The remainder of this paper is organized as follows: Chapter 2 discusses prior
relevant research and develops the hypotheses. Chapter 3 presents the research design,
sample and data sources, and discusses the proposed analyses. Chapter 4 discusses data
analysis and presents the results. Chapter 5 provides a summary and conclusion, and
identifies limitations and opportunities for future research.

CHAPTER 2
LITERATURE REVIEW AND HYPOTHESES
The Importance of Audit Quality
In 1976, Jensen and Meckling expanded on management/stockholder information
asymmetry with their seminal theory of the firm. According to their theory, management,
as agents, is presumed to act on behalf of shareholders, the principals (Jensen &
Meckling, 1976). Although shareholders have an expectation that management will make
strategic decisions that increase value, generate cash flows, and manage operations in
accordance with company policy, management may act in its own best interest to achieve
personal goals. Users are often unaware of management’s self-serving behavior due to
information asymmetry. This problem is called agency cost and can be mitigated by
intermediation of external auditors, who are often paid significant fees to provide high-
quality audits of the financial statements.
Audit quality has been historically defined as both the ability of an auditor to
discover financial reporting issues and the willingness to report them (DeAngelo, 1981).
As the body of literature surrounding audit quality has grown, researchers have
developed numerous ways to measure external audit quality to varying degrees. To more
precisely organize the myriad characteristics that define audit quality, Francis (2011)
developed a framework of analysis units, consisting of audit inputs, audit processes,
accounting firms, guidance, audit industries and markets, institutions, and economic

9
8
consequences of audit outcomes. Knechel et al. (2013) extended Francis’s (2011)
primarily archival synthesis to include behavioral, experimental, and survey research,
while further developing the concepts by which inputs, processes, and outcomes indicate
audit quality. Both studies note that the most difficult area to study is audit inputs since
information about the audit engagement team planning and procedures, audit department
composition, and individual auditor experience have historically been difficult to gather
due to its personal or proprietary nature.
Because the nature of auditing necessitates individual judgments, it is natural that
audit quality is highly dependent on the inputs of individuals performing the audit. As
Knechel et al. (2013, 391) state: “The ability to make sound judgments directly
influences the quality of the audit, so the better the personnel, the better the outcome of
the audit is likely to be.” Auditor judgments are often influenced by the conflicting
pressures of client-desired outcomes and potential regulatory or reputation risks (Haynes,
Jenkins, & Nutt, 1998), although auditors with greater overall and industry-specific
experience are better able to withstand client pressures and thus make higher quality
decisions (Frederick & Libby, 1986; Beck & Wu, 2006). However, the firms themselves,
and offices within the firms, must be able to find the appropriate individuals in order to
mollify the audit quality deterioration that can occur due to budget overruns and
busyseason time compressions (DeZoort & Lord, 1997; McDaniel, 1990). Thus, the
ability of firms to achieve high audit quality is directly influenced by their ability to
accumulate the right amount and composition of human capital.

10
Audit Human Capital and Audit Quality
The theory of human capital suggests that skills and knowledge have value to a
firm and that this valuable investment is made due to a conscious effort from the firm
(Schultz, 1961). Human capital can be acquired and/or it can be developed internally.
The majority of Big 4 human capital acquisitions begin at the staff level, so that they can
be “molded” in accordance with firm culture (Hermanson, Houston, Stefaniak, &
Wilkins, 2016). Once human capital is acquired by a firm, the development process
typically consists of three components. First, auditors are given formal professional
education regarding firm methodology, audit standards, and accounting standards (Yang,
Chen, & Yang, 2013; Schultz, 1961; Lepak & Snell, 1999; Fung, Gul & Krishnan, 2012).
Second, auditors are developed through on-the-job training, by engagement experience,
observation of other auditors, and monitoring with feedback from supervisors (Schultz,
1961; Neumann, 1981). Third, auditors increase their skills and knowledge by taking
advantage of specialization and/or office rotation opportunities, which provide auditors
with unique skill sets and industry expertise that can increase value to clients and reduce
costs to the firm (Schultz, 1961; Fung et al., 2012).
Once a firm acquires and develops its audit human capital to a minimum level, it
depends on these resources in order to achieve and maintain high audit quality, and
continues in-house training and education (Pfiefier & Salancik, 1978; Hillman & Dalziel,
2003; Francis & Yu, 2009). Prior literature typically assumes that the largest offices will
have the most audit human capital, and therefore, will provide higher audit quality.
DeAngelo (1981) hypothesized that Big 4 audit firms produce higher quality audits than
non-Big 4 firms due to more available resources and technology. The findings of

11
Reynolds and Francis (2000) support DeAngelo’s proposition. Similarly, using the
number of clients to proxy for the size of human capital, Choi, Kim, Kim, and Zang
(2010) find the Big 4 offices with more clients produce high-quality audits. Francis and
Yu (2009) propose that larger offices presumably with more in-house audit personnel
experiences provide greater amounts of audit human capital than smaller offices due to
the decentralized nature of the Big 4 office structure. Further, Francis and Michas (2013)
assume that offices with the most in-house audit personnel experiences are able to apply
their industry-specific knowledge and skills to client engagements, resulting in high audit
quality. Therefore, this study presents the following hypothesis:
H1a: There is a positive relationship between audit human capital available at the
office level and audit quality.
Staffing leverage, a PCAOB audit quality indicator, refers to the availability of
senior-level personnel relative to the amount of requisite work for which they provide
oversight (PCAOB 2015). When audit firms have sufficient individuals with valuable
skills and knowledge (i.e. human capital), then they are better placed to provide
highquality audits. Management literature presents numerous studies discussing the
importance of senior-level leadership on company performance and strategic
decisionmaking (for example Herzberg, 1987 and Vera & Crossnan, 2004). Similarly,
publications from regulatory bodies such as the PCAOB have stated that “tone” which
exists at the senior-levels of an organization is the key element that “drives a firm’s
culture and personnel management” (PCAOB, 2015, 13). This observation exists in the
extant audit quality literature as well. Using Chinese data, both Cahan and Sun (2015)
and Gul et al. (2013) examined the individual effects of the signing audit partner on audit

12
quality, and find that experience, both with the firm and overall, is positively associated
with audit quality, measured by more opinion modifications and fewer financial
restatements. However, for high audit quality to persist, firms must be able to acquire
sufficient experienced individuals. Indeed, Hossain et al., (2017), using Japanese data,
examined the composition of CPAs, Junior CPAs, and other professional staff (classified
in accordance with Japanese financial disclosure requirements) on audit teams and found
that audit teams with greater numbers of CPAs produce higher quality audits, when
measured by the propensity to issue going concern opinion modifications and
discretionary accruals. Similarly, Francis and Yu (2009) show that U.S. offices with more
clients (which they assume indicates a higher number of audit professionals) are more
likely to issue going concern opinion modifications and less likely to have greater
discretionary accruals. Together, these studies indicate that audit human capital for senior
level auditors will affect audit quality to a greater extent than audit human capital for
lower level auditors for three primary reasons. First, while lower level auditors tend to
perform the vast majority of fieldwork, their tasks are typically highly supervised and
non-judgmental. Second, senior level auditors tend to make judgments and decisions that
more pointedly affect audit quality, such as the elected omission of an audit adjustment or
a negotiation with the audit committee regarding financial statement materiality (Ng &
Tan, 2003). And finally, clients that possess greater risks of financial misstatements
demand more attention from senior level auditors in order to achieve a higher level of
audit quality (O’Keefe, Simunic, & Stein, 1994; Stein, Simunic, & O’Keefe, 1994).
Therefore, this study presents the following hypothesis:

13
H1b: The positive relationship between audit human capital available at the office
level and audit quality is more pronounced in audit offices that possess more senior-level
audit human capital.
Because accounting employee turnover rates have ranged from 10%-15% as
recently as 2017 (according to insidepublicaccounting.com, an organization that annually
surveys hundreds of accounting firms), it is vital that auditing departments acquire
sufficient strong-foundational human capital on which to build experience over time.
Prior studies show that elite and specialized colleges and universities prepare their
accounting students for entry level positions better than others. For instance, Hardin and
Stocks (1995) find that recruiters view accounting students from an accounting program
separately accredited by the American Assembly of Collegiate Schools of Business
(AACSB) as more attractive hires than students not from an accounting program
separately accredited by the AACSB. Also, Bunker and Harris (2014) find that
accounting students attending an AACSB college or university perform better on the CPA
exam than students attending a non-AACSB college or university. As auditors gain more
experience on the job, however, it is likely that any educational effects on audit quality
will be lessened. For example, although senior level professionals might possess Ivy-
League education or come from AACSB or flagship universities (Erkens & Bonner,
2013; Badolato, Donelson, & Ege, 2014), other factors like performance and relationship
development also play a vital role in achieving senior level status (Westphal & Stern,
2006). Therefore, this study presents the following hypothesis:

14
H1c: The positive relationship between education quality possessed by audit
human capital available at the office level and audit quality decreases with the level of
seniority of audit staff.
Audit Personnel Experience and Audit Quality
Upper echelon theory proposes that the top management teams will make
strategic decisions based on individual interpretations and that these interpretations tend
to be formed by personal experiences and characteristics (Hambrick & Mason, 1984;
Hambrick, 2007). In an audit firm, the more authoritative individuals (e.g. partners,
principals, and managers) may develop internal best practices based on their experiences
which will influence organizational outcomes, such as the strategic selection of a client;
implementation of a procedure; or the effectiveness of an accounting judgment. Because
of these experiential effects, separate offices in the same accounting firm could have
different accounting valuations, classifications, audit judgments, and financial disclosures
leading to inconsistent audit quality across the firm.
Big 4 firms’ quality controls and audit methodologies attempt to mitigate
inconsistent audit quality by transferring knowledge and experiences across the firm
offices (for example: through database sharing and internal training) to achieve
consistently high audit quality (Our System of Audit Quality Controls, 2015; Our
Commitment to Audit Quality, 2017; Our Focus on Audit Quality, 2017; U.S. Audit
Quality Report, 2016). Further, in certain complex situations defined by the firm,
decisions are required to be made at the national office to maintain consistency in
judgments. Yet, despite these efforts, research proposes that high audit quality is
achieved by the largest, most experienced, highest billing offices in the firm rather than

15
consistently throughout all offices (Francis & Yu, 2009; Francis et al., 2013). This
inconsistency appears largely due to the inability of audit firms to successfully transfer
knowledge and experiences among offices (Bamber, Jiang, & Wang, 2010; Francis et al.,
2013).
Due to the difficulties of transferring experienced-based knowledge among all
offices in the audit firm, it stands to reason certain offices might perform better than
others, because the senior-level leadership at each Big 4 office is likely to assemble a
personnel composition that will lead to the best possible quality based on their personal
experiences and knowledge. Audit teams are commonly comprised of partners,
principals, senior managers, managers, senior associates, and associates. Additionally,
each audit team is comprised of individuals with varying degrees and types of personal
experience. Because of these differences and because the audit team authoritative
individuals may utilize personal interpretations, audit quality may vary among the offices
in the same Big 4 firm. The PCAOB (with the support of numerous audit firms)
suggested that information concerning auditor experience could provide vital insight into
the mechanics of the external audit (PCAOB, 2015). Researchers also suggest that
examinations of the personnel comprising the audit teams at each individual office could
provide a more precise measure of audit quality (Knechel et al., 2013), yet information
regarding these inputs and processes has been difficult to gather from an archival
perspective, as U.S. Big 4 firms do not publicize this type of data.
Several studies have performed behavioral research using experience levels to
investigate decision-making. Simon and Chase (1973) used a chess simulation game to
evaluate how chess players of varying skill level made decisions based on their ability to
recall certain positions and potential future moves. The authors found evidence that

16
master chess players had a greater recall ability than novice chess players because
strategy is a component of the placement of chess pieces. Similarly, Moeckel (1990)
found that more experienced auditors were able to incorporate recall and reconstruction
into their decision-making more effectively than auditors with less experience. Moeckel
also found that, although the auditors made errors in the experiment, the errors tended to
occur less often with more experienced auditors. Naturally, as auditors acquire more
experience both through client engagements and through training, their error rate
decreases. This occurs in part due to the awareness of a larger population of errors that
could potentially happen and because of their client experience and training in specific
transactions cycles (Libby & Frederick, 1990).
Using experiments, Kinney and Uecker (1982) and McDaniel and Kinney (1995)
analyzed audit senior associates and their abilities to make analytical decisions. They
found that senior associates rarely stray from the use of decision aids, methodology, and
prior year information to make audit decisions. Similarly, other behavioral studies show
that although auditors’ risk assessment approach varies by firm, staff auditors tend to rely
primarily on firm methodology throughout the audit engagement process (Jiambalvo &
Waller, 1984; Wilks & Zimbelman, 2004; Zimbelman, 1997). Alternatively, Cianci et al.
(2017) found that in certain situations, partners relied on personal judgments rather than
firm methodology or other regulations. These results indicate that more experienced
auditors (e.g., partners) should have a greater individualized impact on the audit
engagement than auditors with less experience (e.g., senior associates and associates).
A limited amount of archival research has examined the impact of auditor
experience on audit quality. Using available Japanese data, Hossain et al., (2017) found
some evidence to indicate a positive association between senior and staff auditors’

17
experience and audit fees, but not with any other measures of audit quality. Other
archival studies, however, have much stronger findings regarding audit quality when
using measurements at the audit partner level. Cahan and Sun (2015) utilized upper
echelon theory to determine the impact of Chinese audit partner experience on audit fees
and audit quality. In China, personal information about audit partners is more readily
available than the U.S., as audit partners are required to sign the audit report and disclose
experience to the Chinese Securities Regulatory Commission. Using audit fees and
discretionary accruals as proxies for audit quality, this study found that partners with
more years of experience provide higher quality non-U.S. audits than partners with less
experience. Gul, Wu, and Yang (2013) also used Chinese data to examine audit partners
that signed off on the audit reports. They too found a significant relationship between
audit partner experience and audit quality. Therefore, the following hypothesis is
proposed:
H2a: - The positive relationship between audit personnel experience and audit
quality is greater at more senior levels than at less senior levels.
While there is a general positive relationship between experience and audit
quality, too much experience could begin to cause a decrease in audit quality. As the
upper echelon (e.g. partners) become long-tenured, they are more likely to resist change
and lose fit with the organization (Miller, 1991). When this occurs, the performance of
long-tenured individuals could begin to deteriorate. Many accounting partnerships
structure a mandatory retirement component into their partnership agreements to remove
this performance deterioration effect (Stanger & Carlson, 2017), although the Big 4 do
not have a publically-available official policy regarding this practice. Using Australian

18
partner data, Carey and Simnett (2006) provide some evidence of longer partner tenure
harming audit quality. Audit quality deterioration occurring due to longer tenure may be
more magnified at smaller offices with fewer partners having more individual control,
rather than at larger offices with many partners where control is disseminated (Miller,
1991), meaning if a small office is providing poor audit performance, that performance
would likely exist among a larger portion of the office audit engagements. It might also
be that smaller offices have a single big client or a small handful of big clients, and by
focusing their efforts on those more “important” (i.e., biggest fee) clients, other smaller
audit engagements would suffer. Therefore, this study also proposes that:
H2b: There is a negative relationship between longer audit partner tenure and
audit quality for smaller offices.
Audit Workload Compression and Audit Quality
As previously mentioned, the PCAOB identified auditor workload compression as
an indicator of audit quality (PCAOB, 2015). Workload compression occurs because of
the rush to complete annual report filings subsequent to fiscal year end (i.e. busy season).
The PCAOB considered both partner workload, and manager and staff in their
discussions. A greater client workload might prevent the partner from giving proper
consideration to each audit. Similarly, managers and staff might be pressured to sacrifice
effectiveness for efficiency’s sake, and therefore, not properly plan and perform the
appropriate audit procedures.
When auditors have a higher workload volume, they will be required to make
more judgments and decisions. Behavioral decision theory suggests that auditors make
decisions that harmonize with their core expectations and standards (Slovic, Fischoff, &

19
Lichtenstein, 1977). When auditors gain experience and knowledge, their decisions
become more practical and appropriate (Einhorn & Hogarth, 1981). As auditors become
required to make faster decisions, however, they often perceive fewer environmental cues
that can help to clarify issues and create appropriate responses (Bruner, Matter, &
Papanek, 1955; Easterbrook, 1959; Edwards, 1961). Time compressions due to the busy
filing season require auditors to make faster decisions and can affect audit performance
and audit precision (McDaniel, 1990).
Audit quality issues related to workload compression have been shown to occur at
smaller offices for three primary reasons. First, although higher overall audit workloads
typically occur at offices with more fees, more SEC clients, and more total clients
(DeAngelo, 1981; Reynolds & Francis, 2000; Choi et al., 2010; Francis et al., 2013;
Francis & Yu, 2009), smaller offices have fewer resources and often require auditors to
work on multiple client engagements (Lopez & Peters, 2012). When auditors work on
multiple engagements and multiple engagement types simultaneously, they may
incorrectly analogize audit information from one client to the next (Brown, Gissel, &
Neely, 2016). Second, large clients and SEC clients tend to be more complex both in
their operational activities and their business structures, and often incur significant
litigation risk (DeAngelo, 1981; Simunic, 1980; Hay et al., 2006). The large offices that
support complex clients have greater on-site access to expert auditors than small offices.
When small offices are faced with complex situations, they may be required to consult
with experts at other offices, leading to magnified engagement timing issues. Third,
when SEC clients are regarded as high-risk for PCAOB inspections, offices might
allocate more experienced auditors to those engagements (Moroney, Knechel, &
Dowling, 2017). This allocation might disproportionately affect small offices by causing

20
their more experienced auditors to shoulder a heavier workload. Therefore, this study
hypothesizes that:
H3a: There is a negative relationship between audit workload compression and
audit quality.
It is probable that the available human capital of the office relative to audit
workload compression will also affect audit quality. Audit partners at offices with less
audit human capital may participate more in the management of the audit engagement,
whereas audit partners at offices with more audit human capital may be involved in
highlevel review of the audit engagement (Lopez & Peters, 2012). Similarly, managers
and staff at offices with less audit human capital might be required to work on audit
engagements in multiple industries (e.g. transportation and manufacturing), while
managers and staff from offices with more audit human capital might have expertise in
particular areas (Francis & Yu, 2009). Overall, offices with fewer audit human capital
may be spread too thin such that the greater workload may influence the quality of the
audit. Therefore, this study hypothesizes that:
H3b: The negative relationship between audit workload compression and audit
quality is greater at offices that have relatively less audit human capital.

CHAPTER 3
METHODOLOGY
The Client Sample
To test the relationship between Big 4 office personnel and audit quality, two
separate datasets are obtained – one containing U.S. client data and one containing U.S.
Big 4 employee current and historical information. The sample of audit client data used
to measure audit quality (restatements, internal control weaknesses, going concern
modifications, qualified opinions, and audit fees) covers the period 2011 to 2018, based
on Compustat year descriptions. This range in evaluation years for the client data is to
mitigate the potential gamesmanship that could occur, for example, if the audit firm were
to discount fees for new clients or load negative findings into loss years and final contract
years (Ruiz-Barbadillo, Gomez-Aguilar, & Carrera, 2009). Using this range also
captures effects from post-Dodd-Frank implementation, as many auditors from the
LinkedIn database would have been working since before 2010 when the Dodd-Frank
legislation became effective. The client data is from audit clients of all U.S. Big 4 firms
and was obtained by matching and merging Audit Analytics and Compustat data.
Consistent with prior studies on audit quality, financial institutions and utilities are
excluded from the client sample (e.g. Francis & Yu, 2009; Hay et al., 2006; Francis et al.,
2013). The initial client sample is 79,286 firm-year observations for fiscal years ending
during 2011 through 2018. After excluding duplicates and unmatched clients between

22
22
Compustat and Audit Analytics (30,737); clients audited by non-Big 4, non-U.S. Big 4,
and non-U.S. clients (27,560); clients audited by U.S. Big 4 offices with unavailable
office personnel information (293); clients from financial institutions and utility
industries (8,175); and remaining clients with missing data (1,220); the final sample
comprises 11,301 observations (See Panel A of Table 2). Panel B of Table 2 breaks down
the client sample by year, and Panel 3 of Table 2 shows the industry membership of the
sample based on two-digit SIC codes.
The Office Personnel Sample
The office personnel composition for the Big 4 firms is captured by accessing
public LinkedIn profiles and extracting and organizing the data into a database. The
public LinkedIn profiles contain variables such as current office, professional level,
experience, education, and gender. As a completeness test, the number of LinkedIn
profiles for the Big 4 firms is compared to the firms’ PCAOB annual reports (see Table 3,
Panel A). Registered public accounting firms that audit publicly traded companies are
required by the PCAOB to file a report that accumulates certain annual activity. Annual
activity includes audits issued, the physical location of firm offices, and the number of
total employees. The evaluation in Panels B and C of Table 3 reveals that a generally
comparable amount of total profiles exist for the Big 4 firms in total (61.75%) and
separately (Big 4 Firm A – 43.10%; Big 4 Firm B – 73.09%; Big 4 Firm C – 79.08%;
Big 4 Firm D – 74.11%).

23
TABLE 2
Client Sample Selection and Industry Membership
Panel A: Client Sample Selection
Observations
Clients listed in Compustat with fiscal years ending
from 2011 to 2018 79,286
Less clients unmatched between Audit Analytics
and Compustat (30,737)
Less clients audited by non-Big 4, non-US Big 4, non-US clients, and
clients that were not audited by
Big 4 after fiscal year ending during 2016 (27,560) Less clients audited by
Big 4 offices with unavailable (293)
information on LinkedIn
Less financial institution and utility clients (8,175)
Less clients with missing data (1,220)
Final Sample 11,301
Panel B: Client Sample by Fiscal Year End
Observations
2011 1,425
2012 1,505
2013
1,609
2014 1,674
2015 1,736
2016 1,787
2017 1,540
2018
25
Panel C: Industry Membership of Client Sample

24
Final Sample
11,301 28 Chemicals and allied products 1,781
15.76
73 Business services 1,466 12.97
36 Electronic and other
electric equipment 817 7.23
38 Instruments and related products 678 6.00
35 Industrial machinery and equipment 658 5.82
13 Oil and gas extraction 521 4.61
37 Transportation equipment 341 3.02
48 Telecommunications 304 2.69
50 Wholesale trade - durable goods 292 2.58
20 Food and kindred products 282 2.50
59 Miscellaneous retail 247 2.19
58 Eating and drinking places 244 2.16
51 Wholesale trade - nondurable goods 221 1.96
56 Apparel and accessory stores 211 1.87
80 Health services 208 1.84
87 Engineering, accounting, research,
management, and related services 200 1.77
21 specific industries 8,471 74.97 Others 44 other industries
2,830 25.03
Total Sample 65 industries 11,301 100.00
Two-Digit
Number
% of
SIC Codes Industry Name
of Firms
Sample

25
TABLE 3
Personnel Sample Selection
Panel A: Personnel Sample Selection
Observations
Total profiles on LinkedIn extracted from
November 2017 to January 2018 206,721
Less profiles with missing data, duplicate profiles, and obvious fake
profiles (66,855) Final Personnel Sample
139,866
Total U.S. Big 4 firm headcount
per PCAOB 2018 annual reports 226,516
Final Personnel Sample as a percent of
PCAOB 2018 annual reports 61.75
Panel B: Composition of U.S. Big 4 Personnel Sample
Observations
Big 4 Firm A 41,406
Big 4 Firm B 37,171
Big 4 Firm C 36,568
Big 4 Firm D 24,721
Final Personnel Sample 139,866

26
Panel C: Comparison of Big 4 Personnel Sample to PCAOB
2018 Annual Firm Reports
Observations
as a % of PCAOB PCAOB
Report Report
Observations Headcount Headcount
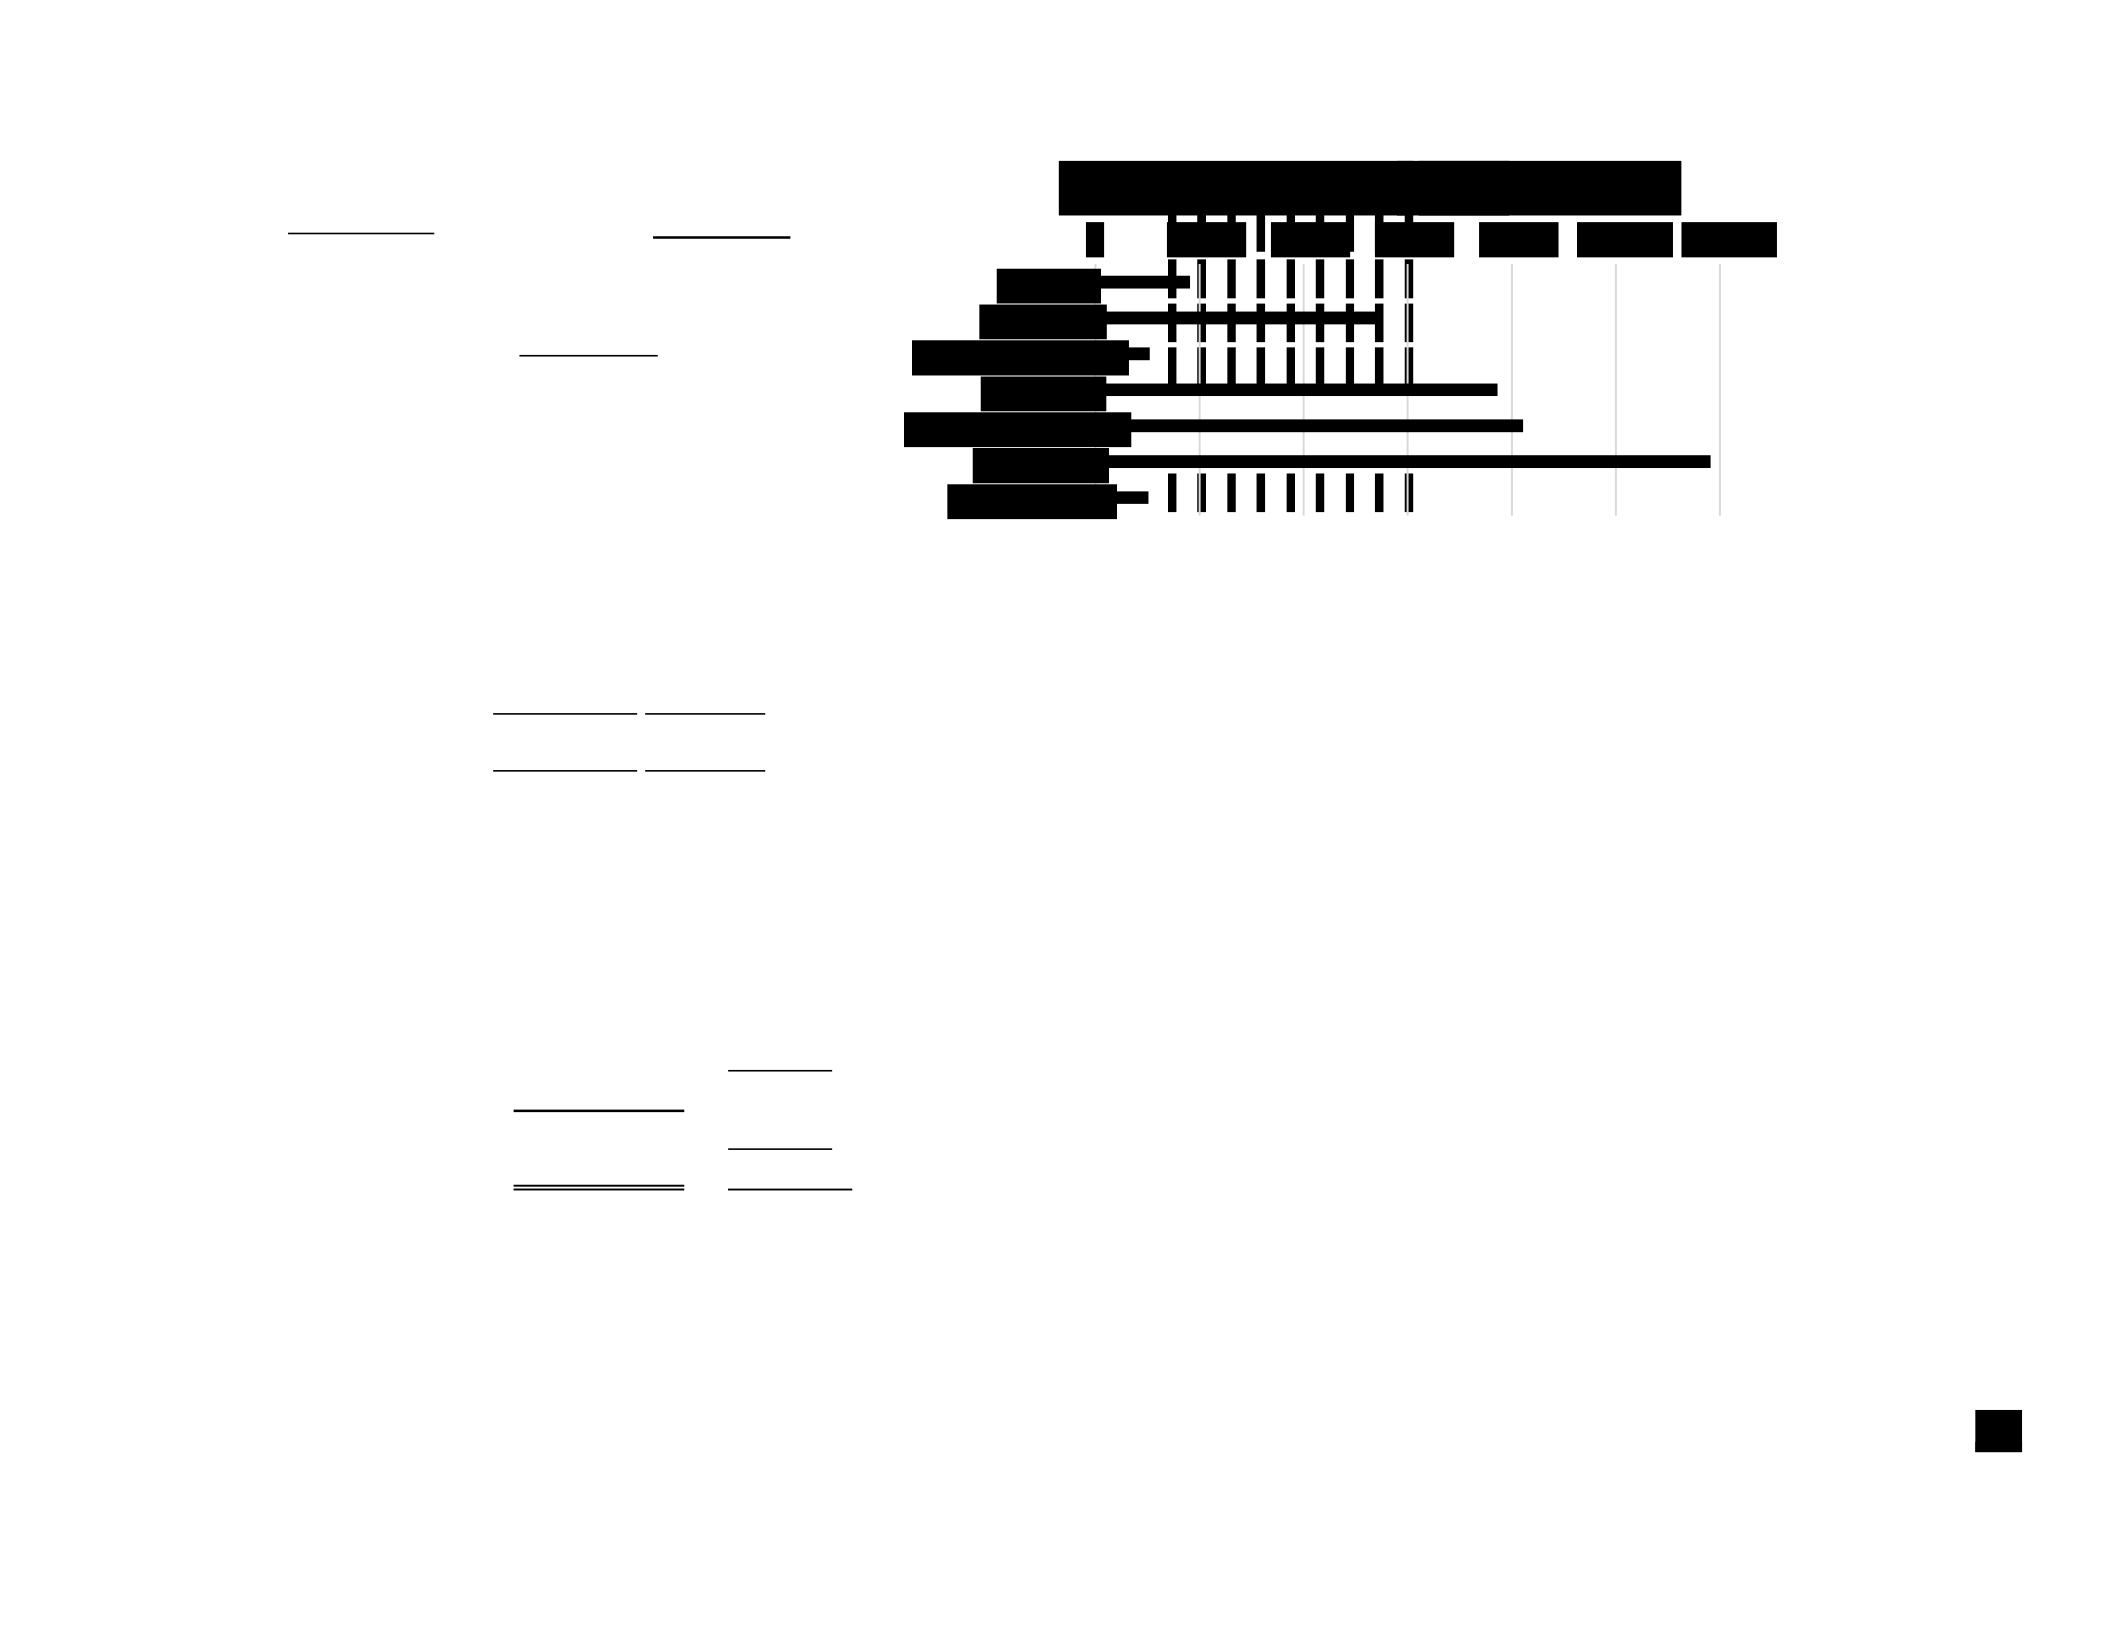
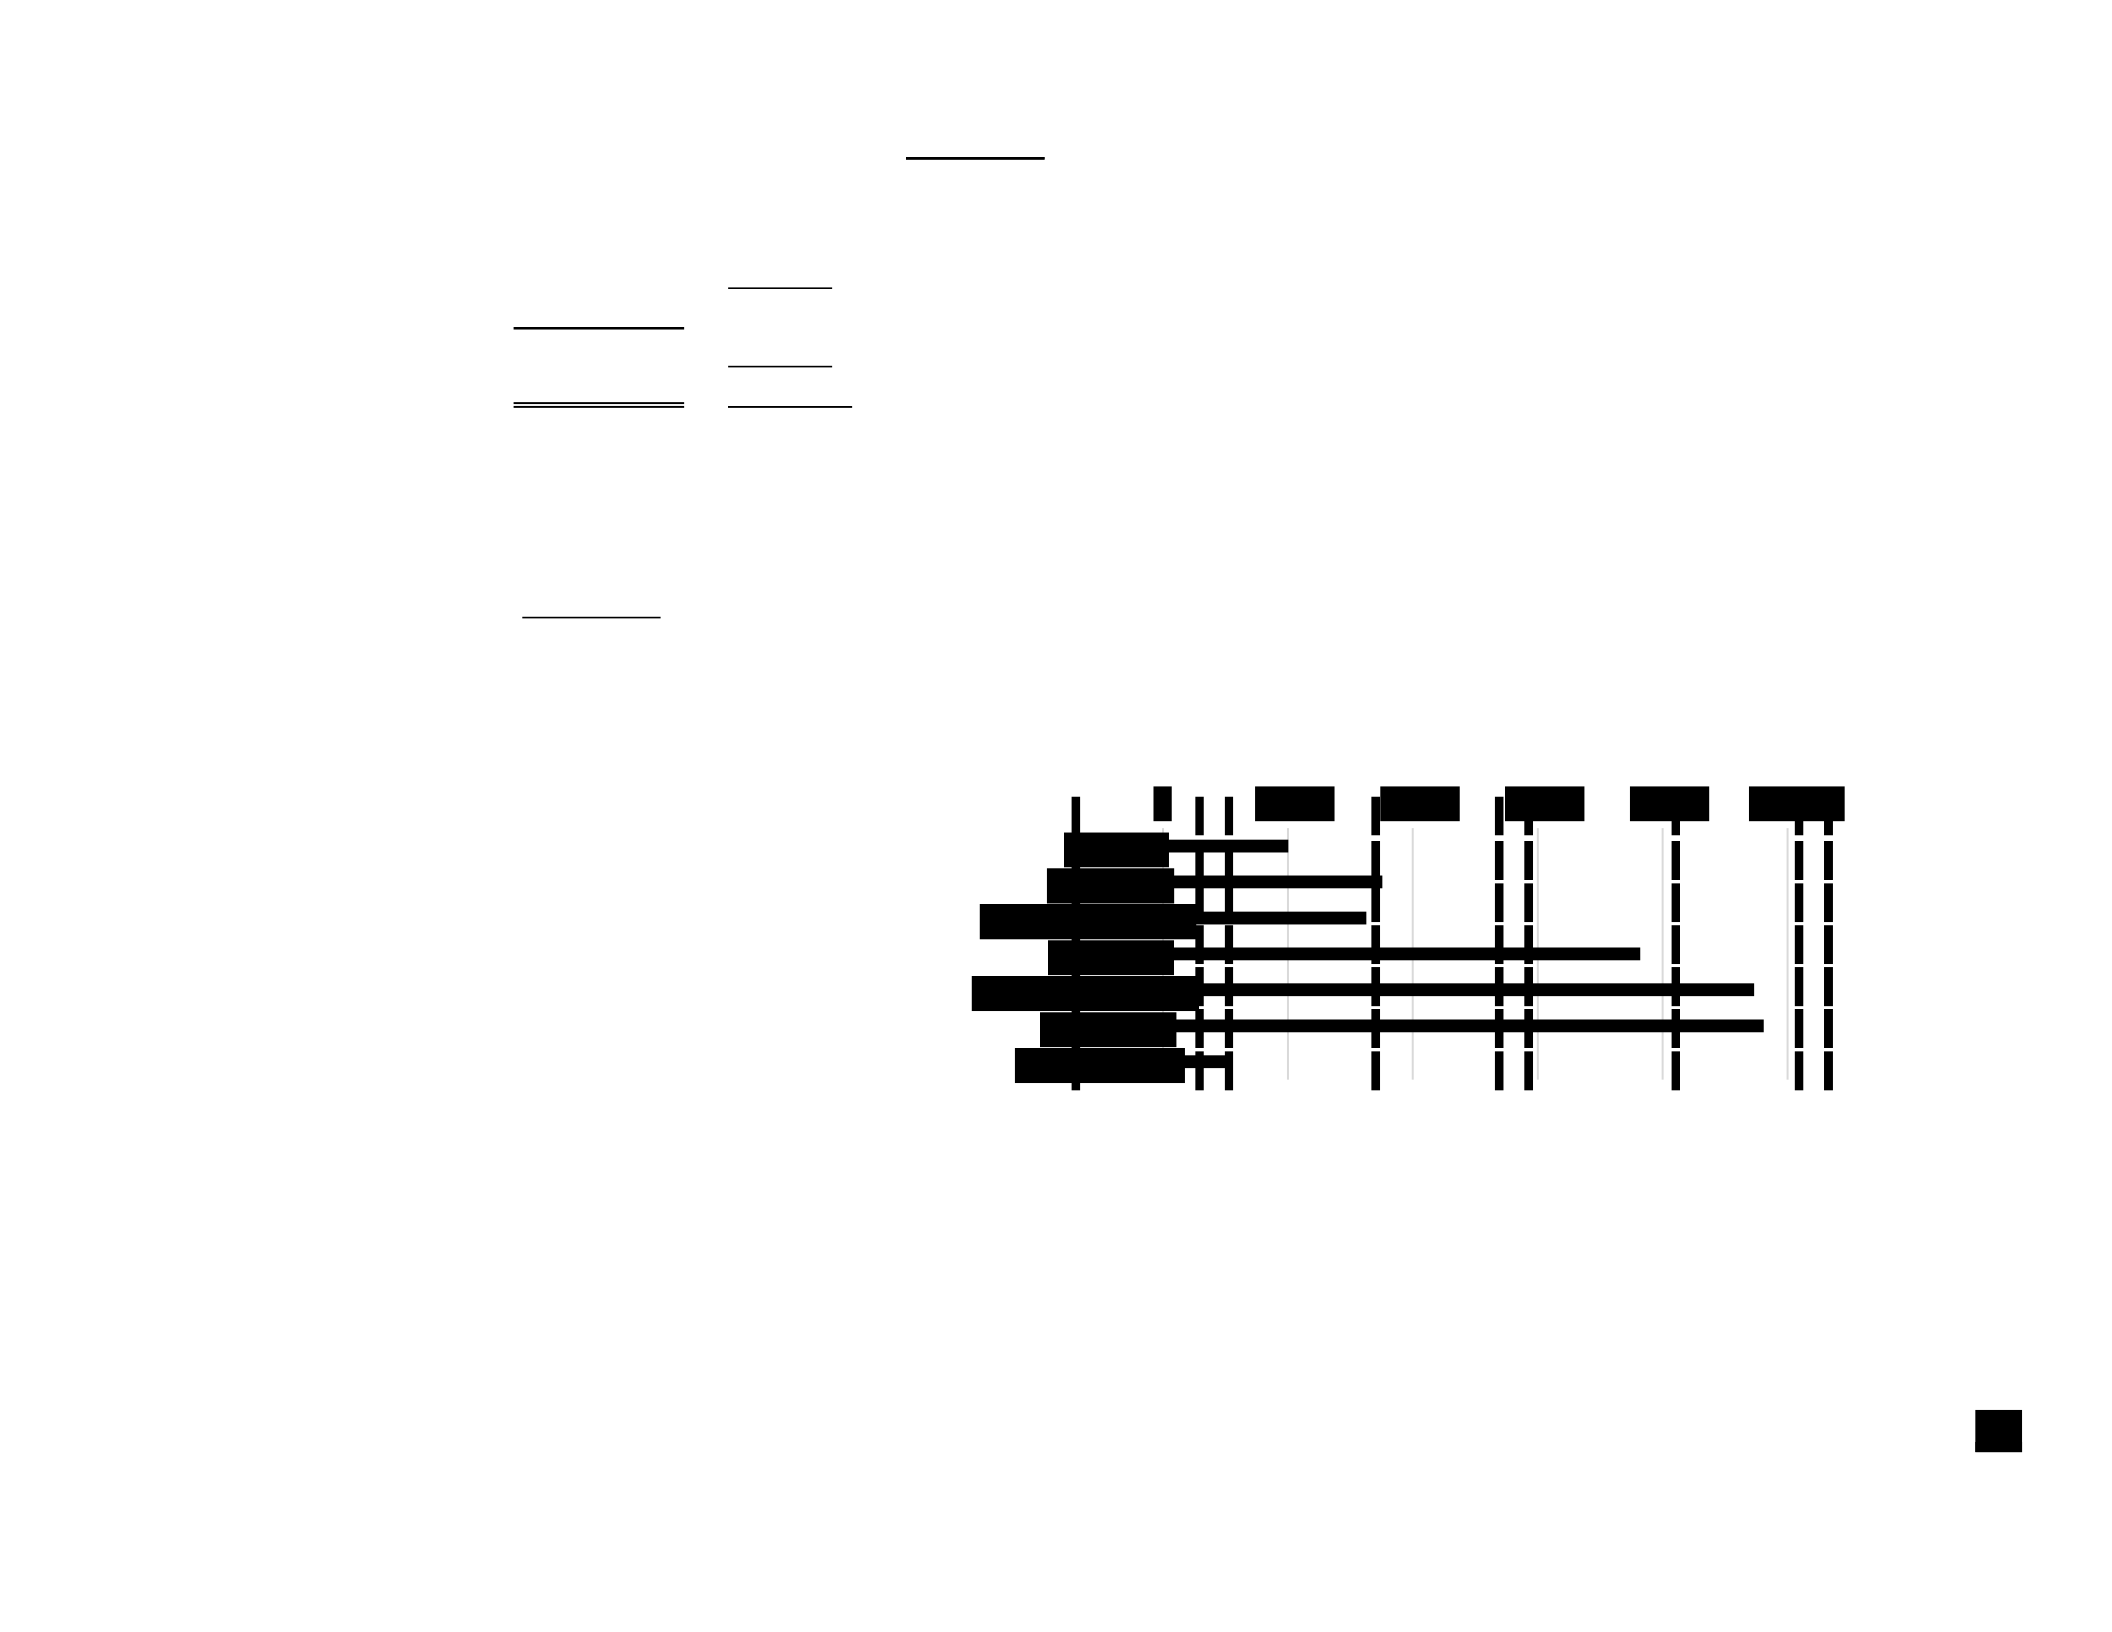
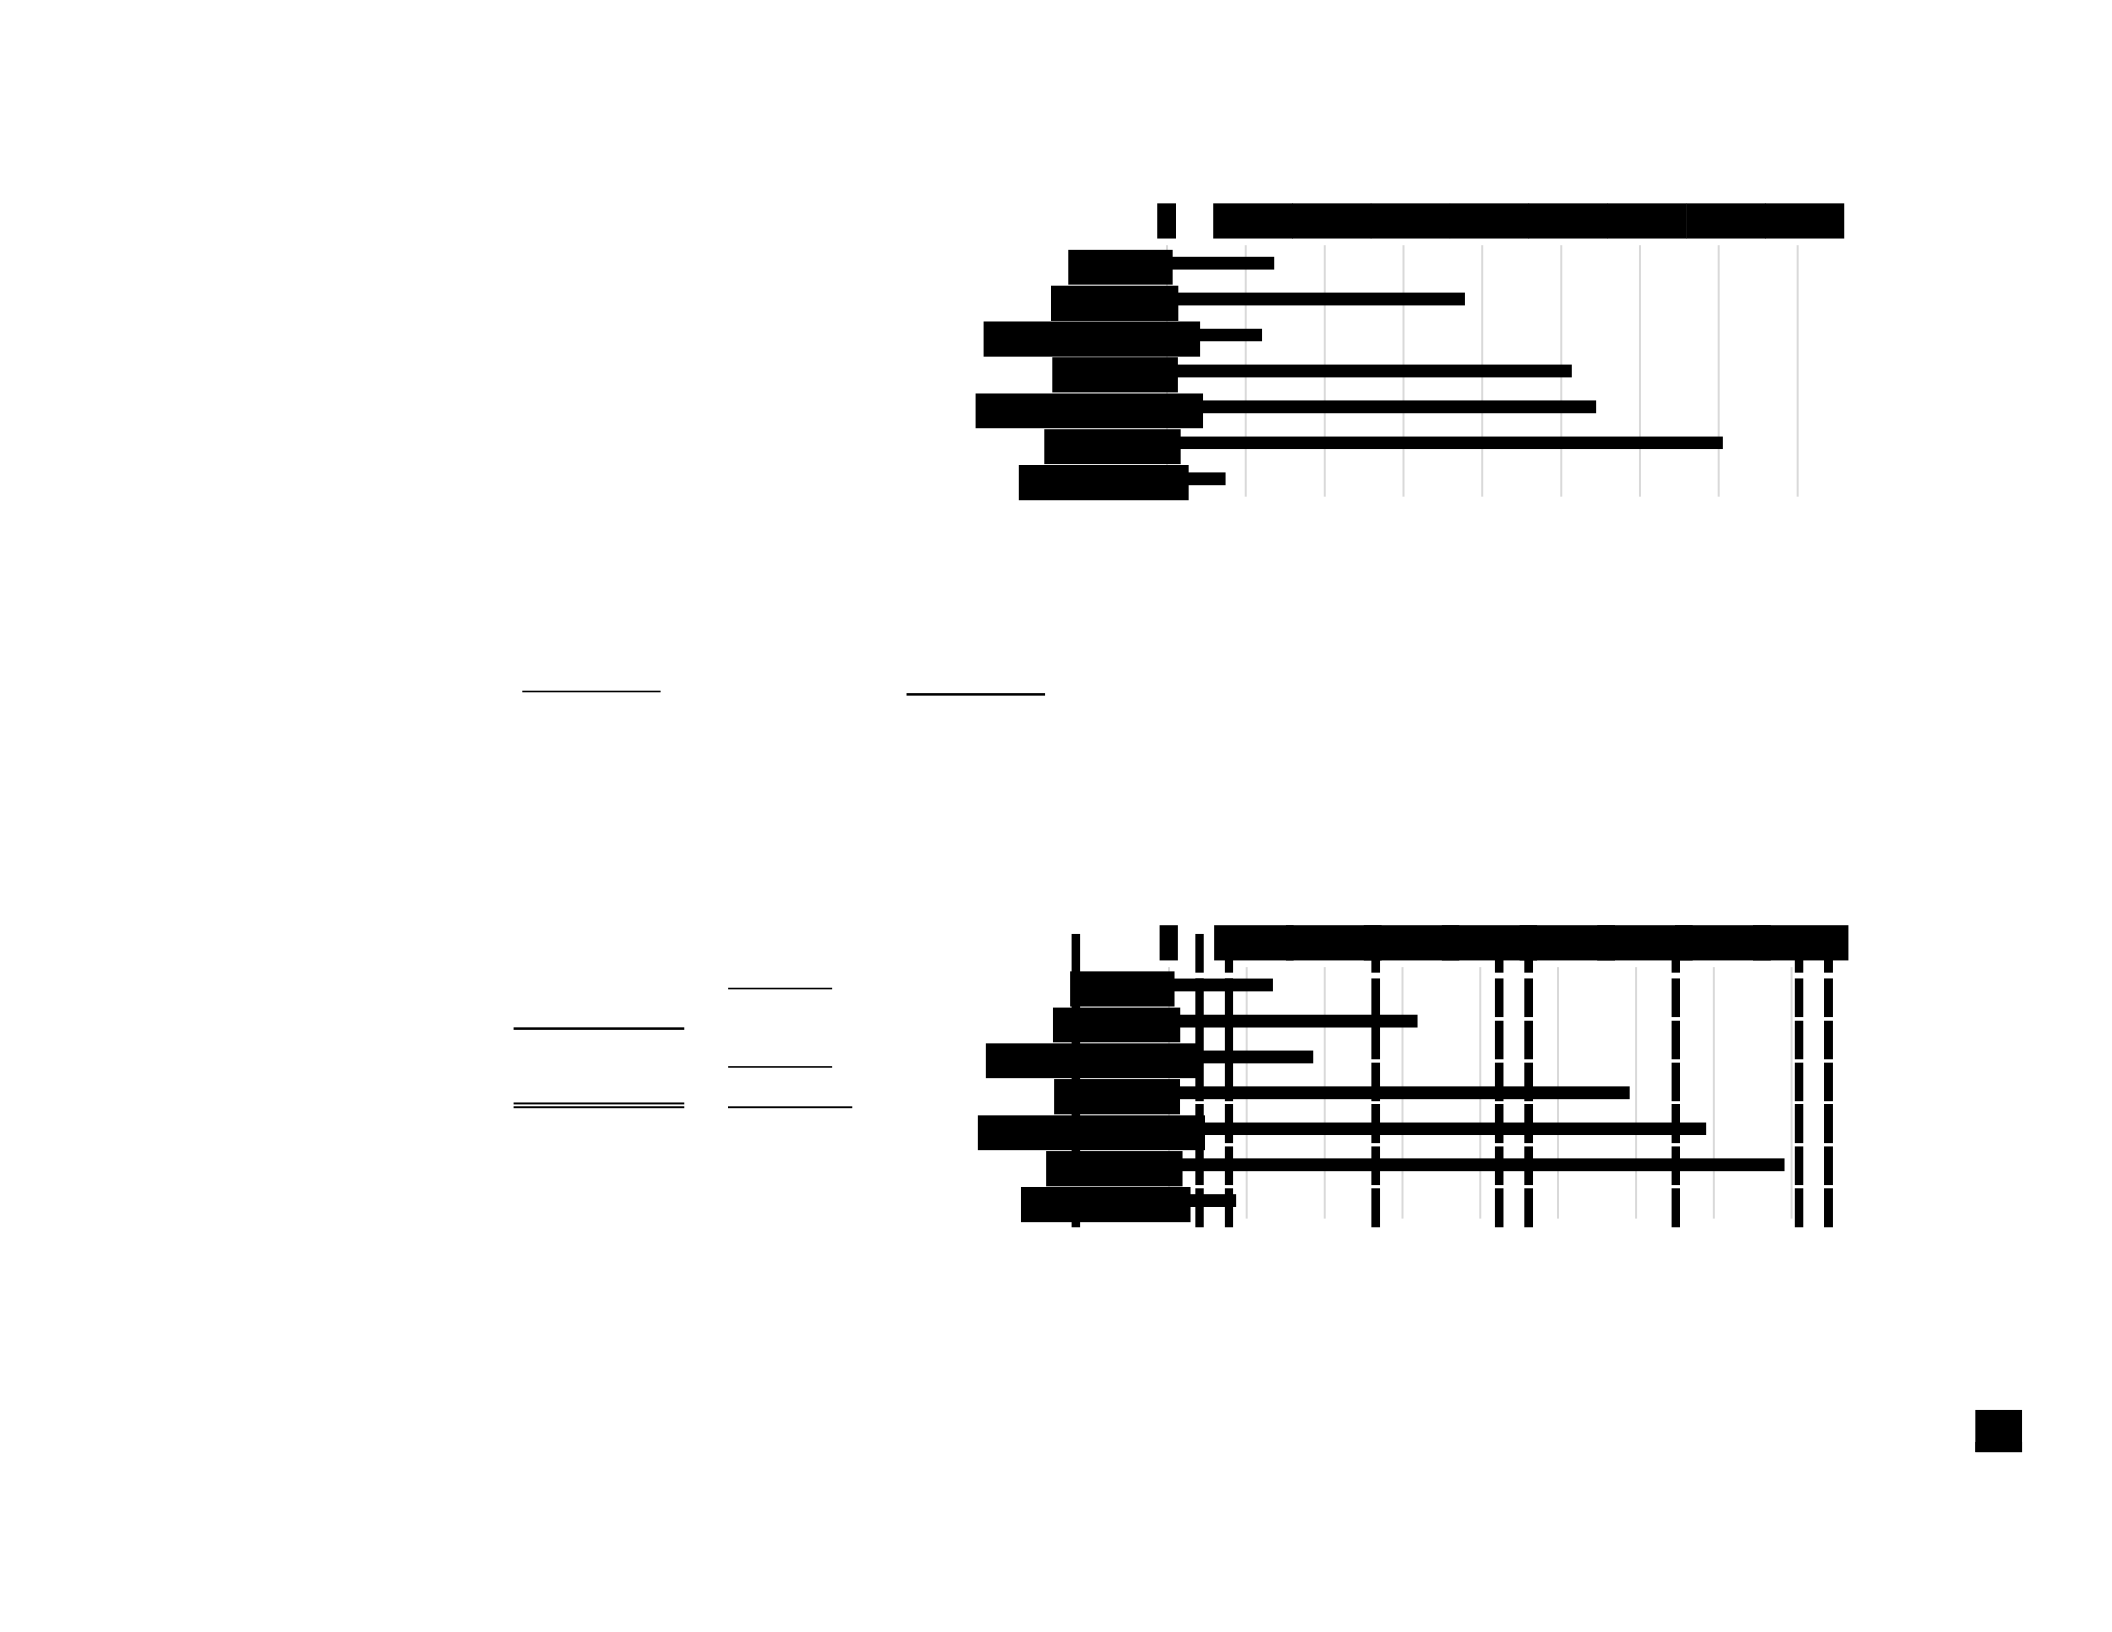
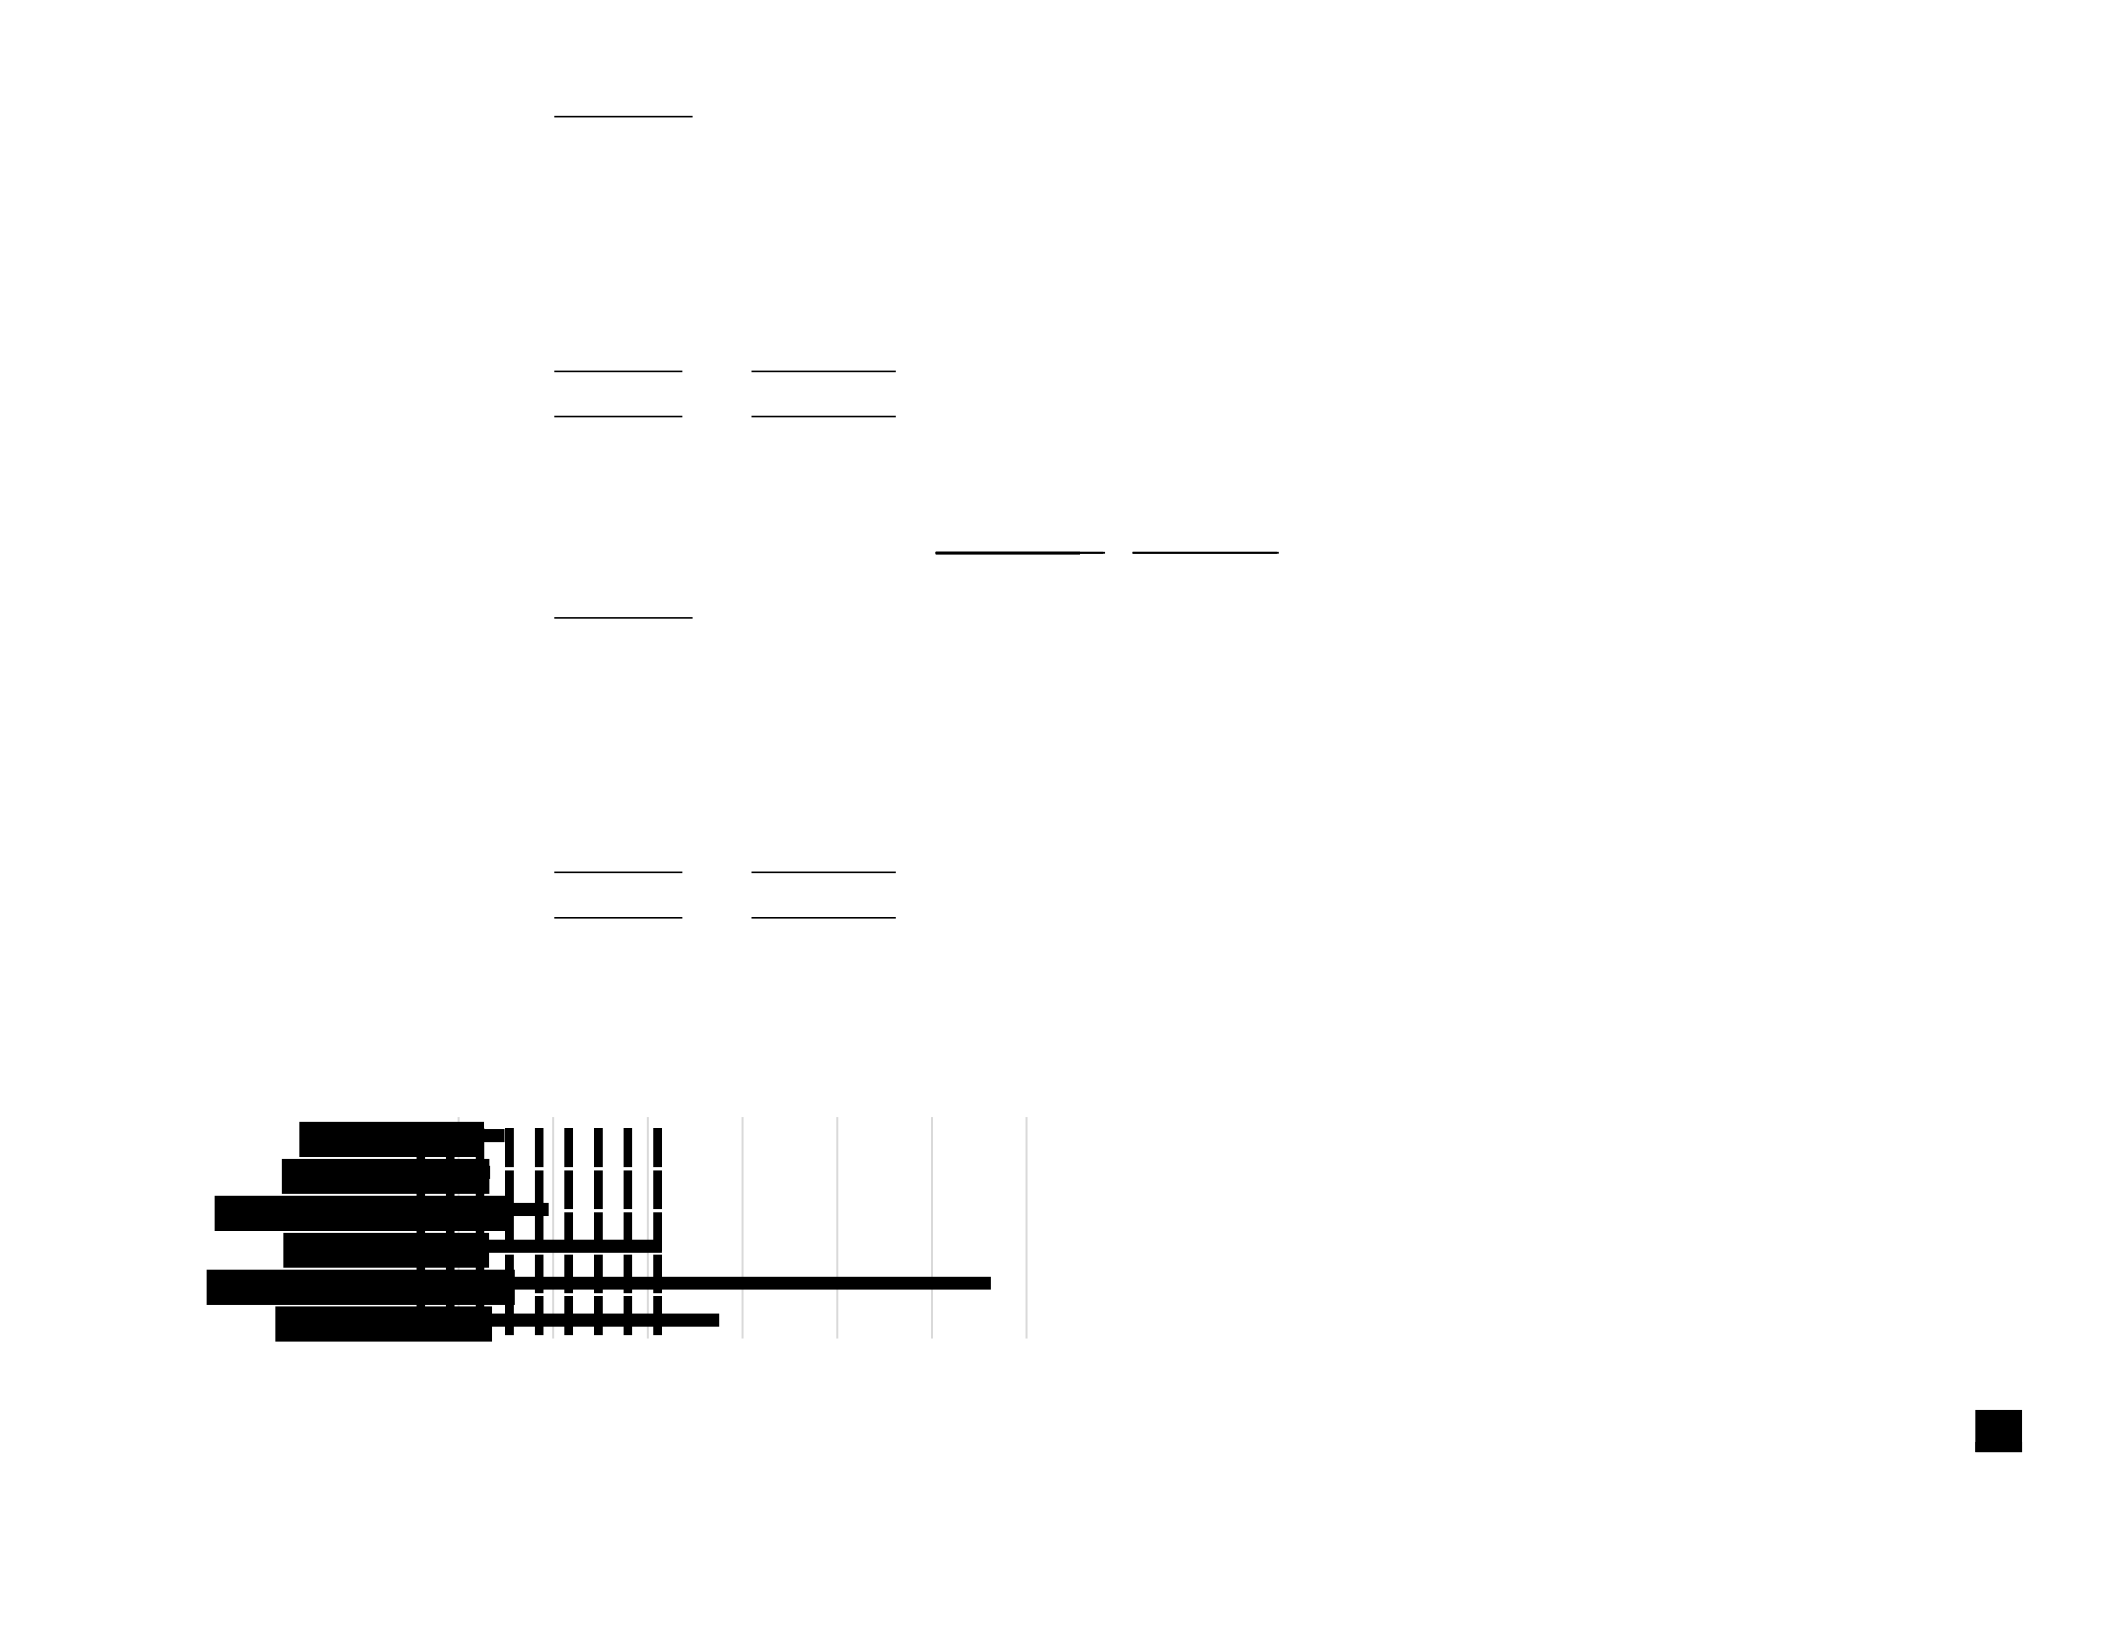
Panel A of Table 4 shows the total firm staffing percentages based on the
personnel sample. It should be noted that the totals for each firm include non-audit
personnel, and certain service lines, such as information technology consulting or
valuations, may not have the same staffing proportions as a typical financial statement
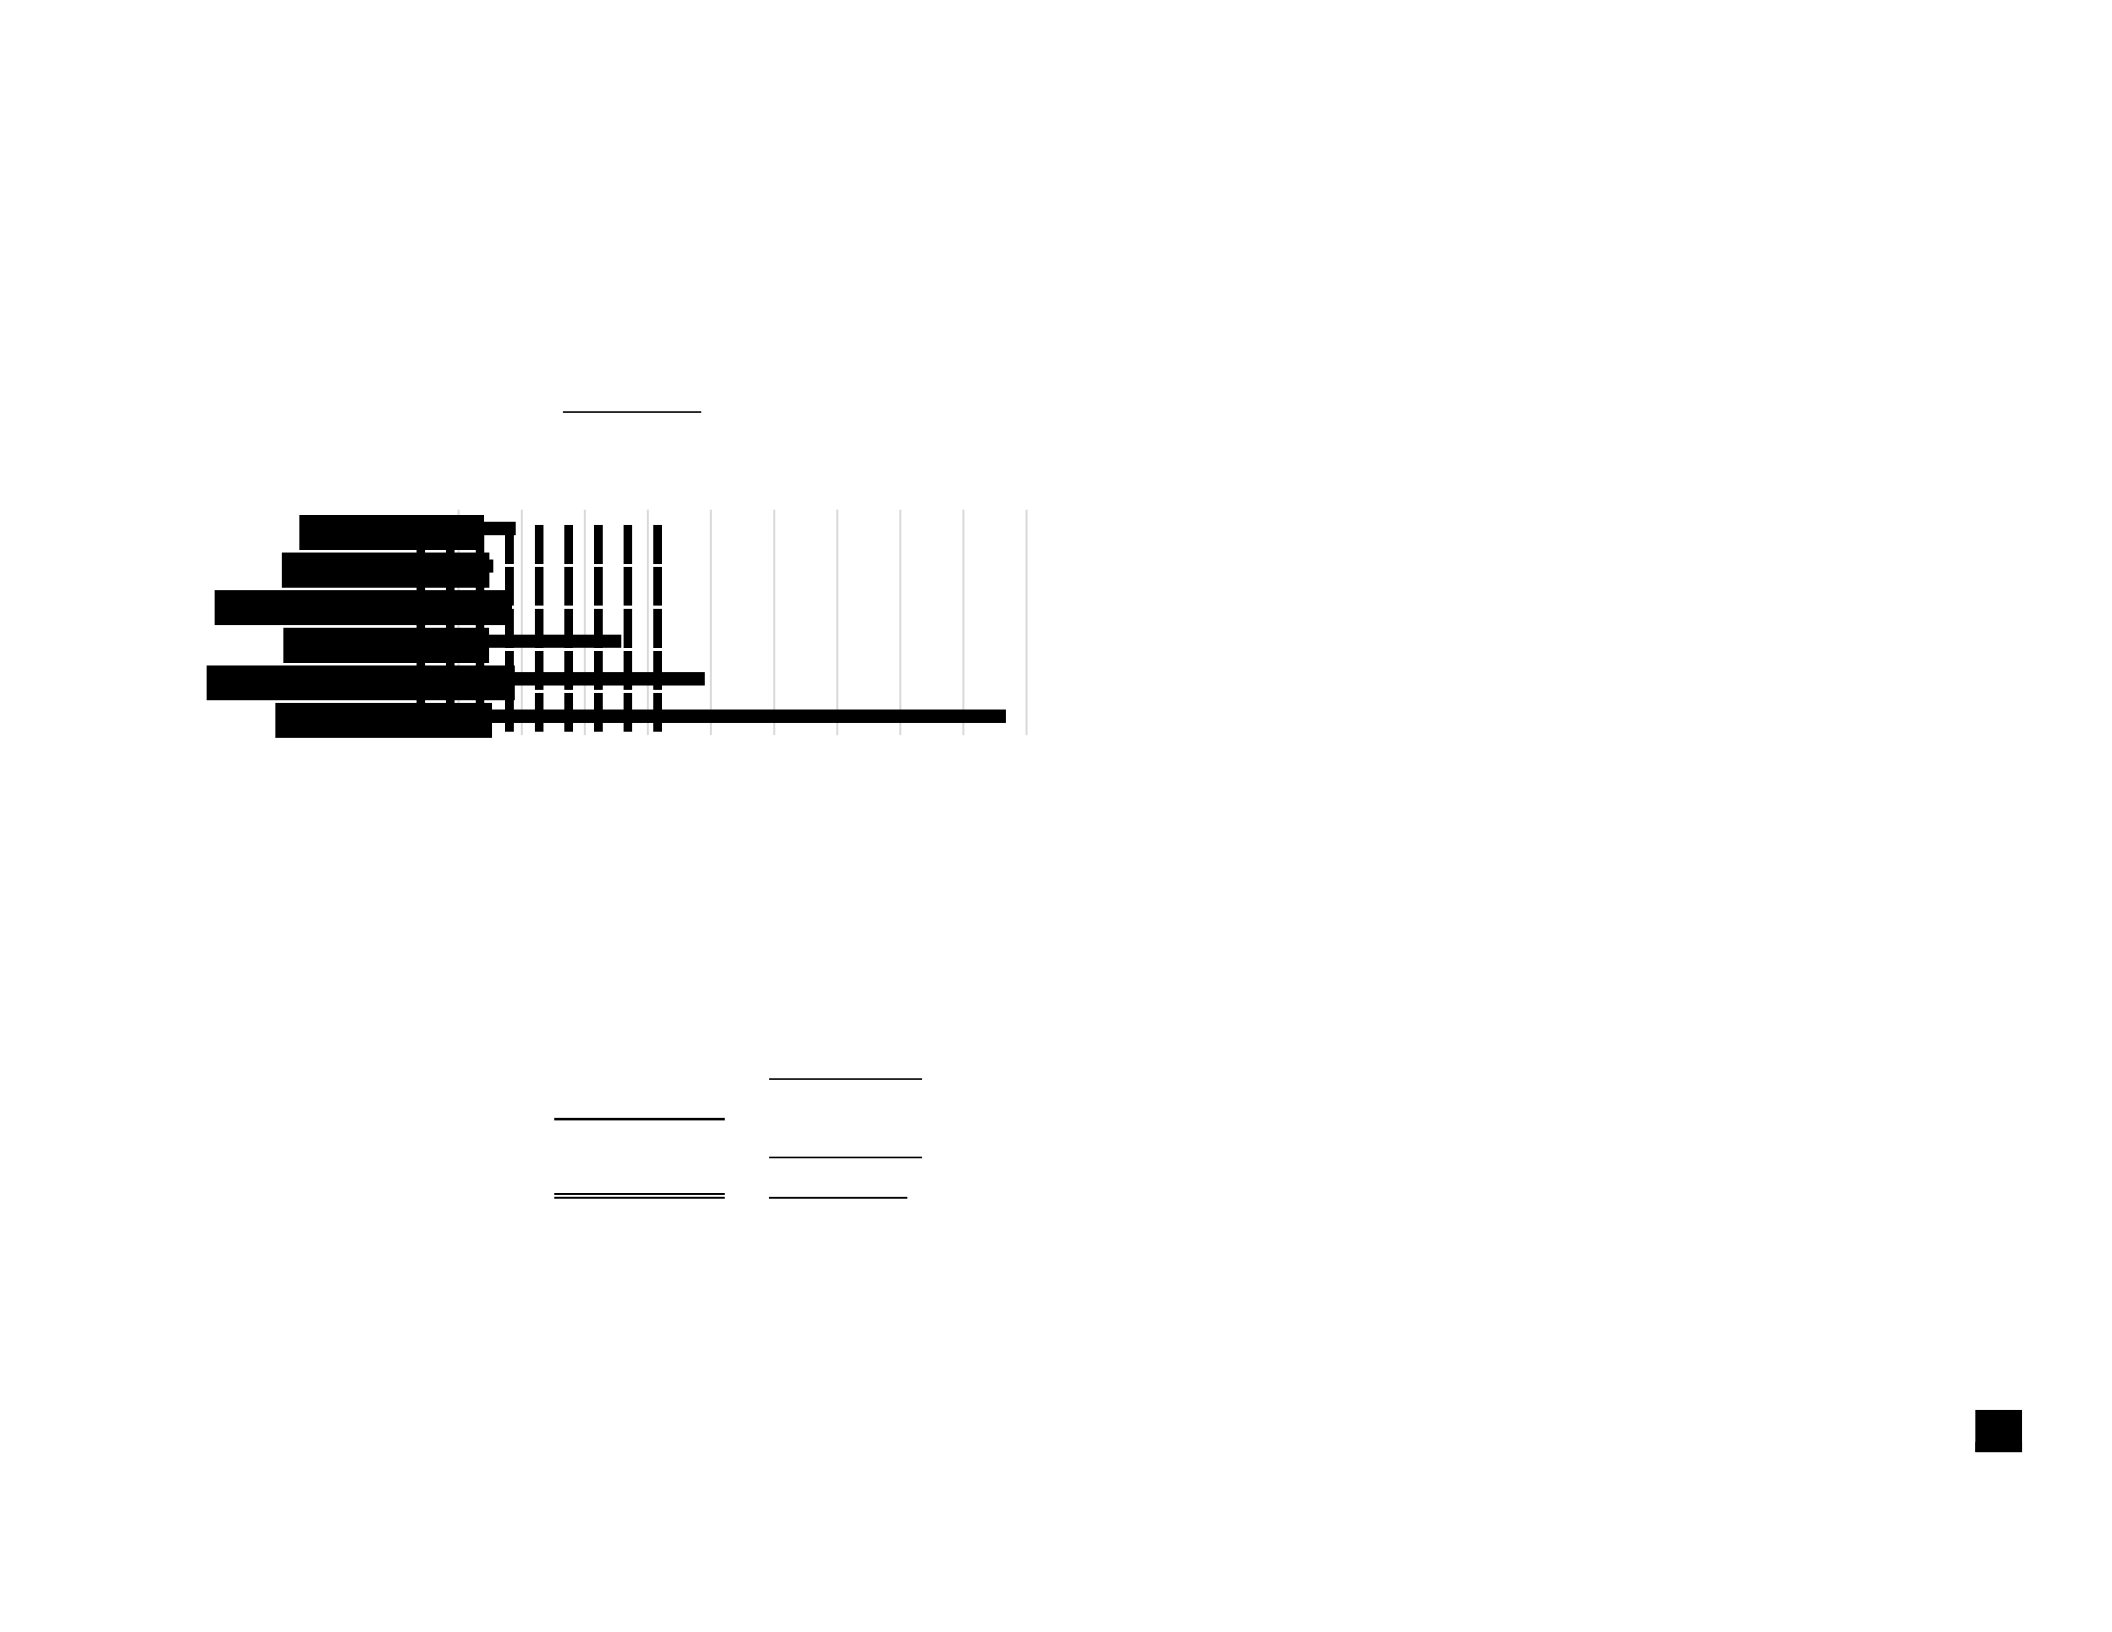
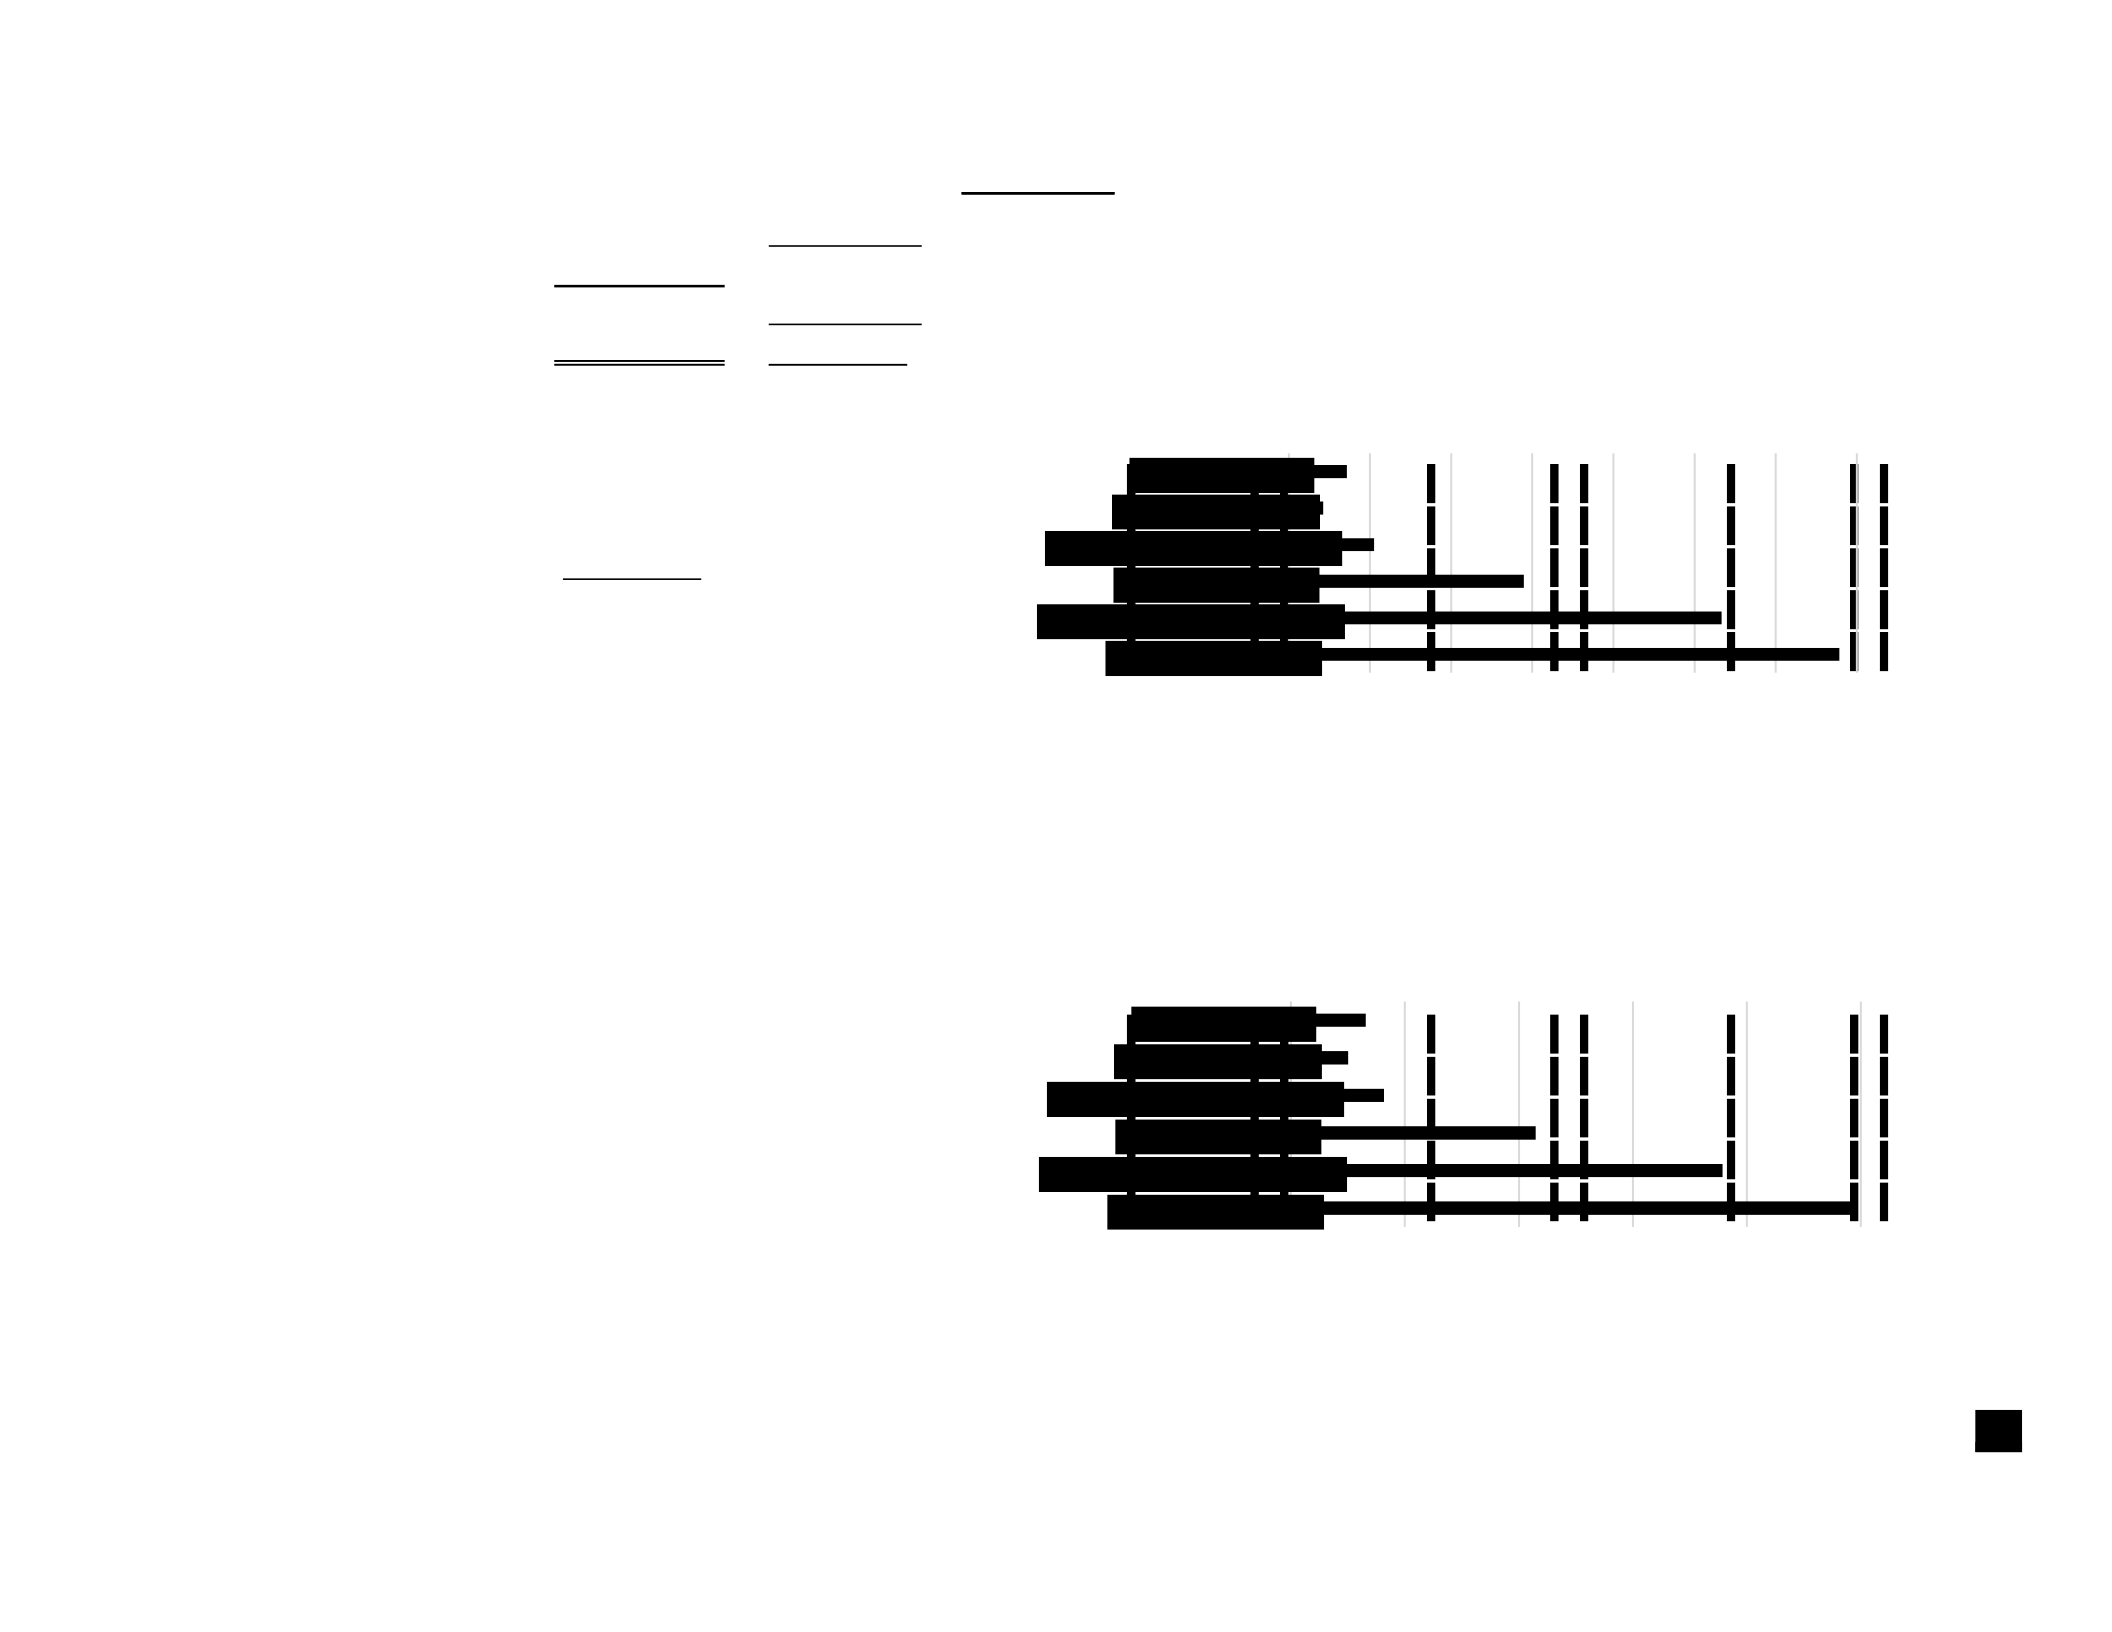
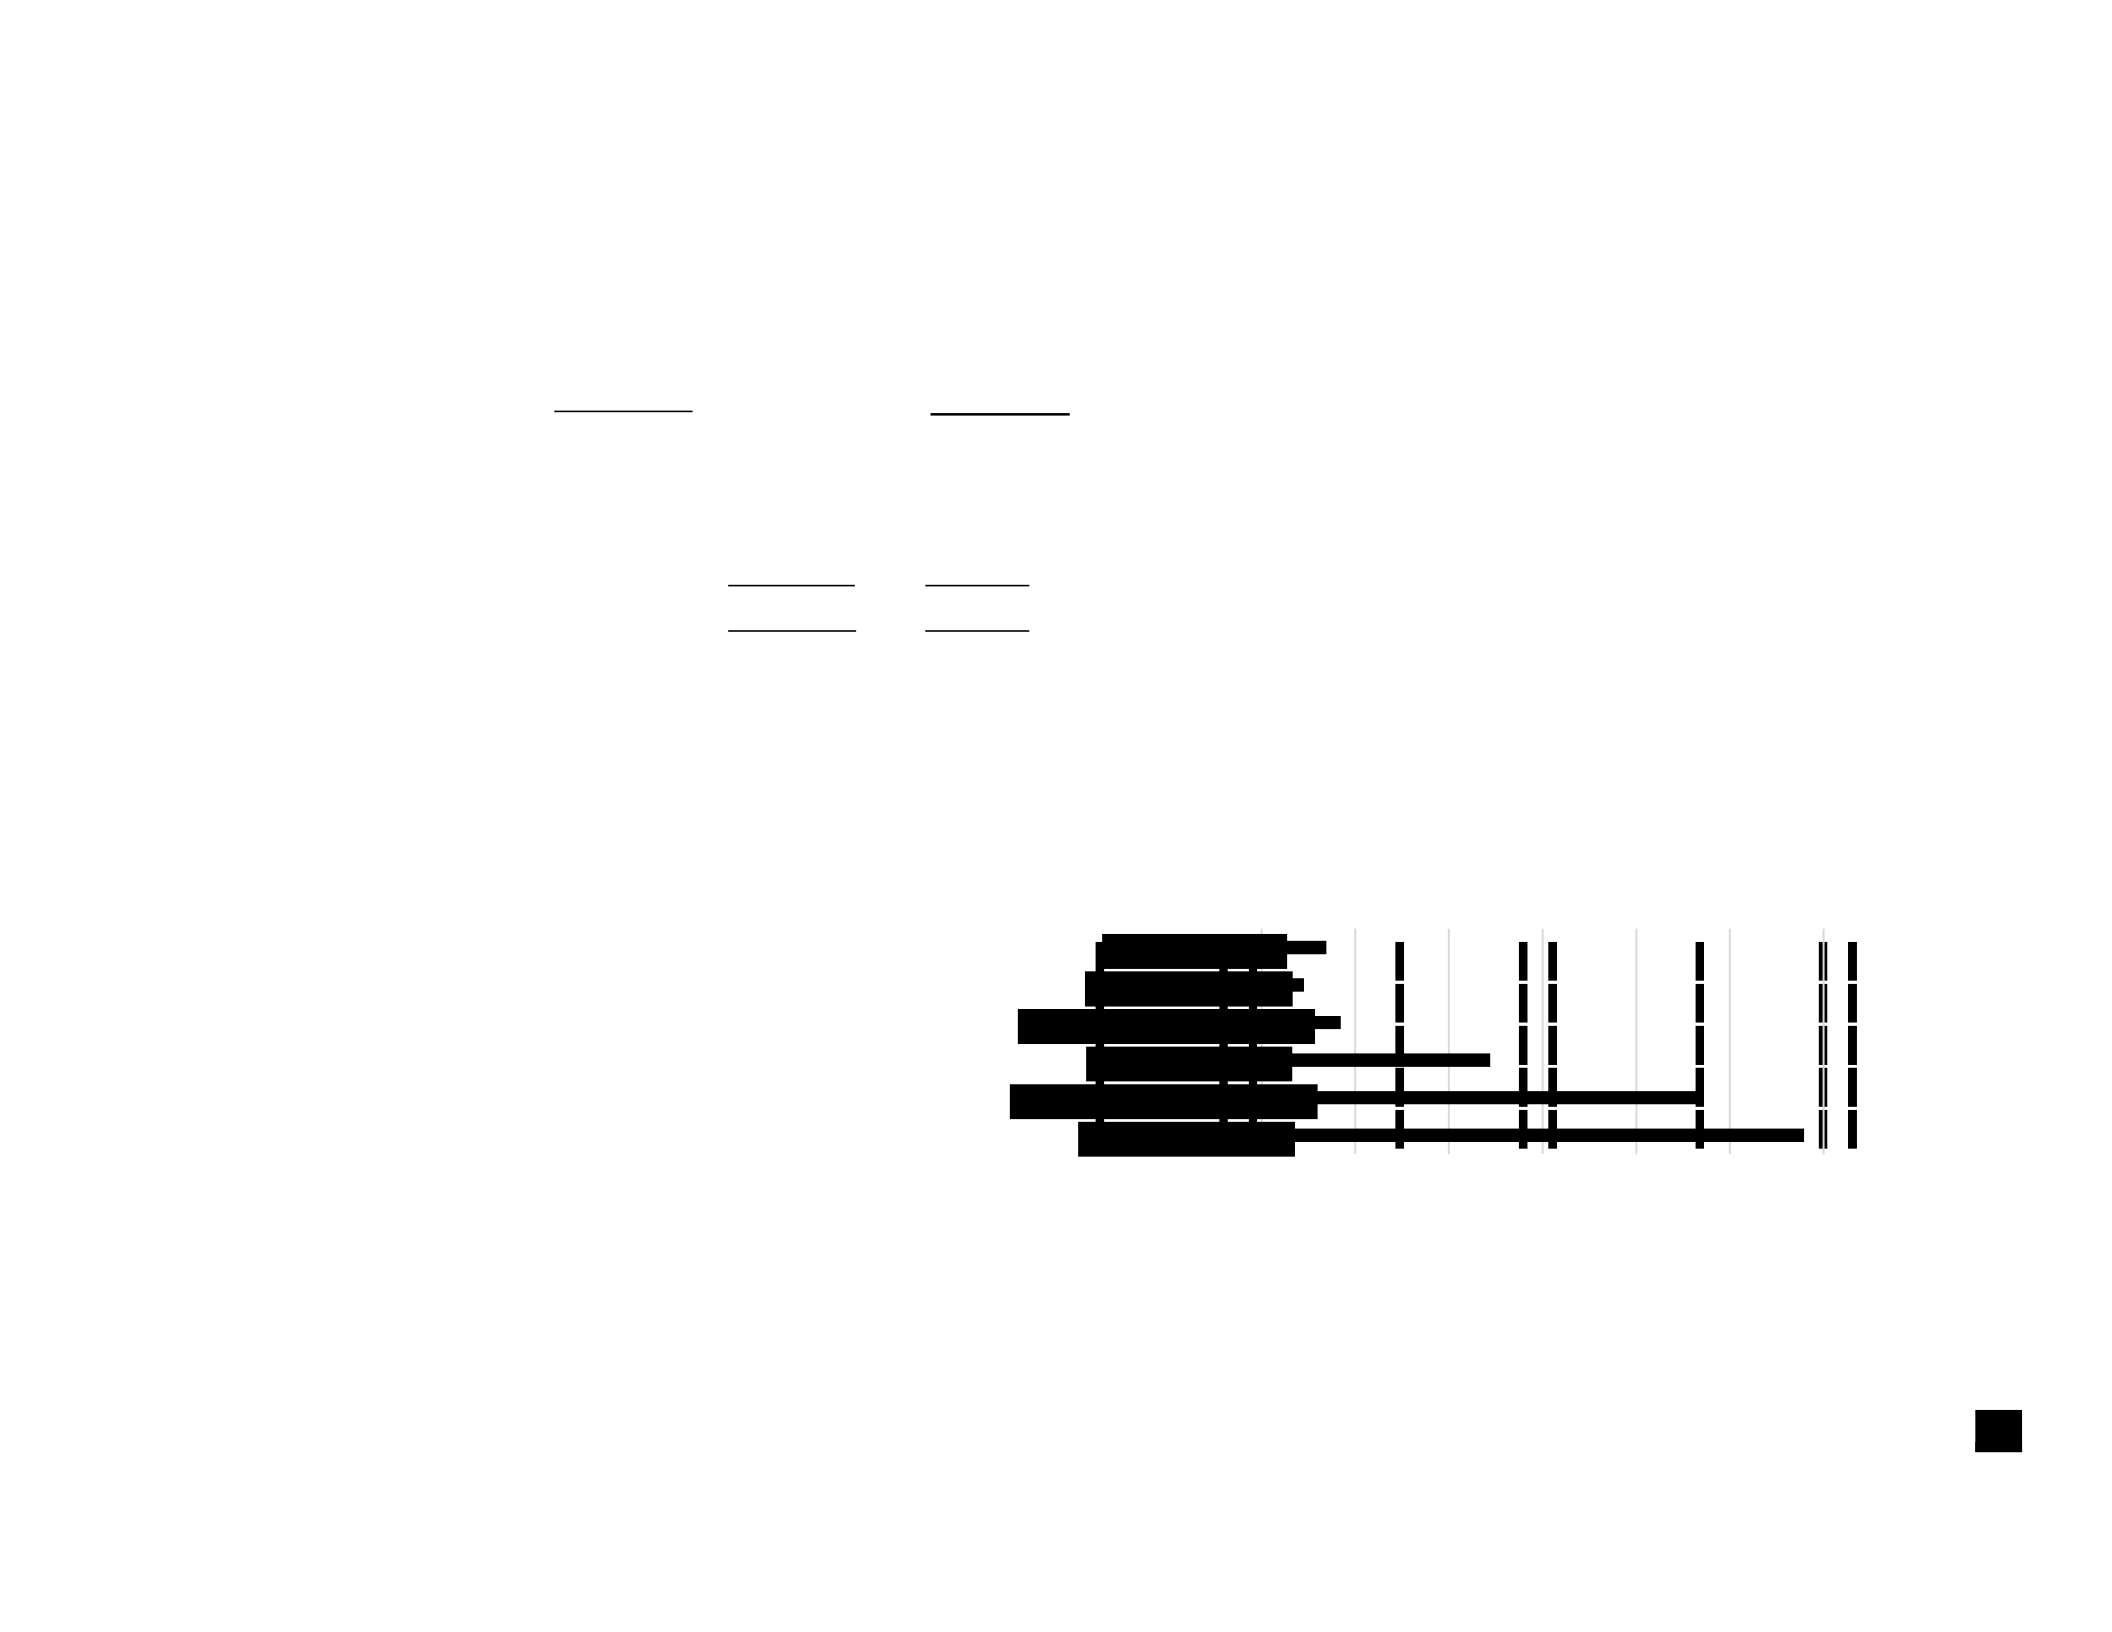
audit service line. Panel B of Table 4 shows just the auditor staffing percentages based
on the personnel sample. These percentages align more closely to the descending slope
shape that one would expect to see among audit departments, with audit partners, audit
principals, and audit senior managers constituting the smaller headcount at the top which
Big 4 Firm A
41,406
96,063
43.10
Big 4 Firm B
37,171
50,856
73.09
Big 4 Firm C
36,568
46,240
79.08
Big 4 Firm D
24,721
33,357
74.11
139,866
226,516
61.75

27
then significantly increases when adding layers of audit managers, audit senior
associates, and audit associates.
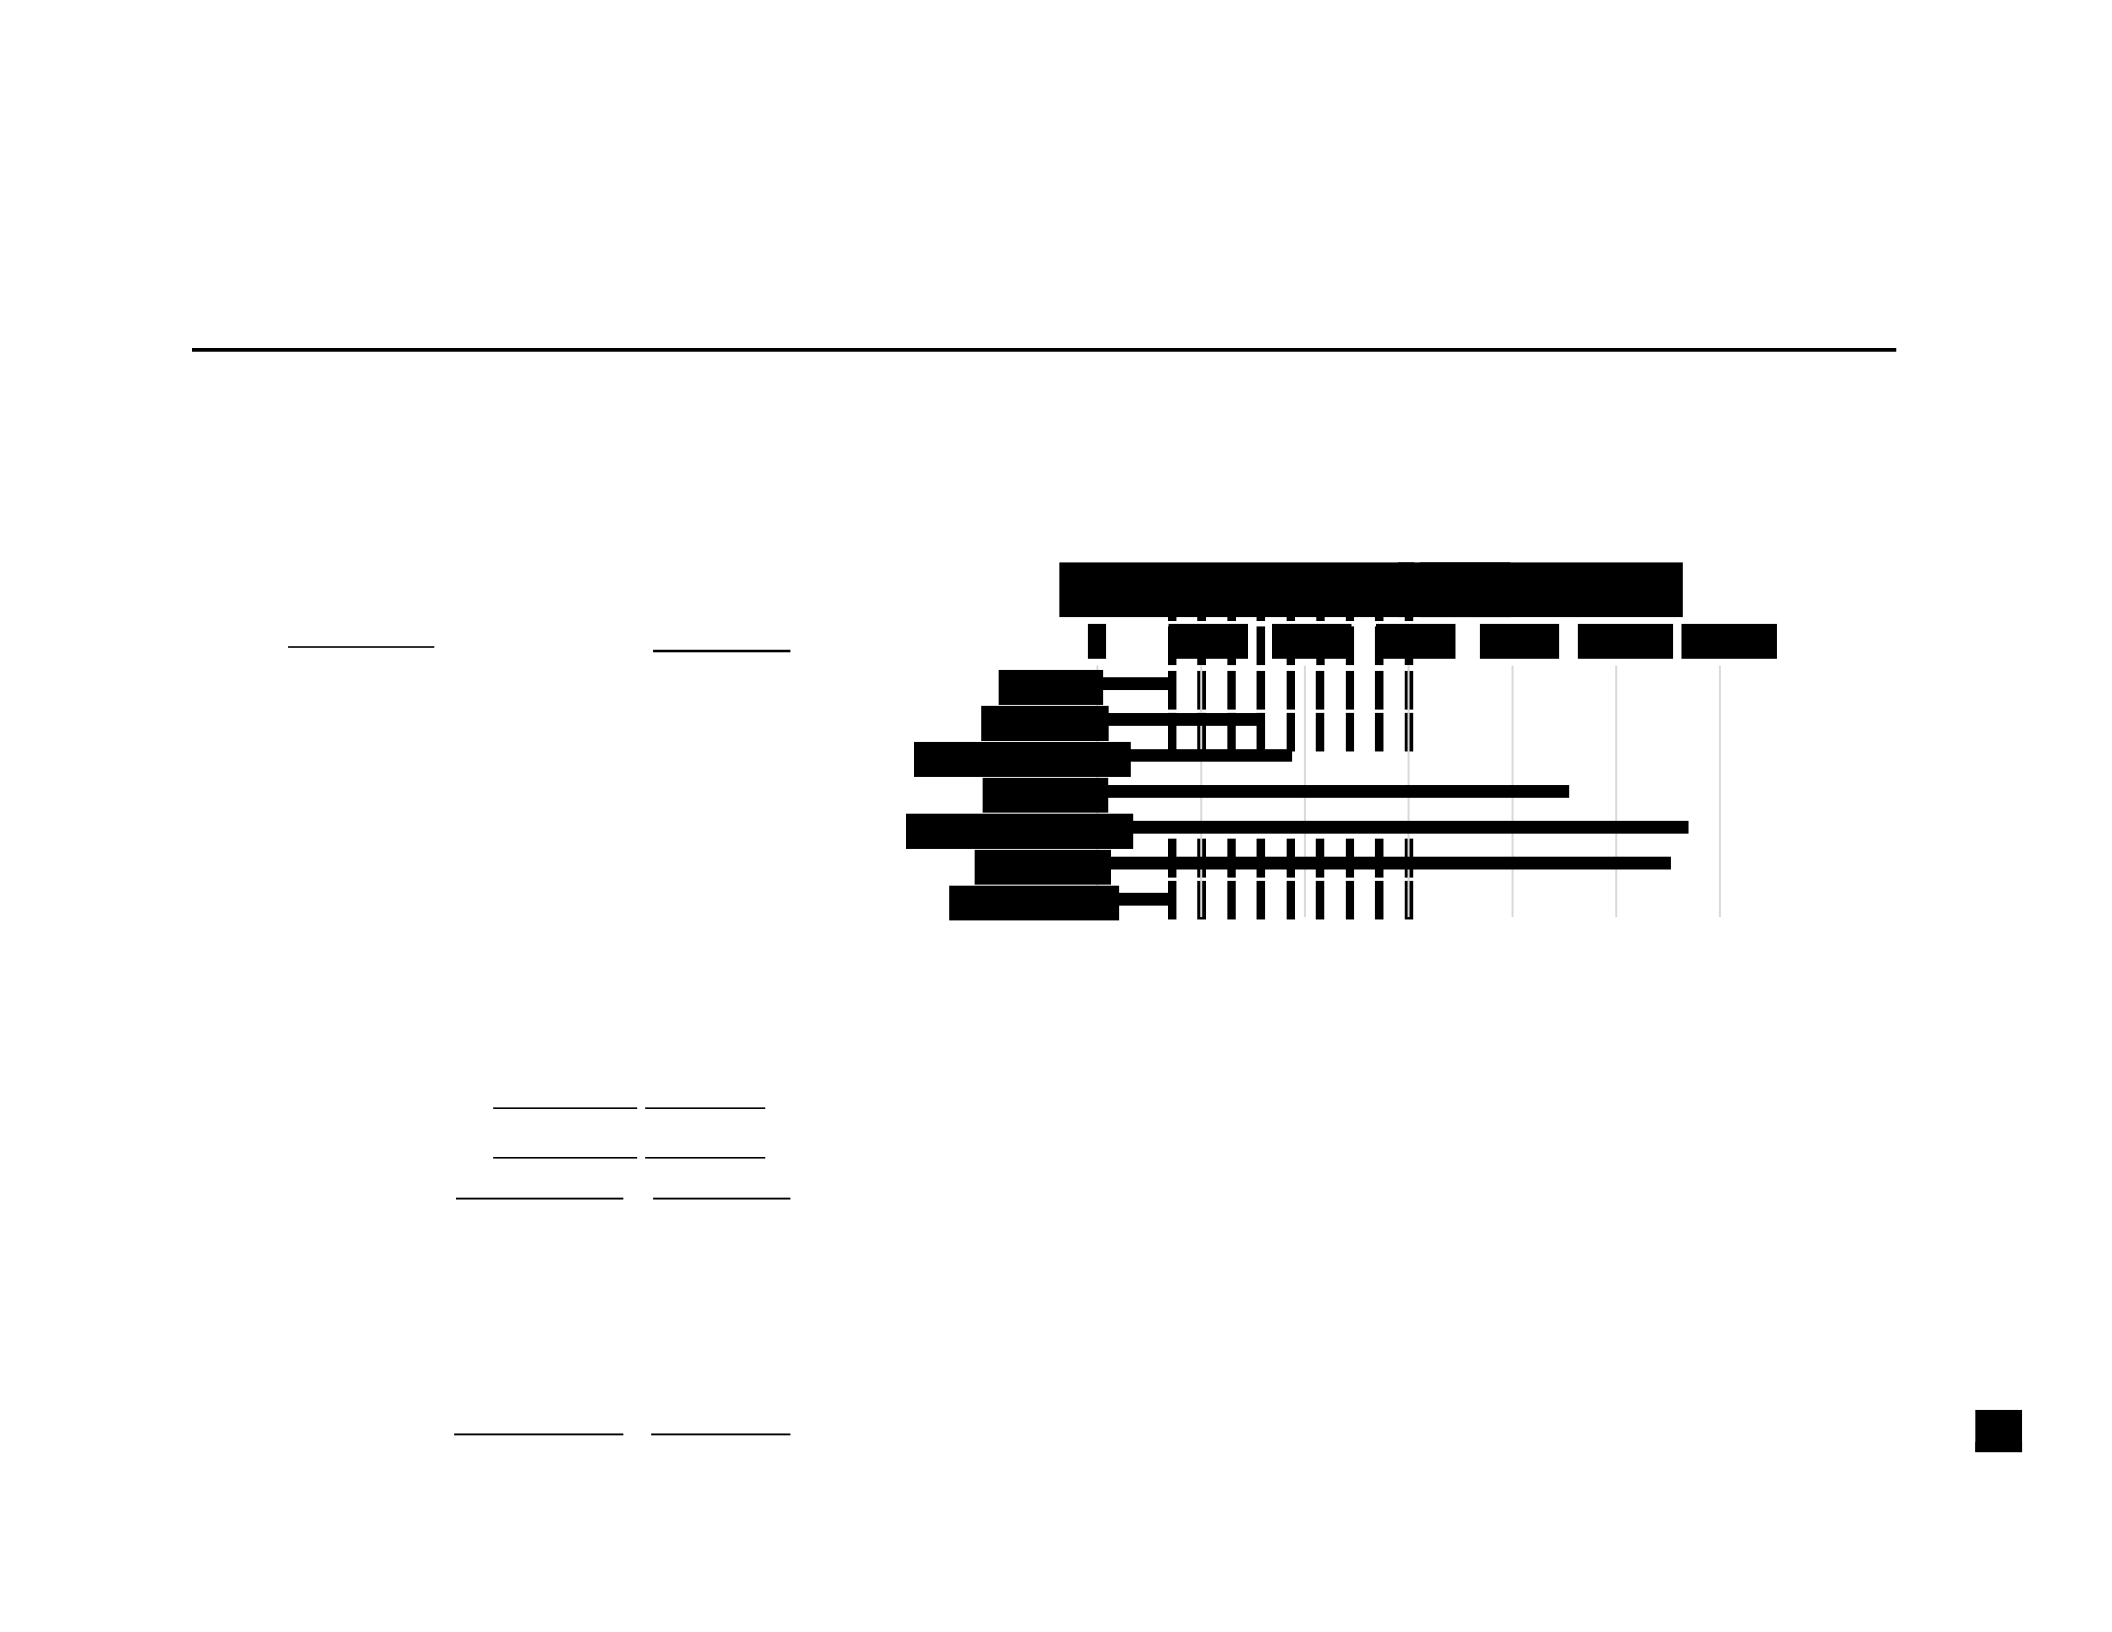
TABLE 4
Personnel Sample Staffing Proportions
Panel A: U.S. Big 4 Total Staffing % Based on Personnel Sample
Big 4 Big 4
Firm A Firm A
Headcount %
Partners 1,484 3.58
Principals 3,154 7.62
Senior Managers 3,753 9.06
Managers 9,096 21.97
Senior Associates 11,395 27.52
Associates 11,056 26.70
Admin/Legal 1,468 3.55
41,406 100.00
Big 4 Big 4
-
2,000
4,000
6,000
8,000
10,000
12,000
Partners
Principals
Senior Managers
Managers
Senior Associates
Associates
Admin/Legal
Total Firm Headcount
-
Big 4 Firm A
Firm B Firm B
Headcount %
Partners
1,818
4.89
Principals 5,527 14.87
Senior Managers 1,045 2.81
Managers 7,725 20.78
Senior Associates 8,215 22.10
Associates 11,821 31.80
Admin/Legal 1,020 2.74
37,171 100.00
Partners
1,360
5.50
Principals
3,781
15.29
Senior Managers
1,207
4.88
Managers
5,134
20.77
Senior Associates
5,444
22.02
Associates
7,051
28.52
Admin/Legal
744
3.01
24,721
100.00
Big 4
Firm C
Big 4
Firm C
Headcount
%
-
2,000
4,000
6,000
8,000
10,000
12,000
Partners
Principals
Senior Managers
Managers
Senior Associates
Associates
Admin/Legal
Total Firm Headcount
-
Big 4 Firm B
Total Firm Headcount - Big 4 Firm C
Partners
2,005
5.48
Principals
3,511
9.60
Senior Managers
3,256
8.90
Managers
7,639
20.89
Senior Associates
9,463
25.88
Associates
9,621
26.31
Admin/Legal
1,073
2.93
36,568
100.00
Big 4
Firm D
Big 4
Firm D
Headcount
%
-
2,000
4,000
6,000
8,000
10,000
Partners
Principals
Senior Managers
Managers
Senior Associates
Associates
Admin/Legal
Total Firm Headcount - Big 4 Firm D
Partners
6,667
4.77
Principals
15,973
11.42
Senior Managers
9,261
6.62
Managers
29,594
21.16
Senior Associates
34,517
24.68
Associates
39,549
28.28
Admin/Legal
4,305
3.08
139,866
100.00
Total Firm Headcount - All U.S.
Big 4
Total
Total
Headcount
%
-
1,000
2,000
3,000
4,000
5,000
6,000
7,000
8,000
Partners
Principals
Senior Managers
Managers
Senior Associates
Associates
Admin/Legal
-
5,000
10,000
15,000
20,000
25,000
30,000
35,000
40,000
Partners
Principals
Senior Managers
Managers
Senior Associates
Associates
Admin/Legal
Panel B: U.S. Big 4 Auditor Staffing %
Based on Personnel Sample
Total Auditor Headcount
- Big 4 Firm A
- 500 1,000 1,500 2,000 2,500 3,000
Big 4
Firm A
Big 4
Firm A
Headcount
%
Audit Partners
242
3.94
Audit Principals
166
2.70
Audit Senior Managers
475
7.73
Audit Managers
1,074
17.48
Audit Senior Associates
2,811
45.75
Audit Associates
1,376
22.40
6,144
100.00
Big 4
Firm B
Big 4
Firm B
Headcount
%
Audit Partners
452
5.26
Audit Principals
274
3.19
Audit Senior Managers
285
3.32
Audit Managers
1,288
15.00
Audit Senior Associates
1,952
22.73
Audit Associates
4,336
50.49
8,587
100.00
Audit Partners
Audit Principals
Audit Senior Managers
Audit Managers
Audit Senior Associates
Audit Associates
Total Auditor Headcount - Big 4 Firm B
- 500 1,000 1,500 2,000 2,500 3,000 3,500 4,000 4,500
Audit Partners
328
5.10
Audit Principals
251
3.90
Audit Senior Managers
408
6.34
Audit Managers
1,074
16.70
Audit Senior Associates
1,893
29.43
Audit Associates
2,478
38.53
6,432
100.00
Big 4
Firm C
Big 4
Firm C
Headcount
%
Audit Partners
Audit Principals
Audit Senior Managers
Audit Managers
Audit Senior Associates
Audit Associates
Total Auditor Headcount - Big 4
Firm C
- 500 1,000 1,500 2,000 2,500 3,000 3,500
Total Auditor Headcount - Big 4 Firm D
- 500 1,000 1,500 2,000 2,500
Audit Partners
358
4.16
Audit Principals
212
2.46
Audit Senior Managers
524
6.09
Audit Managers
1,447
16.82
Audit Senior Associates
2,667
31.01
Audit Associates
3,393
39.45
8,601
100.00
Big 4
Firm D
Big 4
Firm D
Headcount
%
Audit Partners
Audit Principals
Audit Senior Managers
Audit Managers
Audit Senior Associates
Audit Associates
Audit Partners
Audit Principals
Audit Senior Managers
Audit Managers
Audit Senior Associates
Audit Associates
Audit Partners
1,380
4.64
Audit Principals
903
3.03
Audit Senior Managers
1,692
5.68
Audit Managers
4,883
16.41
Audit Senior Associates
9,323
31.32
Audit Associates
11,583
38.92
29,764
100.00
Total Auditor Headcount - All U.S. Big 4
- 2,000 4,000 6,000 8,000 10,000 12,000
Total
Total
Headcount
%
Audit Partners
Audit Principals
Audit Senior Managers
Audit Managers
Audit Senior Associates
Audit Associates


37
To test the validity of the LinkedIn personnel data sample, certain characteristics
of the Big 4 offices are compared to various data sources. First, individual data provided
by a U.S. Big 4 office is compared to the personnel sample (See Panel A of Table 5). The
total headcount provided by a single U.S. Big 4 office is 1,909 compared to the
LinkedIn personnel headcount for that same office of 1,045. Panel B of Table 5 shows
631 specific names can be matched between the U.S. Big 4 office and LinkedIn, a
60.38% match. A less than full match of names is expected because the U.S. Big 4 office
provides the official first and last name, whereas the personnel sample from LinkedIn
include profiles where the individual uses a maiden/married last name, a “nickname” as a
first name, or a middle name as a first name. Panel C of Table 5 shows that, of the 631
names validated from the U.S. Big 4 data to the LinkedIn personnel sample, 87.80% of
job titles are matched.
TABLE 5
Comparison of Personnel Sample to U.S. Big 4 Office Data
Panel A: Comparison of a List of Employees with Job Titles
Validated by a U.S. Big 4 Office to the Personnel Sample
Headcount Total
Headcount per Headcount per Big 4 % of Personnel % of % Office Total
Sample Total Validated
Partners
168
8.80
45
4.31
26.79
Principals
219
11.47
128
12.25
58.45
Senior Managers
249
13.04
80
7.66
32.13
Managers
282
14.77
163
15.60
57.80
Senior Associates
507
26.56
272
26.03
53.65
Associates
396
20.74
338
32.34
85.35
Admin/Legal
88
4.61
19
1.82
21.59

38
Total
1,909
100.00
1,045
100.00
54.74
Panel B: Names from the Personnel Sample
Matched to the U.S. Big 4 Office List
Headcount Names
Total per Matched
Names
Personnel to Big 4 %
Sample List Validated
1,045 631 60.38
Panel C: Validated Names from the Personnel Sample
Matched to Job Titles from the U.S. Big 4 Office List
Names Job
Matched Matched Titles to Big 4 Job % List Titles Validated
631 554 87.80
Second, comparisons are also made between the personnel sample and the Form
AP data from the PCAOB website (See Table 6). The full Form AP data contains 2,228
unique partners, with firm and office information, who are responsible for audit
engagements filed between January 31, 2017 and April 30, 2018. The personnel sample
contains 1,380 audit partners, of which 623 are validated to the Form AP name, firm, and
office location, a match of 45.14%. Again, a less than full match of names is expected
because the Form AP data provides the engagement partners’ signed name, whereas the

39
personnel sample from LinkedIn will include profiles where the individual uses a
maiden/married last name, a “nickname” as a first name, or a middle name as a first name.
Additionally, it is assumed that the personnel sample includes audit partners that are not
required to sign the audit report, audit partners that solely provide technical expertise and
guidance, and audit partners that specialize in private companies, and therefore will not
appear in the Form AP data.
TABLE 6
Comparison of Personnel Sample Audit Partners
To PCAOB Form AP Data
Headcount Headcount Total per Matched to Headcount Personnel
Form AP %
Sample Data Validated
Audit Partners 1,380 623 45.14
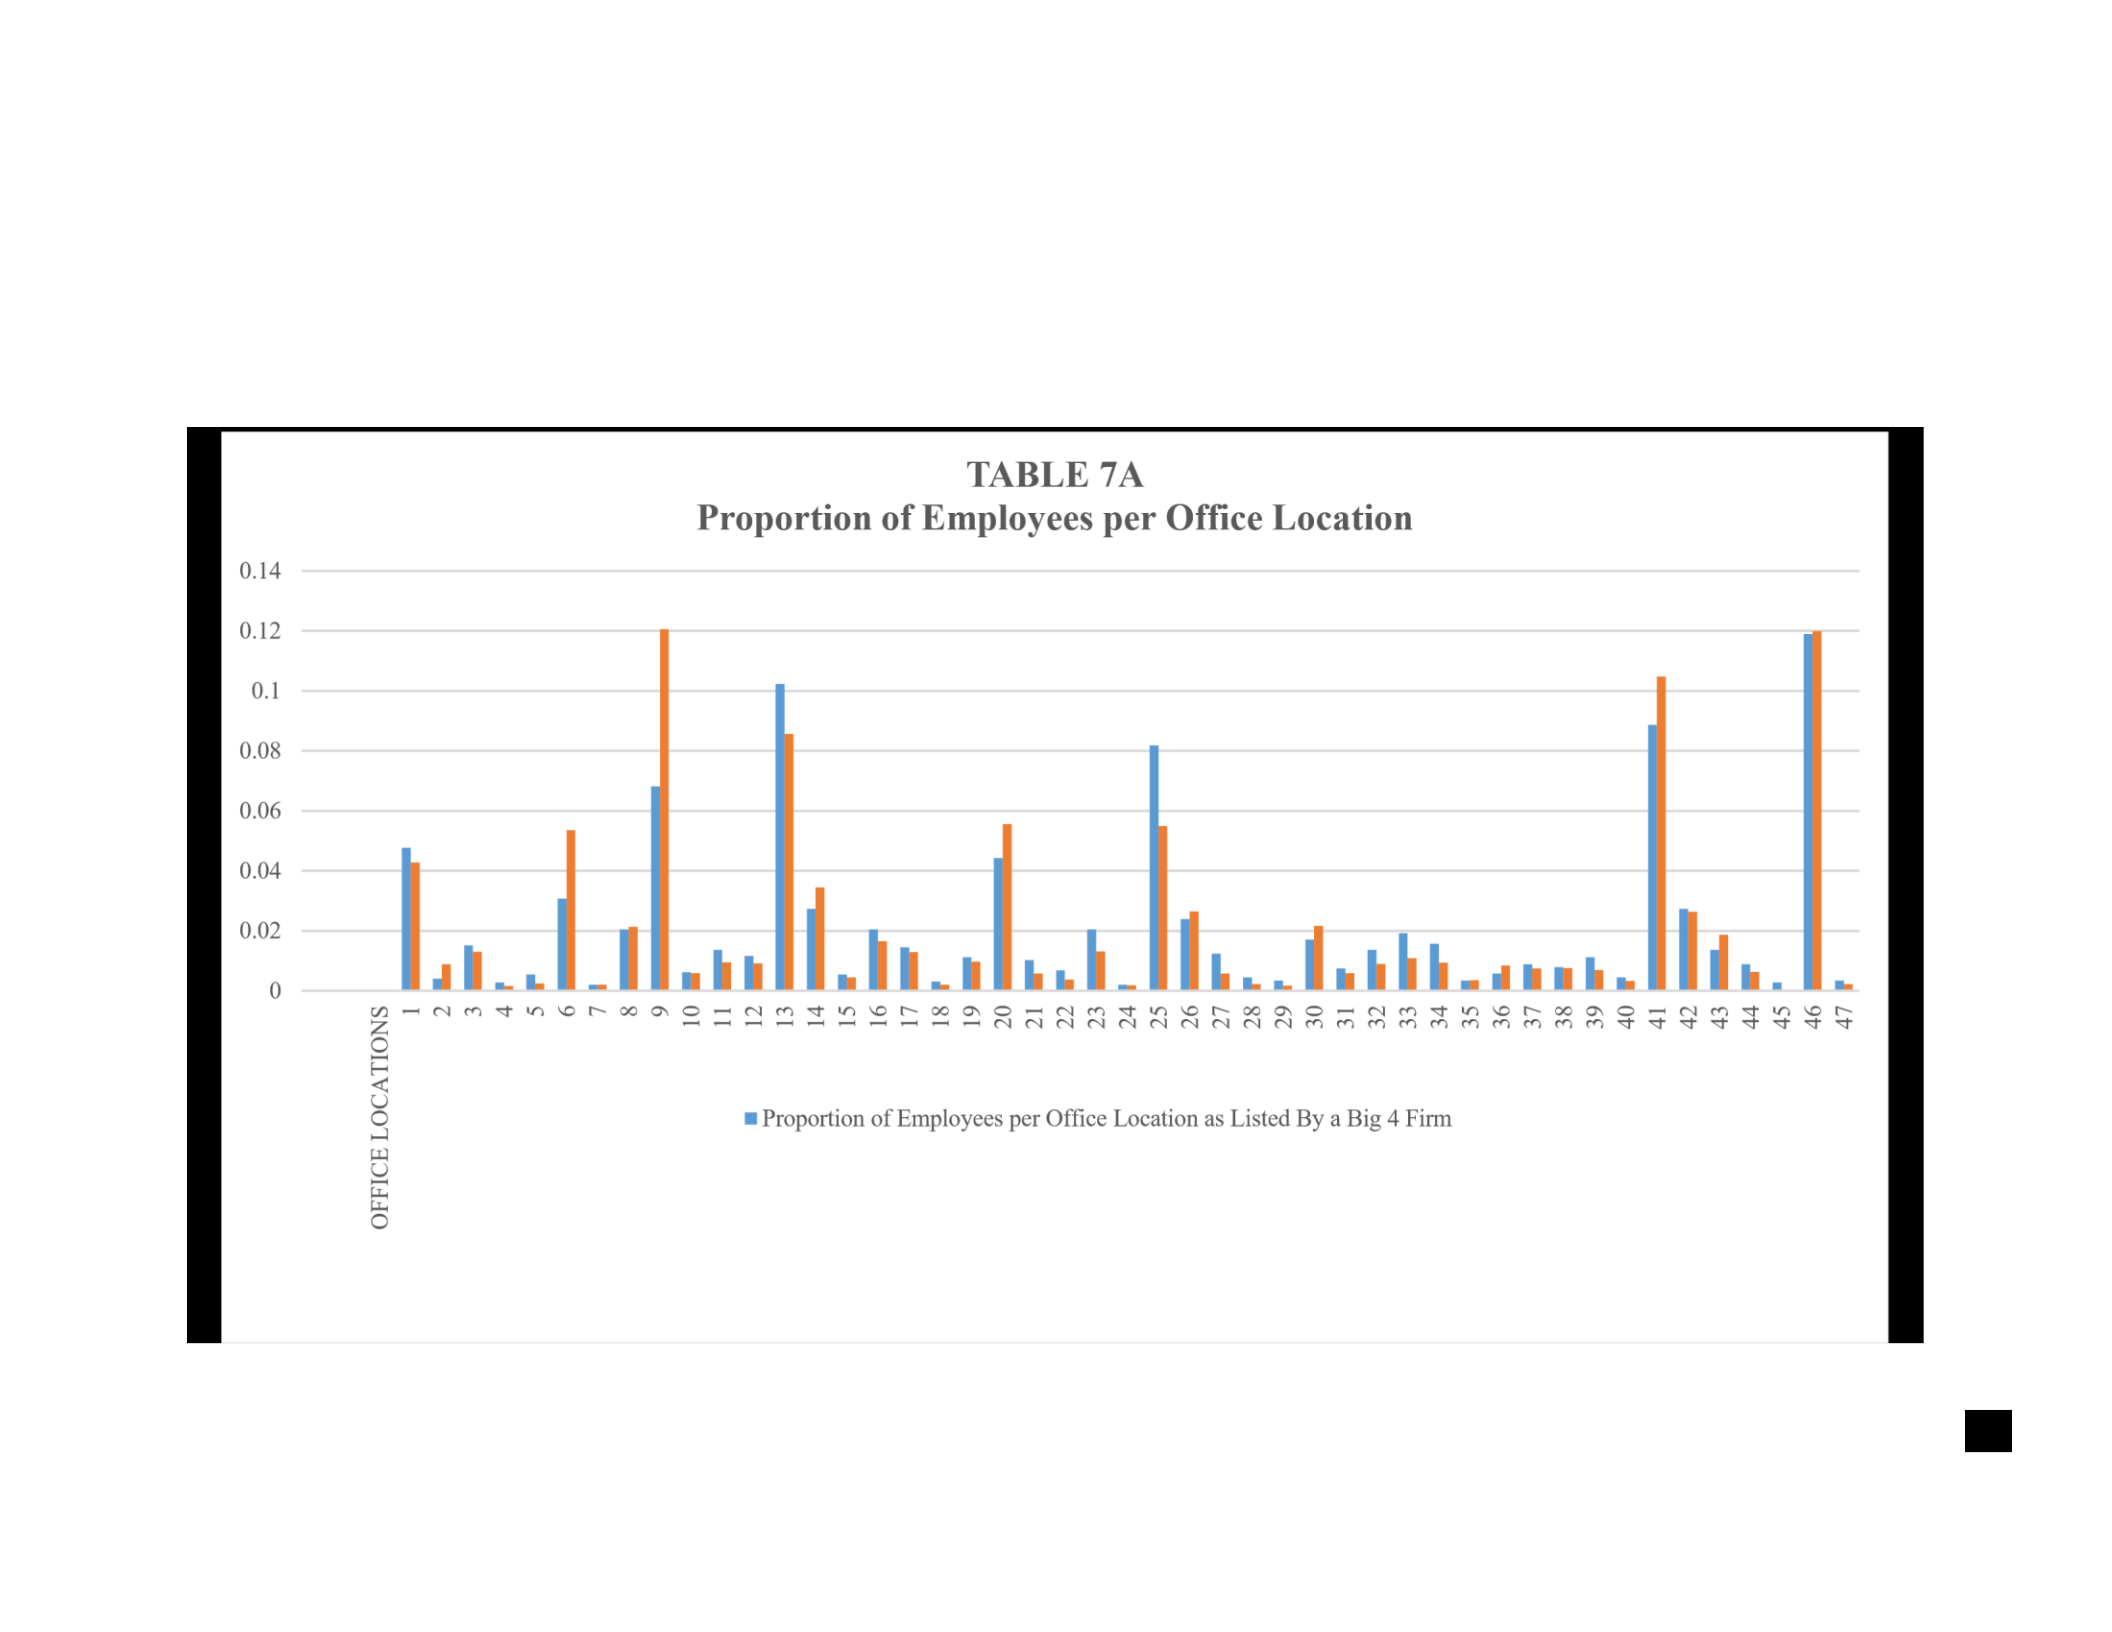
Third, the comparison of total employee headcount from a Big 4 website to the
headcount from the personnel sample is made (See Table 7A). The proportion of
employees per office location as listed by the Big 4 firm from their 2014 campus
information website is compared to the proportion of employees per office location as
listed in the personnel sample. The graph in Table 7A indicates that a reasonable spread of
total headcount in the personnel sample compared to the Big 4 firm data. All three
comparisons tests indicate a reasonable amount of validity in the personnel sample, and

40
the audit client data and personnel data are merged into one database, where individual
firm offices and auditors are matched with the audit clients they served.


43
38
While the audit client data covers 2011 to 2018, based on Compustat year
descriptions, the LinkedIn personnel data was extracted during a short period of time
(November 2017 to January 2018). An initial concern regarding these time frames is that
LinkedIn personnel data cannot be backfilled to dates prior to 2018, and it is possible that
personnel composition and characteristics will have changed drastically over time. To
address issues of using 2018 LinkedIn personnel data with 2011-2018 client data, two
trend comparisons are made to ascertain the extent to which the audit office personnel
composition changes over time. First, a paper by Hoopes, Merkley, Pacelli, and
Schroeder (2018) uses H-1B visa auditor information from the U.S. Department of Labor
to gather certain compensation data for Big 4 associates, senior associates, and managers
from 2004 to 2013 (See Table 7B). An H-1B visa allows foreign individuals to be
employed in certain types of specialty occupations.
TABLE 7B
H-1B Visa Associate, Senior Associate, and Manager Auditor Observations from 2004-
2013 (Hoopes et al., 2018, p. 46)
Observation Year No. of Observations % of Total Sample
2004
897
7%
2005
1,018
8%
2006
1,239
10%
2007
1,714
13%
2008
1,492
12%
2009
1,292
10%
2010
1,034
8%
2011
1,379
11%
2012
1,442
11%
2013
1,289
10%

Total 12,796 100% As Table 7C shows, the observations of audit
managers, audit senior associates, and audit associates compared to the total size of the
sample remains reasonably consistent both in total number of observations and total
percent of the sample. This persistency is expected due to the fact that there are no
significant changes in the number of audited public companies from year to year (i.e.
historically 9,000 – 10,000 public companies are listed in Compustat for each year).
Therefore, the existence of a significant change in the composition of total auditor
headcount from year to year would be unexpected.
Second, information about new U.S. partners and principals from 2015 to 2017
was obtained from promotion press releases issued on the websites for two of the Big 4
firms. The press release information includes, among several items, the offices in which
the newly minted partners and principals are practicing. Table 8 shows that the combined
number of new partners and principals for the two Big 4 firms by office is reasonably
consistent from 2015 to 2017, indicating that the amounts of partner and principal
promotions per office may not vary significantly over time.
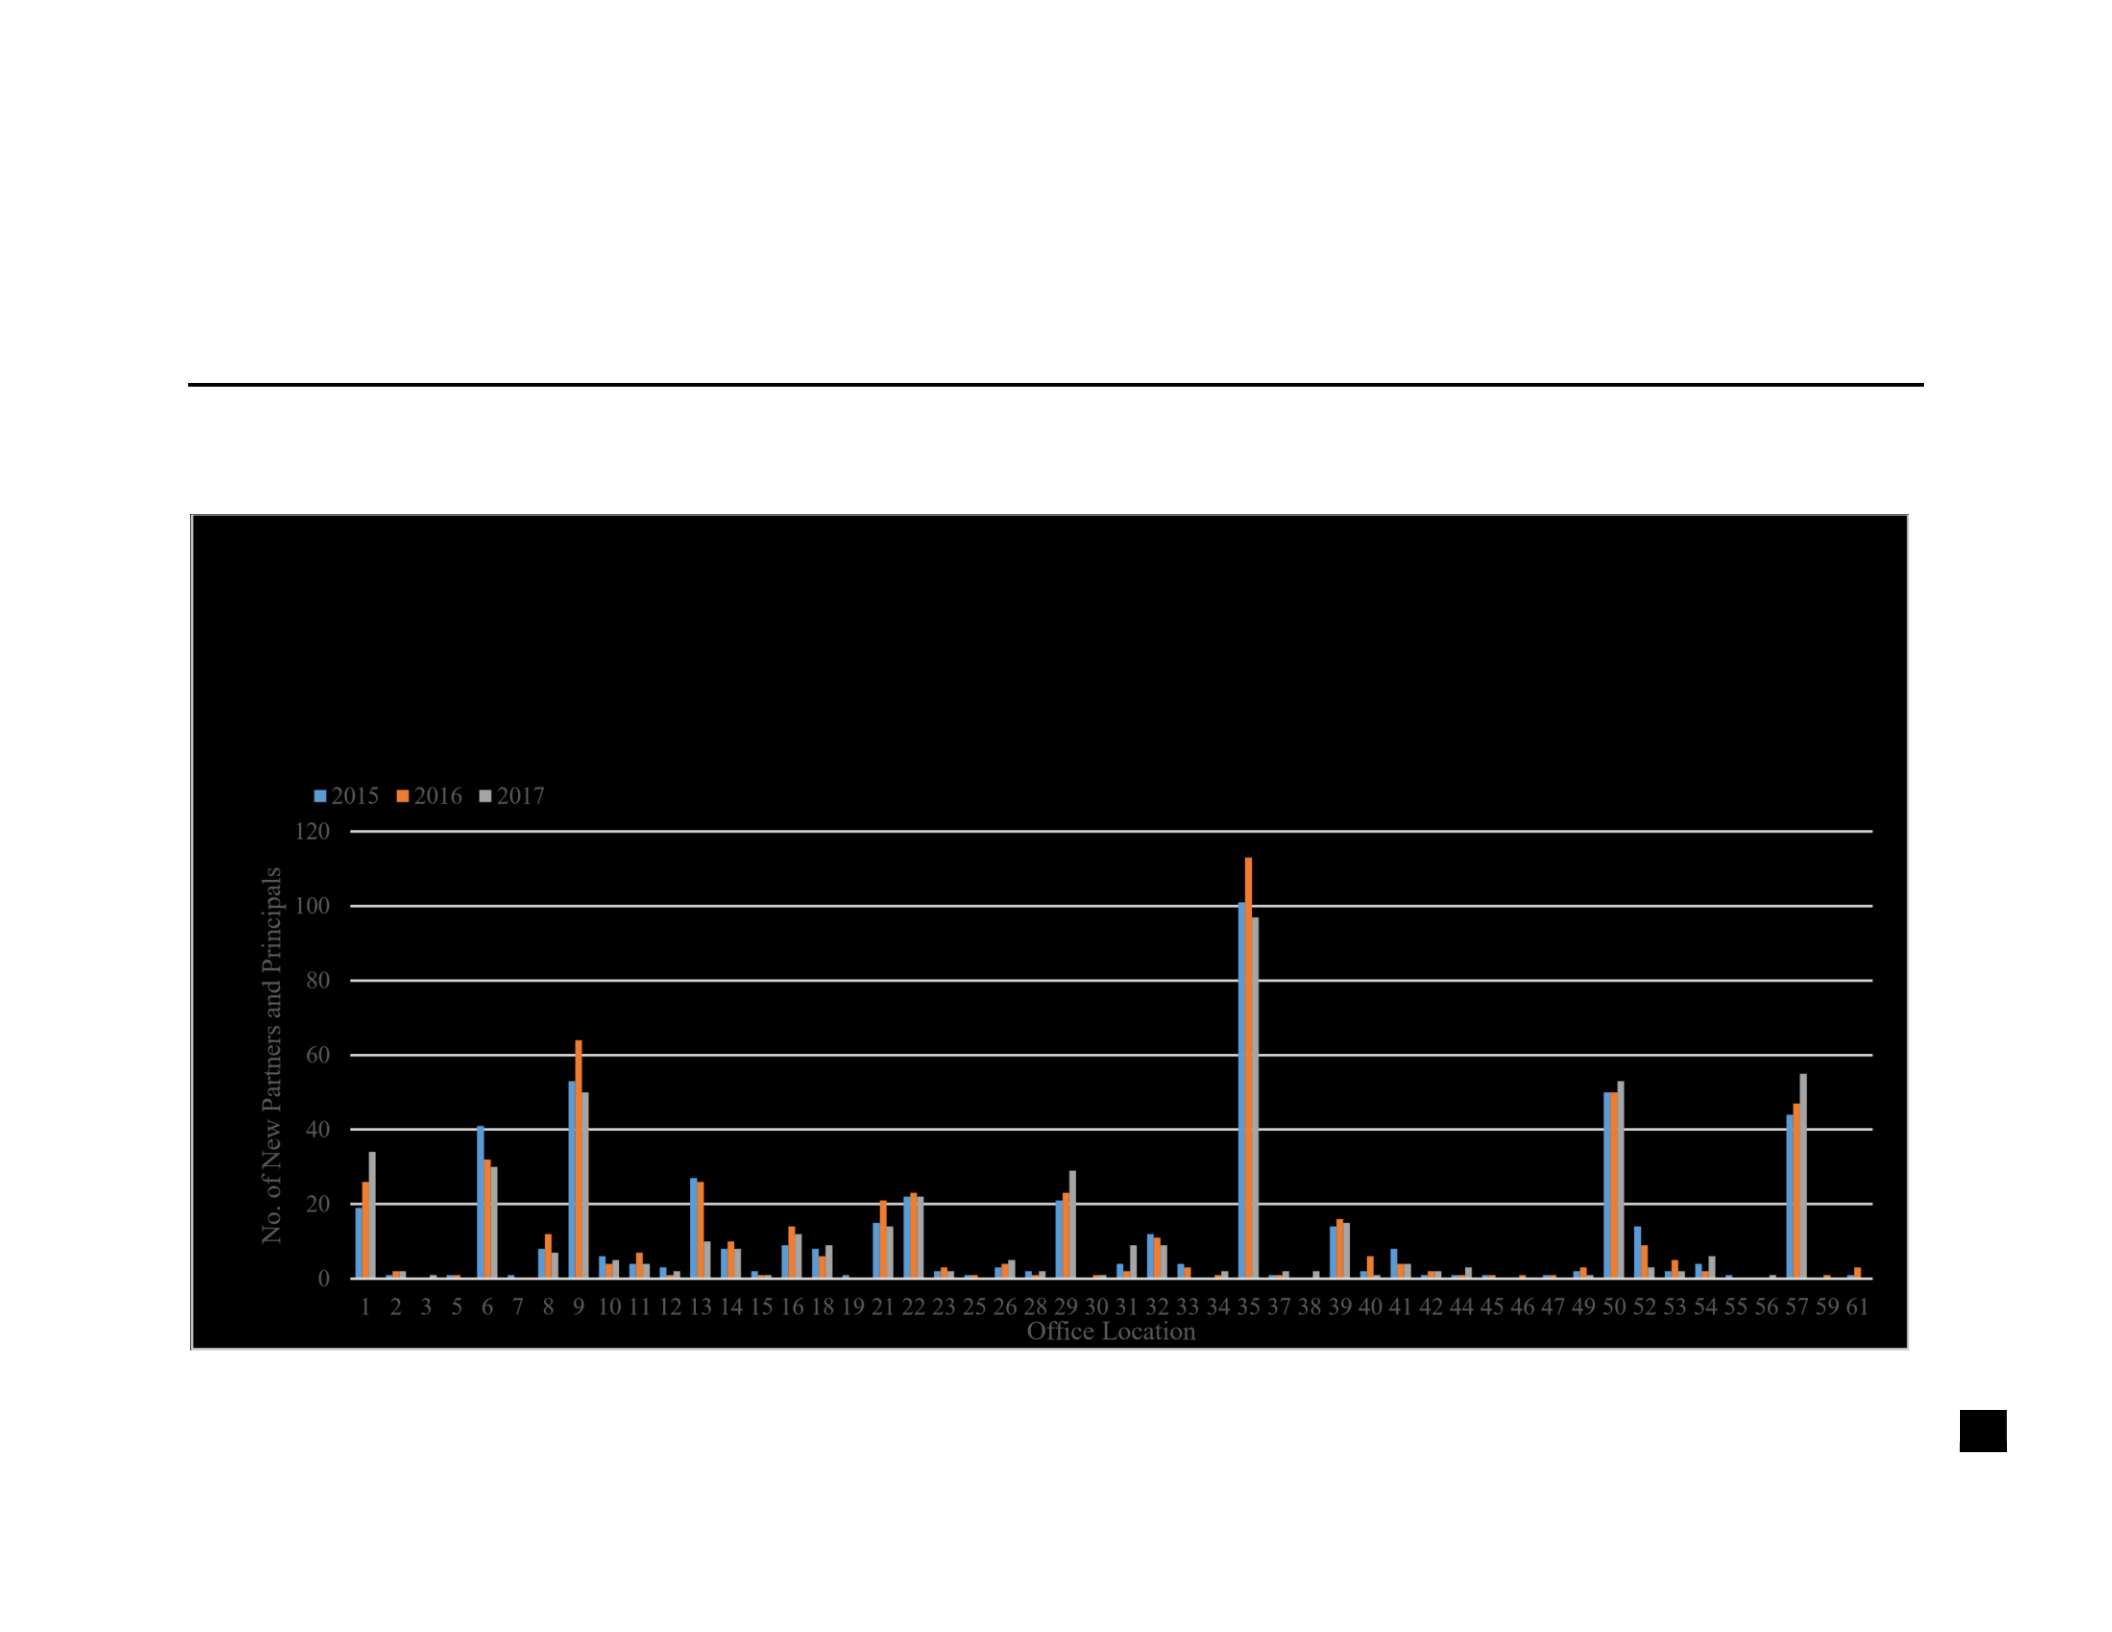
TABLE 7C
New Partners and Principals at Two Big 4 Firms


47
Empirical Models and Variables
Consistent with prior research on audit quality, OLS and logarithmic regression
models are estimated, examining the effect of Big 4 auditor office personnel
characteristics on audit quality (Hay et al., 2006; Hossain et al., 2017; Cahan & Sun,
2015). Table 8 defines main and alternative dependent variables (Panel A), test variables
(Panels B1, B2, and B3), and control variables (Panels C-F). Table 8 also presents the
expected association between all the independent variables and the dependent variables.
Audit Human Capital and Audit Quality
Audit human capital is measured at the office audit department level and for each
type of auditor (partners, principals, managers, and associates). These measurements
indicate the resources available to each office, whether physical resources or peer
resources. Prior research assumes that larger offices with more human capital tend to
have higher audit quality (Fun et al., 2012; Francis et al., 2013; Francis & Yu, 2009; Choi
et al., 2010). AU_DEPT is a measure of the number of total audit department staff
divided by total employees for each auditor office. Because a larger audit department
will have more resources, experience, and expertise, AU_DEPT is expected to positively
impact audit quality, and is the test variable for H1a.
Audit Quality = B0 + B1 AU_DEPT + Control Variables +
Year and Industry Fixed Effects + e (1a)
TABLE 8
Variable Definitions

48
Panel A: Main Dependent and Alternative Dependent Variables
Variable Name Variable Measurement (Source)
RESTATE = 1 if the audit client subsequently restates its current year financial
statements, and 0 otherwise (Audit Analytics);
ICW = 1 if the audit client receives an adverse internal control opinion, and 0
otherwise (Compustat-AUOPIC);
RESTATE_NO_ICW-# = 1 if there is a financial restatement without an ICW, and 0 for a
restatement that is accompanied by a related ICW (Audit Analytics,
Compustat-AUOPIC)
GCM = 1 if the audit client receives a going concern modified opinion, and 0
otherwise (Audit Analytics)
AU_FEES = natural logarithm of the audit fees paid by a client to the auditor (Audit
Analytics)
RESTATE_CE-# = 1 if the financial restatement affected core earnings, and 0 otherwise
(Compustat-AUOPIC, Compustat-NOPI, Compustat-NOPIO);
SEC_REG_FAR-# = 1 if the financial restatement was occurred at an auditor office located in
the same city as one of the twelve SEC regional offices, and 0 otherwise
(web search);
#: These variables are alternative measures and will be employed in supplementary analysis.
Panel B1: Test Variables Measuring Audit Human Capital
Expected
Variable Name Sign Variable Measurement (Source)
AU_DEPT +/- total audit department staff divided by total employees for each
auditor office (web search);
LG_OFFICE_SEN_LVL +/- 1 if the total audit partners, principals, senior managers, and
managers for each auditor office is greater than or equal to the
overall median audit partners, principals, senior managers, and
managers for the audit firm for the year, and 0 otherwise (web
search);
PG_AU_PART +/- the proportion of audit partners at the office with a post-graduate
degree (web search);
UG_MSA_AU_PART +/- the proportion of audit partners at the office that attended an
institution located in the same MSA as the office in which they
work (web search);
UG_ELITE_AU_PART +/- the proportion of audit partners at the office that attended an ivy-
league school, or a top-10 accounting school per US News (web
search);
UG_AACSB_ACC_AU_PART +/- the proportion of audit partners at the office that attended a school
with an accounting department separately accredited by the
AACSB (web search);

49
PG_AU_PRIN +/- the proportion of audit principals at the office with a post-
graduate degree (web search);
UG_MSA_AU_PRIN +/- the proportion of audit principals at the office that attended an
institution located in the same MSA as the office in which they
work (web search);
UG_ELITE_AU_PRIN +/- the proportion of audit principals at the office that attended an
ivy-league school, or a top-10 accounting school per US News
(web search);
UG_AACSB_ACC_AU_PRIN +/- the proportion of audit principals at the office that attended a
school with an accounting department separately accredited by
the AACSB (web search);
PG_AU_SMGR_MGR +/- the proportion of audit senior
managers and managers at the office with a post-graduate degree
(web search);
UG_MSA_AU_SMGR_MGR +/- the proportion of audit senior managers and managers at the
office that attended an institution located in the same MSA as the
office in which they work (web search);
UG_ELITE_AU_SMGR_MGR +/- the proportion of audit senior managers and managers at the
office that attended an ivy-league school, or a top-10
accounting school per US News (web search);
UG_AACSB_ACC_AU_SMGR_MGR +/- the proportion of audit senior managers and managers at the
office that attended a school with an accounting department
separately accredited by the AACSB (web search);
PG_AU_SEN_ASSOC +/- the proportion of audit senior
associates and associates at the office with a post-graduate
degree (web search);
UG_MSA_AU_SEN_ASSOC +/- the proportion of audit senior associates and associates at the
office that attended an institution located in the same MSA as the
office in which they work (web search);
UG_ELITE_AU_SEN_ASSOC +/- the proportion of audit senior associates and associates at the
office that attended an ivy-league school, or a top-10
accounting school per US News (web search);
UG_AACSB_ACC_AU_SEN_ASSOC +/- the proportion of audit senior associates and associates at the
office that attended a school with an accounting department
separately accredited by the AACSB (web search);
Panel B2: Test Variables Measuring Audit Personnel Experience
Expected
Variable Name Sign Variable Measurement (Source)
PART_EXP_DEPT_AVG +/- mean audit partner years of service for each auditor office (web
search);
PRIN_EXP_DEPT_AVG +/- mean audit principal years of service for each auditor office (web
search);
SMGR_MGR_EXP_DEPT_AVG +/- mean audit department senior manager and manager years of service
for each auditor office (web search);
SEN_ASSOC_EXP_DEPT_AVG +/- mean audit department senior associate and associate years of service
for each auditor office (web search);
PART_EXP_FIRM_AVG +/- mean audit partner years of service at the firm for each auditor office
(web search);
PRIN_EXP_FIRM_AVG +/- mean audit principal years of service years of service at the firm for
each auditor office (web search);

50
SMGR_MGR_EXP_FIRM_AVG +/- mean audit department senior manager and manager years of service
at the firm for each auditor office (web search);
SEN_ASSOC_EXP_FIRM_AVG +/- mean audit department senior associate and associate years of service
at the firm for each auditor office (web search);
PART_EXP_TOT_AVG +/- mean audit partner years of service as an auditor for each auditor
office (web search);
PRIN_EXP_TOT_AVG +/- mean audit principal years of service as an auditor for each auditor
office (web search);
SMGR_MGR_EXP_TOT_AVG +/- mean audit department senior manager and manager years of service
as an auditor for each auditor office (web search);
SEN_ASSOC_EXP_TOT_AVG +/- mean audit department senior associate and associate years of service
as an auditor for each auditor office (web search);
PART_TENURE_LONG +/- 1 if the partner overall experience as an auditor is above the median of
all other audit partners in the firm, and 0 otherwise (web search);
SM_OFFICE_CLIENTS +/- 1 if the total audit clients for each auditor office is less than the overall
median for the audit firm for the year, and 0 otherwise (web search);
PRIN_TENURE_LONG-# +/- 1 if the principal overall experience as an auditor is above the median
of all other audit principals in the firm, and 0 otherwise (web search);
PART_TENURE_LONG x +/- 1 if the partner overall experience as an auditor is above the
median of SM_OFFICE_CLIENTS all other audit partners in the firm multiplied by 1 if the total audit
clients for each auditor office is less than the overall median for the
audit firm for the year, and 0 otherwise (web search);
PRIN_TENURE_LONG x +/- 1 if the principal overall experience as an auditor is above the median
SM_OFFICE_CLIENTS-# of all other audit principals in the firm multiplied by 1 if the total audit
clients for each auditor office is less than the overall median for the
audit firm for the year, and 0 otherwise (web search);
#: These variables are alternative measures and will be employed in supplementary analysis.
Panel B3: Test Variables Measuring Audit Workload Compression
Expected
Variable Name Sign Variable Measurement (Source)
BUSY_FYE1 +/- number of clients with fiscal years ending in December for each auditor
office (Compustat-COMN, Compustat-FYR, Audit Analytics, web search);
BUSY_FYE1_PART +/- number of clients with fiscal years ending in December per
partner for each auditor office (Compustat-COMN, Compustat-FYR,
Audit Analytics, web search);
BUSY_FYE1_PRIN +/- number of clients with fiscal years ending in December per
principal for each auditor office (Compustat-COMN, Compustat-FYR,
Audit Analytics, web search);
BUSY_FYE1_SMGR_MGR +/- number of clients with fiscal years ending in December per senior
manager and manager for each auditor office (Compustat-COMN,
Compustat-FYR, Audit Analytics, web search);

51
BUSY_FYE1_SEN_ASSOC +/- number of clients with fiscal years ending in December per senior
associate and associate for each auditor office (Compustat-COMN,
Compustat-FYR, Audit Analytics, web search);
BUSY_FYE2_PART-# +/- number of clients with fiscal years ending between December and
January per partner for each auditor office (Compustat-COMN,
Compustat-FYR, Audit Analytics, web search);
BUSY_FYE2_PRIN-# +/- number of clients with fiscal years ending between December and
January per principal for each auditor office (Compustat-COMN,
Compustat-FYR, Audit Analytics, web search);
BUSY_FYE2_SMGR_MGR-# +/- number of clients with fiscal years ending between December and
January per senior manager and manager for each auditor office
(Compustat-COMN, Compustat-FYR, Audit Analytics, web search);
BUSY_FYE2_SEN_ASSOC-# +/- number of clients with fiscal years ending between December and
January per senior associate and associate for each auditor office
(Compustat-COMN, Compustat-FYR, Audit Analytics, web search);
BUSY_FYE3_PART-# +/- number of clients with fiscal years ending between November and
December per partner for each auditor office (Compustat-COMN,
Compustat-FYR, Audit Analytics, web search);
BUSY_FYE3_PRIN-# +/- number of clients with fiscal years ending between November and
December per principal for each auditor office (Compustat-COMN,
Compustat-FYR, Audit Analytics, web search);
BUSY_FYE3_SMGR_MGR-# +/- number of clients with fiscal years ending between November and
December per senior manager and manager for each auditor office
(Compustat-COMN, Compustat-FYR, Audit Analytics, web search);
BUSY_FYE3_SEN_ASSOC-# +/- number of clients with fiscal years ending between November and
December per senior associate and associate for each auditor office
(Compustat-COMN, Compustat-FYR, Audit Analytics, web search);
BUSY_FYE4_PART-# +/- number of clients with fiscal years ending between November and
January per partner for each auditor office (Compustat-COMN,
Compustat-FYR, Audit Analytics, web search);
BUSY_FYE4_PRIN-# +/- number of clients with fiscal years ending between November and
January per principal for each auditor office (Compustat-COMN,
Compustat-FYR, Audit Analytics, web search);
BUSY_FYE4_SMGR_MGR-# +/- number of clients with fiscal years ending between November and
January per senior manager and manager for each auditor office
(Compustat-COMN, Compustat-FYR, Audit Analytics, web search);
BUSY_FYE4_SEN_ASSOC-# +/- number of clients with fiscal years ending between November and
January per senior associate and associate for each auditor office
(Compustat-COMN, Compustat-FYR, Audit Analytics, web search);
LG_OFFICE_AUD_HC +/- number of clients with fiscal years ending in December for each auditor
office multiplied by 1 if the total audit department staff for each auditor
office is greater than or equal to the overall median for the audit firm for
the year, and 0 otherwise (Audit Analytics, web search);
#: These variables are alternative measures and will be employed in supplementary analysis.

52
Panel C: Common Control Variables
Expected
Variable Name Sign
Variable Measurement (Source)
AUDIT_CLIENTS +/- number of total audit clients divided by the number of total
auditors for each auditor office (Audit Analytics and web search);
SIZE +/- natural logarithm of a client's total assets (Compustat-AT);
LOSS +/- 1 if the client has a net loss in the current period, and 0 otherwise
(Compustat-NI)
EQUITY_MULTIPLIER + ratio of total assets to total equity (Compustat-DT, Compustat-AT)
QUICK - proportion of quick assets to current liabilities (Compustat-ACT,
Compustat-INVT, Compustat-XPP, Compustat-LCT);
OPSEG +/- number of operating segments reported for the client (Compustat-
Segments);
GEOSEG +/- number of geographical segments reported for the client (Compustat-
Segments);
LnPOPULATION - natural logarithm of a MSA population (2010 census data); FIRM_TENURE + 1 if client
tenure with the audit firm is three years or less, and 0
otherwise (Audit Analytics);
NATIONAL_LEADER - 1 if the audit firm receives the most fees in an industry at the national
level, and 0 otherwise (Audit Analytics);
CITY_LEADER - 1 if the audit firm receives the most fees in an industry at the city
level, and 0 otherwise (Audit Analytics);
NONAUDIT +/- natural logarithm of a client's non-audit service fees (Audit
Analytics);
FEM_AUDIT ? proportion of office audit department females tot total office audit
department (web search);
INITIAL +/- 1 if the client switched to a new auditor within the prior two years,
and 0 otherwise (Audit Analytics);
MERGER + 1 if there was a merger activity in the current period, and 0 otherwise
(Compustat-AQA);
Panel D: Control Variables Specific to Restatements
Expected
Variable Name Sign Variable Measurement (Source)
CHANGE_IN_RECEIVABLES + percentage change in accounts receivable from t-1 to t (Compustat-

53
ARTFS);
CHANGE_IN_INVENTORIES + percentage change in inventories from t-1 to t (Compustat-INVT);
CHANGE_IN_CASH_SALES + percentage change in cash sales from t-1 to t (Compustat-REVT,
Compustat-ARTFS);
Panel E: Control Variables Specific to Going Concern Opinion Modifications
Variable Name Sign Variable Measurement (Source)
REPORTLAG + number of days between the end of the fiscal year and the date that
earnings are announced (Audit Analytics);
BANKRUPTCY - probability that bankruptcy will not occur, using the Altman Z-score
(Audit Analytics);
Panel F: Control Variables Specific to Audit Fees
Expected
Variable Name Sign Variable Measurement (Source)
FOREIGN + percentage of sales from non-U.S. localities (Factset Revere)
DCFO + 1 if the client reported negative operating cash flows (Compustat-
OANCF);
GROWTH + percentage increase in total assets from the prior period (Compustat-
AT);
In addition to AU_DEPT, a measure for offices in which the total audit partners,
principals, senior managers, and managers are greater than or equal to the overall median
total audit partners, principals, senior managers, and managers for the audit firm is
calculated (LG_OFFICE_SEN_LVL): these are the test variables for H1b. Although all

54
staffing levels are individually expected to have a positive relationship with audit quality,
the relationship is expected to be greater at more senior levels than at less senior levels.
Audit Quality = B0 + B1 AU_DEPT + B2 LG_OFFICE_SEN_LVL + Control
Variables + Year and Industry Fixed Effects + e (1b)
Auditors with a post-graduate degree might positively impact audit quality more
than auditors with just an undergraduate degree. Similarly, auditors from schools that are
known to produce accountants with higher CPA exam pass rates are viewed as being
foundationally strong investments to employers. Because of the higher turnover rates in
public accounting, firms must be able to maintain the right amount of human capital.
Finally, offices that can fill their human capital needs from local universities should be
able to maintain higher audit quality than offices that have to travel outside their local
area to fill their human capital needs. Measures for the following will create an
interaction effect between educational effects and each staffing level, and represent the
test variables for H1c: the proportion of audit partners, principals, senior
managers/managers, and senior associates/associates at the office with a post-graduate
degree (PG_AU_PART; PG_AU_PRIN; PG_AU_SMGR_MGR; PG_AU_SEN_ASSOC);
the proportion of audit partners, principals, senior managers/managers, and senior
associates/associates at the office that attended an ivy-league school, or a top-10
accounting school per US News (UG_ELITE_AU_PART; UG_ELITE_AU_PRIN;
UG_ELITE_AU_SMGR_MGR; UG_ELITE_AU_SEN_ASSOC); the proportion of audit
partners, principals, senior managers/managers, and senior associates/associates at the
office that attended an institution located in the same MSA as the office in which they

55
work (UG_MSA_AU_PART; UG_MSA_AU_PRIN; UG_MSA_AU_SMGR_MGR;
UG_MSA_AU_SEN_ASSOC); and the proportion of audit partners, principals, senior
managers/managers, and senior associates/associates at the office that attended a school
with an accounting department separately accredited by the AACSB
(UG_AACSB_ACC_AU_PART; UG_AACSB_ACC_AU_PRIN;
UG_AACSB_ACC_AU_SMGR_MGR; UG_AACSB_ACC_AU_SEN_ASSOC).
Audit Quality = B0 + B1 PG_AU_PART + B2 UG_ELITE_AU_PART +
B3 UG_MSA_AU_PART + B4 UG_AACSB_ACC_AU_PART + Control Variables + Year
and Industry Fixed Effects + e (1c)
Audit Quality = B0 + B1 PG_AU_PRIN + B2 UG_ELITE_AU_PRIN +
B3 UG_MSA_AU_PRIN + B4 P UG_AACSB_ACC_AU_PRIN + Control Variables +
Year and Industry Fixed Effects + e (1c)
Audit Quality = B0 + B1 PG_AU_SMGR_MGR +
B2 UG_ELITE_AU_SMGR_MGR + B3 UG_MSA_AU_SMGR_MGR + B4
UG_AACSB_ACC_AU_SMGR_MGR + Control Variables + Year and Industry Fixed
Effects + e (1c)
Audit Quality = B0 + B1 PG_AU_SEN_ASSOC +
B2 UG_ELITE_AU_SEN_ASSOC + B3 UG_MSA_AU_SEN_ASSOC + B4
UG_AACSB_ACC_AU_SEN_ASSOC + Control Variables + Year and Industry Fixed
Effects + e (1c)

56
Audit Personnel Experience and Audit Quality
Auditor experience is measured at three levels (audit office, audit firm, and audit
profession) for each type of auditor (partner, principal, senior manager/manager, and
senior associate/associate). Both Cahan and Sun (2015) and Gul et al., (2013) show the
years of experience of a signing audit partner may have a positive relationship with audit
quality, while Hossain et al. (2015) show that the experience of senior and staff associates
may have a less significant relationship with audit quality. In addition, prior experiments
have shown that more experienced auditors tend to make the most appropriate decisions
(Kinney & Uecker, 1982). Audit office experience is measured as the mean years of
service at the office audit department for each staffing level and is expected to have a
greater positive impact to audit quality at more senior auditor levels than at less senior
auditor levels (PART_EXP_ DEPT_AVG, PRIN_EXP_ DEPT_AVG,
SMGR_MGR_EXP_ DEPT_AVG, and SEN_ASSOC_EXP_ DEPT_AVG), and constitutes
the test variables for H2a (audit department experience).
Audit Quality = B0 + B1 PART_EXP_ DEPT_AVG + B2 PRIN_EXP_ DEPT_AVG
+ B3 SMGR_MGR_EXP_ DEPT_AVG + B4 SEN_ASSOC_EXP_ DEPT_AVG + Control
Variables + Year and Industry Fixed Effects + e (2a)
Auditor firm experience is measured as the mean years of service at the audit
firm, capturing any effects of auditor experience in more than one office of their current
firm, and is expected to have a greater positive impact to audit quality at more senior
auditor levels than at less senior auditor levels (PART_EXP_ FIRM_AVG, PRIN_EXP_
FIRM_AVG, SMGR_MGR_EXP_ FIRM_AVG, and SEN_ASSOC_EXP_ FIRM_AVG),

57
and constitutes the test variables for H2a (audit firm experience).
Audit Quality = B0 + B1 PART_EXP_ FIRM_AVG + B2 PRIN_EXP_ FIRM_AVG
+ B3 SMGR_MGR_EXP_ FIRM_AVG + B4 SEN_ASSOC_EXP_ FIRM_AVG + Control
Variables + Year and Industry Fixed Effects + e (2a)
Auditor total experience is measured as the mean years of service as an auditor,
capturing any effects of auditor experience at different firms, and is expected to have a
greater positive impact to audit quality at more senior auditor levels than at less senior
auditor levels (PART_EXP_ TOT_AVG, PRIN_EXP_ TOT_AVG,
SMGR_MGR_EXP_ TOT_AVG, and SEN_ASSOC_EXP_ TOT_AVG), and constitutes the
test variables for H2a (total auditor experience).
Audit Quality = B0 + B1 PART_EXP_ TOT_AVG + B2 PRIN_EXP_ TOT_AVG +
B3 SMGR_MGR_EXP_ TOT_AVG + B4 SEN_ASSOC_EXP_ TOT_AVG + Control
Variables + Year and Industry Fixed Effects + e (2a)
There is some evidence to suggest that individuals in leadership positions begin to
lose their productivity after reaching an extended level of tenure due to complacency and
resistance to firm changes (Miller, 1991; Carey & Simnett, 2006). Additionally, the
productivity of these individuals may decline more at smaller offices rather than at larger
offices (Miller, 1991). Therefore, this study measures both long and short audit partner
tenure and its effect on audit quality, while also considering the size of the office audit
department. Typically, accounting studies have calculated audit partner tenure with

58
respect to the length of time associated with particular audit clients (Carey & Simnett,
2006). However, since this study is focused more on the partner’s overall personal
experience, this study uses Miller’s (1991) method of dividing CEO tenure subgroups
into long and short according to the median years of experience. The variable
PART_TENURE_LONG equals 1 if the partner’s overall experience as an auditor is above
the median of all other audit partners at the firm, and 0 otherwise.
SM_OFFICE_CLIENTS is 1 if the total audit clients for each auditor office is less than
the overall median for the audit firm for the year, and 0 otherwise, and is a measure of
office audit department size.
PART_TENURE_LONG x SM_OFFICE_CLIENTS is the interaction of these two
variables created to assess main effects. These are the test variables.
Audit Quality = B0 + B1 PART_TENURE_LONG + B2 SM_OFFICE_CLIENTS +
B3 PART_TENURE_LONG x SM_OFFICE_CLIENTS + Control Variables + Year and
Industry Fixed Effects + e (2b)
In supplemental analyses, this study performs the same measurements for
principals. Principals are sometimes considered to be client service partners or nonequity
partners and might also possess a deteriorating audit quality effect of long tenure.
The variable PRIN_TENURE_LONG equals 1 if the principal’s overall experience as an
auditor is above the median, and 0 otherwise. PRIN_TENURE_LONG x
SM_OFFICE_CLIENTS is the interaction of 1 if the principal overall experience as an
auditor is above the median of all other audit principals in the firm multiplied by 1 if the

59
total audit clients for each auditor office is less than the overall median for the audit firm
for the year, and 0 otherwise
Audit Workload Compression and Audit Quality
Auditor workload compression is measured by the size of the audit department in
terms of audit staff and for each type of auditor in the audit department. The largest
portion of audit client fiscal years end during December, resulting in a two to three month
busy season compression. This compression has been shown to result in decreased audit
quality (Lopez & Peters, 2012). The variable BUSY_FYE1 is the number of clients with
fiscal years ending in December for each auditor office, and is the test variable for H3a.
Audit Quality = B0 + B1 BUSY_FYE1 + Control Variables + Year and Industry
Fixed Effects + e (3a)
It is expected that workload compression affects the audit department associate
and manager levels to a greater extent since they are working at the engagement level
rather than the high-level review (Lopez & Peters, 2012). Therefore, this study also
measures the number of December fiscal year-end audit clients as a proportion of the
office audit department staffing level (BUSY_FYE1_PART, BUSY_FYE1_PRIN,
BUSY_FYE1_SMGR_MGR, and BUSY_FYE1_SEN_ASSOC). Because workload
compression is expected to affect large offices differently than smaller offices, this study
also measures the number of clients with fiscal years ending in December for each
auditor office multiplied by 1 if the total audit department staff for each auditor office is
greater than or equal to the overall median for the audit firm for the year, and 0 otherwise

60
(LG_OFFICE_AUD_HC). Together, these constitute the test variables for H3b. In
supplemental analysis, this study also measures these variables for alternate November
(BUSY_FYE2_PART, BUSY_FYE2_PRIN, BUSY_FYE2_SMGR_MGR, and
BUSY_FYE2_SEN_ASSOC), January (BUSY_FYE3_PART, BUSY_FYE3_PRIN,
BUSY_FYE3_SMGR_MGR, and BUSY_FYE3_SEN_ASSOC) and November to January
(BUSY_FYE4_PART, BUSY_FYE4_PRIN, BUSY_FYE4_SMGR_MGR, and
BUSY_FYE4_SEN_ASSOC) busy season windows to investigate the sensitivity of busy
season to audit planning, issues, and delays (Lopez & Peters, 2012).
Audit Quality = B0 + B1 BUSY_FYE1_PART + B2 BUSY_FYE1_PRIN + B3
BUSY_FYE1_SMGR_MGR + B4 BUSY_FYE1_SEN_ASSOC +
B5 LG_OFFICE_AUD_HC + Control Variables + Year and Industry Fixed Effects
+ e (3b)
Dependent Variables
To make the connection between the experience, workload, and audit human
capital and the quality of audits conducted by the engagement office, it is necessary to
discuss several common measures of audit quality that this study examines. The first
measure of audit quality is financial restatements (RESTATE). Restatements of client
financial information have a negative financial reporting quality connotation and can
cause the market to react, leading to auditor litigation (Knechel et al., 2013; Francis,
2004; Stanley & DeZoort, 2007). A restatement of prior period information commonly
occurs due to the correction of a material error and suggests that the auditor failed to
detect and/or report the material error, hence audit quality is low when the audit client

61
restates its financial statements. RESTATE equals 1 if the audit client subsequently
restates its current year financial statements, and 0 otherwise.
The size of the restatement depends not only on the pressure involved but also the
nature of the misstatement. Prior research has shown that restatements affecting core
earnings (operating revenues and operating expenses) tend to be larger than restatements
affecting non-core earnings (non-operating revenues and non-operating expenses) (Hribar
& Jenkins, 2004). Based on the analysis of Francis et al. (2013), the assumption is that
higher quality auditors will have fewer client financial restatements affecting core
earnings. In supplemental analyses, this study measures audit quality by examining
restatements related to core earnings. RESTATE_CE equals 1 if in the restatement is
related to core earnings, and 0 otherwise.
The second measure of audit quality widely used in the literature (Knechel et al.,
2013) is presence of an internal control weakness (ICW). The variable ICW equals 1 if
the client receives an adverse internal control opinion, and 0 otherwise. ICWs exist when
a missing or improperly designed control is so important that its absence could result in a
material financial misstatement. Auditors are required under SOX to report the existence
of ICWs; therefore, audit quality is high when ICWs are detected.
In supplemental analyses and depending on the sample of firms with a financial
restatement, this study utilizes a measure of audit quality that combines the first two
measures. This study employs the presence of a restatement without a preceding internal
control problem identified by the auditor, that is denoted RESTATE_NO_ICW. Since a
financial restatement occurs due to a breakdown in internal controls, a restatement
without a related adverse SOX 404 material weakness opinion has been interpreted to
suggest that the auditor failed to detect or report the material weakness (Rice, Weber, &

62
Biyu, 2015; Rice & Weber, 2012). Hence, RESTATE_NO_ICW equals 1 if there is a
financial restatement without an ICW, and 0 for a restatement that is accompanied by a
related ICW.
The third measure of audit quality relates to the auditor’s opinion. Throughout
the course of fieldwork, auditors are required to determine if the operations of the client
are viable to continue for the foreseeable future (AICPA, 2017). If the auditor determines
that there are going concern issues, then they must modify the audit opinion. Failure to
issue a going concern modified opinion when warranted is considered an audit failure.
The going concern opinion decision is therefore confined to audit clients that are in
distress where distress is defined as negative income and/or negative operating cash
flows. The variable GCM equals 1 if the client receives a going concern modified
opinion, and 0 otherwise.
The final measure of audit quality is audit fees. Prior studies often use audit fees
as a proxy for audit quality justifying that higher audit fees represent additional audit
work (DeAngelo, 1981; Reynolds & Francis, 2000; Choi et al., 2010; Francis & Yu,
2009; Cahan & Sun, 2015). The variable audit fees, AU_FEES, is measured as the
natural logarithm of the audit fees paid by a client to the auditor.
Common Audit Quality Control Variables
The first group of control variables captures client information common to the
RESTATE, ICW, GCM, and AU_FEES (i.e., audit quality) dependent variables, based on
prior studies. The variable SIZE is measured by taking the natural logarithm of total
client assets. Higher values of the variable SIZE should correlate to lower RESTATE,
lower ICW, lower GCM, and higher AU_FEES (Francis et al., 2013; Hossain et al., 2017;

63
Francis & Yu, 2009). The variable LOSS equals 1 if the client has a net loss in the current
period, and 0 otherwise. Higher values of LOSS should correlate to higher RESTATE,
higher ICW, higher GCM, and higher AU_FEES (Francis et al., 2013; Hennes et al.,
2008). INITIAL takes a value of 1 if the client switched to a new auditor within the prior
two years, and 0 otherwise (Rice & Weber, 2012). Higher values of INITIAL should
correlate to higher RESTATE, lower ICW, lower GCM, and lower AU_FEES. MERGER
equals 1 if there was a merger activity during the current period, and 0 otherwise (Stanley
& DeZoort, 2007). Higher values of MERGER should correlate to higher RESTATE,
higher ICW, lower GCM, and higher AU_FEES.
EQUITY_MULTIPLIER is a variable that calculates the ratio of total assets to total equity
(Francis & Yu, 2009). Higher values of EQUITY_MULTIPLIER should correlate to
higher RESTATE, higher ICW, higher GCM, and higher AU_FEES. The variable QUICK
(quick assets divided by current liabilities) is a measure of liquidity (Carey & Simnett,
2006; Reynolds & Francis, 2000). Higher values of QUICK should correlate to lower
RESTATE, lower ICW, lower GCM, and lower AU_FEES. The total number of operating
segments (OPSEG) and the number of geographical segments (GEOSEG) control for
client complexity due to the additional audit effort required. Higher values of GEOSEG
and OPSEG should correlate to higher RESTATE, higher ICW, lower GCM, and higher
AU_FEES. This study will also measure the natural logarithm of metro area population
(LnPOPULATION) because companies located in more populated cities have more
access to individuals with greater accounting expertise (Francis et al., 2005). Higher
values of LnPOPULATION should correlate to lower RESTATE, lower ICW, lower GCM,
and higher AU_FEES. FIRM_TENURE (1 if client tenure with the audit firm is three
years or less, and 0 otherwise) controls for client tenure with the audit firm (Francis &

64
Yu, 2009; Johnson, Khurana, & Reynolds, 2002). Higher values of FIRM_TENURE
should correlate to higher RESTATE, lower ICW, lower GCM, and higher AU_FEES.
Finally, this study includes industry classification codes (INDUSTRY) to control for the
effects of industry type on audit quality. The type of industry could either increase or
decrease audit quality, and thus, no prediction is made to its relationship with audit
quality.
The second group of control variables captures auditor characteristics common to
the measures of audit quality in this study. Auditors that specialize in a particular area are
more likely to provide higher quality audits (and be more expensive than) auditors
without specialization. Prior research shows that audit firms receiving the largest
industry-specific fees at both the national level (NATIONAL_LEADER) and the city level
(CITY_LEADER) provide higher levels of audit quality. Higher values of
NATIONAL_LEADER and CITY_LEADER (each coded as 1 if leader, and 0 otherwise)
should correlate to lower RESTATE, higher ICW, higher GCM, and higher AU_FEES.
NONAUDIT represents the natural logarithm of fees paid to the audit firm for other
services provided. Higher values of NONAUDIT should correlate to higher RESTATE,
higher ICW, higher GCM, and higher AU_FEES. (Rice & Weber, 2012). FEM_AU is a
variable that calculates the proportion of office audit department females to total office
audit department individuals. A small group of studies have investigated non-U.S. Big 4
firms, and found some evidence that clients pay higher fees to auditor offices with larger
proportions of female partners (Hardies et al., 2015; Ittonen et al., 2013). This study
provides the opportunity to examine gender diversity with respect to the existence of a
female audit fee premium in U.S. Big 4 firms. It is unclear to what extent the
composition of males and females in the audit department may impact audit quality

65
because there is no prior evidence. Therefore, this study makes no prediction as to the
direction of the relationship between FEM_AU and audit quality.
Control Variables Specific to Restatements
In addition to the common audit quality control variables previously discussed,
the restatement regression models control for specific client and auditor characteristics
from prior studies that use restatements to proxy for audit quality. Clients with more
accruals have more opportunity to manage earnings and/or misrepresent financial
information (Francis & Yu, 2009; Francis et al., 2013). Higher values of
CHANGE_IN_RECIEVABLES, CHANGE_IN_INVENTORIES, and
CHANGE_IN_CASH_SALES should correlate to higher RESTATE.
Control Variables Specific to Going Concern Opinion Modifications
The internal control weakness regression models control for specific client and
auditor characteristics from prior studies that use going concern opinion modifications to
proxy for audit quality. A number of variables used in prior studies for going concern
testing indicate clients that are financially distressed. REPORTLAG measures the
number of days between the end of the fiscal year and the date that earnings are
announced. Higher REPORTLAG should correlate to higher GCM (Francis & Yu, 2009;
Reynolds & Francis, 2000). Finally, BANKRUPTCY measures the probability that
bankruptcy will not occur, and is calculated using the Altman Z-score (Francis & Yu,
2009; Altman, 1983). Higher BANKRUPTCY should correlate to lower GCM.

66
Control Variables Specific to Audit Fees
The AU_FEES regression models control for specific client and auditor
characteristics from prior studies that use audit fees to proxy for audit quality. FOREIGN
(measured as the percentage of sales from non-U.S. localities), are often more complex,
and therefore require higher audit fees. Higher FOREIGN should correlate to higher
AU_FEES (Hay et al., 2006; Choi et al., 2010). DCFO equals 1 if the client reported
negative operating cash flows, and 0 otherwise. Higher DCFO should correlate to higher
AU_FEES; GROWTH measures the percentage increase in total assets from the prior
period. Higher GROWTH should correlate to higher AU_FEES.

CHAPTER 4
DATA ANALYSIS AND FINDINGS
Descriptive Statistics
Panel A of Table 9 reports descriptive statistics for the measures of audit quality
across the full sample for fiscal years ending during 2011 through 2018. Companies
within the full sample have a mean (median) RESTATE of 0.091 (0.000), ICW of 0.027
(0.000), GCM of 0.022 (0.000), and AU_FEES of 14.374 (14.319), all of which are
comparable with prior studies (for example, Francis et al., 2013; Francis & Yu, 2009;
Hossain et al., 2017). Panel B1 of Table 9 reports descriptive statistics for the test
variables measuring audit human capital for fiscal years ending during 2011 through
2018 and they first show that, as the mean of LG_OFFICE_SEN_LVL is 0.810, a large
proportion of the client sample is audited by Big 4 offices with high concentrations of
senior-level audit human capital; and second, more managers and associates have
postgraduate degrees than partners and principals, more associates are employed from
schools in the same MSA as their home office, and that all other education-related
variables are reasonably consistent at all staffing levels. Panel B2 of Table 9 reports
descriptive statistics for the test variables measuring audit personnel experience for fiscal
years ending during 2011 through 2018 and they show that, as expected, the average

68
61
years of service at the office (DEPT), firm (FIRM), and as a professional (TOTAL) for
more experienced staffing levels such as PART_EXP_DEPT_AVG,
PART_EXP_FIRM_AVG, and PART_EXP_TOT_AVG have much higher mean (median)
values of 13.184 years, 14.550 years, and 15.299 years (13.390 years, 14.898 years, and
15.765 years), respectively, compared to the average years of service at the office
(DEPT), firm (FIRM), and as a professional (TOTAL) for less experienced staffing levels
such as SEN_ASSOC_EXP_DEPT_AVG, SEN_ASSOC_EXP_FIRM_AVG, and
SEN_ASSOC_EXP_TOT_AVG with mean (median) values of 2.352 years, 2.732 years,
and 2.815 years (2.305 years, 2.653 years, and 2.722 years), respectively. Panel B3 of
Table 9 reports descriptive statistics for the test variables measuring audit workload
compression for fiscal years ending during 2011 through 2018 and they show that, as
expected, senior associates and associates (BUSY_FYE1_SEN_ASSOC) have much more
client availability due to their sheer numbers (0.210 clients per audit senior
associate/associate mean and 0.175 client per audit senior associate/associate median),
than partners (BUSY_FYE1_PART), who typically will be much less in number (3.643
clients per partner mean and 0.175 clients per partner median). Descriptive statistics for
control variables for fiscal years ending during 2011 through 2018 are presented in Panel
C of Table 9 and are also comparable with prior studies (for example, Francis et al.,
2013; Francis & Yu, 2009; Hossain et al., 2017).
Multivariate Analysis - Correlations
Table 10 reports the results of Person correlation matrices for the full 2011-2018
client sample. Panel A of Table 10 reports correlations of test variables measuring audit

69
human capital and control variables (Hypotheses 1a, 1b, and 1c), and while there are a
number of significant correlations between the variables measuring education at the
staffing levels, these will be test in separate regressions, thereby eliminating the
multicollinearity threat. The largest VIF (untabulated) is lower than the common
tolerance value of 10 at which the risk of errors due to multicollinearity increases (Hair et
al., 2010). Panel B of Table 11 reports correlations of test variables measuring audit
personnel experience and control variables (Hypotheses 2a and 2b). The audit personnel
experience test variables are naturally highly correlated; however, they are tested in
separate regressions thereby posing no risk of error due to multicollinearity. There are a
number of other significant correlations, but none are large enough to be considered a
multicollinearity threat. The largest VIF (not including test variables) is lower than 10
(untabulated). Panel C of Table 11 reports correlations of test variables measuring audit
workload compression and control variables (Hypotheses 3a and 3b). There are a number
of other significant correlations, but none are large enough to be considered a
multicollinearity threat. The largest VIF is lower than 10 (untabulated). Panel D of Table
11 reports correlations of control variables. There are a number of other significant
correlations, but none are large enough to be considered a multicollinearity threat. The
largest VIF is lower than 10 (untabulated).
TABLE 9
Panel A: Descriptive Statistics for Main Dependent Variables
Full Sample (n = 11,301)
Mean Median Std. Dev. Q1
Q3

70
RESTATE 0.091 0.000 0.288 0.000
0.000
ICW 0.027 0.000 0.163 0.000
0.000
GCM 0.022 0.000 0.146 0.000
0.000
AU_FEES 14.374 14.319 1.029 13.670
15.027
Panel B1: Descriptive Statistics for Test Variables Measuring Audit Human Capital
Full Sample (n = 11,301)
Mean
Median
Std. Dev.
Q1
Q3
AU_DEPT
0.278
0.279
0.105
0.206
0.313
LG_OFFICE_SEN_LVL
0.810
1.000
0.393
1.000
1.000
PG_AU_PART
0.225
0.204
0.169
0.122
0.333
UG_MSA_AU_PART
0.240
0.240
0.192
0.100
0.346
UG_ELITE_AU_PART
0.121
0.063
0.173
0.000
0.182
UG_AACSB_ACC_AU_PART
0.181
0.154
0.185
0.000
0.250
PG_AU_PRIN
0.297
0.311
0.236
0.125
0.385
UG_MSA_AU_PRIN
0.280
0.308
0.212
0.111
0.375
UG_ELITE_AU_PRIN
0.097
0.000
0.172
0.000
0.143
UG_AACSB_ACC_AU_PRIN
0.153
0.100
0.218
0.000
0.222
PG_AU_SMGR_MGR
0.389
0.409
0.183
0.317
0.484
UG_MSA_AU_SMGR_MGR
0.276
0.269
0.172
0.192
0.365
UG_ELITE_AU_SMGR_MGR
0.077
0.043
0.101
0.000
0.107
UG_AACSB_ACC_AU_SMGR_MGR
0.163
0.140
0.143
0.060
0.211
PG_AU_SEN_ASSOC
0.519
0.504
0.121
0.433
0.599
UG_MSA_AU_SEN_ASSOC
0.357
0.346
0.140
0.292
0.407
UG_ELITE_AU_SEN_ASSOC
0.079
0.045
0.089
0.023
0.106
UG_AACSB_ACC_AU_SEN_ASSOC
0.168
0.137
0.121
0.079
0.220
Panel B2: Descriptive Statistics for Test Variables Measuring Audit Personnel Experience
Full Sample (n = 11,301)
Mean Median Std. Dev.
PART_EXP_DEPT_AVG 13.184 13.390 5.100 11.509
14.972
PRIN_EXP_DEPT_AVG 7.594 7.380 4.617 5.004
10.007

71
Descriptive Statistics
Panel B3: Descriptive Statistics for Test Variables Measuring Audit Workload Compression
Full Sample (n = 11,301)
Mean Median Std. Dev. Q1 Q3
BUSY_FYE1
BUSY_FYE1_PART
BUSY_FYE1_PRIN
BUSY_FYE1_SMGR_MGR
BUSY_FYE1_SEN_ASSOC
LG_OFFICE_AUD_HC
SMGR+MGR_EXP_DEPT_AVG 6.028 4.962 6.019 4.535
5.804
SEN_ASSOC_EXP_DEPT_AVG 2.352 2.305 0.280 2.182
2.454
PART_EXP_FIRM_AVG 14.550 14.898 5.062 12.816
16.703
PRIN_EXP_FIRM_AVG 9.487 9.170 5.949 6.226
11.508
SMGR+MGR_EXP_FIRM_AVG 7.012 5.906 6.966 5.204
6.893
SEN_ASSOC_EXP_FIRM_AVG 2.732 2.653 0.448 2.390
3.062
PART_EXP_TOT_AVG 15.299 15.765 5.163 13.244
17.277
PRIN_EXP_TOT_AVG 9.862 9.791 6.002 6.782
11.908
SMGR+MGR_EXP_TOT_AVG 7.208 6.149 6.961 5.382
7.079
SEN_ASSOC_EXP_TOT_AVG 2.815 2.722 0.453 2.479
3.115
PART_TENURE_LONG 0.440 0.000 0.496 0.000
1.000
SM_OFFICE_CLIENTS 0.180 0.000 0.385 0.000
0.000
PART_TENURE_LONG x SM_OFFICE_CLIENTS 0.367 0.000 0.482 0.000
1.000
Q1
Q3

72
Panel C: Descriptive Statistics for Control
Variables
Mean
Median
Std. Dev. Q1 Q3
AUDIT_CLIENTS
0.256
0.181
0.255
0.134
0.294
SIZE
20.979
21.008
1.865
19.685
22.216
LOSS
0.310
0.000
0.463
0.000
1.000
LOSS_NCF
0.328
0.000
0.469
0.000
1.000
EQUITY_MULTIPLIER
2.521
1.979
8.243
1.436
2.865
QUICK
2.398
1.443
3.060
0.966
2.472
OPSEG
1.310
0.000
4.094
0.000
0.000
GEOSEG
6.860
5.000
7.299
2.000
9.000
lnPOPULATION
14.857
14.876
0.836
14.224
15.392
FIRM_TENURE
0.100
0.000
0.305
0.000
0.000
NATIONAL_LEADER
0.390
0.000
0.488
0.000
1.000
CITY_LEADER
0.640
1.000
0.479
0.000
1.000
NONAUDIT
11.117
12.226
4.051
10.597
13.469
FEM_AU
0.468
0.476
0.058
0.435
0.500
INITIAL
0.070
0.000
0.258
0.000
0.000
MERGER
0.370
0.000
0.483
0.000
1.000
CHANGE_IN_RECEIVABLES
-0.070
-0.058
11.501
-0.161
0.005
CHANGE_IN_INVENTORIES
0.015
0.000
1.423
-0.077
0.000
CHANGE_IN_REVENUE
0.567
0.055
22.099
-0.005
0.170
REPORTLAG
63.110
59.000
29.106
53.000
67.000
BANKRUPTCY
3.918
3.052
7.384
1.520
4.966
FOREIGN
0.218
0.002
0.773
0.000
0.373
DCFO
0.160
0.000
0.369
0.000
0.000
GROWTH
0.198
0.043
0.750
-0.023
0.158
46.970
34.000
45.207
13.000
68.000
3.643
2.538
3.728
1.683
4.182
5.990
4.000
6.091
2.375
7.571
0.933
0.663
1.228
0.419
0.910
0.210
0.175
0.136
0.129
0.255
0.823
1.000
0.381
Full Sample (n = 11,301)
1.000
1.000

TABLE 10 - Correlations
Panel A: Correlations of Test Variables Measuring Audit Human Capital and Control Variables
AU_DE
PT
LG_OF
FICE_S
EN_LVL
PG_AU
_PART
UG_MS
A_AU_P
ART
UG_ELI
TE_AU_
PART
UG_AA
CSB_AC
C_AU_
PART
PG_AU
_PRIN
UG_MS
A_AU_P
RIN
UG_ELI
TE_AU_
PRIN
UG_AA
CSB_AC
C_AU_
PRIN
PG_AU
_SMGR
_MGR
UG_MS
A_AU_S
MGR_M
GR
UG_ELI
TE_AU_
SMGR_
MGR
UG_AA
CSB_AC
C_AU_S
MGR_M
GR
PG_AU
_SEN_A
SSOC
UG_MS
A_AU_S
EN_ASS
OC
UG_ELI
TE_AU_
SEN_AS
SOC
UG_AA
CSB_AC
C_AU_S
EN_ASS
OC
AU_DEPT
1.000
LG_OFFICE_SEN_LVL
-.434**
1.000
PG_AU_PART
-.111**
.091**
1.000
UG_MSA_AU_PART
.019*
.102**
-.126**
1.000
UG_ELITE_AU_PART
-.040**
-.097**
.056**
-.004
1.000
UG_AACSB_ACC_AU_PART
-.023*
-.112**
.123**
-.120**
.224**
1.000
PG_AU_PRIN
-.154**
-.075**
.196**
-.117**
.020*
.038**
1.000
UG_MSA_AU_PRIN
.026**
.113**
-.186**
.330**
-.079**
-.211**
.042**
1.000
UG_ELITE_AU_PRIN
-.085**
-.064**
.108**
-.129**
.249**
.088**
.114**
.013
1.000
UG_AACSB_ACC_AU_PRIN
.050**
-.287**
.053**
.007
.301**
.254**
.122**
.010
.292**
1.000
PG_AU_SMGR_MGR
.083**
-.198**
.119**
-.146**
.095**
.000
-.019
.008
.158**
.020*
1.000
UG_MSA_AU_SMGR_MGR
.131**
-.098**
-.125**
.206**
-.114**
-.227**
-.134**
.183**
.028**
-.039**
.351**
1.000
UG_ELITE_AU_SMGR_MGR
-.173**
-.008
.128**
.018
.426**
.066**
-.077**
.061**
.402**
.116**
.144**
.039**
1.000
UG_AACSB_ACC_AU_SMGR_MGR
-.175**
-.231**
.090**
-.175**
.214**
.314**
.073**
.017
.099**
.211**
.309**
.099**
.371**
1.000
PG_AU_SEN_ASSOC
.063**
-.148**
.179**
.090**
.011
.004
.182**
-.010
.119**
.081**
.455**
.163**
.147**
.223**
1.000

UG_MSA_AU_SEN_ASSOC
.185**
-.174**
-.213**
.419**
-.106**
-.250**
-.048**
.166**
-.086**
-.066**
.109**
.621**
.013
-.040**
.264**
1.000
UG_ELITE_AU_SEN_ASSOC
-.200**
.100**
.069**
.197**
.560**
.002
.053**
.200**
.456**
.198**
.006
-.018
.633**
.180**
.085**
-.026**
1.000
UG_AACSB_ACC_AU_SEN_ASSOC
-.108**
-.242**
.147**
-.116**
.249**
.324**
.190**
.007
.124**
.331**
.264**
-.021*
.328**
.701**
.370**
-.005
.284**
1.000
AUDIT_CLIENTS
-.022*
.035**
-.079**
.091**
.015
-.187**
-.118**
.158**
.109**
-.177**
.098**
.114**
.109**
-.095**
-.057**
-.001
.164**
-.140**
SIZE
-.070**
-.023*
.100**
-.129**
.044**
.095**
.086**
-.061**
.078**
.026**
.064**
-.057**
.069**
.086**
.056**
-.088**
.031**
.090**
LOSS
.016
.086**
-.072**
.104**
-.066**
-.058**
-.034**
.060**
-.060**
-.064**
-.114**
-.010
-.056**
-.077**
-.026**
.046**
-.005
-.055**
EQUITY_MULTIPLIER
-.016
-.020*
.006
-.015
.003
-.002
-.008
.000
.009
-.015
-.011
-.004
.004
.010
-.010
-.012
.003
.000
QUICK
.023*
.097**
-.056**
.135**
-.055**
-.074**
-.074**
.045**
-.077**
-.057**
-.110**
.005
-.075**
-.118**
-.039**
.044**
-.027**
-.111**
OPSEG
.010
-.037**
.037**
-.085**
.026**
-.015
.040**
-.024*
.035**
.008
.035**
-.004
.042**
.039**
.025**
-.027**
.022*
-.003
GEOSEG
-.042**
.015
-.007
-.025*
.023*
-.049**
-.008
-.001
.030**
-.025*
-.022*
-.009
.029**
-.018
.000
-.015
.008
-.002
lnPOPULATION
-.277**
.250**
.108**
.023*
.069**
-.084**
.027**
-.029**
.146**
-.081**
.176**
.204**
.142**
.055**
.115**
.034**
.207**
-.046**
FIRM_TENURE
-.031**
.025**
-.003
.038**
-.012
-.003
.019
.015
-.002
-.023*
-.027**
-.009
-.005
-.016
.008
.017
-.006
-.016
NATIONAL_LEADER
.084**
-.019*
.018
.105**
.028**
-.014
-.039**
-.020*
-.065**
.047**
.005
.000
-.040**
-.016
.067**
.028**
.069**
.009
CITY_LEADER
.134**
-.110**
-.057**
-.008
.017
.072**
-.099**
-.001
-.051**
-.035**
.111**
.087**
-.003
.065**
.039**
.053**
-.004
.045**
NONAUDIT
-.081**
.015
.053**
-.098**
.020*
.043**
-.007
-.045**
.030**
-.018
.034**
-.038**
.012
.001
-.050**
-.065**
-.018
-.017
FEM_AU
-.174**
.161**
-.030**
.048**
-.025**
-.202**
-.098**
-.089**
-.080**
-.263**
-.015
-.021*
-.131**
-.168**
.037**
.018
-.009
-.210**
INITIAL
-.030**
.029**
.003
.031**
-.016
-.009
.016
.012
-.016
-.019
-.039**
-.015
-.008
-.013
.002
.015
-.006
-.007
MERGER
-.052**
.012
.018
-.016
.020*
-.025**
.015
-.007
.030**
-.008
.003
-.003
.028**
-.002
-.015
.007
.009
-.006

CHANGE_IN_RECEIVABLES
-.002
.002
-.005
-.007
.008
.004
.010
-.005
.008
.003
-.004
-.001
.003
.007
.007
.003
.007
.009
CHANGE_IN_INVENTORIES
.004
.003
.020*
-.011
-.001
.015
-.010
-.002
-.004
-.001
-.016
-.006
-.009
-.009
-.010
-.011
-.006
-.014
CHANGE_IN_REVENUE
-.005
.004
-.003
.000
.016
.000
.002
.000
.001
-.008
-.004
-.011
.003
.000
.003
-.009
.004
-.008
REPORTLAG
-.009
.018
-.030**
.027**
-.038**
-.032**
-.030**
.002
-.044**
-.038**
-.038**
.007
-.023*
-.036**
-.021*
.017
-.020*
-.031**
BANKRUPTCY
.016
.008
.010
.043**
.004
-.016
-.025*
.010
-.033**
-.018
-.044**
-.002
-.014
-.023*
-.028**
.016
.002
-.027**
FIOREIGN
-.028**
.020*
-.001
-.024*
.000
-.036**
.009
.001
.008
-.006
-.022*
-.015
-.002
-.023*
-.027**
.004
-.002
-.025**
DCFO
.024*
.084**
-.095**
.128**
-.079**
-.075**
-.044**
.071**
-.078**
-.045**
-.114**
-.002
-.084**
-.106**
-.045**
.050**
-.032**
-.087**
GROWTH
.004
.042**
-.015
.047**
-.027**
-.027**
-.024*
.019
-.026**
-.039**
-.045**
-.004
-.028**
-.053**
-.012
.021*
-.011
-.046**
Panel B: Correlations of Test Variables Measuring Audit Personnel Experience and Control Variables
PRIN_
EXP_T
OT_AV
G
SMGR
_MGR
_EXP_
TOT_A
VG
SEN_A
SSOC_
EXP_T
OT_AV
G
PART_
TENU
RE_LO
NG
SM_O
FFICE
_CLIE
NTS
PART_
TENU
RE_LO
NG
xSM_O
FFICE
_CLIE
NTS
PART_
EXP_D
EPT_A
VG
PRIN_
EXP_D
EPT_A
VG
SMGR
_MGR
_EXP_
DEPT_
AVG
SEN_A
SSOC_
EXP_D
EPT_A
VG
PART_
EXP_F
IRM_A
VG
PRIN_
EXP_F
IRM_A
VG
SMGR_
MGR_E
XP_FIR
M_AVG
SEN_A
SSOC_
EXP_F
IRM_A
VG
PART_
EXP_T
OT_AV
G
PART_EXP_DEPT_AVG
1.000
PRIN_EXP_DEPT_AVG
.157**
1.000
SMGR_MGR_EXP_DEPT_AVG
.017
.106**
1.000
SEN_ASSOC_EXP_DEPT_AVG
.108**
.114**
.083**
1.000
PART_EXP_FIRM_AVG
.945**
.160**
-.003
.111**
1.000
PRIN_EXP_FIRM_AVG
.166**
.700**
.137**
.036**
.198**
1.000

SMGR+MGR_EXP_FIRM_AVG
.026**
.109**
.995**
.088**
.009
.153**
1.000
SEN+ASSOC_EXP_FIRM_AVG
.056**
.066**
.015
.622**
.123**
.179**
.035**
1.000
PART_EXP_TOT_AVG
.924**
.122**
-.023*
.064**
.971**
.148**
-.012
.080**
1.000
PRIN_EXP_TOT_AVG
.171**
.708**
.158**
.021*
.199**
.993**
.174**
.169**
.152**
1.000
SMGR_MGR_EXP_TOT_AVG
.025**
.108**
.994**
.086**
.009
.152**
1.000**
.036**
-.011
.174**
1.000
SEN_ASSOC_EXP_TOT_AVG
.062**
.065**
.016
.601**
.129**
.167**
.037**
.991**
.088**
.159**
.040**
1.000
PART_TENURE_LONG
.579**
-.004
-.102**
.028**
.611**
.111**
-.087**
.047**
.656**
.106**
-.086**
.047**
1.000
SM_OFFICE_CLIENTS
PART_TENURE_LONG x
-.172**
-.092**
-.051**
.130**
-.177**
-.138**
-.055**
-.086**
-.187**
-.150**
-.059**
-.128**
-.034**
1.000
SM_OFFICE_CLIENTS
.325**
.072**
-.021*
.051**
.304**
-.004
-.024*
-.082**
.321**
-.002
-.026**
-.103**
.316**
.598**
1.000
AUDIT_CLIENTS
.069**
.034**
-.075**
.082**
.089**
.011
-.068**
.028**
.112**
.008
-.073**
.012
.048**
-.139**
-.103**
SIZE
-.083**
-.047**
-.065**
-.017
-.079**
-.019*
-.057**
.060**
-.082**
-.029**
-.057**
.055**
-.089**
.036**
-.017
LOSS
.037**
.030**
.052**
-.032**
.043**
.019*
.048**
-.016
.047**
.027**
.049**
-.007
.062**
-.078**
-.040**
EQUITY_MULTIPLIER
-.014
-.008
-.001
.028**
-.012
-.001
.000
.021*
-.016
-.003
.000
.017
-.012
.026**
.011
QUICK
.043**
.041**
.053**
-.066**
.052**
.048**
.049**
-.080**
.058**
.058**
.049**
-.071**
.073**
-.089**
-.043**
OPSEG
-.020*
-.053**
-.033**
.002
-.009
-.026**
-.032**
.011
-.022*
-.031**
-.032**
.007
-.058**
.040**
-.016
GEOSEG
.001
.019*
-.003
-.024*
.001
.044**
.002
.004
-.003
.042**
.001
.008
-.002
-.019*
-.032**
lnPOPULATION
.119**
.080**
-.161**
.039**
.116**
-.013
-.147**
.127**
.112**
-.006
-.146**
.151**
.065**
-.166**
-.065**
FIRM_TENURE
.021*
.018
.038**
.002
.024*
.012
.038**
.005
.023*
.014
.038**
.006
.022*
-.021*
-.017
NATIONAL_LEADER
-.023*
.018
-.054**
-.133**
-.014
-.021*
-.061**
-.125**
-.009
-.022*
-.058**
-.117**
.012
-.004
-.003
CITY_LEADER
-.006
-.022*
-.113**
-.024*
-.019*
-.010
-.113**
-.123**
-.018
-.016
-.113**
-.128**
-.011
.090**
.050**
NONAUDIT
-.042**
.007
-.011
-.001
-.030**
.041**
.000
.027**
-.042**
.039**
-.001
.032**
-.061**
.003
-.011
FEM_AU
.090**
.043**
.114**
.178**
.100**
-.062**
.116**
.166**
.125**
-.065**
.114**
.177**
.101**
-.116**
.031**
INITIAL
.016
.004
.042**
-.002
.018
-.003
.041**
.001
.018
-.001
.041**
.005
.020*
-.032**
-.025**
MERGER
-.023*
.002
.018
-.008
-.019*
.014
.021*
.004
-.027**
.014
.021*
.009
-.040**
-.015
-.023*
CHANGE_IN_RECEIVABLES
-.006
.001
.000
.001
-.004
.004
-.001
.017
-.005
.003
-.001
.015
-.012
-.002
-.003
CHANGE_IN_INVENTORIES
-.006
-.006
-.002
.001
.002
-.003
-.003
.011
.001
-.004
-.003
.011
-.002
-.002
-.009
CHANGE_IN_REVENUE
.013
.002
-.003
-.005
.007
.002
-.003
-.009
.010
.005
-.002
-.008
.011
-.008
-.006
REPORTLAG
.014
.005
.035**
.012
.012
-.006
.034**
-.008
.013
-.002
.034**
-.002
.021*
-.025**
-.009
BANKRUPTCY
.029**
.025**
.051**
-.021*
.035**
.048**
.050**
-.034**
.034**
.049**
.050**
-.033**
.023*
-.024*
-.013
FIOREIGN
.007
.004
.024*
.002
.006
.018
.026**
.012
.000
.021*
.025**
.013
.001
-.014
.002
DCFO
.039**
.038**
.051**
-.031**
.042**
.027**
.046**
-.049**
.046**
.037**
.046**
-.040**
.071**
-.076**
-.032**
GROWTH
.020*
.008
.023*
-.024*
.021*
.011
.023*
-.026**
.020*
.014
.023*
-.022*
.027**
-.040**
-.021*
Panel C: Correlations of Test Variables Measuring Audit Workload Compression and Control Variables
BUSY_FYE1_ BUSY_FYE1_ LG_OFFICE
BUSY_FYE1
BUSY_FYE1_PART
BUSY_FYE1_PRIN
SMGR_MGR
SEN_ASSOC
_AUD_HC
BUSY_FYE1
1.000

BUSY_FYE1_PART
.486**
1.000
BUSY_FYE1_PRIN
.208**
.272**
1.000
BUSY_FYE1_SMGR_MGR
-.046**
.062**
.208**
1.000
BUSY_FYE1_SEN_ASSOC
.026**
.337**
.417**
.244**
1.000
LG_OFFICE_AUD_HC
.400**
-.029**
.182**
-.068**
-.177**
1.000
SIZE
-.015
-.009
-.097**
-.039**
-.054**
-.019*
LOSS
.078**
-.027**
.096**
.013
.015
.079**
EQUITY_MULTIPLIER
-.002
.001
-.014
.014
.003
-.014
QUICK
.123**
.033**
.129**
.031**
.032**
.080**
OPSEG
-.013
.029**
-.019*
-.032**
.011
-.028**
GEOSEG
.029**
.014
-.003
.011
.005
.009
lnPOPULATION
.154**
.030**
.013
-.145**
-.020*
.259**
FIRM_TENURE
.003
-.021*
.014
.012
-.003
.012
NATIONAL_LEADER
.017
.016
.097**
-.038**
-.011
-.020*
CITY_LEADER
-.134**
-.015
.034**
-.052**
.050**
-.098**
NONAUDIT
.069**
.039**
-.001
-.006
-.043**
.036**
FEM_AU
.176**
.023*
-.030**
.067**
.049**
.096**
INITIAL
.022*
-.022*
.013
.019*
.003
.018*
MERGER
.011
-.013
-.024*
.033**
-.027**
.020*
CHANGE_IN_RECEIVABLES
.009
.007
-.002
.000
.001
.001
CHANGE_IN_INVENTORIES
.014
.004
.002
-.007
-.005
.003
CHANGE_IN_REVENUE
-.005
.000
-.003
-.009
-.009
.011
REPORTLAG
.057**
.007
.037**
.031**
.018
.020*
BANKRUPTCY
.001
.005
.030**
.029**
-.007
.005
FOREIGN
.023*
.031**
-.003
.015
-.003
.016
DCFO
.099**
-.002
.117**
.018
.029**
.071**
GROWTH
.051**
-.002
.051**
.018
.007
.037**
Panel D: Correlations of Control Variables
AUDIT_
CLIENT
S
SIZE
LOSS
EQUITY
_MULTI
PLIER
QUICK
OPSEG
GEOSE
G
lnPOPU
LATION
FIRM_T
ENURE
NATION
AL_LEA
DER
CITY_L
EADER
NONAU
DIT
FEM_A
U
INITIAL
MERGE
R
CHANG
E_IN_R
CHANG
E_IN_I
NVENT
CHANG
E_IN_R
EVENU
REPOR
TLAG

ECEIVA
BLES
ORIES
E
AUDIT_CLIENTS
1.000
SIZE
LOSS
-.048** .013
1.000
-.410**
1.000
EQUITY_MULTIPLIER
.006
.100**
-.033**
1.000
QUICK
.041**
-.354**
.277**
-.059**
1.000
OPSEG
GEOSEG
.020*
.025**
.218**
.211**
-.096**
-.161**
.034**
.003
-.110**
-.112**
1.000
.102**
1.000
lnPOPULATION
.103**
.030**
-.012
.001
-.015
.047**
.017
1.000
FIRM_TENURE
.028**
-.139**
.143**
-.007
.098**
-.047**
-.092**
.007
1.000
NATIONAL_LEADER
CITY_LEADER
-.058** -.012
-.063**
.097**
.070**
-.058**
.004
.019*
.065**
-.066**
-.014
.081**
-.067**
-.039**
.047**
-.051**
.006
-.041**
1.000
.228**
1.000
NONAUDIT
.006
.479**
-.210**
.059**
-.207**
.137**
.214**
.048**
-.097**
-.054**
.058**
1.000
FEM_AU
.198**
-.020*
.054**
.001
.045**
-.020*
.001
.061**
.011
-.022*
-.085**
-.020*
1.000
INITIAL
MERGER
.024* .004
-.174**
.199**
.162**
-.120**
-.024**
.031**
.105**
-.126**
-.048**
.021*
-.085**
.111**
-.004
.033**
.490** -
.012
.013
-.044**
-.035** -
.014
-.132**
.179**
.014
-.009
1.000
-.040**
1.000
CHANGE_IN_RECEIVABLES
-.004
.004
-.002
-.006
.003
.003
.000
.004
-.001
.009
.012
.006
.001
.005
.013
1.000
CHANGE_IN_INVENTORIES
-.008
.005
.004
.009
-.004
.000
-.008
-.002
.014
-.001
-.020*
.009
.001
-.007
.004
-.003
1.000
CHANGE_IN_REVENUE
-.006
-.028**
.010
-.001
.016
-.007
-.020*
-.004
.009
.001
-.002
-.006
-.001
.014
.015
-.001
-.001
1.000
REPORTLAG
.031**
-.358**
.216**
-.040**
.066**
-.060**
-.099**
-.005
.141**
.032**
-.029**
-.200**
.021*
.308**
-.077**
.006
.002
.022*
1.000
BANKRUPTCY
.009
.008
-.142**
-.018
.469**
-.029**
.005
-.035**
.023*
-.012
-.019*
-.025**
-.017
.008
-.016
-.011
-.005
-.006
-.153**
FIOREIGN
-.003
.128**
-.133**
.004
-.035**
.049**
.192**
.012
-.024*
-.032**
-.026**
.117**
-.009
-.026**
.079**
-.001
-.007
.000
-.052**
DCFO
.034**
-.465**
.555**
-.047**
.405**
-.108**
-.176**
-.023*
.132**
.097**
-.050**
-.232**
.038**
.130**
-.178**
.014
-.008
.028**
.207**
GROWTH
.012
-.140**
.137**
-.015
.325**
-.052**
-.097**
-.012
.171**
.034**
-.021*
-.107**
.008
.272**
.031**
-.009
-.001
.052**
.116**

Panel D: Correlations of Control Variables (continued)
BANKRUPTCY FIOREIGN DCFO GROWTH
BANKRUPTCY 1.000
FIOREIGN .006 1.000
DCFO -.057** -.098** 1.000
GROWTH .198** -.024** .176** 1.000
*, **, *** denote significance at 0.10, 0.05, and 0.01 levels, respectively. See Table 8 for variable definitions.

70
Logistic and OLS Regressions – Audit Human Capital (H1a, H1b, H1c)
Audit Human Capital at the Audit Office Department and Audit Quality (H1a)
Tables 11 through 19 present the regression results of the relationships between
the test variables and audit quality. Each table includes control variables based on 2011-
2018 client data, as well as control variables based on 2017-2018 client data for purposes
of sensitivity analysis, since the personnel data was extracted from November 2017 to
January 2018. Table 11 provides the regression results of the relationship between audit
human capital and audit quality for Hypothesis 1a. Panel A of Table 11 presents the
results from the logistic regression of RESTATE on the test and control variables. The
coefficients for year and industry fixed effects are not reported for brevity in this table
and all regression tables. The results do not indicate a significant association between
RESTATE and AU_DEPT (p = 0.312). This result suggests that, alternative to H1a, audit
quality measured by client restatements is not impacted by Big 4 offices with greater
proportions of audit human capital. However, the variable capturing the number of total
audit clients at each office as a proportion of total auditors at each office,
(AUDIT_CLIENTS), has a significant negative association with RESTATE (p = 0.020).
This result suggests that, in general, offices with more clients per auditor have fewer
restatements, possibly due to increased exposure from client-related risks, or because

these offices are better able to scale audit resources, such as audit workpaper templates,
planning documents, and internal control narratives for audit clients that operate in
similar industries. The results also show expected significant positive relationships
between RESTATE and ICW, AU_FEES, EQUITY_MULTIPLIER, and FIRM_TENURE,
71
and significant negative relationships with SIZE, NATIONAL_LEADER and QUICK.
Because the personnel data sample also contains gender information, an opportunity is
provided to ascertain the impact of gender on audit quality. Interestingly, the results
indicate a significant negative association between RESTATE and FEM_AU (p = 0.009),
suggesting that audit departments with greater amounts of female auditors have fewer
client restatements, and therefore higher audit quality. When evaluating the results using
only 2017-2018 control variable years, the test variable is not significant, and none of the
control variable results are unexpected.
Panel B of Table 11 presents the results from the logistic regression of ICW on the
test and control variables for Hypothesis 1a. The coefficients for year and industry fixed
effects are not reported. The results indicate a significant positive relationship between
ICW and AU_DEPT (p = 0.088), suggesting that the quantity of audit human capital
available to the office positively impacts audit quality measured by the detection of
material weaknesses. The significant positive relationship between ICW and AU_FEES

is expected because, consistent with the literature, as auditors uncover material
weaknesses, they expand testing and incur additional fees. In addition, the significant
positive relationships between ICW and MERGER and LOSS are expected because,
consistent with the literature, complexities and losses may result in risks that are not
adequately addressed by internal control activities.
TABLE 11 - Regression of Audit Quality on Audit Human Capital at the Audit Office Department (H1a)
Panel A: Using RESTATE as the Dependent Variable Control Variable Years: 2011-2018 Control Variable Years: 2017-2018
Variable Wald
Intercept
?
-2.219
3.370
0.066*
-22.338
0.000
0.999
AU_DEPT
-
-0.179
0.242
0.312
-0.570
0.240
0.312
AUDIT_CLIENTS
-
-0.327
4.224
0.020**
-0.131
0.097
0.378
ICW
+
1.409
107.612
0.000***
2.144
30.776
0.000***
AU_FEES
+
0.329
23.215
0.000***
0.276
1.637
0.101
SIZE
-
-0.166
17.101
0.000***
-0.202
2.537
0.056*
LOSS
+
0.004
0.002
0.484
0.486
3.129
0.077*
EQUITY_MULTIPLIER
+
0.007
3.829
0.025**
0.004
0.122
0.364
QUICK
-
-0.023
2.167
0.071*
-0.049
0.754
0.193
OPSEG
+
0.006
0.454
0.250
0.029
0.232
0.315
GEOSEG
+
0.001
0.049
0.412
0.007
0.029
0.433
LnPOPULATION
-
0.000
0.000
0.497
0.157
1.491
0.222
FIRM_TENURE
+
0.234
3.784
0.026**
0.133
0.128
0.360
NATIONAL_LEADER
-
-0.148
4.138
0.021**
-0.094
0.182
0.335
Expected Sign
Estimate
Wald
p
-
value
Estimate
p
-
value
CITY_LEADER
-
0.014
0.035
0.851
0.200
0.752
0.386
NONAUDIT
+
0.009
0.722
0.198
0.031
0.856
0.178
FEM_AU
?
-1.617
6.859
0.009***
-2.211
1.307
0.253
INITIAL
+
-0.007
0.002
0.962
0.712
2.132
0.072*
MERGER
+
-0.012
0.029
0.866
0.090
0.171
0.340
CHANGE_IN_RECEIVABLES
+
-0.001
0.122
0.727
-0.019
0.017
0.898
CHANGE_IN_INVENTORIES
+
-0.004
0.025
0.874
-0.005
0.010
0.919
CHANGE_IN_CASH_SALES
+
-0.002
1.019
0.313
-0.071
1.757
0.185
Year and Industry fixed effects
Yes
Yes
Number of Restatements
1,025
122
Total Number of Observations
11,301
1,524
Model p-value
0.000***
0.000***
Pseudo R2
5.6%
19.0%
Regression of Audit Quality on Audit Human Capital at the Audit Office Department (H1a)
Panel B: Using ICW as the Dependent Variable Control Variable Years: 2011-2018 Control Variable Years: 2017-2018
Expected Sign
Estimate
Wald
p
-
value
Estimate
p
-
value

Variable Wald
Intercept ? -26.612 0.000 0.998 -21.295 0.000 0.999
AU_DEPT + 0.802 1.838 0.088* 0.596 0.132 0.359
AUDIT_CLIENTS + 0.145 0.519 0.236 -0.945 1.032 0.310
AU_FEES + 1.445 142.247 0.000*** 1.241 11.259 0.000***
SIZE - -0.797 124.839 0.000*** -0.791 13.561 0.000***
LOSS + 0.193 1.829 0.088* 0.079 0.043 0.418
EQUITY_MULTIPLIER + 0.006 0.916 0.170 -0.012 0.557 0.455
QUICK - -0.046 1.859 0.087* -0.214 1.997 0.079*
OPSEG + -0.010 0.372 0.542 0.002 0.000 0.493
GEOSEG + 0.001 0.007 0.468 -0.029 0.163 0.687
LnPOPULATION - 0.066 0.822 0.364 -0.137 0.462 0.249
FIRM_TENURE - 0.245 1.481 0.224 0.612 1.399 0.237
NATIONAL_LEADER + -0.110 0.708 0.400 0.099 0.082 0.388
CITY_LEADER + -0.148 1.163 0.281 0.179 0.242 0.312
NONAUDIT + 0.004 0.042 0.419 -0.005 0.011 0.917
FEM_AU ? 1.562 2.219 0.136 3.191 1.016 0.313
INITIAL - -0.331 1.698 0.193 0.128 0.035 0.851
MERGER + 0.265 4.316 0.019** 0.516 2.250 0.067*
Year and Industry fixed effects Yes Yes
Number of Control Weaknesses 308 45
Total Number of Observations 11,301 1,565
Model p-value 0.000*** 0.113
Pseudo R2 13.3% 23.2%
Regression of Audit Quality on Audit Human Capital at the Audit Office Department (H1a)
Panel C: Using GCM as the Dependent Variable Control Variable Years: 2011-2018 Control Variable Years: 2017-2018
Variable Wald p-value Wald
Intercept
?
10.374
13.536
0.000***
10.426
0.000
1.000
AU_DEPT
+
-0.921
0.914
0.339
-4.398
1.256
0.262
AUDIT_CLIENTS
-
-0.223
0.358
0.275
1.141
0.932
0.334
ICW
+
0.140
0.093
0.380
-15.539
0.000
0.998
AU_FEES
+
0.168
1.518
0.109
0.103
0.025
0.437
SIZE
-
-0.458
24.098
0.000***
-0.779
2.950
0.043**
LOSS
+
0.367
0.495
0.241
17.875
0.000
0.499
EQUITY_MULTIPLIER
+
-0.003
0.130
0.718
-0.026
0.166
0.683
QUICK
-
-0.162
18.381
0.000***
-0.096
0.918
0.169
OPSEG
-
0.012
0.095
0.758
-0.184
0.300
0.292
Expected Sign
Estimate
Estimate
p
-
value

GEOSEG
-
-0.051
5.320
0.021**
0.191
2.161
0.142
LnPOPULATION
-
-0.179
2.507
0.057*
-0.885
4.379
0.018**
FIRM_TENURE
-
0.332
2.059
0.151
0.668
0.679
0.410
NATIONAL_LEADER
+
-0.292
2.371
0.124
-1.070
2.509
0.113
CITY_LEADER
+
0.162
0.730
0.197
0.592
0.744
0.195
NONAUDIT
+
0.001
0.004
0.474
-0.064
1.309
0.253
FEM_AU
?
2.155
2.087
0.149
-5.955
1.228
0.268
INITIAL
-
-0.239
0.858
0.177
-0.843
0.585
0.444
MERGER
-
-0.451
2.907
0.044**
-0.222
0.060
0.806
REPORTLAG
+
0.002
1.366
0.122
0.054
4.003
0.023**
BANKRUPTCY
-
-0.069
34.707
0.000***
-0.076
3.243
0.036**
Year and Industry fixed effects
Yes
Yes
Number of Going Concern Modifications
235
19
Total Number of Observations
3,705
481
Model p-value
0.000***
0.000***
Pseudo R2
40.0%
58.8%

Regression of Audit Quality on Audit Human Capital at the Audit Office Department (H1a)
Panel D: Using AU_FEES as the Dependent Variable
Control Variable Years: 2011-2018
Control Variable Years: 2017-2018
Variable
t-value
p-value
t-value
p-value
Intercept
?
3.981
31.183
0.000***
4.513
13.816
0.000***
AU_DEPT
+
-0.403
-8.216
0.000***
-0.435
-3.481
0.001***
AUDIT_CLIENTS
+
-0.165
-8.630
0.000***
-0.150
-3.222
0.001***
ICW
+
0.343
11.836
0.000***
0.241
3.338
0.000***
RESTATE
+
0.084
5.100
0.000***
0.071
1.574
0.058*
GCM
+
0.117
3.486
0.000***
0.233
2.721
0.004***
SIZE
+
0.462
128.382
0.000***
0.447
47.609
0.000***
LOSS
+
0.168
13.023
0.000***
0.130
4.006
0.000***
EQUITY_MULTIPLIER
+
0.000
0.848
0.199
0.001
0.976
0.165
QUICK
-
-0.025
-13.278
0.000***
-0.025
-4.575
0.000***
OPSEG
+
0.012
9.421
0.000***
0.032
4.330
0.000***
GEOSEG
+
0.008
10.987
0.000***
0.027
5.458
0.000***
lnPOPULATION
+
0.025
4.141
0.000***
0.022
1.426
0.077*
FIRM_TENURE
+
0.057
3.263
0.000***
-0.026
-0.603
0.546
NATIONAL_LEADER
+
-0.011
-1.101
0.271
0.009
0.357
0.361
CITY_LEADER
+
0.034
3.207
0.000***
0.039
1.457
0.073*
NONAUDIT
+
0.017
12.494
0.000***
0.016
4.837
0.000***
FEM_AU
?
0.517
6.058
0.000***
0.307
1.410
0.159
INITIAL
-
0.100
4.684
0.000***
0.078
1.223
0.222
FOREIGN
+
0.050
7.967
0.000***
0.018
1.384
0.084*
MERGER
+
0.053
5.086
0.000***
0.059
2.276
0.012**
DCFO
+
0.115
6.634
0.000***
0.125
2.714
0.004***
GROWTH
+
0.014
1.974
0.024**
0.019
0.879
0.190
Year and Industry fixed effects
Yes
Yes
Total Number of Observations
11,301
1,083
Model p-value
0.000***
0.000***
R2
77.1%
78.8%
Expected Sign
Estimate
Estimate

90
The significant negative relationships between ICW and SIZE and QUICK are also
expected because, consistent with the literature, larger and/or liquid clients have greater
flexibility to develop and maintain high quality systems of internal controls. When
evaluating the results using only 2017-2018 control variable years, the model becomes
insignificant, possibly due to the small incidence of ICWs.
Panel C of Table 11 presents the results from the logistic regression of GCM on
the test and control variables for Hypothesis 1a. The results do not indicate a significant
relationship between GCM and AU_DEPT (p = 0.339), suggesting that the quantity of
audit human capital available to the office may not impact audit quality measured by
going concern modifications of client financial statements. The highly significant
negative relationship between GCM and BANKRUPTCY is expected, as BANKRUPTCY
measures the Altman-Z Score, where higher numbers indicate greater financial health and
lower likelihood of going concern issues. The significant negative relationships between
GCM and SIZE, QUICK, GEOSEG, LnPOPULATION, and MERGER are also expected
because, consistent with the literature, larger clients, more liquid clients, and clients with
greater market spreads, and engaging in a merger are less likely to exhibit indicators of
failure. When evaluating the results using only 2017-2018 control variable years, the test
variable is not significant, and none of the control variable results are unexpected.
Panel D of Table 11 presents the results from the OLS regression of AU_FEES on
the test and control variables for Hypothesis 1a. The results indicate a significant
negative relationship between AU_FEES and AU_DEPT (p < 0.01), opposite of the

91
positive relationship that was hypothesized in H1a. This finding might indicate that
offices with more available human capital are more productive and efficient. This
finding is strengthened by the significant negative relationship between AU_FEES and
AUDIT_CLIENTS (p < 0.01), which is also opposite of expectation, yet indicates that
offices with more clients per auditor are able to generate “economies of scale” through
resource sharing to control fees. As expected, based on prior literature, the findings
indicate significant positive relationships between AU_FEES and ICW, RESTATE, SIZE,
LOSS, OP_SEG, GEO_SEG, LnPOPULATION, FIRM_TENURE, CITY_LEADER (when
controlling for NATIONAL_LEADER), NONAUDIT, FOREIGN, MERGER, DCFO, and
GROWTH, and a significant negative relationship between AU_FEES and QUICK. In
addition, the results indicate the presence of a significant female audit fee premium as
there is a positive relationship between AU_FEES and FEM_AU (p < 0.01), perhaps
suggesting that offices with greater proportions of female auditors command a fee
premium due to greater audit quality. The results unexpectedly note a significant positive
relationship between AU_FEES and INITIAL, as a “low-ball” effect commonly occurs in
the first year of an audit. However, as INITIAL measures whether a client switched
auditors in the prior two years, it might be that the new auditor is “catching up” on fees in
the years immediately subsequent to the switch. When evaluating the results using only
2017-2018 control variable years, the findings also indicate a significant negative
relationship between AU_FEES and AU_DEPT (p < 0.01), while none of the control
variable results are unexpected.

92
Results Summary for Audit Human Capital at the Audit Office Department and Audit
Quality (H1a)
The test results for H1a overall are mixed, which makes it difficult to draw any
solid conclusions on the effect of human capital on audit quality. The results first make
no indication that audit offices with greater amounts of human capital have fewer
subsequent client financial restatements or greater going concern opinion modifications,
which do not align with H1a. In addition, the results show a negative relationship
between audit department human capital and audit fees, which also does not align with
H1a, yet do show a significant relationship between the amount of audit department
human capital and the reporting of material internal control weaknesses which does align
with H1a. These results could indicate that offices with the greatest amount of available
audit human capital (or biggest audit offices) possess more high quality auditors willing
to report material internal control weaknesses, and are able to manage audit fees more
effectively than offices with lesser amounts of available audit human capital (smaller
audit offices). When evaluating the test results for H1a using only control variables from
2017-2018, the extraction dates for the personnel sample, the test variable results align
with the full sample results (2011-2018), and none of the control variable results are
unexpected.
Supplemental Analysis for Audit Human Capital at the Audit Office Department and

93
Audit Quality (H1a)
In supplemental analysis of H1a testing on the full sample, the dependent variable
RESTATE is modified in three ways. First, RESTATE is replaced with
RESTATE_NO_ICW, to test for restatements in which the auditor failed to report a
material internal control weakness. The model for this test (untabulated) is not
significant (p = 0.603), likely because there are so few instances of restatements
unaccompanied by a material internal control weakness (n = 41). Second, RESTATE is
replaced by RESTATE_CE, to test for restatements only affecting core earnings. The
model for this test (untabulated) is significant (p = 0.012), with a pseudo R-square of
0.132; however, similar to the main model in Panel A of Table 11, the test variable
AU_DEPT remains insignificant (p = 0.143). Finally, RESTATE is replaced by
SEC_REG_FAR, to test for restatements that occurred at an auditor office in the same city
as one of the eleven SEC regional offices. The model for this test (untabulated) is
significant (p < 0.01), with a pseudo R-square of 0.088, and produces a significant
negative relationship between the test variable (AU_DEPT: p < 0.01) and the dependent
variable (SEC_REG_FAR), indicating that audit departments with more available human
capital might be less likely to issue restated financial statements when they are located at
offices in the same city as one of the eleven SEC regional offices, possibly due to the
perceived exposure to regulatory oversight experienced by the auditor and/or client.
Senior-Level Audit Human Capital at the Audit Office Department and Audit Quality
(H1b)

94
Table 12 provides the regression results of the relationship between audit human
capital and audit quality for Hypothesis 1b. Panel A of Table 12 presents the results from
the logistic regression of RESTATE on the test and control variables. The coefficients for
industry and year fixed effects for all regressions are not tabulated to conserve space.
The results indicate a significant negative association between RESTATE and AU_DEPT
(p = 0.087), a significant negative relationship between RESTATE and
LG_OFFICE_SEN_LVL (p = 0.006). These results appear to align with H1b in that
offices with more senior-level audit human capital, rather than just more overall audit
human capital, seem to have fewer future restatements. The results also indicate
significant positive relationships between RESTATE and ICW, AU_FEES,
EQUITY_MULTIPLIER, and FIRM_TENURE, and significant negative relationships
between RESTATE and AUDIT_CLIENTS, NATIONAL_LEADER, QUICK, and SIZE, all
of which are expected based on the prior literature. Finally, the results indicate a
significant negative association between RESTATE and FEM_AU (p = 0.016), suggesting
that audit departments with greater amounts of female auditors have fewer future client
financial restatements, adding to the results from Panel A of Table 11. When evaluating
the results using only 2017-2018 control variable years, the findings indicate a significant
negative relationship between RESTATE and LG_OFFICE_SEN_LVL (p = 0.083), while
none of the control variable results are unexpected.
Panel B of Table 12 presents the results from the logistic regression of ICW on the
test and control variables for Hypothesis 1b. The results do not indicate a significant
relationship between ICW and the test variables. The significant positive relationships

95
between ICW and AU_FEES, LOSS, and MERGER are expected. The significant
negative relationships between ICW and SIZE, QUICK, and INITIAL are also expected.
When evaluating the results using only 2017-2018 control variable years, the model
becomes insignificant and is not tabulated.
TABLE 12 - Regression of Audit Quality on Senior-Level Audit Human Capital at the Audit Office Department (H1b)
Panel A: Using RESTATE as the Dependent Variable Control Variable Years: 2011-2018 Control Variable Years: 2017-2018
Variable Wald
Intercept
?
-2.248
3.464
0.063*
-22.539
0.000
0.999
AU_DEPT
-
-0.527
1.855
0.087*
-1.178
0.918
0.169
LG_OFFICE_SEN_LVL
-
-0.242
6.335
0.006***
-0.416
1.918
0.083*
AUDIT_CLIENTS
-
-0.329
4.299
0.019**
-0.138
0.110
0.370
ICW
+
1.403
106.406
0.000***
2.152
30.874
0.000***
AU_FEES
+
0.341
24.735
0.000***
0.289
1.797
0.090*
SIZE
-
-0.171
18.104
0.000***
-0.205
2.581
0.054*
LOSS
+
0.010
0.014
0.453
0.462
2.815
0.093*
EQUITY_MULTIPLIER
+
0.007
3.638
0.028*
0.004
0.131
0.359
QUICK
-
-0.021
1.753
0.093*
-0.046
0.675
0.206
OPSEG
+
0.005
0.392
0.266
0.028
0.217
0.321
GEOSEG
+
0.001
0.037
0.424
0.008
0.033
0.428
LnPOPULATION
-
0.017
0.167
0.683
0.188
2.091
0.148
FIRM_TENURE
+
0.230
3.635
0.029**
0.126
0.114
0.368
NATIONAL_LEADER
-
-0.147
4.079
0.022**
-0.095
0.186
0.333
Expected Sign
Estimate
Wald
p
-
value
Estimate
p
-
value
CITY_LEADER
-
0.010
0.018
0.893
0.214
0.863
0.353
NONAUDIT
+
0.009
0.720
0.198
0.029
0.763
0.191
FEM_AU
?
-1.475
5.849
0.016**
-1.839
0.937
0.333
INITIAL
+
-0.010
0.005
0.945
0.690
1.983
0.080*
MERGER
+
-0.014
0.038
0.845
0.077
0.123
0.363
CHANGE_IN_RECEIVABLES
+
-0.001
0.129
0.719
-0.017
0.013
0.909
CHANGE_IN_INVENTORIES
+
-0.004
0.022
0.881
-0.005
0.008
0.930
CHANGE_IN_CASH_SALES
+
-0.002
1.064
0.302
-0.071
1.739
0.187
Year and Industry fixed effects
Yes
Yes
Number of Restatements
1,025
122
Total Number of Observations
11,301
1,524
Model p-value
0.000***
0.000***
Pseudo R2
5.7%
19.2%
Regression of Audit Quality on Senior-Level Audit Human Capital at the Audit Office Department (H1b)
Panel B: Using ICW as the Dependent Variable Control Variable Years: 2011-2018 Control Variable Years: 2017-2018
Variable Wald
Expected Sign
Estimate
Wald
p
-
value
Estimate
p
-
value

Intercept ? -26.593 0.000 0.998 -21.298 0.000 0.999
AU_DEPT + 0.543 0.747 0.194 0.541 0.095 0.379
LG_OFFICE_SEN_LVL + -0.211 1.459 0.227 -0.041 0.008 0.931
AUDIT_CLIENTS + 0.158 0.613 0.217 -0.944 1.031 0.310
AU_FEES + 1.455 143.407 0.000*** 1.243 11.251
0.000***
SIZE - -0.802 125.676 0.000*** -0.792 13.550
0.000***
LOSS + 0.196 1.899 0.084* 0.081 0.045 0.416
EQUITY_MULTIPLIER + 0.006 0.894 0.172 -0.012 0.552 0.457
QUICK - -0.043 1.668 0.099* -0.213 1.990 0.079*
OPSEG + -0.011 0.428 0.513 0.002 0.000 0.493
GEOSEG + 0.001 0.005 0.471 -0.029 0.163 0.686
LnPOPULATION - 0.078 1.129 0.288 -0.134 0.427 0.257
FIRM_TENURE - 0.242 1.439 0.230 0.616 1.406 0.236
NATIONAL_LEADER + -0.109 0.699 0.403 0.099 0.082 0.387
CITY_LEADER + -0.154 1.251 0.263 0.18 0.243 0.311
NONAUDIT + 0.004 0.047 0.414 -0.005 0.011 0.918
FEM_AU ? 1.635 2.483 0.115 3.188 1.022 0.312
INITIAL - -0.334 1.732 0.094* 0.123 0.032 0.857
MERGER + 0.264 4.257 0.020** 0.515 2.238 0.068*
Year and Industry fixed effects Yes Yes
Number of Control Weaknesses 308 45
Total Number of Observations 11,301 1,565
Model p-value 0.000*** 0.129
Pseudo R2 13.3% 23.2%
Regression of Audit Quality on Senior-Level Audit Human Capital at the Audit Office Department (H1b)
Panel C: Using GCM as the Dependent Variable Control Variable Years: 2011-2018 Control Variable Years: 2017-2018
Variable Wald p-value Wald
Intercept
?
10.620
14.170
0.000***
7.504
0.000
1.000
AU_DEPT
+
-1.516
2.160
0.142
-5.797
1.892
0.169
LG_OFFICE_SEN_LVL
+
-0.452
2.885
0.089*
-0.976
0.872
0.350
AUDIT_CLIENTS
-
-0.187
0.252
0.308
0.970
0.673
0.412
ICW
+
0.145
0.100
0.376
-15.361
0.000
0.998
AU_FEES
+
0.172
1.623
0.102
0.117
0.033
0.214
SIZE
-
-0.464
24.894
0.000***
-0.780
2.956
0.022**
LOSS
+
0.397
0.574
0.225
18.054
0.000
0.250
EQUITY_MULTIPLIER
+
-0.003
0.120
0.729
-0.025
0.153
0.696
QUICK
-
-0.160
18.018
0.000***
-0.108
1.126
0.073*
OPSEG
-
0.006
0.024
0.878
-0.224
0.428
0.129
Expected Sign
Estimate
Estimate
p
-
value

GEOSEG
-
-0.048
4.733
0.015**
0.196
2.254
0.133
LnPOPULATION
-
-0.162
2.051
0.076*
-0.707
2.378
0.031**
FIRM_TENURE
-
0.318
1.873
0.171
0.701
0.727
0.394
NATIONAL_LEADER
+
-0.271
2.033
0.154
-0.984
2.126
0.145
CITY_LEADER
+
0.171
0.815
0.184
0.650
0.905
0.086*
NONAUDIT
+
0.002
0.010
0.460
-0.073
1.604
0.205
FEM_AU
?
2.455
2.693
0.101
-3.916
0.473
0.492
INITIAL
-
-0.236
0.835
0.181
-0.896
0.648
0.106
MERGER
-
-0.468
3.120
0.039**
-0.212
0.056
0.204
REPORTLAG
+
0.002
1.385
0.120
0.057
4.337
0.010***
BANKRUPTCY
-
-0.070
35.975
0.000***
-0.076
3.131
0.020**
Year and Industry fixed effects
Yes
Yes
Number of Going Concern Modifications
235
19
Total Number of Observations
3,705
481
Model p-value
0.000***
0.000***
Pseudo R2
40.2%
59.1%

Regression of Audit Quality on Senior-Level Audit Human Capital at the Audit Office Department (H1b)
Panel D: Using AU_FEES as the Dependent Variable
Control Variable Years: 2011-2018
Control Variable Years: 2017-2018
Variable
t-value
p-value
t-value
p-value
Intercept
?
3.991
31.320
0.000***
4.546
13.920
0.000***
AU_DEPT
+
-0.277
-5.261
0.000***
-0.322
-2.383
0.017**
LG_OFFICE_SEN_LVL
+
0.090
6.496
0.000***
0.077
2.184
0.015**
AUDIT_CLIENTS
+
-0.163
-8.527
0.000***
-0.145
-3.129
0.002***
ICW
+
0.344
11.875
0.000***
0.240
3.323
0.000***
RESTATE
+
0.086
5.243
0.000***
0.074
1.639
0.051*
GCM
+
0.116
3.441
0.000***
0.235
2.741
0.003***
SIZE
+
0.461
128.514
0.000***
0.446
47.565
0.000***
LOSS
+
0.165
12.803
0.000***
0.125
3.834
0.000***
EQUITY_MULTIPLIER
+
0.001
0.949
0.171
0.001
0.974
0.165
QUICK
-
-0.026
-13.590
0.000***
-0.025
-4.646
0.000***
OPSEG
+
0.012
9.467
0.000***
0.032
4.341
0.000***
GEOSEG
+
0.008
11.120
0.000***
0.027
5.466
0.000***
lnPOPULATION
+
0.019
3.096
0.001***
0.015
0.987
0.162
FIRM_TENURE
+
0.058
3.323
0.000***
-0.029
-0.664
0.507
NATIONAL_LEADER
+
-0.011
-1.144
0.252
0.008
0.338
0.368
CITY_LEADER
+
0.035
3.318
0.000***
0.037
1.374
0.085*
NONAUDIT
+
0.017
12.458
0.000***
0.017
4.934
0.000***
FEM_AU
?
0.468
5.473
0.000***
0.260
1.189
0.235
INITIAL
-
0.100
4.707
0.000***
0.083
1.314
0.190
FOREIGN
+
0.049
7.899
0.000***
0.017
1.282
0.100*
MERGER
+
0.054
5.157
0.000***
0.062
2.376
0.009***
DCFO
+
0.113
6.529
0.000***
0.125
2.726
0.003***
GROWTH
+
0.013
1.930
0.027**
0.020
0.934
0.176
Year and Industry fixed effects
Yes
Yes
Total Number of Observations
11,301
1,565
Model p-value
0.000***
0.000***
R2
77.2%
78.9%
Expected Sign
Estimate
Estimate

102

104
Panel C of Table 12 presents the results from the logistic regression of GCM on
the test and control variables for Hypothesis 1b. The results show a significant negative
relationship between GCM and LG_OFFICE_SEN_LVL (p = 0.012), unexpectedly
indicating that offices with more senior-level auditors are less likely to report going
concern opinion modifications. The significant negative relationship between GCM and
BANKRUPTCY is expected. The significant negative relationships between GCM and
SIZE, QUICK, GEOSEG, and MERGER are also expected. When evaluating the results
using only 2017-2018 control variable years, the test variables are not significant, and
none of the control variable results are unexpected.
Panel D of Table 12 presents the results from the OLS regression of AU_FEES on
the test and control variables for Hypothesis 1b. The results indicate a significant
negative relationship between AU_FEES and AU_DEPT (p < 0.01) and a significant
positive relationship between AU_FEES and LG_OFFICE_SEN_LVL (p < 0.01). These
results can potentially be explained in two ways. First, this result might indicate that
offices with more available human capital are more efficient, a finding strengthened by
the significant negative relationship between AU_FEES and AUDIT_CLIENTS (p <
0.01), where offices with more audit clients per auditor are able to create efficiencies
among similar clients to scale fees. Second, the results might indicate that offices with a
larger proportion of senior-level auditors, rather than just more overall auditors, bill
greater amounts due to their expertise. The findings indicate significant positive
relationships between AU_FEES and ICW, RESTATE, SIZE, LOSS, OP_SEG,
GEO_SEG, LnPOPULATION, FIRM_TENURE, CITY_LEADER (when controlling for

105
NATIONAL_LEADER), NONAUDIT, INITIAL, FOREIGN, MERGER, REPORTLAG,
DCFO, and GROWTH, and a significant negative relationship between AU_FEES and
QUICK. In addition, the results continue to indicate the presence of a significant female
audit fee premium when evaluating the positive relationship between AU_FEES and
FEM_AU (p < 0.01). When evaluating the results using only 2017-2018 control variable
years, the findings also indicate a significant negative relationship between AU_FEES
and AU_DEPT and a significant positive relationship between AU_FEES and
LG_OFFICE_SEN_LVL, while none of the control variable results are unexpected.
Results Summary for Senior-Level Audit Human Capital at the Audit Office Department
and Audit Quality (H1b)
The test results for H1b first suggest that audit offices with greater amounts of
senior-level auditors have clients with fewer financial restatements, fewer going concern
opinion modifications, and have no impact on the discovery of material internal control
weaknesses, a mixed conclusion when compared to the expectations of H1b. Taken
together, it might be that offices with larger quantities of senior-level auditors have
“trained” their clients to maintain high quality financial reporting and internal controls,
and have eliminated risky or illiquid clients. It could also be that the interactions
between lower-level auditors and client management are ineffective in reducing the
amount of material internal control weaknesses, which makes sense given that auditor-
client negotiations typically do not occur at lower staffing levels. Finally, the results
show audit fees tend to have a negative relationship to larger overall audit departments,
and tend to have a positive relationship to audit departments with greater proportions of

106
senior-level auditors. It might be that offices with larger proportions of senior-level
auditors cost more due to their level of experience, while at the overall audit department
level, offices with greater amounts of total overall audit human capital are able to create
enough efficiencies to drive down audit cost.
Supplemental Analysis for Senior-Level Audit Human Capital at the Audit Office
Department and Audit Quality (H1b)
In supplemental analysis of H1b testing, the dependent variable RESTATE is again
modified in three ways. First, RESTATE is replaced with RESTATE_NO_ICW. The
model for this test (untabulated) is not significant (p = 0.633). Second, RESTATE was
replaced by RESTATE_CE. The model for this test (untabulated) is significant (p =
0.014), with a pseudo R-square of 0.131; however, the test variables are not significant.
Finally, RESTATE is replaced by SEC_REG_FAR, to test for restatements that occurred at
an auditor office in the same city as one of the eleven SEC regional offices. The model
for this test (untabulated) is significant (p < 0.01), with a pseudo R-square of 0.102, and
produces a significant negative relationship with AU_DEPT and a significant positive
relationship with LG_OFFICE_SEN_LVL. This finding is unexpected, as one would
expect that offices with greater amounts of senior-level human capital and presumably
more experience would be associated with fewer restatements. It is possible that the
nearness to an SEC regional office affects audit offices with greater amounts of
seniorlevel auditors to a greater extent than other audit offices, perhaps because senior-

107
level auditors feel regulatory pressure more strongly than other auditors; therefore this
finding warrants future research.
Education Quality of Audit Human Capital at the Audit Office Department and Audit
Quality (H1c)
Table 13 provides the regression results of the relationship between audit human
capital and audit quality for Hypothesis 1c. Panels A1-A4 of Table 13 present the results
from the logistic regressions of RESTATE on the test and control variables for each
staffing level (A1=partner, A2=principal, A3=senior manager-manager, and A4=senior
associate-associate). The results indicate significant positive associations between
RESTATE and PG_AU_PRIN (p = 0.055), UG_ELITE_AU_SMGR_MGR (p < 0.01), and
UG_MSA_AU_SEN_ASSOC (p = 0.054), and a significant negative association between
RESTATE and UG_AACSB_ACC_AU_PART (p = 0.068). These mixed results at the
partner, principal, senior manager/manager, and senior associate/associate levels are
unexpected, but might indicate that audit departments which are disproportioned (for
example, “top-heavy” and/or “bottom-heavy”) perform poorer than those that are more
proportionately staffed, perhaps because the client workload is not distributed efficiently.
The results also indicate significant positive relationships at all staffing levels between
RESTATE and ICW, AU_FEES, EQUITY_MULTIPLIER and FIRM_TENURE, and
significant negative relationships between RESTATE and AUDIT_CLIENTS, QUICK,
NATIONAL_LEADER, FEM_AU, and SIZE.
TABLE 13 - Regression of Audit Quality on the Education Quality of Audit Human Capital at the Audit Office Department
(H1c)
Panel A1: Using RESTATE as the Dependent Variable Control Variable Years: 2011-2018 Control Variable Years: 2017-2018
Variable p-value Wald
Intercept
?
-2.271
6.917
0.048**
-22.525
0.000
0.999
PG_AU_PART
-
0.181
0.758
0.384
0.307
0.223
0.637
UG_MSA_AU_PART
-
-0.162
0.729
0.197
-0.208
0.121
0.364
UG_ELITE_AU_PART
-
-0.199
0.781
0.189
-0.586
0.572
0.225
UG_AACSB_ACC_AU_PART
-
-0.314
2.220
0.068*
-1.612
4.988
0.013**
AUDIT_CLIENTS
-
-0.347
4.526
0.017**
-0.176
0.163
0.343
ICW
+
1.406
107.028
0.000***
2.196
31.833
0.000***
AU_FEES
+
0.332
23.799
0.000***
0.283
1.716
0.095*
SIZE
-
-0.167
17.178
0.000***
-0.189
2.200
0.069*
LOSS
+
0.002
0.001
0.490
-0.494
3.197
0.074*
EQUITY_MULTIPLIER
+
0.007
3.748
0.027**
0.005
0.155
0.347
QUICK
-
-0.023
2.107
0.074*
-0.045
0.622
0.215
OPSEG
+
0.004
0.296
0.293
0.018
0.090
0.382
GEOSEG
+
0.001
0.030
0.431
0.004
0.009
0.463
Expected Sign
Estimate
Wald
Estimate
p
-
value

Regression of Audit Quality on the Education Quality of Audit Human Capital at the Audit Office Department (H1c)
Pseudo R2
LnPOPULATION
-
0.004
0.011
0.915
0.164
1.641
0.200
FIRM_TENURE
+
0.240
3.958
0.024**
0.194
0.268
0.303
NATIONAL_LEADER
-
-0.148
4.065
0.022**
-0.112
0.250
0.309
CITY_LEADER
-
0.021
0.073
0.787
0.236
1.013
0.314
NONAUDIT
+
0.009
0.724
0.198
0.032
0.920
0.169
FEM_AU
?
-1.731
8.041
0.005***
-2.960
2.439
0.118
INITIAL
+
-0.010
0.004
0.948
0.692
1.982
0.080*
MERGER
+
-0.015
0.041
0.840
0.110
0.252
0.308
CHANGE_IN_RECEIVABLES
+
-0.001
0.112
0.738
-0.003
0.000
0.983
CHANGE_IN_INVENTORIES
+
-0.005
0.027
0.869
-0.005
0.009
0.925
CHANGE_IN_CASH_SALES
+
-0.002
1.032
0.310
-0.070
1.670
0.196
Year and Industry fixed effects
Yes
Yes
Number of Restatements
1,025
122
Total Number of Observations
11,301
1,524
Model p-value
0.000***
0.000***
Regression of Audit Quality on the Education Quality of Audit Human Capital at the Audit Office Department (H1c)
Pseudo R2
Pseudo R2
5.7%
19.9%
Panel A2: Using RESTATE as the Dependent Variable Control Variable Years: 2011-2018 Control Variable Years: 2017-2018
Variable Wald
Intercept
?
-2.165
3.558
0.059*
-22.772
0.000
0.999
PG_AU_PRIN
-
0.279
3.695
0.055*
0.386
0.803
0.370
UG_MSA_AU_PRIN
-
-0.018
0.013
0.456
-0.596
1.381
0.120
UG_ELITE_AU_PRIN
-
0.123
0.294
0.588
-0.447
0.363
0.274
UG_AACSB_ACC_AU_PRIN
-
-0.177
0.942
0.166
-0.346
0.427
0.257
AUDIT_CLIENTS
-
-0.317
3.836
0.025**
0.012
0.001
0.978
ICW
+
1.412
107.634
0.000***
2.104
29.196
0.000***
AU_FEES
+
0.322
22.139
0.000***
0.273
1.609
0.051*
SIZE
-
-0.165
16.764
0.000***
-0.199
2.452
0.059*
LOSS
+
0.000
0.000
0.499
-0.491
3.165
0.038**
EQUITY_MULTIPLIER
+
0.007
3.864
0.025**
0.005
0.147
0.351
Expected Sign
Estimate
Wald
p
-
value
Estimate
p
-
value

Regression of Audit Quality on the Education Quality of Audit Human Capital at the Audit Office Department (H1c)
Pseudo R2
QUICK
-
-0.023
2.166
0.071*
-0.047
0.702
0.201
OPSEG
+
0.005
0.432
0.256
0.024
0.156
0.347
GEOSEG
+
0.001
0.041
0.420
0.008
0.039
0.422
LnPOPULATION
-
-0.005
0.016
0.450
0.186
2.159
0.142
FIRM_TENURE
+
0.228
3.588
0.029**
0.122
0.108
0.372
NATIONAL_LEADER
-
-0.142
3.759
0.027**
-0.103
0.219
0.320
CITY_LEADER
-
0.022
0.084
0.772
0.184
0.634
0.426
NONAUDIT
+
0.009
0.808
0.185
0.030
0.836
0.180
FEM_AU
?
-1.587
6.581
0.010***
-2.263
1.424
0.233
INITIAL
+
-0.009
0.004
0.951
0.717
2.162
0.071*
MERGER
+
-0.014
0.038
0.845
0.097
0.197
0.329
CHANGE_IN_RECEIVABLES
+
-0.001
0.128
0.720
-0.017
0.014
0.905
CHANGE_IN_INVENTORIES
+
-0.004
0.018
0.893
-0.002
0.002
0.963
CHANGE_IN_CASH_SALES
+
-0.002
1.020
0.313
-0.072
1.751
0.186
Year and Industry fixed effects
Yes
Yes
Regression of Audit Quality on the Education Quality of Audit Human Capital at the Audit Office Department (H1c)
Pseudo R2
Number of Restatements
1,025
122
Total Number of Observations
11,301
1,524
Model p-value
0.000***
0.000***
5.7%
19.3%
Panel A3: Using RESTATE as the Dependent Variable Control Variable Years: 2011-2018 Control Variable Years: 2017-2018
Variable p-value Wald
Intercept
?
-2.407
4.447
0.035**
-22.718
0.000
0.999
PG_AU_SMGR_MGR
-
-0.277
1.614
0.102
0.178
0.070
0.791
UG_MSA_AU_SMGR_MGR
-
0.301
1.947
0.163
-0.274
0.172
0.678
UG_ELITE_AU_SMGR_MGR
-
1.187
12.618
0.000***
3.500
15.988
0.000***
UG_AACSB_ACC_AU_SMGR_MGR
-
0.113
0.172
0.678
-0.619
0.504
0.478
AUDIT_CLIENTS
-
-0.383
5.787
0.008***
-0.348
0.707
0.201
ICW
+
1.405
106.241
0.000***
2.220
32.340
0.000***
AU_FEES
+
0.342
24.734
0.000***
0.335
2.333
0.064*
Expected Sign
Estimate
Wald
Estimate
p
-
value

Regression of Audit Quality on the Education Quality of Audit Human Capital at the Audit Office Department (H1c)
Pseudo R2
SIZE
-
-0.172
18.305
0.000***
-0.254
3.891
0.025**
LOSS
+
0.000
0.000
0.498
-0.524
3.589
0.058*
EQUITY_MULTIPLIER
+
0.007
3.847
0.025**
0.004
0.136
0.357
QUICK
-
-0.022
1.973
0.080*
-0.049
0.781
0.189
OPSEG
+
0.005
0.356
0.276
0.029
0.240
0.312
GEOSEG
+
0.001
0.035
0.426
0.004
0.011
0.458
LnPOPULATION
-
-0.015
0.132
0.359
0.138
1.111
0.292
FIRM_TENURE
+
0.239
3.929
0.024**
0.164
0.193
0.330
NATIONAL_LEADER
-
-0.144
3.902
0.024**
-0.108
0.236
0.314
CITY_LEADER
-
0.010
0.017
0.896
0.233
0.997
0.318
NONAUDIT
+
0.011
1.038
0.154
0.035
1.067
0.151
FEM_AU
?
-1.017
2.759
0.097*
-0.841
0.191
0.662
INITIAL
+
-0.015
0.010
0.921
0.714
2.135
0.072*
MERGER
+
-0.022
0.087
0.768
0.033
0.023
0.441
CHANGE_IN_RECEIVABLES
+
-0.001
0.146
0.703
-0.015
0.010
0.920
Regression of Audit Quality on the Education Quality of Audit Human Capital at the Audit Office Department (H1c)
Pseudo R2
CHANGE_IN_INVENTORIES
+
-0.004
0.023
0.879
-0.008
0.017
0.896
CHANGE_IN_CASH_SALES
+
-0.002
0.892
0.345
-0.066
1.505
0.220
Year and Industry fixed effects
Yes
Yes
Number of Restatements
1,025
122
Total Number of Observations
11,301
1,524
Model p-value
0.000***
0.000***
5.9%
21.0%
Panel A4: Using RESTATE as the Dependent Variable Control Variable Years: 2011-2018 Control Variable Years: 2017-2018
Variable p-value Wald
Intercept
?
-2.839
5.994
0.014**
-24.064
0.000
0.999
PG_AU_SEN_ASSOC
-
0.376
1.361
0.243
0.014
0.000
0.988
UG_MSA_AU_SEN_ASSOC
-
0.493
3.710
0.054*
1.425
3.134
0.077*
UG_ELITE_AU_SEN_ASSOC
-
0.188
0.199
0.656
-0.368
0.081
0.388
UG_AACSB_ACC_AU_SEN_ASSOC
-
0.353
1.186
0.276
0.184
0.035
0.852
Expected Sign
Estimate
Wald
Estimate
p
-
value

Regression of Audit Quality on the Education Quality of Audit Human Capital at the Audit Office Department (H1c)
Pseudo R2
AUDIT_CLIENTS
-
-0.300
3.505
0.031**
-0.097
0.048
0.414
ICW
+
1.413
107.514
0.000***
2.171
31.098
0.000***
AU_FEES
+
0.340
24.772
0.000***
0.299
1.934
0.082*
SIZE
-
-0.167
17.198
0.000***
-0.196
2.348
0.063*
LOSS
+
0.009
0.011
0.458
-0.487
3.121
0.077*
EQUITY_MULTIPLIER
+
0.007
4.052
0.022**
0.005
0.163
0.343
QUICK
-
-0.022
2.034
0.077*
-0.049
0.747
0.194
OPSEG
+
0.005
0.355
0.276
0.029
0.239
0.313
GEOSEG
+
0.001
0.012
0.457
0.005
0.011
0.476
LnPOPULATION
-
-0.004
0.008
0.466
0.185
2.051
0.152
FIRM_TENURE
+
0.231
3.681
0.028**
0.132
0.125
0.362
NATIONAL_LEADER
-
-0.159
4.681
0.016**
-0.099
0.201
0.327
CITY_LEADER
-
-0.006
0.007
0.467
0.167
0.525
0.469
NONAUDIT
+
0.010
0.964
0.163
0.030
0.792
0.187
FEM_AU
?
-1.326
4.815
0.028**
-1.715
0.900
0.343

Regression of Audit Quality on the Education Quality of Audit Human Capital at the Audit Office Department (H1c)
Pseudo R2
INITIAL
+
-0.009
0.004
0.952
0.735
2.238
0.068*
MERGER
+
-0.016
0.048
0.827
0.091
0.170
0.340
CHANGE_IN_RECEIVABLES
+
-0.001
0.130
0.718
-0.011
0.008
0.931
CHANGE_IN_INVENTORIES
+
-0.004
0.017
0.896
-0.005
0.009
0.924
CHANGE_IN_CASH_SALES
+
-0.002
0.987
0.321
-0.072
1.786
0.181
Year and Industry fixed effects
Yes
Yes
Number of Restatements
1,025
122
Total Number of Observations
11,301
1,524
Model p-value
0.000***
0.000***
5.8%
19.4%
Regression of Audit Quality on the Education Quality of Audit Human Capital at the Audit Office Department (H1c)
Panel B1: Using ICW as the Dependent Variable Control Variable Years: 2011-2018 Control Variable Years: 2017-2018
Variable Wald
Intercept ? -25.745 0.000 0.998 -19.279 0.000 0.999
PG_AU_PART + -0.437 1.119 0.290 -0.548 0.276 0.599
UG_MSA_AU_PART + -0.136 0.139 0.709 0.334 0.120 0.365
UG_ELITE_AU_PART + -0.171 0.147 0.702 -1.217 0.887 0.346
UG_AACSB_ACC_AU_PART + -0.495 1.491 0.222 0.851 0.853 0.178
AUDIT_CLIENTS + 0.121 0.335 0.282 -0.975 1.021 0.312
AU_FEES + 1.433 140.821 0.000*** 1.239 11.243
0.000***
SIZE - -0.792 122.962 0.000*** -0.792 13.283
0.000***
LOSS + 0.180 1.601 0.103 0.050 0.017 0.448
EQUITY_MULTIPLIER + 0.006 0.830 0.181 -0.009 0.353 0.552
QUICK - -0.046 1.839 0.088* -0.222 2.131 0.072*
OPSEG + -0.010 0.364 0.546 0.016 0.014 0.453
GEOSEG + 0.000 0.001 0.491 -0.034 0.220 0.639
LnPOPULATION - 0.053 0.539 0.463 -0.095 0.207 0.325
FIRM_TENURE - 0.244 1.456 0.228 0.584 1.264 0.261
NATIONAL_LEADER + -0.104 0.628 0.428 0.122 0.124 0.363
CITY_LEADER + -0.137 0.990 0.320 0.149 0.164 0.343
NONAUDIT + 0.004 0.045 0.416 -0.006 0.017 0.896
Expected Sign
Estimate
Wald
p
-
value
Estimate
p
-
value
Regression of Audit Quality on the Education Quality of Audit Human Capital at the Audit Office Department (H1c)
FEM_AU ? 1.191 1.189 0.275 3.738 1.303 0.254
INITIAL - -0.332 1.707 0.096* 0.177 0.066 0.797
MERGER + 0.267 4.353 0.019** 0.537 2.427 0.060*
Year and Industry fixed effects Yes Yes
Number of Control Weaknesses 308 45
Total Number of Observations 11,301 1,565
Model p-value 0.000*** 0.137
Pseudo R2 13.3% 23.7%
Panel B2: Using ICW as the Dependent Variable Control Variable Years: 2011-2018 Control Variable Years: 2017-2018
Variable Wald
Intercept
?
-26.047
0.000
0.998
-21.356
0.000
0.999
PG_AU_PRIN
+
-0.111
0.150
0.699
0.368
0.260
0.305
UG_MSA_AU_PRIN
+
-0.368
1.400
0.237
-0.163
0.043
0.835
UG_ELITE_AU_PRIN
+
-0.614
1.650
0.199
-2.313
1.634
0.201
UG_AACSB_ACC_AU_PRIN
+
-0.154
0.171
0.679
-1.427
1.403
0.236
Expected Sign
Estimate
Wald
p
-
value
Estimate
p
-
value

Regression of Audit Quality on the Education Quality of Audit Human Capital at the Audit Office Department (H1c)
AUDIT_CLIENTS
+
0.220
1.080
0.150
-0.928
0.823
0.364
AU_FEES
+
1.430
139.905
0.000***
1.200
10.435
0.000***
SIZE
-
-0.791
122.124
0.000***
-0.761
12.522
0.000***
LOSS
+
0.204
2.049
0.076*
0.072
0.035
0.426
EQUITY_MULTIPLIER
+
0.006
0.939
0.166
-0.012
0.577
0.448
QUICK
-
-0.046
1.889
0.085*
-0.212
2.006
0.079*
OPSEG
+
-0.009
0.314
0.575
0.015
0.013
0.454
GEOSEG
+
0.001
0.022
0.442
-0.029
0.168
0.682
LnPOPULATION
-
0.067
0.863
0.353
-0.084
0.169
0.341
FIRM_TENURE
-
0.242
1.437
0.231
0.697
1.794
0.180
NATIONAL_LEADER
+
-0.111
0.721
0.396
0.125
0.130
0.359
CITY_LEADER
+
-0.168
1.467
0.226
0.138
0.142
0.354
NONAUDIT
+
0.002
0.010
0.461
-0.014
0.086
0.770
FEM_AU
?
1.224
1.268
0.260
2.350
0.541
0.462
INITIAL
-
-0.336
1.760
0.093*
0.037
0.003
0.958
MERGER
+
0.263
4.220
0.020**
0.505
2.123
0.073*
Year and Industry fixed effects
Yes
Yes
Regression of Audit Quality on the Education Quality of Audit Human Capital at the Audit Office Department (H1c)
Number of Control Weaknesses
308
45
Total Number of Observations
11,301
1,565
Model p-value
0.000***
0.097*
Pseudo R2
13.4%
24.4%
Panel B3: Using ICW as the Dependent Variable Control Variable Years: 2011-2018 Control Variable Years: 2017-2018
Variable Wald Wald
Intercept ? -25.686 0.000 0.998 -20.063 0.000 0.999
PG_AU_SMGR_MGR + 0.599 2.429 0.060* 1.292 1.897 0.084*
UG_MSA_AU_SMGR_MGR + 0.774 3.989 0.023** 0.268 0.066 0.399
UG_ELITE_AU_SMGR_MGR + 0.478 0.524 0.235 -1.139 0.267 0.605
UG_AACSB_ACC_AU_SMGR_MGR + -0.428 0.722 0.396 -1.470 1.074 0.300
AUDIT_CLIENTS + 0.092 0.181 0.335 -1.280 1.343 0.246
AU_FEES + 1.485 147.268 0.000*** 1.295 11.981
0.000***
SIZE - -0.806 126.763 0.000*** -0.817 13.977
0.000***
LOSS + 0.211 2.180 0.070* 0.160 0.174 0.338
Expected Sign
Estimate
p
-
value
Estimate
p
-
value

Regression of Audit Quality on the Education Quality of Audit Human Capital at the Audit Office Department (H1c)
EQUITY_MULTIPLIER + 0.006 0.811 0.184 -0.013 0.656 0.418
QUICK - -0.043 1.642 0.100* -0.203 1.760 0.093*
OPSEG + -0.008 0.248 0.618 0.006 0.002 0.483
GEOSEG + -0.001 0.006 0.937 -0.023 0.109 0.741
LnPOPULATION - -0.020 0.075 0.392 -0.209 0.937 0.167
FIRM_TENURE - 0.240 1.398 0.237 0.630 1.474 0.225
NATIONAL_LEADER + -0.091 0.485 0.486 0.074 0.045 0.416
CITY_LEADER + -0.179 1.682 0.195 0.115 0.095 0.379
NONAUDIT + 0.001 0.003 0.477 -0.005 0.011 0.459
FEM_AU ? 1.454 1.875 0.171 2.302 0.559 0.228
INITIAL - -0.345 1.818 0.089* 0.074 0.011 0.458
MERGER + 0.248 3.764 0.026** 0.528 2.299 0.065*
Year and Industry fixed effects Yes Yes
Number of Control Weaknesses 308 45
Total Number of Observations 11,301 1,565
Model p-value 0.000*** 0.114
Pseudo R2 13.6% 24.1%
Regression of Audit Quality on the Education Quality of Audit Human Capital at the Audit Office Department (H1c)
Panel B4: Using ICW as the Dependent Variable Control Variable Years: 2011-2018 Control Variable Years: 2017-2018
Variable Wald
Intercept ? -25.856 0.000 0.998 -20.941 0.000 0.999
PG_AU_SEN_ASSOC + -0.451 0.583 0.445 -0.198 0.017 0.895
UG_MSA_AU_SEN_ASSOC + 0.543 1.330 0.125 -0.464 0.132 0.716
UG_ELITE_AU_SEN_ASSOC + -0.963 1.443 0.230 -3.211 1.239 0.266
UG_AACSB_ACC_AU_SEN_ASSOC + -0.598 0.914 0.339 -1.292 0.597 0.440
AUDIT_CLIENTS + 0.216 1.019 0.157 -0.984 0.898 0.343
AU_FEES + 1.430 140.391 0.000*** 1.244 11.421
0.000***
SIZE - -0.786 121.080 0.000*** -0.793 13.389
0.000***
LOSS + 0.202 1.991 0.079* 0.074 0.038 0.423
EQUITY_MULTIPLIER + 0.006 0.898 0.172 -0.012 0.551 0.458
QUICK - -0.048 2.048 0.076* -0.211 1.912 0.084*
OPSEG + -0.009 0.272 0.602 0.010 0.006 0.471
GEOSEG + 0.001 0.024 0.439 -0.029 0.164 0.686
LnPOPULATION - 0.054 0.553 0.457 -0.099 0.221 0.319
FIRM_TENURE - 0.239 1.404 0.236 0.657 1.613 0.204
NATIONAL_LEADER + -0.088 0.455 0.500 0.136 0.156 0.347
CITY_LEADER + -0.156 1.278 0.258 0.203 0.306 0.290
NONAUDIT + 0.001 0.002 0.481 -0.008 0.031 0.861
FEM_AU ? 1.285 1.322 0.250 2.712 0.671 0.413
Expected Sign
Estimate
Wald
p
-
value
Estimate
p
-
value
Regression of Audit Quality on the Education Quality of Audit Human Capital at the Audit Office Department (H1c)
INITIAL - -0.333 1.729 0.095* 0.089 0.017 0.896
MERGER + 0.259 4.124 0.021** 0.527 2.346 0.063*
Year and Industry fixed effects Yes Yes
Number of Control Weaknesses 308 45
Total Number of Observations 11,301 1,565
Model p-value 0.000*** 0.121
Pseudo R2 13.4% 23.9%
Panel C1: Using GCM as the Dependent Variable Control Variable Years: 2011-2018 Control Variable Years: 2017-2018
Variable Wald p-value Wald
Intercept ? 10.830 15.011 0.000*** 7.300 0.000 1.000
PG_AU_PART + -0.052 0.008 0.930 -4.049 2.689 0.101
UG_MSA_AU_PART + -0.408 0.668 0.414 -2.416 2.205 0.138
UG_ELITE_AU_PART + 0.480 0.577 0.224 1.161 0.392 0.266
UG_AACSB_ACC_AU_PART + -1.081 3.455 0.063* -0.164 0.007 0.934
AUDIT_CLIENTS - -0.349 0.855 0.178 1.207 1.013 0.314
ICW + 0.112 0.059 0.404 -15.375 0.000 0.998
AU_FEES + 0.171 1.550 0.107 0.317 0.227 0.317
Expected Sign
Estimate
Estimate
p
-
value

Regression of Audit Quality on the Education Quality of Audit Human Capital at the Audit Office Department (H1c)
SIZE - -0.468 24.716 0.000*** -1.021 4.457
0.018**
LOSS + 0.386 0.540 0.232 17.655 0.000 0.499
EQUITY_MULTIPLIER + -0.004 0.233 0.629 -0.017 0.082 0.774
QUICK - -0.164 18.921 0.000*** -0.106 1.107 0.147
OPSEG - 0.003 0.005 0.944 -0.198 0.299 0.292
GEOSEG - -0.053 5.526 0.001*** 0.243 3.202
0.074*
LnPOPULATION - -0.196 2.991 0.042** -0.674 2.721
0.050**
FIRM_TENURE - 0.334 2.080 0.149 1.055 1.551 0.213
NATIONAL_LEADER + -0.313 2.632 0.105 -1.018 1.984 0.159
CITY_LEADER + 0.174 0.831 0.181 0.322 0.221 0.319
NONAUDIT + 0.002 0.016 0.450 -0.065 1.181 0.277
FEM_AU ? 2.035 1.958 0.162 -2.042 0.146 0.703
INITIAL - -0.224 0.745 0.194 -1.229 1.042 0.154
MERGER - -0.441 2.778 0.048** 0.022 0.001 0.980
REPORTLAG + 0.002 1.398 0.119 0.057 4.184
0.021**
BANKRUPTCY - -0.067 33.148 0.000*** -0.072 2.656
0.052*
Year and Industry fixed effects Yes Yes
Number of Going Concern Modifications 235 19
Total Number of Observations 3,705 481
Regression of Audit Quality on the Education Quality of Audit Human Capital at the Audit Office Department (H1c)
Model p-value 0.000*** 0.000***
Pseudo R2 40.2% 60.0%
Panel C2: Using GCM as the Dependent Variable Control Variable Years: 2011-2018 Control Variable Years: 2017-2018
Variable Wald p-value Wald
Intercept
?
10.045
13.999
0.000***
11.337
0.000
1.000
PG_AU_PRIN
+
-0.284
0.457
0.499
-0.730
0.267
0.605
UG_MSA_AU_PRIN
+
-0.022
0.002
0.961
-2.829
2.975
0.085*
UG_ELITE_AU_PRIN
+
0.814
1.640
0.100*
-0.252
0.016
0.901
UG_AACSB_ACC_AU_PRIN
+
-0.043
0.006
0.937
-0.911
0.290
0.591
AUDIT_CLIENTS
-
-0.290
0.579
0.224
1.410
1.091
0.296
ICW
+
0.120
0.067
0.398
-14.888
0.000
0.998
AU_FEES
+
0.175
1.652
0.100*
0.575
0.648
0.211
SIZE
-
-0.455
23.697
0.000***
-0.911
3.719
0.027**
LOSS
+
0.401
0.589
0.222
18.373
0.000
0.499
EQUITY_MULTIPLIER
+
-0.003
0.124
0.725
-0.036
0.299
0.584
QUICK
-
-0.160
18.431
0.000***
-0.116
1.295
0.128
OPSEG
-
0.010
0.073
0.787
0.064
0.032
0.857
Expected Sign
Estimate
Estimate
p
-
value

Regression of Audit Quality on the Education Quality of Audit Human Capital at the Audit Office Department (H1c)
GEOSEG
-
-0.052
5.568
0.009***
0.224
2.987
0.084*
LnPOPULATION
-
-0.186
2.689
0.051*
-1.079
5.511
0.001***
FIRM_TENURE
-
0.330
2.014
0.156
0.483
0.326
0.568
NATIONAL_LEADER
+
-0.306
2.552
0.110
-1.086
2.286
0.131
CITY_LEADER
+
0.126
0.435
0.255
0.168
0.056
0.407
NONAUDIT
+
-0.001
0.001
0.976
-0.079
1.851
0.174
FEM_AU
?
2.239
2.420
0.120
-6.934
1.787
0.181
INITIAL
-
-0.216
0.696
0.202
-0.589
0.272
0.301
MERGER
-
-0.444
2.815
0.047**
-0.446
0.222
0.319
REPORTLAG
+
0.002
1.412
0.118
0.064
4.546
0.017**
BANKRUPTCY
-
-0.069
35.073
0.000***
-0.085
3.956
0.024**
Year and Industry fixed effects
Yes
Yes
Number of Going Concern Modifications
235
19
Total Number of Observations
3,705
481
Model p-value
0.000***
0.000***
Pseudo R2
40.1%
60.4%
Panel C3: Using GCM as the Dependent Variable Control Variable Years: 2011-2018 Control Variable Years: 2017-2018
Regression of Audit Quality on the Education Quality of Audit Human Capital at the Audit Office Department (H1c)
Variable Wald p-value Wald
Intercept
?
9.454
11.917
0.001***
3.359
0.000
1.000
PG_AU_SMGR_MGR
+
1.771
10.254
0.000***
1.763
0.865
0.176
UG_MSA_AU_SMGR_MGR
+
0.086
0.026
0.437
-0.113
0.003
0.955
UG_ELITE_AU_SMGR_MGR
+
0.131
0.015
0.452
1.781
0.208
0.325
UG_AACSB_ACC_AU_SMGR_MGR
+
1.055
2.024
0.078*
0.782
0.079
0.390
AUDIT_CLIENTS
-
-0.394
0.983
0.161
1.071
0.789
0.374
ICW
+
0.061
0.017
0.448
-15.817
0.000
0.998
AU_FEES
+
0.241
3.053
0.041**
0.199
0.090
0.382
SIZE
-
-0.469
24.628
0.000***
-0.688
2.260
0.067*
LOSS
+
0.459
0.761
0.192
17.672
0.000
0.499
EQUITY_MULTIPLIER
+
-0.003
0.073
0.787
-0.048
0.538
0.463
QUICK
-
-0.156
17.350
0.000***
-0.092
0.860
0.177
OPSEG
-
0.009
0.056
0.812
-0.225
0.356
0.276
GEOSEG
-
-0.055
5.959
0.008***
0.132
0.805
0.370
LnPOPULATION
-
-0.265
4.994
0.013**
-0.876
3.986
0.023**
FIRM_TENURE
-
0.308
1.720
0.190
0.953
1.416
0.234
Expected Sign
Estimate
Estimate
p
-
value

Regression of Audit Quality on the Education Quality of Audit Human Capital at the Audit Office Department (H1c)
NATIONAL_LEADER
+
-0.195
1.038
0.308
-0.838
1.376
0.241
CITY_LEADER
+
0.102
0.296
0.293
0.349
0.266
0.303
NONAUDIT
+
-0.003
0.027
0.869
-0.068
1.402
0.236
FEM_AU
?
3.285
5.023
0.025**
-1.269
0.063
0.803
INITIAL
-
-0.225
0.750
0.194
-1.060
0.889
0.173
MERGER
-
-0.454
2.891
0.045**
-0.264
0.080
0.389
REPORTLAG
+
0.003
2.354
0.063*
0.053
3.668
0.028**
BANKRUPTCY
-
-0.071
36.101
0.000***
-0.085
3.727
0.027**
Year and Industry fixed effects
Yes
Yes
Number of Going Concern Modifications
235
19
Total Number of Observations
3,705
481
Model p-value
0.000***
0.000***
Pseudo R2
41.1%
58.9%
Panel C4: Using GCM as the Dependent Variable Control Variable Years: 2011-2018 Control Variable Years: 2017-2018
Variable Wald p-value Wald
Intercept
?
9.873
12.787
0.000***
8.664
0.000
1.000
PG_AU_SEN_ASSOC
+
1.605
2.990
0.042**
-1.443
0.279
0.597
UG_MSA_AU_SEN_ASSOC
+
-0.314
0.210
0.647
-1.595
0.436
0.509
UG_ELITE_AU_SEN_ASSOC
+
0.967
0.509
0.238
-1.191
0.055
0.815
UG_AACSB_ACC_AU_SEN_ASSOC
+
-1.185
1.303
0.254
-2.108
0.499
0.480
AUDIT_CLIENTS
-
-0.410
1.116
0.146
0.860
0.479
0.489
ICW
+
0.077
0.028
0.434
-15.736
0.000
0.998
AU_FEES
+
0.189
1.907
0.084**
0.287
0.183
0.335
SIZE
-
-0.458
24.133
0.000***
-0.852
3.208
0.037**
LOSS
+
0.354
0.460
0.249
18.671
0.000
0.499
EQUITY_MULTIPLIER
+
-0.004
0.206
0.650
-0.030
0.189
0.664
QUICK
-
-0.168
19.542
0.000***
-0.104
1.061
0.152
OPSEG
-
0.009
0.061
0.805
-0.007
0.000
0.493
GEOSEG
-
-0.051
5.212
0.011**
0.233
3.044
0.081*
LnPOPULATION
-
-0.185
2.592
0.054*
-0.851
3.375
0.033**
FIRM_TENURE
-
0.336
2.090
0.148
0.712
0.758
0.384
Expected Sign
Estimate
Estimate
p
-
value

Regression of Audit Quality on the Education Quality of Audit Human Capital at the Audit Office Department (H1c)
NATIONAL_LEADER
+
-0.326
2.936
0.087*
-1.145
2.740
0.098*
CITY_LEADER
+
0.124
0.426
0.257
0.425
0.402
0.263
NONAUDIT
+
0.002
0.013
0.454
-0.061
1.174
0.279
FEM_AU
?
1.355
0.804
0.370
-5.894
1.216
0.270
INITIAL
-
-0.221
0.733
0.196
-0.565
0.252
0.308
MERGER
-
-0.453
2.908
0.044**
-0.487
0.257
0.306
REPORTLAG
+
0.002
1.773
0.092*
0.062
4.234
0.020**
BANKRUPTCY
-
-0.067
33.032
0.000***
-0.076
3.120
0.039**
Year and Industry fixed effects
Yes
Yes
Number of Going Concern Modifications
235
19
Total Number of Observations
3,705
481
Model p-value
0.000***
0.000***
Pseudo R2
40.2%
59.1%
Regression of Audit Quality on the Education Quality of Audit Human Capital at the Audit Office Department (H1c)
Panel D1: Using AU_FEES as the Dependent Variable
Control Variable Years: 2011-2018
Control Variable Years: 2017-2018

Variable
t-value
p-value
t-value
p-value
Intercept
?
3.590
30.190
0.000***
4.100
13.510
0.000***
PG_AU_PART
+
0.021
0.713
0.238
0.061
0.835
0.202
UG_MSA_AU_PART
+
-0.022
-0.880
0.190
0.013
0.195
0.423
UG_ELITE_AU_PART
+
0.012
0.427
0.335
0.044
0.595
0.276
UG_AACSB_ACC_AU_PART
+
-0.023
-0.833
0.203
-0.070
-1.005
0.158
AUDIT_CLIENTS
+
-0.172
-8.821
0.000***
-0.150
-3.166
0.001***
ICW
+
0.342
11.751
0.000***
0.244
3.359
0.000***
RESTATE
+
0.084
5.136
0.000***
0.072
1.587
0.057*
GCM
+
0.123
3.651
0.000***
0.245
2.842
0.003***
SIZE
+
0.464
128.883
0.000***
0.450
47.760
0.000***
LOSS
+
0.171
13.165
0.000***
0.133
4.072
0.000***
EQUITY_MULTIPLIER
+
0.001
0.913
0.181
0.001
0.853
0.197
QUICK
-
-0.025
-13.170
0.000***
-0.024
-4.518
0.000***
OPSEG
+
0.011
9.074
0.000***
0.031
4.134
0.000***
GEOSEG
+
0.008
11.037
0.000***
0.026
5.343
0.000***
lnPOPULATION
+
0.038
6.379
0.000***
0.032
2.142
0.016**
FIRM_TENURE
+
0.061
3.441
0.000***
-0.021
-0.476
0.317
Regression of Audit Quality on the Education Quality of Audit Human Capital at the Audit Office Department (H1c)
NATIONAL_LEADER
+
-0.016
-1.572
0.058*
0.001
0.056
0.478
CITY_LEADER
+
0.026
2.430
0.008***
0.034
1.262
0.104
NONAUDIT
+
0.017
12.610
0.000***
0.016
4.844
0.000***
FEM_AU
?
0.626
7.325
0.000***
0.450
2.081
0.019**
INITIAL
-
0.105
4.907
0.000***
0.081
1.272
0.102
FOREIGN
+
0.050
7.984
0.000***
0.017
1.332
0.092*
MERGER
+
0.053
5.099
0.000***
0.060
2.300
0.011**
DCFO
+
0.117
6.730
0.000***
0.124
2.679
0.004***
GROWTH
+
0.013
1.959
0.025**
0.019
0.872
0.192
Year and Industry fixed effects
Yes
Yes
Total Number of Observations
11,301
1,565
Model p-value
0.000***
0.000***
R2
77.0%
78.7%
Expected Sign
Estimate
Estimate

Panel D2: Using AU_FEES as the Dependent Variable
Control Variable Years: 2011-2018
Control Variable Years: 2017-2018
Variable
t-value
p-value
t-value
p-value
Intercept
?
3.597
30.105
0.000***
4.123
13.523
0.000***
PG_AU_PRIN
+
0.154
7.393
0.000***
0.194
3.791
0.000***
UG_MSA_AU_PRIN
+
0.046
2.030
0.021**
-0.013
-0.230
0.818
UG_ELITE_AU_PRIN
+
-0.061
-1.932
0.053*
-0.039
-0.496
0.620
UG_AACSB_ACC_AU_PRIN
+
-0.049
-1.979
0.048**
-0.051
-0.857
0.392
AUDIT_CLIENTS
+
-0.162
-8.199
0.000***
-0.130
-2.701
0.007***
ICW
+
0.342
11.781
0.000***
0.236
3.272
0.000***
RESTATE
+
0.082
4.978
0.000***
0.069
1.517
0.065*
GCM
+
0.125
3.708
0.000***
0.248
2.891
0.002***
SIZE
+
0.462
128.465
0.000***
0.446
47.493
0.000***
LOSS
+
0.167
12.898
0.000***
0.132
4.040
0.000***
EQUITY_MULTIPLIER
+
0.001
0.998
0.159
0.001
0.980
0.164
QUICK
-
-0.026
-13.291
0.000***
-0.024
-4.415
0.000***
OPSEG
+
0.011
9.142
0.000***
0.031
4.084
0.000***
GEOSEG
+
0.008
11.015
0.000***
0.027
5.461
0.000***
Regression of Audit Quality on the Education Quality of Audit Human Capital at the Audit Office Department (H1c)
lnPOPULATION
+
0.036
6.058
0.000***
0.031
2.095
0.018**
FIRM_TENURE
+
0.058
3.310
0.000***
-0.028
-0.653
0.514
NATIONAL_LEADER
+
-0.014
-1.375
0.169
0.006
0.235
0.407
CITY_LEADER
+
0.032
3.004
0.002***
0.034
1.276
0.101
NONAUDIT
+
0.017
12.844
0.000***
0.017
5.012
0.000***
FEM_AU
?
0.641
7.425
0.000***
0.483
2.208
0.027**
INITIAL
-
0.102
4.778
0.000***
0.082
1.290
0.197
FOREIGN
+
0.049
7.891
0.000***
0.017
1.333
0.092*
MERGER
+
0.054
5.155
0.000***
0.062
2.383
0.009***
DCFO
+
0.110
6.374
0.000***
0.115
2.487
0.007***
GROWTH
+
0.014
1.986
0.024**
0.018
0.834
0.202
Year and Industry fixed effects
Yes
Yes
Total Number of Observations
11,301
1,565
Model p-value
0.000***
0.000***
R2
77.1%
78.9%
Expected Sign
Estimate
Estimate

Regression of Audit Quality on the Education Quality of Audit Human Capital at the Audit Office Department (H1c)
Panel D3: Using AU_FEES as the Dependent Variable
Control Variable Years: 2011-2018
Control Variable Years: 2017-2018
Variable
t-value
p-value
t-value
p-value
Intercept
?
3.519
29.961
0.000***
4.020
13.449
0.000***
PG_AU_SMGR_MGR
+
-0.240
-8.102
0.000***
-0.245
-3.348
0.001***
UG_MSA_AU_SMGR_MGR
+
-0.203
-6.733
0.000***
-0.244
-3.246
0.001***
UG_ELITE_AU_SMGR_MGR
+
-0.136
-2.614
0.009***
-0.225
-1.789
0.074*
UG_AACSB_ACC_AU_SMGR_MGR
+
0.072
1.852
0.032**
0.088
0.896
0.185
AUDIT_CLIENTS
+
-0.134
-6.863
0.000***
-0.097
-2.057
0.040**
ICW
+
0.348
12.031
0.000***
0.241
3.357
0.000***
RESTATE
+
0.085
5.239
0.000***
0.080
1.782
0.038**
GCM
+
0.128
3.815
0.000***
0.257
3.015
0.002***
SIZE
+
0.461
128.496
0.000***
0.445
47.667
0.000***
LOSS
+
0.161
12.523
0.000***
0.122
3.760
0.000***
EQUITY_MULTIPLIER
+
0.000
0.750
0.227
0.001
0.888
0.188
QUICK
-
-0.026
-13.626
0.000***
-0.024
-4.552
0.000***
OPSEG
+
0.011
9.230
0.000***
0.031
4.194
0.000***
GEOSEG
+
0.008
11.222
0.000***
0.027
5.557
0.000***
Regression of Audit Quality on the Education Quality of Audit Human Capital at the Audit Office Department (H1c)
LnPOPULATION
+
0.057
9.616
0.000***
0.055
3.671
0.000***
FIRM_TENURE
+
0.060
3.435
0.000***
-0.024
-0.569
0.569
NATIONAL_LEADER
+
-0.020
-2.043
0.041**
0.005
0.180
0.429
CITY_LEADER
+
0.039
3.693
0.000***
0.041
1.529
0.064*
NONAUDIT
+
0.017
12.755
0.000***
0.016
4.845
0.000***
FEM_AU
?
0.570
6.652
0.000***
0.415
1.918
0.055*
INITIAL
-
0.100
4.713
0.000***
0.099
1.570
0.117
FOREIGN
+
0.049
7.910
0.000***
0.016
1.278
0.101
MERGER
+
0.056
5.392
0.000***
0.067
2.599
0.005***
DCFO
+
0.108
6.274
0.000***
0.112
2.453
0.007***
GROWTH
+
0.013
1.964
0.025**
0.016
0.764
0.223
Year and Industry fixed effects
Yes
Yes
Total Number of Observations
11,301
1,565
Model p-value
0.000***
0.000***
R2
77.3%
79.1%
Expected Sign
Estimate
Estimate

Regression of Audit Quality on the Education Quality of Audit Human Capital at the Audit Office Department (H1c)
Panel D4: Using AU_FEES as the Dependent Variable
Control Variable Years: 2011-2018
Control Variable Years: 2017-2018
Variable
t-value
p-value
t-value
p-value
Intercept
?
3.592
29.694
0.000***
4.074
13.086
0.000***
PG_AU_SEN_ASSOC
+
-0.222
-4.870
0.000***
-0.187
-1.663
0.097*
UG_MSA_AU_SEN_ASSOC
+
-0.156
-4.374
0.000***
-0.142
-1.560
0.119
UG_ELITE_AU_SEN_ASSOC
+
-0.016
-0.278
0.781
0.000
0.003
0.499
UG_AACSB_ACC_AU_SEN_ASSOC
+
0.206
4.359
0.000***
0.200
1.740
0.041**
AUDIT_CLIENTS
+
-0.169
-8.650
0.000***
-0.148
-3.072
0.002***
ICW
+
0.342
11.786
0.000***
0.240
3.314
0.000***
RESTATE
+
0.087
5.280
0.000***
0.078
1.727
0.042**
GCM
+
0.124
3.672
0.000***
0.242
2.813
0.003***
SIZE
+
0.463
128.681
0.000***
0.448
47.617
0.000***
LOSS
+
0.168
13.018
0.000***
0.130
3.985
0.000***
EQUITY_MULTIPLIER
+
0.000
0.866
0.194
0.001
0.899
0.185
QUICK
-
-0.025
-13.001
0.000***
-0.024
-4.413
0.000***
OPSEG
+
0.012
9.430
0.000***
0.032
4.199
0.000***
Regression of Audit Quality on the Education Quality of Audit Human Capital at the Audit Office Department (H1c)
GEOSEG
+
0.008
11.125
0.000***
0.026
5.407
0.000***
lnPOPULATION
+
0.044
7.393
0.000***
0.041
2.662
0.004***
FIRM_TENURE
+
0.063
3.549
0.000***
-0.018
-0.425
0.671
NATIONAL_LEADER
+
-0.012
-1.234
0.217
0.007
0.285
0.388
CITY_LEADER
+
0.030
2.866
0.002***
0.034
1.261
0.104
NONAUDIT
+
0.017
12.435
0.000***
0.017
4.884
0.000***
FEM_AU
?
0.740
8.545
0.000***
0.564
2.585
0.010***
INITIAL
-
0.104
4.861
0.000***
0.081
1.280
0.201
FOREIGN
+
0.050
8.047
0.000***
0.019
1.472
0.071*
MERGER
+
0.055
5.230
0.000***
0.060
2.284
0.011**
DCFO
+
0.117
6.776
0.000***
0.124
2.696
0.004***
GROWTH
+
0.014
2.001
0.023**
0.017
0.779
0.218
Year and Industry fixed effects
Yes
Yes
Total Number of Observations
11,301
1,565
Model p-value
0.000***
0.000***
R2
77.1%
78.8%
Expected Sign
Estimate
Estimate

Regression of Audit Quality on the Education Quality of Audit Human Capital at the Audit Office Department (H1c)

140
When evaluating the results using only 2017-2018 control variable years, the findings
indicate a significant negative relationship between RESTATE and
UG_AACSB_ACC_AU_PART (p = 0.013) and significant positive relationships between
RESTATE and UG_ELITE_AU_SMGR_MGR (p < 0.01) and UG_MSA_AU_SEN_ASSOC
(p = 0.077), while none of the control variable results are unexpected.
Panels B1-B4 of Table 13 present the results from the logistic regressions of ICW
on the test and control variables for each staffing level (B1=partner, B2=principal,
B3=senior manager-manager, and B4=senior associate-associate). The results indicate
significant positive relationships between ICW and PG_AU_SMGR_MGR (p = 0.015)
and UG_MSA_AU_SMGR_MGR (p = 0.023). These results indicate that material
internal control weaknesses tend to be detected by audit departments with more senior
manager/manager audit human capital possessing post-graduate degrees and
undergraduate degrees from institutions located in the same metro-statistical area as their
home office. However, none of the educational test variables are significant at the
principal and partner levels, aligning with H1c in that the positive effects of education on
audit quality decrease as seniority levels increase. Of note is that the educational test
variables are not significant at the senior associate/associate level, possibly because
senior associates/associates tend to be involved in the audit detail testing, whereas senior
managers/managers tend to be more involved in the review process and in making overall
assessments of control deficiencies that would include assessing the presence of
compensating controls. The significant positive relationships between ICW and
AU_FEES, LOSS, and MERGER are expected. The significant negative relationships
between ICW and SIZE, QUICK, and INITIAL are also expected. When evaluating the

141
results using only 2017-2018 control variable years, the results show an unexpected
significant negative relationship between ICW and UG_MSA_AU_PRIN (p = 0.085),
while none of the control variable results are unexpected.
Panels C1-C4 of Table 13 present the results from the logistic regressions of
GCM on the test and control variables for each staffing level (C1=partner, C2=principal,
C3=senior manager-manager, and C4=senior associate-associate). The results indicate a
significant negative relationship between GCM and UG_AACSB_ACC_AU_PART (p =
0.063) and significant positive relationships between GCM and UG_ELITE_AU_PRIN (p
= 0.100), PG_AU_SMGR_MGR (p < 0.01), UG_AACSB_ACC_AU_SMGR_MGR (p =
0.078), and PG_AU_SEN_ASSOC (p = 0.042), partially aligning with H1c. The
significant negative relationship at the partner level is unexpected, although it may again
indicate that disproportionally staffed offices have inconsistent audit quality. The
significant positive relationships between GCM and AU_FEES, BANKRUPTCY, and
REPORTLAG are expected, as are the significant negative relationships between GCM
and SIZE, QUICK, MERGER, LnPOPULATION, GEOSEG, and NATIONAL_LEADER.
When evaluating the results using only 2017-2018 control variable years, the findings
indicate a significant negative relationship between GCM and UG_MSA_AU_PRIN,
while none of the control variable results are unexpected.
Panels D1-D4 of Table 13 present the results from the OLS regression of
AU_FEES on the test and control variables for each staffing level (D1=partner,
D2=principal, D3=senior manager-manager, and D4=senior associate-associate). The
results indicate significant negative relationships between AU_FEES and
UG_ELITE_AU_PRIN (p = 0.053), UG_AACSB_ACC_AU_PRIN (p = 0.048),
PG_AU_SMGR_MGR (p < 0.01), UG_MSA_AU_SMGR_MGR (p < 0.01),

142
UG_ELITE_AU_SMGR_MGR (p = 0.009), PG_AU_SEN_ASSOC (p < 0.01), and
UG_MSA_AU_SEN_ASSOC (p < 0.01), and significant positive relationships between
AU_FEES and PG_AU_PRIN (p < 0.01), UG_MSA_AU_PRIN (p = 0.021),
UG_AACSB_ACC_AU_SMGR_MGR (p = 0.032), and
UG_AACSB_ACC_AU_SEN_ASSOC (p < 0.01). The results seem to indicate that, while
educational effects on audit fees tend to disappear at the partner staffing level (as
expected by H1c), the educational effects of other staffing levels are mixed and should be
examined at a more detailed level in future research. The findings again report a
significant negative relationship between AU_FEES and AUDIT_CLIENTS (p < 0.01) at
all staffing levels, perhaps indicating that offices with greater amounts of audit clients per
auditor can create resource-sharing efficiencies among similar clients. The results also
indicate significant positive relationships between AU_FEES and RESTATE, ICW, GCM,
SIZE, LOSS, OP_SEG, GEO_SEG, LnPOPULATION, FIRM_TENURE, CITY_LEADER
(when controlling for NATIONAL_LEADER), NONAUDIT, INITIAL, FOREIGN,
MERGER, DCFO, and GROWTH, and a significant negative relationship between
AU_FEES and QUICK. Additionally, the results continue to indicate the presence of a
significant female audit fee premium when evaluating the positive relationship between
AU_FEES and FEM_AU (p < 0.01). When evaluating the results using only 2017-2018
control variable years, the results indicate significant negative relationships between
AU_FEES and PG_AU_SMGR_MGR (p = 0.001), UG_MSA_AU_SMGR_MGR (p =
0.001), UG_ELITE_AU_SMGR_MGR (p = 0.074), and PG_AU_SEN_ASSOC (p =
0.097), and significant positive relationships between AU_FEES and PG_AU_PRIN (p <
0.01) and UG_AACSB_ACC_AU_SEN_ASSOC (p = 0.041), while none of the control
variable results are unexpected.

143
Results Summary for Education Quality of Audit Human Capital at the Audit Office
Department and Audit Quality (H1c)
The test results for H1c first suggest that audit departments with higher
proportions of principals with post-graduate degrees; higher proportions of senior
managers/managers with elite undergraduate educations; and higher proportions of senior
associates/associates who attended an undergraduate program in the same metrostatistical
area as their current audit office all, surprisingly, have a significant positive relationship
to subsequent financial restatements, none of which align with H1c. The results also
indicate that offices with higher proportions of partners who attended undergraduate
accounting programs separately accredited by the AACSB have a significant negative
relationship to subsequent financial restatements, which does not fully align with H1c (as
H1c suggests that positive education effects are reduced at higher staffing levels). While
these mixed results warrant additional future research, a simple explanation might be that
audit departments that are staffed disproportionately (see Table 4 – the shape of a
descending slope) do not perform as well as audit departments that are staffed
proportionately. When considering only 2017-2018 control variable years, all of the test
variable results (except for PG_AU_PRIN which is no longer significant) are similar to
the results from the main model, while none of the control variable results are
unexpected.
The test results for H1c also suggest that material internal control weaknesses are
more likely to be reported by audit offices with higher proportions of senior
managers/managers who have a post-graduate degree or attended an undergraduate

144
program in the same metro-statistical area as their current audit office, which aligns with
H1c in that educational effects should lessen in correspondence with staffing level
increases, especially at the partner and principal levels. It could be that senior
managers/managers are involved more in the audit review processes where control
weaknesses would be identified, as opposed to associates who are more involved in detail
testing or partners and principals who might be more involved with the process of client
negotiations to report or withhold material internal control weakness disclosures. When
considering only 2017-2018 control variable years, only the model from Panel B2 is
significant, although none of the test variables are significant, while none of the control
variable results are unexpected.
The test results for H1c also suggest that audit departments with greater
proportions of partners who attended undergraduate accounting programs separately
accredited by the AACSB; greater proportions of principals who attended an elite
undergraduate institution; greater proportions of senior managers/managers with a
postgraduate degree or who attended undergraduate accounting programs separately
accredited by the AACSB; and greater proportions of senior associates/associates with a
post-graduate degree are all positively associated with going concern modifications.
These results partially align with H1c (warranting future research) by indicating that
general educational effects (i.e. the general possession of a post-graduate degree) are
more significant at the senior associate/associate and senior manager/manager levels,
whereas specialized educational effects (i.e. an elite education or a separately accredited
accounting program) may not be marginalized by the experience that comes with
advances in staffing level.

145
Finally, the test results for H1c indicate that audit fees do not have a significant
relationship with partner educational effects, which aligns with the expectations of H1c.
However, the test results also suggest that audit departments with greater proportions of
principals with post-graduate degrees or attended an undergraduate program in the same
metro-statistical area as their current audit office are associated with higher audit fees,
while audit departments with greater proportions of principals with elite educations or
who attended undergraduate accounting programs separately accredited by the AACSB
are associated with lower audit fees. In addition, audit departments with higher
proportions of both senior managers/managers and senior associates/associates who have
a post-graduate degree or attended an undergraduate program in the same metrostatistical
area as their current audit office are associated with lower audit fees, while audit
departments with higher proportions of both senior managers/managers and senior
associates/associates who attended undergraduate accounting programs separately
accredited by the AACSB are associated with higher audit fees. Taken together, these
mixed results might be capturing inefficiency effects that exists in offices which are
disproportionately staffed, or capturing the effects of offices that borrow (lend) audit
human capital from (to) other offices with excess (limited) capacity. Future research in
this area could attempt to uncover which offices tend to lend audit human capital and
which offices tend to borrow audit human capital, and how educational background
affects this practice. When evaluating the test results for H1c using only control variables
from 2017-2018, the results for senior managers/managers and senior
associates/associates are similar to the main model, while only the proportion of

146
principals with post-graduate degrees remains significant, possibly indicating that for the
control sample, educational effects are stronger for lower staffing levels. None of the
2017-2018 control variable results are unexpected.
Logistic and OLS Regressions – Audit Personnel Experience
Auditor Experience at the Audit Office Department and Audit Quality (H2a)
Table 14 provides the regression results of the relationship between audit
personnel experience at the audit office department and audit quality for Hypotheses 2a.
Panel A of Table 14 presents the results from the logistic regression of RESTATE on the
test and control variables. The results indicate a significant negative association between
RESTATE and SMGR_MGR_EXP_DEPT_AVG (p = 0.016). This result could indicate
that experienced managers have an impact on audit quality (measured by subsequent
restatements), while experienced staff or experienced principals and partners may not.
Although this finding does not fully align with H2a, the assessment is intuitive, as
managers are the primary database and financial statement reviewers in an audit
engagement, and therefore might have the most influence on the incorrect application of
a standard that would require a subsequent restatement. Additionally, the results continue
to indicate a significant negative association between RESTATE and FEM_AU (0.026).
The results also indicate significant positive relationships between RESTATE and ICW,
AU_FEES, EQUITY_MULTIPLIER, and FIRM_TENURE, and significant negative
relationships between RESTATE and AUDIT_CLIENTS, NATIONAL_LEADER, and

147
SIZE, all of which are expected based on the prior literature. When evaluating the results
using only 2017-2018 control variable years, the test variables are not significant, while
none of the control variable results are unexpected.
Panel B of Table 14 presents the results from the logistic regression of ICW on the
test and control variables for Hypothesis 2a. The results indicate significant positive
relationships between ICW and PART_EXP_DEPT_AVG (p = 0.021) and
SEN_ASSOC_EXP_DEPT_AVG (p = 0.087), and a significant negative relationship
between ICW and PRIN_EXP_DEPT_AVG (p = 0.014), which partially aligns with H2a,
in that experience seems to impacts audit quality much more at senior levels. However,
the negative coefficient for principals is unexpected when compared to the positive
coefficient for partners. It could be that some of the audit principals act in an
administrative audit or director role, such as a revenue auditing expert or PCAOB
compliance expert, and give general guidance rather than work on a specific audit
engagement at an office. When comparing to the results from Panel B1 of Table 13
(H1c), it is interesting to note that the coefficients for audit department partners/education
interactions are negative, while the coefficient for the experience of the audit department
partners (PART_EXP_DEPT_AVG) is positive, possibly indicating that the experience
level of partners (rather than simply headcount) has a more powerful effect in the
reporting of material internal control weaknesses.
TABLE 14 - Regression of Audit Quality on Auditor Experience at the Audit Office Department (H2a)
Panel A: Using RESTATE as the Dependent Variable Control Variable Years: 2011-2018 Control Variable Years: 2017-2018
Variable Wald
Intercept
?
-2.038
2.981
0.084*
-21.531
0.000
0.999
PART_EXP_DEPT_AVG
-
-0.004
0.374
0.271
-0.018
0.628
0.214
PRIN_EXP_DEPT_AVG
-
0.012
2.590
0.108
-0.027
1.268
0.130
SMGR_MGR_EXP_DEPT_AVG
-
-0.015
4.646
0.016**
-0.036
1.468
0.113
SEN_ASSOC_EXP_DEPT_AVG
-
-0.044
0.120
0.365
-0.414
0.879
0.174
AUDIT_CLIENTS
-
-0.358
4.984
0.013**
-0.141
0.110
0.370
ICW
+
1.413
107.827
0.000***
2.190
31.403
0.000***
AU_FEES
+
0.338
24.558
0.000***
0.296
1.907
0.084*
SIZE
-
-0.172
18.341
0.000***
-0.220
2.977
0.042**
LOSS
+
0.005
0.003
0.479
0.469
2.863
0.091*
EQUITY_MULTIPLIER
+
0.007
4.075
0.022**
0.006
0.237
0.313
QUICK
-
-0.023
2.104
0.074*
-0.047
0.675
0.206
OPSEG
+
0.006
0.539
0.232
0.023
0.149
0.350
GEOSEG
+
0.001
0.015
0.451
0.001
0.001
0.489
Expected Sign
Estimate
Wald
p
-
value
Estimate
p
-
value

Regression of Audit Quality on Auditor Experience at the Audit Office Department (H2a)
LnPOPULATION
-
-0.010
0.059
0.405
0.172
1.792
0.181
FIRM_TENURE
+
0.240
3.958
0.024**
0.153
0.170
0.340
NATIONAL_LEADER
-
-0.163
4.887
0.014**
-0.162
0.532
0.233
CITY_LEADER
-
0.000
0.000
0.996
0.161
0.491
0.484
NONAUDIT
+
0.009
0.763
0.191
0.034
1.026
0.156
FEM_AU
?
-1.370
4.928
0.026**
-0.955
0.254
0.614
INITIAL
+
0.000
0.000
0.500
0.732
2.250
0.067*
MERGER
+
-0.008
0.013
0.910
0.100
0.208
0.324
CHANGE_IN_RECEIVABLES
+
-0.001
0.121
0.728
-0.021
0.022
0.881
CHANGE_IN_INVENTORIES
+
-0.005
0.029
0.865
-0.004
0.006
0.937
CHANGE_IN_CASH_SALES
+
-0.002
0.986
0.321
-0.071
1.721
0.190
Year and Industry fixed effects
Yes
Yes
Number of Restatements
1,025
122
Total Number of Observations
11,301
1,524
Model p-value
0.000***
0.000***
Pseudo R2
5.8%
19.9%
Panel B: Using ICW as the Dependent Variable Control Variable Years: 2011-2018 Control Variable Years: 2017-2018
Regression of Audit Quality on Auditor Experience at the Audit Office Department (H2a)
Variable Wald
Intercept
?
-26.239
0.000
0.998
-19.325
0.000
0.999
PART_EXP_DEPT_AVG
+
0.025
4.180
0.021**
0.062
3.559
0.030**
PRIN_EXP_DEPT_AVG
+
-0.036
6.045
0.014**
-0.006
0.028
0.867
SMGR_MGR_EXP_DEPT_AVG
+
-0.020
2.453
0.117
-0.037
1.679
0.195
SEN_ASSOC_EXP_DEPT_AVG
+
0.282
1.856
0.087*
-0.562
0.690
0.406
AUDIT_CLIENTS
+
0.073
0.120
0.365
-1.163
1.406
0.236
AU_FEES
+
1.443
143.096
0.000***
1.38
13.328
0.000***
SIZE
-
-0.798
125.090
0.000***
-0.856
15.323
0.000***
LOSS
+
0.201
2.005
0.079*
0.123
0.104
0.374
EQUITY_MULTIPLIER
+
0.006
0.962
0.164
-0.009
0.283
0.595
QUICK
-
-0.042
1.548
0.107
-0.215
1.985
0.080*
OPSEG
+
-0.012
0.526
0.468
-0.007
0.002
0.961
GEOSEG
+
0.002
0.030
0.432
-0.039
0.283
0.595
LnPOPULATION
-
0.014
0.036
0.850
-0.275
1.678
0.098*
FIRM_TENURE
-
0.244
1.458
0.227
0.599
1.325
0.250
NATIONAL_LEADER
+
-0.078
0.350
0.554
-0.023
0.004
0.947
Expected Sign
Estimate
Wald
p
-
value
Estimate
p
-
value
Regression of Audit Quality on Auditor Experience at the Audit Office Department (H2a)
CITY_LEADER
+
-0.178
1.687
0.194
0.138
0.143
0.353
NONAUDIT
+
0.006
0.094
0.380
-0.002
0.002
0.961
FEM_AU
?
1.477
1.813
0.178
4.231
1.610
0.204
INITIAL
-
-0.325
1.638
0.101
0.142
0.043
0.836
MERGER
+
0.273
4.556
0.017**
0.609
3.030
0.041**
Year and Industry fixed effects
Yes
Yes
Number of Control Weaknesses
308
45
Total Number of Observations
11,301
1,565
Model p-value
0.000***
0.074*
Pseudo R2
13.8%
24.9%
Panel C: Using GCM as the Dependent Variable Control Variable Years: 2011-2018 Control Variable Years: 2017-2018
Variable Wald p-value Wald
Intercept
?
10.699
14.553
0.000***
8.714
0.000
1.000
PART_EXP_DEPT_AVG
+
0.006
0.093
0.381
-0.062
0.625
0.429
Expected Sign
Estimate
Estimate
p
-
value

Regression of Audit Quality on Auditor Experience at the Audit Office Department (H2a)
PRIN_EXP_DEPT_AVG
+
-0.002
0.012
0.911
-0.067
0.870
0.351
SMGR_MGR_EXP_DEPT_AVG
+
-0.058
4.730
0.030**
-0.283
1.351
0.245
SEN_ASSOC_EXP_DEPT_AVG
+
-0.051
0.028
0.866
-0.246
0.065
0.799
AUDIT_CLIENTS
-
-0.416
1.211
0.136
1.372
1.225
0.268
ICW
+
0.069
0.023
0.440
-15.544
0.000
0.998
AU_FEES
+
0.188
1.909
0.084*
0.061
0.008
0.464
SIZE
-
-0.477
25.661
0.000***
-0.649
2.016
0.078*
LOSS
+
0.384
0.537
0.232
18.661
0.000
0.499
EQUITY_MULTIPLIER
+
-0.004
0.187
0.665
-0.033
0.270
0.603
QUICK
-
-0.166
19.000
0.000***
-0.092
0.782
0.189
OPSEG
-
0.013
0.122
0.727
-0.083
0.053
0.410
GEOSEG
-
-0.057
6.379
0.006***
0.189
1.955
0.162
LnPOPULATION
-
-0.200
2.994
0.042**
-0.941
4.281
0.020**
FIRM_TENURE
-
0.329
1.986
0.159
0.713
0.734
0.392
NATIONAL_LEADER
+
-0.320
2.838
0.092*
-0.843
1.475
0.225
CITY_LEADER
+
0.098
0.270
0.302
0.054
0.006
0.470
NONAUDIT
+
0.001
0.005
0.473
-0.042
0.539
0.463

Regression of Audit Quality on Auditor Experience at the Audit Office Department (H2a)
FEM_AU
?
2.696
3.262
0.071*
-1.712
0.123
0.726
INITIAL
-
-0.217
0.702
0.201
-0.641
0.325
0.285
MERGER
-
-0.407
2.357
0.063*
-0.891
0.741
0.195
REPORTLAG
+
0.002
1.613
0.102
0.065
5.155
0.012**
BANKRUPTCY
-
-0.067
32.554
0.000***
-0.085
3.947
0.024**
Year and Industry fixed effects
Yes
Yes
Number of Going Concern Modifications
235
19
Total Number of Observations
3,705
481
Model p-value
0.000***
0.000***
Pseudo R2
40.5%
60.0%
Panel D: Using AU_FEES as the Dependent Variable
Control Variable Years: 2011-2018
Control Variable Years: 2017-2018
Variable
t-value
p-value
t-value
p-value
Intercept
?
3.539
28.531
0.000***
4.146
13.065
0.000***
PART_EXP_DEPT_AVG
+
-0.004
-3.948
0.000***
-0.004
-1.560
0.119
PRIN_EXP_DEPT_AVG
+
0.000
-0.376
0.354
-0.002
-0.913
0.361

Regression of Audit Quality on Auditor Experience at the Audit Office Department (H2a)
SMGR_MGR_EXP_DEPT_AVG
+
0.003
4.135
0.000***
0.006
2.917
0.002***
SEN_ASSOC_EXP_DEPT_AVG
+
-0.012
-0.649
0.517
-0.092
-2.043
0.041**
AUDIT_CLIENTS
+
-0.161
-8.378
0.000***
-0.129
-2.764
0.006***
ICW
+
0.345
11.850
0.000***
0.249
3.443
0.000***
RESTATE
+
0.086
5.217
0.000***
0.072
1.583
0.057*
GCM
+
0.125
3.721
0.000***
0.242
2.827
0.003***
SIZE
+
0.464
128.695
0.000***
0.448
47.808
0.000***
LOSS
+
0.169
13.074
0.000***
0.129
3.972
0.000***
EQUITY_MULTIPLIER
+
0.001
0.883
0.189
0.001
0.965
0.168
QUICK
-
-0.026
-13.367
0.000***
-0.024
-4.528
0.000***
OPSEG
+
0.011
9.126
0.000***
0.031
4.151
0.000***
GEOSEG
+
0.008
11.106
0.000***
0.026
5.375
0.000***
lnPOPULATION
+
0.045
7.636
0.000***
0.047
3.132
0.001***
FIRM_TENURE
+
0.060
3.409
0.000***
-0.024
-0.550
0.583
NATIONAL_LEADER
+
-0.017
-1.710
0.087*
-0.003
-0.103
0.918
CITY_LEADER
+
0.030
2.847
0.002***
0.034
1.280
0.101
NONAUDIT
+
0.017
12.525
0.000***
0.017
4.886
0.000***
Regression of Audit Quality on Auditor Experience at the Audit Office Department (H2a)
FEM_AU
?
0.623
7.201
0.000***
0.499
2.295
0.022**
INITIAL
-
0.103
4.821
0.000***
0.088
1.394
0.164
FOREIGN
+
0.050
7.948
0.000***
0.016
1.260
0.104
MERGER
+
0.052
4.939
0.000***
0.061
2.340
0.001***
DCFO
+
0.114
6.602
0.000***
0.115
2.508
0.006***
GROWTH
+
0.014
2.009
0.023**
0.020
0.933
0.176
Year and Industry fixed effects
Yes
Yes
Total Number of Observations
11,301
1,565
Model p-value
0.000***
0.000***
R2
77.1%
78.9%
Expected Sign
Estimate
Estimate

Regression of Audit Quality on Auditor Experience at the Audit Office Department (H2a)

157
The significant positive relationships between ICW and AU_FEES, MERGER, and LOSS
are expected, as is the significant negative relationship between ICW and SIZE. When
evaluating the results using only 2017-2018 control variable years, the significant
relationship between ICW and PART_EXP_DEPT_AVG remains, while none of the
control variable results are unexpected.
Panel C of Table 14 presents the results from the logistic regression of GCM on
the test and control variables for Hypothesis 2a. The results show a significant negative
relationship between GCM and SMGR_MGR_EXP_DEPT_AVG (p = 0.030). At first
glance this result is unexpected. However, the decision of whether or not to modify an
audit opinion for a going concern risk is often based on complex calculations performed
during the manager review stage, and pressures caused by deadlines and workload
compressions could have a greater effect on manager audit quality than simply years of
experience. The significant negative relationships between GCM and SIZE, QUICK,
GEOSEG, NATIONAL_LEADER, LnPOPULATION, and BANKRUPTCY are expected,
as is the significant positive relationship between GCM and AU_FEES. Of note is the
significant positive relationship between GCM and FEM_AU (p = 0.071), indicating that
offices with greater proportions of female auditors may be more likely to report going
concern opinion modifications than offices with greater proportions of male auditors.
When evaluating the results using only 2017-2018 control variable years, none of the test
variables are significant, while none of the control variable results are unexpected.
Panel D of Table 14 presents the results from the OLS regression of AU_FEES on
the test and control variables for Hypotheses 2a. The results show a significant negative

158
relationship between AU_FEES and PART_EXP_DEPT_AVG (p < 0.01), and a
significant positive relationship between AU_FEES and SMGR_MGR_EXP_DEPT_AVG
(p < 0.01). These mixed results are unexpected and, similar to Panel D3 of Table 13,
could indicate that senior managers and managers are more involved in the audit
processes and that the Big 4 bill excess fees for their expertise, or alternatively that
disproportionately staffed offices are inefficient. The findings indicate significant
positive relationships between AU_FEES and RESTATE, ICW, SIZE, LOSS, OP_SEG,
GEO_SEG, LnPOPULATION, FIRM_TENURE, CITY_LEADER (when controlling for
NATIONAL_LEADER), NONAUDIT, INITIAL, FOREIGN, MERGER, DCFO, and
GROWTH, and a significant negative relationship between AU_FEES and QUICK. The
findings again report a significant negative relationship between AU_FEES and
AUDIT_CLIENTS (p < 0.01) at all staffing levels, similar to previously reported results,
as well as the presence of a significant female audit fee premium when evaluating the
positive relationship between AU_FEES and FEM_AU (p < 0.01). When evaluating the
results using only 2017-2018 control variable years, the findings continue to show a
significant positive relationship between AU_FEES and SMGR_MGR_EXP_DEPT_AVG,
while also showing a significant negative relationship with
SEN_ASSOC_EXP_DEPT_AVG, which is unexpected but could indicate that experience
is not as valuable at the senior associate and associate levels, or perhaps that more
experienced senior associates and associates are being shared within the office or among
other offices in order to create engagement efficiencies. Additionally, none of the control
variable results are unexpected.

159
Auditor Experience at the Audit Firm and Audit Quality (H2a)
Table 15 provides the regression results of the relationship between audit
personnel experience at the firm level and audit quality for Hypotheses 2a. Panel A of
Table 15 presents the results from the logistic regression of RESTATE on the test and
control variables. Similar to Panel A of Table 14, the results continue to indicate a
significant negative association between RESTATE and SMGR_MGR_EXP_FIRM_AVG
(p = 0.039). Unlike Panel A of Table 14, however, the results show a significant positive
association between RESTATE and PRIN_EXP_FIRM_AVG (p = 0.069), which is
unexpected and therefore warrants future research. It is possible that principals in the
national office or in expert offices are utilized on audit engagements that require
restatements, or that, as previously mentioned, disproportionately staffed offices lead to
poor quality because of inefficiencies and workload volume. The results continue to
indicate a significant negative association between RESTATE and FEM_AU. The results
also indicate significant positive relationships between RESTATE and ICW, AU_FEES,
FIRM_TENURE, and EQUITY_MULTIPLIER and significant negative relationships
between RESTATE and AUDIT_CLIENTS, SIZE, QUICK, and NATIONAL_LEADER, all
of which are expected. When evaluating the results using only 2017-2018 control
variable years, none of the test variables are significant, while none of the control
variable results are unexpected.

160
Panel B of Table 15 presents the results from the logistic regression of ICW on the
test and control variables for Hypothesis 2a. As expected, the results indicate a
significant positive relationship between ICW and PART_EXP_FIRM_AVG (p = 0.046).
However, similar to Panel A of Table 15, the significant negative relationship between
ICW and PRIN_EXP_FIRM_AVG (p = 0.060) is unexpected and warrants future research.
The significant positive relationships between ICW and AU_FEES, MERGER, and LOSS
are expected, as are the significant negative relationships between ICW and SIZE,
QUICK, and INITIAL. When evaluating the results using only 2017-2018 control
variable years, the significant negative relationship between ICW and
PART_EXP_DEPT_AVG remains, while none of the control variable results are
unexpected.
Panel C of Table 15 presents the results from the logistic regression of GCM on
the test and control variables for Hypothesis 2a. The results show an unexpected
significant negative relationship between GCM and SMGR_MGR_EXP_FIRM_AVG (p =
0.041), similar to Panel C of Table 14. The significant negative relationships between
GCM and BANKRUPTCY, GCM, SIZE, QUICK, GEOSEG, LnPOPULATION, and
NATIONAL_LEADER are all expected, as is the significant positive relationship between
GCM and AU_FEES. When evaluating the results using only 2017-2018 control variable
years, the test variables are not significant, while none of the control variable results are
unexpected.
Panel D of Table 15 presents the results from the OLS regression of AU_FEES on
the test and control variables for Hypotheses 2a.2. The results show a significant

161
negative relationship between AU_FEES and PART_EXP_FIRM_AVG (p < 0.01), and
significant positive relationships between AU_FEES and PRIN_EXP_FIRM_AVG (p =
0.002), SMGR_MGR_EXP_FIRM_AVG (p < 0.01), and SEN_ASSOC_EXP_FIRM_AVG
(p = 0.002).
TABLE 15 - Regression of Audit Quality on Auditor Experience at the Audit Office Firm (H2a)
Panel A: Using RESTATE as the Dependent Variable Control Variable Years: 2011-2018 Control Variable Years: 2017-2018
Variable p-value Wald
Intercept
?
-2.311
4.024
0.045**
-22.298
0.000
0.999
PART_EXP_FIRM_AVG
-
-0.005
0.472
0.246
-0.019
0.720
0.198
PRIN_EXP_FIRM_AVG
-
0.010
3.304
0.069*
-0.005
0.081
0.388
SMGR_MGR_EXP_FIRM_AVG
-
-0.010
3.112
0.039**
-0.021
0.966
0.163
SEN_ASSOC_EXP_FIRM_AVG
-
-0.007
0.007
0.468
-0.091
0.133
0.358
AUDIT_CLIENTS
-
-0.349
4.753
0.015**
-0.117
0.076
0.392
ICW
+
1.413
107.916
0.000***
2.169
30.950
0.000***
AU_FEES
+
0.332
23.729
0.000***
0.297
1.917
0.083*
SIZE
-
-0.170
17.798
0.000***
-0.215
2.843
0.046**
LOSS
+
0.006
0.004
0.474
0.485
3.089
0.079*
EQUITY_MULTIPLIER
+
0.007
3.974
0.023**
0.005
0.160
0.345
QUICK
-
-0.023
2.165
0.071*
-0.045
0.629
0.214
OPSEG
+
0.006
0.501
0.240
0.027
0.197
0.329
GEOSEG
+
0.001
0.023
0.441
0.002
0.003
0.478
Expected Sign
Estimate
Wald
Estimate
p
-
value

(H2a)
LnPOPULATION
-
0.001
0.000
0.987
0.169
1.721
0.190
FIRM_TENURE
+
0.237
3.877
0.025**
0.156
0.175
0.338
NATIONAL_LEADER
-
-0.156
4.493
0.017**
-0.135
0.375
0.270
CITY_LEADER
-
-0.002
0.000
0.492
0.183
0.635
0.426
NONAUDIT
+
0.009
0.729
0.197
0.034
1.037
0.154
FEM_AU
?
-1.275
4.218
0.040**
-1.441
0.579
0.447
INITIAL
+
0.003
0.000
0.493
0.705
2.082
0.075*
MERGER
+
-0.009
0.016
0.900
0.086
0.153
0.348
CHANGE_IN_RECEIVABLES
+
-0.001
0.126
0.723
-0.025
0.028
0.868
CHANGE_IN_INVENTORIES
+
-0.005
0.028
0.867
-0.006
0.011
0.917
CHANGE_IN_CASH_SALES
+
-0.002
1.000
0.317
-0.070
1.727
0.189
Year and Industry fixed effects
Yes
Yes
Number of Restatements
1,025
122
Total Number of Observations
11,301
1,524
Model p-value
0.000***
0.000***
Pseudo R2
5.7%
19.3%
Regression of Audit Quality on Auditor Experience at the Audit Office Firm
(H2a)
Panel B: Using ICW as the Dependent Variable Control Variable Years: 2011-2018 Control Variable Years: 2017-2018
Variable Wald
Intercept
?
-25.601
0.000
0.998
-19.728
0.000
0.999
PART_EXP_FIRM_AVG
+
0.021
2.849
0.046**
0.053
2.511
0.057*
PRIN_EXP_FIRM_AVG
+
-0.023
3.533
0.060*
-0.036
1.243
0.265
SMGR_MGR_EXP_FIRM_AVG
+
-0.013
1.632
0.201
-0.025
1.172
0.279
SEN_ASSOC_EXP_FIRM_AVG
+
-0.023
0.027
0.871
-0.412
0.999
0.317
AUDIT_CLIENTS
+
0.135
0.429
0.257
-1.18
1.427
0.232
AU_FEES
+
1.452
143.866
0.000***
1.381
13.466
0.000***
SIZE
-
-0.802
126.798
0.000***
-0.849
15.159
0.000***
LOSS
+
0.192
1.821
0.089*
0.14
0.134
0.357
EQUITY_MULTIPLIER
+
0.006
0.924
0.168
-0.01
0.392
0.531
QUICK
-
-0.045
1.747
0.093*
-0.206
1.889
0.085*
OPSEG
+
-0.012
0.509
0.475
-0.015
0.011
0.915
GEOSEG
+
0.001
0.017
0.449
-0.032
0.190
0.663
LnPOPULATION
-
0.010
0.019
0.890
-0.25
1.427
0.116
FIRM_TENURE
-
0.241
1.415
0.234
0.616
1.405
0.236
NATIONAL_LEADER
+
-0.112
0.738
0.390
-0.007
0.000
0.984
Expected Sign
Estimate
Wald
p
-
value
Estimate
p
-
value
(H2a)
CITY_LEADER
+
-0.153
1.254
0.263
0.09
0.061
0.403
NONAUDIT
+
0.005
0.075
0.393
0.001
0.001
0.491
FEM_AU
?
1.673
2.238
0.135
3.899
1.425
0.233
INITIAL
-
-0.340
1.784
0.091*
0.131
0.037
0.848
MERGER
+
0.271
4.477
0.017**
0.57
2.670
0.051*
Year and Industry fixed effects
Yes
Yes
Number of Control Weaknesses
308
45
Total Number of Observations
11,301
1,565
Model p-value
0.000***
0.072*
Pseudo R2
13.5%
25.0%
Regression of Audit Quality on Auditor Experience at the Audit Office Firm
Panel C: Using GCM as the Dependent Variable Control Variable Years: 2011-2018 Control Variable Years: 2017-2018
Variable Wald p-value Wald
Intercept
?
10.341
14.044
0.000***
9.629
0.000
1.000
Expected Sign
Estimate
Estimate
p
-
value

(H2a)
PART_EXP_FIRM_AVG
+
-0.001
0.005
0.945
-0.099
1.036
0.309
PRIN_EXP_FIRM_AVG
+
-0.004
0.042
0.837
0.031
0.318
0.287
SMGR_MGR_EXP_FIRM_AVG
+
-0.042
4.187
0.041**
-0.278
0.955
0.328
SEN_ASSOC_EXP_FIRM_AVG
+
0.235
1.309
0.127
0.631
0.669
0.207
AUDIT_CLIENTS
-
-0.411
1.298
0.127
1.573
1.359
0.244
ICW
+
0.061
0.017
0.448
-16.056
0.000
0.998
AU_FEES
+
0.186
1.865
0.086*
0.154
0.054
0.409
SIZE
-
-0.481
26.016
0.000***
-0.770
3.088
0.040**
LOSS
+
0.429
0.671
0.207
19.268
0.000
0.499
EQUITY_MULTIPLIER
+
-0.004
0.191
0.662
-0.019
0.083
0.773
QUICK
-
-0.165
18.864
0.000***
-0.084
0.654
0.210
OPSEG
-
0.011
0.082
0.774
-0.188
0.255
0.307
GEOSEG
-
-0.055
6.086
0.007***
0.149
1.336
0.248
LnPOPULATION
-
-0.204
3.232
0.036**
-1.016
4.932
0.013**
FIRM_TENURE
-
0.336
2.084
0.149
1.012
1.545
0.214
NATIONAL_LEADER
+
-0.323
2.919
0.088*
-0.801
1.330
0.249
CITY_LEADER
+
0.132
0.487
0.243
0.125
0.030
0.431

(H2a)
NONAUDIT
+
0.001
0.003
0.480
-0.036
0.376
0.540
FEM_AU
?
2.200
2.361
0.124
-1.993
0.160
0.689
INITIAL
-
-0.220
0.726
0.197
-0.903
0.640
0.212
MERGER
-
-0.414
2.446
0.059*
-0.833
0.619
0.216
REPORTLAG
+
0.002
1.493
0.111
0.051
3.305
0.035**
BANKRUPTCY
-
-0.067
32.470
0.000***
-0.084
3.915
0.024**
Year and Industry fixed effects
Yes
Yes
Number of Going Concern Modifications
235
19
Total Number of Observations
3,705
481
Model p-value
0.000***
0.000***
Pseudo R2
40.4%
59.9%
Regression of Audit Quality on Auditor Experience at the Audit Office Firm
Panel D: Using AU_FEES as the Dependent Variable
Control Variable Years: 2011-2018
Control Variable Years: 2017-2018
Variable
t-value
p-value
t-value
p-value
Intercept
?
3.454
28.853
0.000***
3.962
13.003
0.000***

(H2a)
PART_EXP_FIRM_AVG
+
-0.004
-3.935
0.000***
-0.005
-2.047
0.041**
PRIN_EXP_FIRM_AVG
+
0.002
2.892
0.002***
0.001
0.645
0.260
SMGR_MGR_EXP_FIRM_AVG
+
0.003
3.692
0.000***
0.004
2.520
0.006***
SEN_ASSOC_EXP_FIRM_AVG
+
0.033
2.891
0.002***
0.001
0.033
0.487
AUDIT_CLIENTS
+
-0.161
-8.356
0.000***
-0.126
-2.676
0.008***
ICW
+
0.345
11.885
0.000***
0.250
3.458
0.000***
RESTATE
+
0.084
5.141
0.000***
0.076
1.676
0.047**
GCM
+
0.125
3.719
0.000***
0.242
2.817
0.003***
SIZE
+
0.464
129.012
0.000***
0.449
47.941
0.000***
LOSS
+
0.169
13.093
0.000***
0.127
3.908
0.000***
EQUITY_MULTIPLIER
+
0.000
0.825
0.205
0.001
0.867
0.193
QUICK
-
-0.025
-13.192
0.000***
-0.024
-4.535
0.000***
OPSEG
+
0.011
9.268
0.000***
0.032
4.227
0.000***
GEOSEG
+
0.008
11.035
0.000***
0.026
5.336
0.000***
lnPOPULATION
+
0.042
7.170
0.000***
0.044
2.966
0.002***
FIRM_TENURE
+
0.059
3.356
0.000***
-0.025
-0.572
0.567
NATIONAL_LEADER
+
-0.012
-1.208
0.227
0.007
0.264
0.396
(H2a)
CITY_LEADER
+
0.032
2.989
0.002***
0.037
1.363
0.087*
NONAUDIT
+
0.017
12.357
0.000***
0.016
4.783
0.000***
FEM_AU
?
0.597
6.860
0.000***
0.440
2.007
0.045**
INITIAL
-
0.104
4.856
0.000***
0.084
1.325
0.186
FOREIGN
+
0.050
7.904
0.000***
0.017
1.283
0.100*
MERGER
+
0.052
4.982
0.000***
0.058
2.220
0.014**
DCFO
+
0.114
6.615
0.000***
0.123
2.671
0.004***
GROWTH
+
0.014
1.998
0.023**
0.018
0.853
0.197
Year and Industry fixed effects
Yes
Yes
Total Number of Observations
11,301
1,565
Model p-value
0.000***
0.000***
R2
77.1%
78.8%
Expected Sign
Estimate
Estimate

125
These mixed results capture the effects of inter-office firm experience and might indicate
that principals, senior managers/managers, and senior associates/associates are more
involved in the audit processes and that the Big 4 bill excess fees for their expertise at the
firm. The results also continue to suggest that future research regarding staffing
proportions and audit efficiency should be conducted. The findings indicate significant
positive relationships between AU_FEES and RESTATE, ICW, SIZE, LOSS, OP_SEG,
GEO_SEG, LnPOPULATION, FIRM_TENURE, CITY_LEADER (when controlling for
NATIONAL_LEADER), NONAUDIT, INITIAL, FOREIGN, MERGER, DCFO, and
GROWTH, and a significant negative relationship between AU_FEES and QUICK. The
findings again report a significant negative relationship between AU_FEES and
AUDIT_CLIENTS (p < 0.01) at all staffing levels, similar to previously reported results,
as well as the presence of a significant female audit fee premium when evaluating the
positive relationship between AU_FEES and FEM_AU (p < 0.01). When evaluating the
results using only 2017-2018 control variable years, the findings indicate a significant
negative relationship between AU_FEES and PART_EXP_FIRM_AVG (p = 0.041), and a
significant positive relationship between AU_FEES and SMGR_MGR_EXP_FIRM_AVG
(p = 0.012), similar to the results of Panel D of Table 15, while none of the control
variable results are unexpected.

Auditor Experience as a Professional and Audit Quality (H2a)
Table 16 provides the regression results of the relationship between audit personnel
experience as an auditor regardless of firm or office and audit quality for Hypotheses 2a.
Panel A of Table 16 presents the results from the logistic regression of RESTATE on the
126
test and control variables. Similar to Panel A of Table 15, the results indicate a significant
negative association between RESTATE and SMGR_MGR_EXP_TOT_AVG (p
= 0.034), and a significant positive association between RESTATE and
PRIN_EXP_TOT_AVG (p = 0.048). The results continue to indicate a significant
negative association between RESTATE and FEM_AU. The results also indicate
significant positive relationships between RESTATE and ICW, AU_FEES,
TOT_TENURE, and EQUITY_MULTIPLIER and significant negative relationships
between RESTATE and AUDIT_CLIENTS, SIZE, QUICK, and NATIONAL_LEADER, all
of which are expected. When evaluating the results using only 2017-2018 control
variable years, none of the test variables are significant, while none of the control
variable results are unexpected.

Panel B of Table 16 presents the results from the logistic regression of ICW on the
test and control variables for Hypothesis 2a. The results again indicate a significant
positive relationship between ICW and PART_EXP_TOT_AVG (p = 0.073) and a
significant negative relationship between ICW and PRIN_EXP_TOT_AVG (p = 0.087),
results similar to Panel B of Table 15. The significant positive relationships between
ICW and AU_FEES, MERGER, and LOSS are expected, as are the significant negative
relationships between ICW and SIZE, QUICK, and INITIAL. When evaluating the results
using only 2017-2018 control variable years, the significant negative relationship
between ICW and PART_EXP_TOT_AVG remains, while none of the control variable
results are unexpected.
TABLE 16 - Regression of Audit Quality on Auditor Experience as a Professional (H2a)
Panel A: Using RESTATE as the Dependent Variable Control Variable Years: 2011-2018 Control Variable Years: 2017-2018
Variable p-value Wald
Intercept
?
-2.286
3.950
0.047**
-22.343
0.000
0.999
PART_EXP_TOT_AVG
-
-0.008
1.424
0.117
-0.022
0.988
0.160
PRIN_EXP_TOT_AVG
-
0.011
3.919
0.048**
-0.007
0.126
0.362
SMGR_MGR_EXP_TOT_AVG
-
-0.010
3.352
0.034**
-0.020
0.909
0.170
SEN_ASSOC_EXP_TOT_AVG
-
-0.008
0.009
0.463
-0.024
0.010
0.461
AUDIT_CLIENTS
-
-0.341
4.534
0.017**
-0.082
0.037
0.424
ICW
+
1.414
108.096
0.000***
2.172
31.026
0.000***
AU_FEES
+
0.331
23.576
0.000***
0.296
1.907
0.084*
SIZE
-
-0.170
17.756
0.000***
-0.213
2.804
0.047**
LOSS
+
0.006
0.004
0.474
0.484
3.078
0.079*
EQUITY_MULTIPLIER
+
0.007
3.965
0.023**
0.005
0.151
0.349
QUICK
-
-0.023
2.173
0.070*
-0.044
0.608
0.218
OPSEG
+
0.006
0.502
0.240
0.026
0.188
0.332
GEOSEG
+
0.001
0.019
0.446
0.002
0.003
0.478
Expected Sign
Estimate
Wald
Estimate
p
-
value

(H2a)
LnPOPULATION
-
0.002
0.003
0.957
0.165
1.651
0.199
FIRM_TENURE
+
0.238
3.902
0.024**
0.155
0.173
0.339
NATIONAL_LEADER
-
-0.155
4.498
0.017**
-0.130
0.347
0.278
CITY_LEADER
-
-0.001
0.000
0.497
0.184
0.643
0.422
NONAUDIT
+
0.009
0.694
0.203
0.033
0.984
0.161
FEM_AU
?
-1.226
3.872
0.049**
-1.557
0.673
0.412
INITIAL
+
0.003
0.000
0.493
0.701
2.061
0.076*
MERGER
+
-0.010
0.019
0.891
0.085
0.151
0.349
CHANGE_IN_RECEIVABLES
+
-0.001
0.127
0.722
-0.026
0.029
0.865
CHANGE_IN_INVENTORIES
+
-0.005
0.027
0.870
-0.006
0.011
0.918
CHANGE_IN_CASH_SALES
+
-0.002
0.992
0.319
-0.071
1.727
0.189
Year and Industry fixed effects
Yes
Yes
Number of Restatements
1,025
122
Total Number of Observations
11,301
1,524
Model p-value
0.000***
0.000***
Pseudo R2
5.8%
19.3%
Regression of Audit Quality on Auditor Experience as a Professional
(H2a)
Panel B: Using ICW as the Dependent Variable Control Variable Years: 2011-2018 Control Variable Years: 2017-2018
Variable Wald
Intercept
?
-25.635
0.000
0.998
-19.822
0.000
0.999
PART_EXP_TOT_AVG
+
0.018
2.127
0.073*
0.044
1.818
0.089*
PRIN_EXP_TOT_AVG
+
-0.020
2.933
0.087*
-0.039
1.453
0.228
SMGR_MGR_EXP_TOT_AVG
+
-0.013
1.529
0.216
-0.023
0.980
0.322
SEN_ASSOC_EXP_TOT_AVG
+
0.030
0.046
0.415
-0.299
0.531
0.466
AUDIT_CLIENTS
+
0.126
0.379
0.269
-1.186
1.450
0.228
AU_FEES
+
1.449
143.099
0.000***
1.368
13.297
0.000***
SIZE
-
-0.802
126.710
0.000***
-0.846
15.105
0.000***
LOSS
+
0.191
1.807
0.090*
0.132
0.119
0.365
EQUITY_MULTIPLIER
+
0.006
0.901
0.172
-0.01
0.398
0.528
QUICK
-
-0.044
1.729
0.094*
-0.205
1.890
0.085*
OPSEG
+
-0.011
0.436
0.509
-0.014
0.010
0.920
GEOSEG
+
0.001
0.013
0.455
-0.032
0.189
0.664
LnPOPULATION
-
0.010
0.021
0.886
-0.239
1.310
0.126
FIRM_TENURE
-
0.241
1.413
0.235
0.609
1.371
0.242
NATIONAL_LEADER
+
-0.108
0.686
0.407
0.01
0.001
0.489
Expected Sign
Estimate
Wald
p
-
value
Estimate
p
-
value
(H2a)
CITY_LEADER
+
-0.150
1.203
0.273
0.088
0.058
0.405
NONAUDIT
+
0.005
0.086
0.385
0.003
0.003
0.478
FEM_AU
?
1.532
1.892
0.169
3.606
1.233
0.267
INITIAL
-
-0.337
1.758
0.093*
0.145
0.045
0.832
MERGER
+
0.271
4.479
0.017**
0.556
2.562
0.055*
Year and Industry fixed effects
Yes
Yes
Number of Control Weaknesses
308
45
Total Number of Observations
11,301
1,565
Model p-value
0.000***
0.081*
Pseudo R2
13.5%
24.8%
Regression of Audit Quality on Auditor Experience as a Professional
Panel C: Using GCM as the Dependent Variable Control Variable Years: 2011-2018 Control Variable Years: 2017-2018
Variable Wald p-value Wald
Intercept
?
10.350
13.987
0.000***
10.207
0.000
1.000
Expected Sign
Estimate
Estimate
p
-
value

(H2a)
PART_EXP_TOT_AVG
+
0.007
0.138
0.355
-0.104
1.252
0.263
PRIN_EXP_TOT_AVG
+
-0.005
0.078
0.781
0.025
0.220
0.320
SMGR_MGR_EXP_TOT_AVG
+
-0.043
4.187
0.041**
-0.316
1.302
0.254
SEN_ASSOC_EXP_TOT_AVG
+
0.160
0.632
0.214
0.576
0.579
0.224
AUDIT_CLIENTS
-
-0.418
1.288
0.128
1.664
1.489
0.222
ICW
+
0.071
0.024
0.439
-16.124
0.000
0.998
AU_FEES
+
0.185
1.860
0.087*
0.217
0.107
0.372
SIZE
-
-0.476
25.588
0.000***
-0.798
3.267
0.036**
LOSS
+
0.406
0.604
0.219
19.101
0.000
0.499
EQUITY_MULTIPLIER
+
-0.004
0.186
0.666
-0.019
0.084
0.772
QUICK
-
-0.165
18.902
0.000***
-0.078
0.567
0.226
OPSEG
-
0.012
0.103
0.748
-0.147
0.161
0.344
GEOSEG
-
-0.056
6.245
0.006***
0.166
1.645
0.200
LnPOPULATION
-
-0.205
3.240
0.036**
-1.038
5.019
0.013**
FIRM_TENURE
-
0.333
2.044
0.153
0.989
1.464
0.226
NATIONAL_LEADER
+
-0.321
2.876
0.090*
-0.744
1.131
0.287
CITY_LEADER
+
0.124
0.425
0.257
0.099
0.019
0.446

(H2a)
NONAUDIT
+
0.001
0.002
0.481
-0.033
0.307
0.579
FEM_AU
?
2.282
2.492
0.114
-1.797
0.126
0.722
INITIAL
-
-0.216
0.698
0.202
-0.873
0.609
0.218
MERGER
-
-0.413
2.435
0.060*
-0.923
0.736
0.196
REPORTLAG
+
0.002
1.474
0.113
0.051
3.251
0.036**
BANKRUPTCY
-
-0.067
32.900
0.000***
-0.085
3.982
0.023**
Year and Industry fixed effects
Yes
Yes
Number of Going Concern Modifications
235
19
Total Number of Observations
3,705
481
Model p-value
0.000***
0.000***
Pseudo R2
40.4%
60.1%
Regression of Audit Quality on Auditor Experience as a Professional
Panel D: Using AU_FEES as the Dependent Variable
Control Variable Years: 2011-2018
Control Variable Years: 2017-2018
Variable
t-value
p-value
t-value
p-value
Intercept
?
3.453
28.912
0.000***
3.960
13.022
0.000***

(H2a)
PART_EXP_TOT_AVG
+
-0.004
-4.137
0.000***
-0.005
-1.889
0.059*
PRIN_EXP_TOT_AVG
+
0.002
2.749
0.003***
0.001
0.473
0.319
SMGR_MGR_EXP_TOT_AVG
+
0.003
3.635
0.000***
0.004
2.531
0.006***
SEN_ASSOC_EXP_TOT_AVG
+
0.041
3.667
0.000***
0.006
0.207
0.418
AUDIT_CLIENTS
+
-0.156
-8.109
0.000***
-0.122
-2.577
0.010***
ICW
+
0.345
11.863
0.000***
0.249
3.446
0.000***
RESTATE
+
0.084
5.119
0.000***
0.075
1.669
0.048**
GCM
+
0.126
3.746
0.000***
0.242
2.818
0.003***
SIZE
+
0.464
129.107
0.000***
0.449
47.950
0.000***
LOSS
+
0.169
13.078
0.000***
0.126
3.880
0.000***
EQUITY_MULTIPLIER
+
0.000
0.813
0.208
0.001
0.860
0.195
QUICK
-
-0.025
-13.151
0.000***
-0.024
-4.527
0.000***
OPSEG
+
0.011
9.241
0.000***
0.032
4.203
0.000***
GEOSEG
+
0.008
11.040
0.000***
0.026
5.349
0.000***
lnPOPULATION
+
0.041
6.930
0.000***
0.044
2.902
0.002***
FIRM_TENURE
+
0.059
3.360
0.000***
-0.025
-0.583
0.560
NATIONAL_LEADER
+
-0.012
-1.140
0.254
0.008
0.296
0.384
(H2a)
CITY_LEADER
+
0.033
3.098
0.001***
0.037
1.387
0.083*
NONAUDIT
+
0.017
12.275
0.000***
0.016
4.773
0.000***
FEM_AU
?
0.592
6.761
0.000***
0.431
1.958
0.050**
INITIAL
-
0.103
4.838
0.000***
0.084
1.317
0.188
FOREIGN
+
0.049
7.878
0.000***
0.016
1.271
0.102
MERGER
+
0.052
4.949
0.000***
0.058
2.224
0.013**
DCFO
+
0.114
6.597
0.000***
0.124
2.693
0.004***
GROWTH
+
0.014
1.984
0.024**
0.018
0.827
0.204
Year and Industry fixed effects
Yes
Yes
Total Number of Observations
11,301
1,565
Model p-value
0.000***
0.000***
R2
77.1%
78.8%
Expected Sign
Estimate
Estimate

181
Panel C of Table 16 presents the results from the logistic regression of GCM on
the test and control variables for Hypothesis 2a. The results show a significant negative
relationship between GCM and SMGR_MGR_EXP_TOT_AVG (p = 0.041), a result
similar to Panel C of Table 15. The significant negative relationships between GCM and
BANKRUPTCY, GCM, SIZE, QUICK, GEOSEG, LnPOPULATION, and
NATIONAL_LEADER are all expected, as is the significant positive relationship between
GCM and AU_FEES. When evaluating the results using only 2017-2018 control variable
years, the test variables are not significant, while none of the control variable results are
unexpected.
Panel D of Table 16 presents the results from the OLS regression of AU_FEES on
the test and control variables for Hypotheses 2a. The results show a significant negative
relationship between AU_FEES and PART_EXP_TOT_AVG (p < 0.01), and significant
positive relationships between AU_FEES and PRIN_EXP_TOT_AVG (p = 0.003),
SMGR_MGR_EXP_TOT_AVG (p < 0.01), and SEN_ASSOC_EXP_TOT_AVG (p < 0.01),
all of which are similar to Panel D of Table 15. The findings indicate significant positive
relationships between AU_FEES and RESTATE, ICW, SIZE, LOSS, OP_SEG,
GEO_SEG, LnPOPULATION, FIRM_TENURE, CITY_LEADER (when controlling for
NATIONAL_LEADER), NONAUDIT, INITIAL, FOREIGN, MERGER, DCFO, and
GROWTH, and a significant negative relationship between AU_FEES and QUICK. The
findings again report a significant negative relationship between AU_FEES and
AUDIT_CLIENTS (p < 0.01) at all staffing levels, similar to previously reported results,
as well as the presence of a significant female audit fee premium when evaluating the

182
positive relationship between AU_FEES and FEM_AU (p < 0.01). When evaluating the
results using only 2017-2018 control variable years, the findings indicate a significant
negative relationship between AU_FEES and PART_EXP_TOT_AVG (p = 0.041), and a
significant positive relationship between AU_FEES and SMGR_MGR_EXP_TOT_AVG
(p = 0.012), similar to the results of Panel D of Table 15, while none of the control
variable results are unexpected.
Results Summary for Audit Personnel Experience at the Office, Firm, and Professional
Level and Audit Quality (H2a)
The test results for H2a suggest that when offices possess auditors with greater
experience, their audit engagements have fewer subsequent financial restatements. This
tends to be the most significant at the manager staffing level, which partially aligns with
H2a. It might be that managers, as the primary reviewers, with more experience are more
likely to catch mistakes that could result in a subsequent restatement. Second, when
offices possess auditors with greater experience, their audit engagements report more
material internal control weaknesses. This result tends to be significant at the partner
level, which aligns with H2a. It is possible that more experienced partners, who are often
involved in auditor-client negotiations, are less likely to be swayed in their judgment
regarding the inclusion or exclusion of a reported material internal control weakness. Of
note is that more experienced audit principals tend to have more future financial
restatements and fewer instances of material internal control weaknesses, which could be
an indicator of poor audit quality, although it might be that some offices have greater

183
amount of audit principals that act in administrative roles or as experts on an “as needed”
basis, such as an IT network auditor, audit innovation specialist, or audit data analytic
specialist, and do not focus as much on internal control assessment. Third, more
experienced managers seem to report fewer going concern opinion modifications, which
does not align with H2a. It could be that more experienced auditors tend to work on
clients with various attributes that reduce their exposure to going concern issues, but
these attributes cannot be captured because they are publicly unobservable. Additionally,
female auditors with more department experience tend to report more going concern
opinion modifications, although this effect becomes insignificant for auditors who have
worked at multiple offices or other audit firms (see Panel C of Tables 15 and 16),
indicating that certain traits or characteristics related to gender that might increase audit
quality seem to lose effect as auditors, both male and female, gain experiential
knowledge and client familiarity. Finally, audit fees are not positively correlated with all
staffing levels. This result does not align with H2a; however, because of the descending
slope shape of the audit department staffing proportion (less partners to more associates),
it is possible that offices are billing based on the same staffing proportion (less from
partners to more from associates), more experienced auditors command higher fees, and
audit departments are not absorbing any excess client fees that might result from using
more experienced auditors.
Supplemental Analysis for Audit Personnel Experience at the Office, Firm, and
Professional Level and Audit Quality (H2a)

184
In supplemental analysis of H2a testing, the dependent variable RESTATE is again
modified in three ways. First, RESTATE is replaced with RESTATE_NO_ICW. The
models for this test (untabulated) are not significant, due to the limited sample size.
Second, RESTATE was replaced by RESTATE_CE. The models for this test
(untabulated) are significant when considering auditor experience at the department, at
the firm, and overall as an auditor. However, the only significant test variable is
PRIN_EXP_DEPT_AVG (p = 0.046), indicating that to some extent, future financial
restatements are less likely to occur when affecting core earnings, as expected. Finally,
RESTATE is replaced by SEC_REG_FAR, to test for restatements that occurred at an
auditor office in the same city as one of the eleven SEC regional offices. The models for
this test (untabulated) are significant for the audit department, the firm, and in total as an
auditor. SEC_REG_FAR has an expected significant negative relationship with
SEN_ASSOC_EXP_DEPT_AVG, PRIN_EXP_FIRM_AVG, and PRIN_EXP_TOT_AVG.
However, SEC_REG_FAR has an unexpected significant positive relationship with
SMGR_MGR_EXP_TOT_AVG. This result is counter to the results from Panel A of
Tables 14-16, which show a negative correlation between future financial restatements
and senior manager/manager experience. It could be that the most experienced senior
managers/managers are placed at offices with riskier clients, or it might be that audit
departments that are disproportionately staffed cause pressures at varying staffing levels.
Audit Personnel Experience for Long-Tenured Partners and Audit Quality (H2b)

185
Table 17 provides the regression results of the relationship between audit
personnel experience and audit quality for Hypotheses 2b. Panel A of Table 17 presents
the results from the logistic regression of RESTATE on the test and control variables. The
results show a significant positive relationship between RESTATE and
SM_OFFICE_CLIENTS as expected, but no significant relationships with the other test
variables, indicating that restatements tend to occur at offices with fewer audit clients
regardless of partner tenure effects. This result might occur when offices with fewer
clients also have fewer and/or less experienced auditors overall, and are unable to share
peer experiential effects, all of which could lead to poor audit quality. This result aligns
with the findings of the PCAOB, which is concerned that audit quality is not consistent
among offices within the same firm, even when the firms provide high quality consistent
training for their auditors. The results do indicate significant positive relationships
between RESTATE and ICW, AU_FEES, FIRM_TENURE, EQUITY_MULTIPLIER,
significant negative relationships between RESTATE and SIZE, QUICK, and
NATIONAL_LEADER, all of which are expected based on the prior literature. The results
also show a significant negative relationship between RESTATE and FEM_AU. When
evaluating the results using only 2017-2018 control variable years, the test variables are
not significant, and none of the control variable results are unexpected.
Panel B of Table 17 presents the results from the logistic regression of ICW on the
test and control variables for Hypothesis 2b. The results show significant positive
relationships between ICW and PART_TENURE_LONG (p < 0.01) and

186
SM_OFFICE_CLIENTS (p < 0.01), and a significant negative relationship between
PART_TENURE_LONG x SM_OFFICE_CLIENTS (p < 0.01), indicating that generally,
long-tenured partners are more likely to report material internal control weaknesses and
generally, smaller offices are more likely to have clients with material internal control
weaknesses; however, when considering the negative coefficient of the interaction
between long-tenured partners and smaller offices, the tendency of long-tenured partners
to report material internal control weaknesses appears less likely among smaller offices.
The significant positive relationship between ICW and AU_FEES is expected, as is the
significant positive relationship between ICW and MERGER. The significant negative
relationships between ICW and SIZE, QUICK, and INITIAL are also expected. The
findings also indicate a significant positive relationship between FEM_AU and ICW.
When evaluating the results using only 2017-2018 control variable years, the model is
not significant.
Panel C of Table 17 presents the results from the logistic regression of GCM on
the test and control variables for Hypothesis 2b. The results show a significant positive
relationship between GCM and SM_OFFICE_CLIENTS (p = 0.009), but no significant
relationships with the other test variables, indicating that going concern opinion
modifications often occur at smaller offices, and long-tenure of audit partners does not
have an effect. This result might occur because smaller offices tend to have larger
proportions of smaller, riskier clients with a higher likelihood of failure. The significant
positive relationships between GCM and AU_FEES and FIRM_TENURE are expected, as

187
are the significant negative relationships between GCM and SIZE, BANKRUPTCY,
QUICK, LnPOPULATION, GEOSEG, NATIONAL_LEADER, and MERGER. When
evaluating the results using only 2017-2018 control variable years, the test variable
results are not significant, and none of the control variable results are unexpected.

TABLE 17 - Regression of Audit Quality on Audit Personnel Experience for Long-Tenured Partners (H2b)
Panel A: Using RESTATE as the Dependent Variable
Control Variable Years: 2011-2018
Control Variable Years: 2017-2018
Variable
Wald
p-value
Wald
Intercept
?
-2.800
5.954
0.015**
-23.010
0.000
0.999
PART_TENURE_LONG
+
-0.015
0.036
0.849
-0.062
0.071
0.789
SM_OFFICE_CLIENTS
+
0.291
6.918
0.005***
0.041
0.012
0.456
PART_TENURE_LONG x SM_OFFICE_CLIENTS
+
-0.271
2.300
0.129
0.046
0.007
0.468
ICW
+
1.394
104.663
0.000***
2.162
31.202
0.000***
AU_FEES
+
0.354
27.185
0.000***
0.293
1.870
0.086*
SIZE
-
-0.174
18.767
0.000***
-0.207
2.668
0.051*
LOSS
+
0.009
0.012
0.457
-0.488
3.147
0.076*
EQUITY_MULTIPLIER
+
0.007
3.521
0.031**
0.004
0.131
0.359
QUICK
-
-0.022
1.937
0.082*
-0.048
0.721
0.198
OPSEG
+
0.004
0.210
0.324
0.026
0.193
0.330
GEOSEG
+
0.001
0.021
0.443
0.006
0.024
0.439
LnPOPULATION
-
0.017
0.173
0.678
0.175
1.941
0.164
Regression of Audit Quality on Audit Personnel Experience for Long-Tenured Partners (H2b)
FIRM_TENURE
+
0.227
3.550
0.030**
0.126
0.116
0.367
NATIONAL_LEADER
-
-0.142
3.789
0.026**
-0.096
0.188
0.332
CITY_LEADER
-
0.001
0.000
0.986
0.189
0.671
0.413
NONAUDIT
+
0.008
0.580
0.223
0.031
0.846
0.179
FEM_AU
?
-1.503
6.671
0.010***
-1.958
1.072
0.300
INITIAL
+
-0.014
0.010
0.922
0.723
2.209
0.069*
MERGER
+
-0.018
0.062
0.803
0.090
0.170
0.340
CHANGE_IN_RECEIVABLES
+
-0.001
0.118
0.731
-0.021
0.020
0.888
CHANGE_IN_INVENTORIES
+
-0.005
0.027
0.870
-0.006
0.011
0.918
CHANGE_IN_CASH_SALES
+
-0.002
1.035
0.309
-0.072
1.779
0.182
Year and Industry fixed effects
Yes
Yes
Number of Restatements
1,025
122
Total Number of Observations
11,301
1,524
Model p-value
0.000***
0.000***
Pseudo R2
5.7%
18.9%
Expected Sign
Estimate
Estimate
p
-
value
Regression of Audit Quality on Audit Personnel Experience for Long-Tenured Partners (H2b)
Panel B: Using ICW as the Dependent Variable Control Variable Years: 2011-2018 Control Variable Years: 2017-2018
Variable Wald Wald
Intercept
?
-26.238
0.000
0.998
-19.902
0.000
0.999
PART_TENURE_LONG
-
0.607
19.010
0.000***
0.348
0.932
0.334
SM_OFFICE_CLIENTS
-
0.748
13.673
0.000***
-0.234
0.141
0.354
PART_TENURE_LONG x SM_OFFICE_CLIENTS
-
-1.057
10.930
0.000***
0.355
0.171
0.679
AU_FEES
+
1.440
142.108
0.000***
1.34
12.969
0.000***
SIZE
-
-0.799
124.706
0.000***
-0.83
14.582
0.000***
LOSS
+
0.171
1.438
0.116
0.05
0.017
0.448
EQUITY_MULTIPLIER
+
0.006
0.837
0.180
-0.009
0.340
0.560
QUICK
-
-0.045
1.778
0.091*
-0.224
2.150
0.072*
OPSEG
+
-0.010
0.359
0.549
-0.006
0.002
0.966
GEOSEG
+
0.000
0.000
0.494
-0.034
0.220
0.639
LnPOPULATION
-
0.045
0.408
0.523
-0.232
1.289
0.128
FIRM_TENURE
-
0.222
1.227
0.268
0.591
1.307
0.253
NATIONAL_LEADER
+
-0.113
0.751
0.386
0.109
0.102
0.375
Expected Sign
Estimate
p
-
value
Estimate
p
-
value
Regression of Audit Quality on Audit Personnel Experience for Long-Tenured Partners (H2b)
CITY_LEADER
+
-0.139
1.034
0.309
0.173
0.226
0.317
NONAUDIT
+
0.006
0.126
0.362
-0.007
0.019
0.889
FEM_AU
?
1.686
2.924
0.087*
1.949
0.395
0.530
INITIAL
-
-0.343
1.842
0.088*
0.123
0.033
0.857
MERGER
+
0.278
4.709
0.015**
0.509
2.184
0.070*
Year and Industry fixed effects
Yes
Yes
Number of Control Weaknesses
308
45
Total Number of Observations
11,301
1,565
Model p-value
0.000***
0.125
Pseudo R2
14.1%
23.3%
Panel C: Using GCM as the Dependent Variable Control Variable Years: 2011-2018 Control Variable Years: 2017-2018
Variable Wald p-value Wald
Intercept
?
9.411
11.735
0.001***
5.377
0.000
1.000
Expected Sign
Estimate
Estimate
p
-
value

Regression of Audit Quality on Audit Personnel Experience for Long-Tenured Partners (H2b)
PART_TENURE_LONG
-
0.137
0.553
0.457
-0.074
0.016
0.226
SM_OFFICE_CLIENTS
-
0.774
6.819
0.009***
0.204
0.034
0.854
PART_TENURE_LONG x SM_OFFICE_CLIENTS
-
-0.473
1.163
0.141
-0.180
0.011
0.230
ICW
+
0.083
0.032
0.429
-15.895
0.000
0.998
AU_FEES
+
0.178
1.744
0.094*
0.084
0.017
0.224
SIZE
-
-0.463
24.252
0.000***
-0.690
2.383
0.031**
LOSS
+
0.551
1.096
0.148
17.229
0.000
0.250
EQUITY_MULTIPLIER
+
-0.005
0.308
0.579
-0.034
0.294
0.588
QUICK
-
-0.164
19.170
0.000***
-0.089
0.812
0.092*
OPSEG
-
0.003
0.006
0.936
-0.011
0.001
0.243
GEOSEG
-
-0.055
5.976
0.008***
0.182
2.068
0.150
LnPOPULATION
-
-0.150
1.837
0.088*
-0.658
2.821
0.024**
FIRM_TENURE
+
0.301
1.649
0.100*
0.791
0.978
0.081*
NATIONAL_LEADER
-
-0.281
2.193
0.070*
-1.091
2.531
0.028**
CITY_LEADER
-
0.113
0.360
0.548
0.434
0.436
0.509
NONAUDIT
+
0.004
0.041
0.420
-0.062
1.240
0.265
FEM_AU
?
2.129
2.630
0.105
-1.492
0.094
0.759

Regression of Audit Quality on Audit Personnel Experience for Long-Tenured Partners (H2b)
INITIAL
-
-0.202
0.610
0.218
-0.505
0.224
0.159
MERGER
-
-0.447
2.837
0.046**
-0.169
0.037
0.212
REPORTLAG
+
0.002
1.442
0.115
0.062
5.239
0.006***
BANKRUPTCY
-
-0.067
32.748
0.000***
-0.082
3.692
0.014**
Year and Industry fixed effects
Yes
Yes
Number of Going Concern Modifications
235
19
Total Number of Observations
3,705
481
Model p-value
0.000***
0.000***
Pseudo R2
40.4%
57.9%
Panel D: Using AU_FEES as the Dependent Variable
Control Variable Years: 2011-2018
Control Variable Years: 2017-2018
Variable
t-value
p-value
t-value
p-value
Intercept
?
3.723
31.040
0.000***
4.222
13.744
0.000***
PART_TENURE_LONG
-
-0.044
-4.115
0.000***
-0.067
-2.509
0.006***
SM_OFFICE_CLIENTS
-
-0.083
-4.960
0.000***
-0.059
-1.432
0.076*

Regression of Audit Quality on Audit Personnel Experience for Long-Tenured Partners (H2b)
PART_TENURE_LONG x SM_OFFICE_CLIENTS
-
0.069
2.704
0.007***
0.022
0.340
0.734
ICW
+
0.348
11.923
0.000***
0.250
3.450
0.000***
RESTATE
+
0.090
5.441
0.000***
0.078
1.721
0.043**
GCM
+
0.130
3.852
0.000***
0.231
2.688
0.004***
SIZE
+
0.466
129.398
0.000***
0.450
47.925
0.000***
LOSS
+
0.173
13.296
0.000***
0.131
4.028
0.000***
EQUITY_MULTIPLIER
+
0.001
0.906
0.183
0.001
0.989
0.162
QUICK
-
-0.026
-13.313
0.000***
-0.025
-4.592
0.000***
OPSEG
+
0.011
8.772
0.000***
0.029
3.894
0.000***
GEOSEG
+
0.008
11.079
0.000***
0.026
5.396
0.000***
lnPOPULATION
+
0.030
5.167
0.000***
0.028
1.889
0.030**
FIRM_TENURE
+
0.059
3.332
0.001***
-0.031
-0.706
0.481
NATIONAL_LEADER
+
-0.010
-1.010
0.312
0.008
0.306
0.380
CITY_LEADER
+
0.025
2.374
0.018**
0.033
1.217
0.112
NONAUDIT
+
0.017
12.290
0.000***
0.017
4.866
0.000***
FEM_AU
?
0.453
5.388
0.000***
0.316
1.463
0.144
INITIAL
-
0.103
4.784
0.000***
0.089
1.399
0.081*
Regression of Audit Quality on Audit Personnel Experience for Long-Tenured Partners (H2b)
FOREIGN
+
0.050
8.015
0.000***
0.018
1.387
0.083*
MERGER
+
0.051
4.895
0.000***
0.059
2.276
0.012**
DCFO
+
0.113
6.532
0.000***
0.132
2.864
0.002***
GROWTH
+
0.013
1.937
0.053*
0.017
0.801
0.212
Year and Industry fixed effects
Yes
Yes
Total Number of Observations
11,301
1,565
Model p-value
0.000***
0.000***
R2
76.9%
78.6%
Expected Sign
Estimate
Estimate

Regression of Audit Quality on Audit Personnel Experience for Long-Tenured Partners (H2b)

197
Panel D of Table 17 presents the results from the OLS regression of AU_FEES on
the test and control variables for Hypotheses 2b. The results show significant negative
relationships between AU_FEES and PART_TENURE_LONG (p < 0.01) and
SM_OFFICE_CLIENTS and a significant positive relationship between AU_FEES and
PART_TENURE_LONG x SM_OFFICE_CLIENTS (p = 0.007), indicating that generally,
long-tenured partners are more likely to charge lower fees and generally, smaller offices
are more likely to charge lower fees; however, when considering the positive coefficient
of the interaction between long-tenured partners and smaller offices, the tendency of
long-tenured partners to charge lower (higher) fees appears less (more) likely among
smaller offices. The findings indicate significant positive relationships between
AU_FEES and ICW, RESTATE, SIZE, LOSS, OP_SEG, GEO_SEG, LnPOPULATION,
FIRM_TENURE, CITY_LEADER (when controlling for NATIONAL_LEADER),
NONAUDIT, INITIAL, FOREIGN, MERGER, DCFO, and GROWTH, and a significant
negative relationship between AU_FEES and QUICK. The findings again report a
significant negative relationship between AU_FEES and AUDIT_CLIENTS (p < 0.01),
similar to previously reported results, as well as the presence of a significant female audit
fee premium when evaluating the positive relationship between AU_FEES and FEM_AU
(p < 0.01). When evaluating the results using only 2017-2018 control variable years, the
interaction variable PART_TENURE_LONG x SM_OFFICE_CLIENT becomes
insignificant, while none of the control variable results are unexpected.
Results Summary for Audit Personnel Experience for Long-Tenured Partners and Audit
Quality (H2b)

198
The test results for H2b suggest that both long-tenured audit partners and small
audit offices are generally more likely to report material internal control deficiencies for
their clients; however, these effects tend to become less likely for long-tenured audit
partners at smaller offices, a finding that aligns with H2b. The test results for H2b also
suggest that there is no significant relationship between long-tenured audit partners and
future financial restatements or the likelihood of reporting a going concern opinion
modification; however, the results do show that both restatements and going concern
opinion modifications are more likely to occur at smaller offices, which makes sense
given that smaller offices have fewer clients and fewer auditors, and have less ability to
share experiences and resources. It might be that partners have more of an individualized
effect on the reporting of material internal control weaknesses, which are often judgment
based, and have less of an individualized effect on restatements or going concern opinion
modifications, which are often based on a method change or debt calculation and
therefore not impacted by partner judgment. It might also be that, because the Big 4
supposedly require their audit partners to retire after reaching a certain tenure, some, but
not all, deterioration of audit performance quality is able to be avoided. Finally, the test
results for H2b also suggest that both long-tenured audit partners and smaller offices are
more likely to charge lower fees; however, these effects tend to become less likely for
long-tenured audit partners at smaller offices, which does not align with H2b. This could
indicate one of two possibilities. First, long-tenured audit partners might charge higher
fees at smaller offices because they are required to perform more engagement tasks than
they would at larger offices, depending on client workload or audit staffing problems. Or
second, long-tenured audit partners might charge higher fees at smaller offices because of

199
the high level of expertise and specialization they can provide to a more focused group of
clients.
Supplemental Analysis for Audit Personnel Experience for Long-Tenured Partners and
Audit Quality (H2b)
In the first phase of supplemental analysis of H2b testing, the dependent variable
RESTATE is again modified in three ways. First, RESTATE is replaced with
RESTATE_NO_ICW. The models for this test (untabulated) are not significant. Second,
RESTATE was replaced by RESTATE_CE. The models for this test (untabulated) are
significant, and RESTATE_CE shows a significant negative relationship with
PART_TENURE_LONG (p = 0.085), indicating that long-tenured audit partners are less
likely to have future financial restatements that affect core earnings and that this is not
impacted by the size of the audit department based on number of clients. Finally,
RESTATE is replaced by SEC_REG_FAR, to test for restatements that occurred at an
auditor office in the same city as one of the eleven SEC regional offices. The model for
this test (untabulated) is significant, as is the significant negative relationship between
SEC_REG_FAR and SM_OFFICE_CLIENTS (p < 0.01) and the significant positive
relationship between SEC_REG_FAR and PART_TENURE_LONG x
SM_OFFICE_CLIENTS (p = 0.075), indicating that smaller auditor offices closest to the
eleven SEC regional offices generally have fewer restatements, but that this effect
weakens (i.e., more restatements occur) when considering the interaction effect of
longtenured audit partners.
In the secondary phase of supplemental analysis of H2b testing, the test variable

200
PART_TENURE_LONG is replaced by PRIN_TENURE_LONG and
PART_TENURE_LONG x SM_OFFICE_CLIENTS is replaced by
PRIN_TENURE_LONG x SM_OFFICE_CLIENTS in the main models, to consider
whether principals contribute to audit quality deterioration as they become long-tenured.
In the first model (untabulated), using RESTATE as the dependent variable, the results do
not show any significant relationships with the test variables. In the second model
(untabulated), using ICW as the dependent variable, the results show a significant
positive relationship to PRIN_TENURE_LONG x SM_OFFICE_CLIENTS p = 0.050),
but no
significant relationships with the other test variables, indicating that there is some
positive effect of long-tenured principals at smaller offices on the likelihood of reporting
material internal control weaknesses, a finding alternative to that of Table 17 Panel B. In
the third model (untabulated), using GCM as the dependent variable, the results show a
significant negative relationship to PRIN_TENURE_LONG (p = 0.021), which is
interesting considering that, in Panel C of Table 17, the PART_TENURE_LONG test
variable was not significant. This result could occur because principals might be
excluded from the unofficial mandatory partner retirement that occurs at Big 4 audit
firms. In the fourth and final model (untabulated), using AU_FEES as the dependent
variable, the results show a significant positive relationship to PRIN_TENURE_LONG (p
< 0.01) and a significant negative relationship to PRIN_TENURE_LONG x
SM_OFFICE_CLIENTS (p = 0.009). This result conflicts somewhat with Panel D of
Table 17, and possibly indicates that long-tenured principals are less efficient and
therefore have excess billable hours, although less often at smaller offices. Alternatively,

201
it could be that long-tenured principals are in higher demand due to their experience, and
therefore command fee premiums, although less often at smaller offices.
Logistic and OLS Regressions – Audit Workload Compression
Audit Workload Compression at the Audit Office Department Level and Audit Quality
(H3a)
Table 18 provides the regression results of the relationship between audit
workload compression and audit quality for Hypotheses 3a. Panel A of Table 18 presents
the results from the logistic regression of RESTATE on the test and control variables. The
results do not show significant associations between RESTATE and the test variable,
indicating that workload compression at the overall office level may not impact future
financial restatements. The results do indicate a significant negative association between
RESTATE and FEM_AU (0.005). The results also indicate significant positive
relationships between RESTATE and ICW, AU_FEES, EQUITY_MULTIPLIER, and
FIRM_TENURE, and significant negative relationships between RESTATE and SIZE,
NATIONAL_LEADER, and QUICK, all of which were expected based on the prior
literature. When evaluating the results using only 2017-2018 control variable years, the
test variable is not significant, and none of the control variable results are unexpected.
Panel B of Table 18 presents the results from the logistic regression of ICW on the
test and control variables for Hypothesis 3a. The results show a significant negative
relationship between ICW and BUSY_FYE1 (p = 0.003), indicating that offices with a
greater overall workload compression may not be as likely to report material weaknesses,
a sign of poor audit quality. The significant positive relationship between ICW and

202
AU_FEES is expected, as is the significant positive relationship between ICW and
MERGER. The significant negative relationships between ICW and SIZE and INITIAL
are also expected. In addition, the results show a significant positive relationship
between ICW and FEM_AU (p = 0.038), indicating that during periods of workload
compression, female auditors are more likely to report material internal control
weaknesses. When evaluating the results using only 2017-2018 control variable years,
the model is significant, but the test variable is not, while none of the control variable
results are unexpected.
Panel C of Table 18 presents the results from the logistic regression of GCM on
the test and control variables for Hypothesis 3a. The results show a significant negative
association between GCM and the BUSY_FYE1 (p = 0.024), indicating that workload
compression at the office level reduces the likelihood of an auditor reporting going
concern modifications. The significant positive relationships between GCM and
REPORTLAG, FIRM_TENURE, and AU_FEES are expected. The significant negative
relationships between GCM and SIZE, BANKRUPTCY, QUICK, NATIONAL_LEADER,
LnPOPULATION, GEOSEG, and MERGER are also expected. In addition, the results
show a significant positive relationship between GCM and FEM_AU (p = 0.089),
indicating that during periods of workload compression, female auditors are more likely
to modify auditor opinions for going concern issues. When evaluating the results using
only 2017-2018 control variable years, the model is significant, but the test variable is
not, while none of the control variable results are unexpected.
Panel D1 of Table 18 presents the results from the OLS regression of AU_FEES on the
test and control variables for Hypotheses 3a. The results show a significant positive

203
relationship between AU_FEES and BUSY_FYE1 (p < 0.01), possibly indicating that
firms charge fee premiums during peak times of the year in exchange for high quality
performance. The findings indicate significant positive relationships between AU_FEES
and ICW, RESTATE, SIZE, LOSS, OP_SEG, GEO_SEG, LnPOPULATION,
FIRM_TENURE, CITY_LEADER (but only when controlling for NATIONAL_LEADER),
NONAUDIT, INITIAL, FOREIGN, MERGER, GROWTH and DCFO, and significant
negative relationships between AU_FEES and QUICK and AUDIT_CLIENTS. In
addition, the results indicate the presence of a significant female audit fee premium when
evaluating the positive relationship between AU_FEES and FEM_AU. When evaluating
the results using only 2017-2018 control variable years, the results show a significant
positive relationship between AU_FEES and BUSY_FYE1, while none of the control
variable results are unexpected.
Results Summary for Audit Workload Compression at the Audit Office Department Level
and Audit Quality (H3a)
The test results for H3a suggest that when the office audit department
workload is concentrated on clients with fiscal years ending in December, auditors are
less likely to report material internal control weaknesses and going concern opinion
modifications, and are more likely to charge fee premiums, which only partially aligns
with H3a.
TABLE 18 - Regression of Audit Quality on Audit Workload Compression at the Audit Office Department Level (H3a)
Panel A: Using RESTATE as the Dependent Variable Control Variable Years: 2011-2018 Control Variable Years: 2017-2018
Variable p-value Wald
Intercept
?
-2.540
4.925
0.026**
-22.742
0.000
0.999
BUSY_FYE1
+
-0.001
0.929
0.335
0.001
0.180
0.336
ICW
+
1.398
105.924
0.000***
2.166
31.420
0.000***
AU_FEES
+
0.353
26.718
0.000***
0.286
1.793
0.091*
SIZE
-
-0.172
18.301
0.000***
-0.206
2.628
0.053*
LOSS
+
0.006
0.005
0.473
0.490
3.174
0.075*
EQUITY_MULTIPLIER
+
0.007
3.779
0.026**
0.004
0.128
0.360
QUICK
-
-0.022
1.997
0.079*
-0.050
0.772
0.190
OPSEG
+
0.004
0.286
0.297
0.027
0.203
0.327
GEOSEG
+
0.001
0.042
0.419
0.006
0.022
0.441
LnPOPULATION
-
0.004
0.010
0.919
0.164
1.708
0.191
FIRM_TENURE
+
0.228
3.578
0.030**
0.125
0.115
0.368
NATIONAL_LEADER
-
-0.138
3.605
0.029**
-0.100
0.208
0.324
CITY_LEADER
-
-0.003
0.001
0.487
0.194
0.716
0.397
Expected Sign
Estimate
Wald
Estimate
p
-
value
(H3a)
NONAUDIT
+
0.009
0.708
0.200
0.030
0.831
0.181
FEM_AU
?
-1.665
7.872
0.005***
-2.236
1.414
0.234
INITIAL
+
-0.013
0.008
0.930
0.733
2.269
0.066*
MERGER
+
-0.017
0.054
0.816
0.096
0.193
0.330
CHANGE_IN_RECEIVABLES
+
-0.001
0.107
0.744
-0.021
0.020
0.887
CHANGE_IN_INVENTORIES
+
-0.004
0.020
0.887
-0.006
0.013
0.908
CHANGE_IN_CASH_SALES
+
-0.002
1.025
0.311
-0.072
1.773
0.183
Year and Industry fixed effects
Yes
Yes
Number of Restatements
1,025
122
Total Number of Observations
11,301
1,524
Model p-value
0.000***
0.000***
Pseudo R2
5.5%
18.9%
Regression of Audit Quality on Audit Workload Compression at the Audit Office Department Level
Panel B: Using ICW as the Dependent Variable Control Variable Years: 2011-2018 Control Variable Years: 2017-2018
Variable Wald
Intercept
?
-26.464
0.000
0.998
-20.998
0.000
0.999
Expected Sign
Estimate
Wald
p
-
value
Estimate
p
-
value

(H3a)
BUSY_FYE1
-
-0.004
7.650
0.003***
-0.006
1.245
0.132
AU_FEES
+
1.473
144.492
0.000***
1.317
12.701
0.000***
SIZE
-
-0.810
126.678
0.000***
-0.82
14.527
0.000***
LOSS
+
0.178
1.567
0.106
0.108
0.081
0.388
EQUITY_MULTIPLIER
+
0.006
0.934
0.167
-0.01
0.436
0.509
QUICK
-
-0.039
1.395
0.119
-0.209
1.958
0.081*
OPSEG
+
-0.009
0.297
0.586
-0.008
0.003
0.955
GEOSEG
+
0.001
0.028
0.434
-0.027
0.142
0.706
LnPOPULATION
-
0.064
0.839
0.360
-0.156
0.634
0.213
FIRM_TENURE
-
0.228
1.278
0.258
0.581
1.262
0.261
NATIONAL_LEADER
+
-0.091
0.488
0.485
0.169
0.242
0.312
CITY_LEADER
+
-0.166
1.455
0.228
0.138
0.142
0.353
NONAUDIT
+
0.006
0.115
0.367
0.002
0.001
0.487
FEM_AU
?
2.076
4.321
0.038**
2.91
0.939
0.333
INITIAL
-
-0.350
1.889
0.085*
0.093
0.018
0.892
MERGER
+
0.262
4.21
0.020**
0.488
2.007
0.079*
Year and Industry fixed effects
Yes
Yes
Number of Control Weaknesses
308
45
(H3a)
Total Number of Observations
11,301
1,565
Model p-value
0.000***
0.099*
Pseudo R2
13.5%
23.2%
Regression of Audit Quality on Audit Workload Compression at the Audit Office Department Level
Panel C: Using GCM as the Dependent Variable Control Variable Years: 2011-2018 Control Variable Years: 2017-2018
Variable Wald p-value Wald
Intercept
?
9.263
11.565
0.001***
3.485
0.000
1.000
BUSY_FYE1
-
-0.004
3.958
0.024**
0.003
0.126
0.723
ICW
+
0.083
0.032
0.429
-15.903
0.000
0.998
AU_FEES
+
0.198
2.132
0.072*
0.024
0.001
0.486
SIZE
-
-0.453
23.608
0.000***
-0.702
2.478
0.058*
LOSS
+
0.461
0.791
0.187
17.288
0.000
0.499
Expected Sign
Estimate
Estimate
p
-
value

(H3a)
EQUITY_MULTIPLIER
+
-0.003
0.133
0.715
-0.030
0.233
0.629
QUICK
-
-0.157
17.533
0.000***
-0.094
0.899
0.172
OPSEG
-
0.012
0.099
0.753
0.003
0.000
0.991
GEOSEG
-
-0.054
5.880
0.008***
0.188
2.116
0.146
LnPOPULATION
-
-0.148
1.804
0.090*
-0.736
3.257
0.036**
FIRM_TENURE
+
0.321
1.901
0.084*
0.777
0.969
0.163
NATIONAL_LEADER
-
-0.266
1.958
0.081*
-1.118
2.846
0.046**
CITY_LEADER
-
0.130
0.479
0.489
0.417
0.420
0.517
NONAUDIT
+
0.001
0.002
0.482
-0.059
1.135
0.287
FEM_AU
?
2.266
2.890
0.089*
-2.455
0.281
0.596
INITIAL
-
-0.207
0.644
0.211
-0.475
0.197
0.329
MERGER
-
-0.455
2.958
0.043**
-0.131
0.023
0.440
REPORTLAG
+
0.002
2.140
0.072*
0.062
5.329
0.011**
BANKRUPTCY
-
-0.070
36.016
0.000***
-0.080
3.552
0.030**
Year and Industry fixed effects
Yes
Yes
Number of Going Concern Modifications
235
19
Total Number of Observations
3,705
481
Model p-value
0.000***
0.000***

(H3a)
Pseudo R2
40.2%
57.9%
Regression of Audit Quality on Audit Workload Compression at the Audit Office Department Level
Panel D: Using AU_FEES as the Dependent Variable
Control Variable Years: 2011-2018
Control Variable Years: 2017-2018
Variable
t-value
p-value
t-value
p-value
Intercept
?
3.797
32.059
0.000***
4.348
14.373
0.000***
BUSY_FYE1
+
0.001
10.842
0.000***
0.001
4.337
0.000***
ICW
+
0.346
11.901
0.000***
0.253
3.503
0.000***
RESTATE
+
0.089
5.424
0.000***
0.076
1.689
0.046**
GCM
+
0.129
3.828
0.000***
0.228
2.657
0.004***
SIZE
+
0.464
129.502
0.000***
0.449
47.974
0.000***
LOSS
+
0.170
13.181
0.000***
0.128
3.933
0.000***
EQUITY_MULTIPLIER
+
0.000
0.794
0.214
0.001
0.933
0.176
QUICK
-
-0.026
-13.726
0.000***
-0.026
-4.764
0.000***

(H3a)
OPSEG
+
0.011
8.860
0.000***
0.030
4.044
0.000***
GEOSEG
+
0.008
10.849
0.000***
0.026
5.342
0.000***
lnPOPULATION
+
0.024
4.186
0.000***
0.019
1.260
0.104
FIRM_TENURE
+
0.062
3.519
0.000***
-0.032
-0.749
0.454
NATIONAL_LEADER
+
-0.014
-1.408
0.159
0.005
0.217
0.414
CITY_LEADER
+
0.034
3.175
0.001***
0.038
1.406
0.080*
NONAUDIT
+
0.016
11.624
0.000***
0.016
4.592
0.000***
FEM_AU
?
0.341
4.070
0.000***
0.176
0.828
0.408
INITIAL
-
0.100
4.695
0.000***
0.098
1.545
0.124
FOREIGN
+
0.050
8.027
0.000***
0.017
1.343
0.090*
MERGER
+
0.054
5.172
0.000***
0.063
2.438
0.008***
DCFO
+
0.110
6.371
0.000***
0.125
2.730
0.003***
GROWTH
+
0.013
1.871
0.031**
0.021
0.963
0.168
Year and Industry fixed effects
Yes
Yes
Total Number of Observations
11,301
1,565
Model p-value
0.000***
0.000***
R2
77.1%
78.8%
(H3a)
Expected Sign
Estimate
Estimate

152
However, it might be that fee premiums are being charged based on the time period
effects, rather than because of high quality (similar to the price gouging of gasoline that
sometimes occurs during the summer vacation season). In addition, female auditors
appear more likely to report material internal control weaknesses and going concern
opinion modifications during periods of workload compression, perhaps indicating that
female auditors become more conservative as time pressures increase. When evaluating
the test results for H3a using only control variables from 2017-2018, only the significant
positive relationship between audit fees and audit department workload compression
remains.
Supplemental Analysis for Audit Workload Compression at the Audit Office Department
Level and Audit Quality (H3a)
In supplemental analysis of H3a testing, the dependent variable RESTATE is again
modified in three ways. First, RESTATE is replaced with RESTATE_NO_ICW. The
models for this test (untabulated) are not significant. Second, RESTATE was replaced by
RESTATE_CE. The models for this test (untabulated) are significant, although the test
variables are not. Finally, RESTATE is replaced by SEC_REG_FAR, to test for
restatements that occurred at an auditor office in the same city as one of the eleven SEC

regional offices. The models for this test (untabulated) are significant, and positively
correlated to the test variable BUSY_FYE1 (p < 0.01) indicating that the proximity of an
SEC regional office may influence auditors to commit errors that result in future
restatements due to workload volume. This finding conflicts with the supplemental
153
analysis for H1a, in which the proximity of an office to an SEC regional office reduced
the likelihood of a future financial restatement.
Audit Workload Compression at the Audit Office Personnel Level and Audit Quality
(H3b)
Table 19 provides the regression results of the relationship between audit
workload compression at the audit office personnel level and audit quality for Hypotheses
3b. Panel A of Table 18 presents the results from the logistic regression of RESTATE on
the test and control variables. The results show a significant negative association
between RESTATE and BUSY_FYE1_SEN_ASSOC (p = 0.011) and a significant positive
association between RESTATE and BUSY_FYE1_SMGR_MGR (p = 0.056), indicating

that senior associates/associates may not feel the effects of workload compression to the
same extent as senior managers/managers, perhaps for two reasons: first, a significant
part of the review process takes place at the manager level. Second, audit personnel
levels are greater at lower levels, then decreasingly so as staffing levels progress (due to
pyramidal staffing proportions), which can allow for workload to be spread to a greater
extent at lower levels. The results continue to indicate a significant negative association
between RESTATE and FEM_AU (p = 0.003).
TABLE 19 - Regression of Audit Quality on Audit Workload Compression at the Audit Office Personnel Level (H3b)
Panel A: Using RESTATE as the Dependent Variable Control Variable Years: 2011-2018 Control Variable Years: 2017-2018
Variable Wald
Intercept
?
-2.251
3.789
0.052*
-22.360
0.000
0.999
BUSY_FYE1_PART
+
0.004
0.177
0.337
0.039
1.844
0.087*
BUSY_FYE1_PRIN
+
0.002
0.060
0.404
0.005
0.052
0.410
BUSY_FYE1_SMGR_MGR
+
0.043
2.541
0.056*
0.123
2.273
0.066*
BUSY_FYE1_SEN_ASSOC
+
-0.936
6.509
0.011**
-3.060
4.484
0.034**
LG_OFFICE_AUD_HC
-
-0.061
0.370
0.272
0.130
0.165
0.684
ICW
+
1.415
108.007
0.000***
2.146
30.386
0.000***
AU_FEES
+
0.327
22.601
0.000***
0.193
0.796
0.186
SIZE
-
-0.165
16.641
0.000***
-0.171
1.804
0.090*
LOSS
+
0.007
0.007
0.467
0.457
2.719
0.099*
EQUITY_MULTIPLIER
+
0.007
3.788
0.026**
0.003
0.046
0.415
QUICK
-
-0.023
2.211
0.069*
-0.052
0.842
0.180
OPSEG
+
0.006
0.498
0.240
0.032
0.289
0.296
GEOSEG
+
0.001
0.085
0.386
0.014
0.114
0.368
Expected Sign
Estimate
Wald
p
-
value
Estimate
p
-
value

(H3b)
LnPOPULATION
-
0.013
0.087
0.768
0.199
2.276
0.131
FIRM_TENURE
+
0.229
3.605
0.029**
0.174
0.218
0.321
NATIONAL_LEADER
-
-0.147
4.025
0.023**
-0.084
0.142
0.354
CITY_LEADER
-
0.026
0.114
0.735
0.245
1.111
0.292
NONAUDIT
+
0.008
0.588
0.222
0.024
0.491
0.242
FEM_AU
?
-1.788
8.914
0.003***
-2.674
1.970
0.160
INITIAL
+
-0.008
0.003
0.955
0.713
2.112
0.073*
MERGER
+
-0.019
0.065
0.799
0.093
0.179
0.336
CHANGE_IN_RECEIVABLES
+
-0.001
0.124
0.725
-0.021
0.014
0.905
CHANGE_IN_INVENTORIES
+
-0.004
0.022
0.883
-0.004
0.005
0.941
CHANGE_IN_CASH_SALES
+
-0.002
0.983
0.321
-0.070
1.668
0.197
Year and Industry fixed effects
Yes
Yes
Number of Restatements
1,025
122
Total Number of Observations
11,301
1,524
Model p-value
0.000***
0.000***
Pseudo R2
5.7%
20.0%
Regression of Audit Quality on Audit Workload Compression at the Audit Office Personnel Level
(H3b)
Panel B: Using ICW as the Dependent Variable Control Variable Years: 2011-2018 Control Variable Years: 2017-2018
Variable Wald
Intercept
?
-25.842
0.000
0.998
-19.257
0.000
0.999
BUSY_FYE1_PART
-
-0.048
4.992
0.013**
-0.026
0.138
0.356
BUSY_FYE1_PRIN
-
0.014
1.565
0.211
0.026
0.477
0.490
BUSY_FYE1_SMGR_MGR
-
-0.111
3.342
0.034**
-0.242
1.897
0.084*
BUSY_FYE1_SEN_ASSOC
-
0.476
1.812
0.178
-0.957
0.181
0.336
LG_OFFICE_AUD_HC
+
-0.157
0.755
0.385
0.436
0.671
0.207
AU_FEES
+
1.444
139.826
0.000***
1.23
10.686
0.000***
SIZE
-
-0.798
124.222
0.000***
-0.79
13.179
0.000***
LOSS
+
0.166
1.344
0.123
0.046
0.014
0.452
EQUITY_MULTIPLIER
+
0.006
0.829
0.182
-0.01
0.429
0.512
QUICK
-
-0.046
1.832
0.088*
-0.227
2.217
0.069*
OPSEG
+
-0.008
0.249
0.618
-0.003
0.000
0.982
GEOSEG
+
0.000
0.003
0.478
-0.035
0.216
0.642
LnPOPULATION
-
0.047
0.407
0.523
-0.283
1.749
0.093*
FIRM_TENURE
-
0.238
1.386
0.239
0.523
1.028
0.156
NATIONAL_LEADER
+
-0.112
0.737
0.391
0.06
0.030
0.432
Expected Sign
Estimate
Wald
p
-
value
Estimate
p
-
value
(H3b)
CITY_LEADER
+
-0.163
1.416
0.234
0.122
0.111
0.370
NONAUDIT
+
0.005
0.065
0.400
-0.004
0.007
0.935
FEM_AU
?
1.552
2.262
0.133
3.195
0.914
0.339
INITIAL
-
-0.332
1.706
0.096*
0.239
0.124
0.725
MERGER
+
0.273
4.542
0.017**
0.552
2.525
0.056*
Year and Industry fixed effects
Yes
Yes
Number of Control Weaknesses
308
45
Total Number of Observations
11,301
1,565
Model p-value
0.000***
0.118
Pseudo R2
13.6%
24.0%
Regression of Audit Quality on Audit Workload Compression at the Audit Office Personnel Level
Panel C: Using GCM as the Dependent Variable Control Variable Years: 2011-2018 Control Variable Years: 2017-2018
Variable Wald p-value Wald
Intercept
?
11.085
2.799
0.000***
4.393
0.000
1.000
Expected Sign
Estimate
Estimate
p
-
value

(H3b)
BUSY_FYE1_PART
-
0.072
9.947
0.002***
0.174
3.117
0.077*
BUSY_FYE1_PRIN
-
0.003
0.025
0.874
-0.082
1.083
0.149
BUSY_FYE1_SMGR_MGR
-
-0.356
5.387
0.010***
-0.405
0.275
0.300
BUSY_FYE1_SEN_ASSOC
-
0.216
0.164
0.685
4.223
1.101
0.294
LG_OFFICE_AUD_HC
+
-0.484
3.895
0.048**
-0.048
0.003
0.957
ICW
+
0.073
0.025
0.438
-15.462
0.000
0.998
AU_FEES
+
0.184
1.842
0.088*
0.665
0.766
0.191
SIZE
-
-0.477
25.667
0.000***
-0.964
4.037
0.023**
LOSS
+
0.668
1.380
0.120
16.996
0.000
0.499
EQUITY_MULTIPLIER
+
-0.003
0.101
0.751
-0.028
0.185
0.667
QUICK
-
-0.172
20.785
0.000***
-0.105
1.005
0.158
OPSEG
-
-0.011
0.076
0.391
0.082
0.075
0.784
GEOSEG
-
-0.053
5.591
0.009***
0.131
1.008
0.315
LnPOPULATION
-
-0.221
3.583
0.029**
-1.006
3.983
0.023**
FIRM_TENURE
+
0.301
1.622
0.102
0.783
0.921
0.169
NATIONAL_LEADER
-
-0.314
2.664
0.052*
-1.002
2.070
0.075*
CITY_LEADER
-
0.088
0.220
0.639
0.410
0.350
0.554

(H3b)
NONAUDIT
+
0.000
0.001
0.491
-0.092
2.316
0.128
FEM_AU
?
1.957
2.137
0.144
-0.011
0.000
0.998
INITIAL
-
-0.156
0.362
0.274
-1.036
0.764
0.191
MERGER
-
-0.422
2.483
0.058*
-0.128
0.019
0.445
REPORTLAG
+
0.002
1.239
0.133
0.059
4.471
0.017**
BANKRUPTCY
-
-0.068
33.413
0.000***
-0.066
2.288
0.065*
Year and Industry fixed effects
Yes
Yes
Number of Going Concern Modifications
235
19
Total Number of Observations
3,705
481
Model p-value
0.000***
0.000***
Pseudo R2
41.2%
61.1%
Regression of Audit Quality on Audit Workload Compression at the Audit Office Personnel Level
Panel D: Using AU_FEES as the Dependent Variable
Control Variable Years: 2011-2018
Control Variable Years: 2017-2018
Variable
t-value
p-value
t-value
p-value
Intercept
?
3.915
32.790
0.000***
4.370
14.347
0.000***
BUSY_FYE1_PART
+
0.006
4.206
0.000***
0.005
1.219
0.112

(H3b)
BUSY_FYE1_PRIN
+
-0.001
-0.634
0.526
0.006
2.158
0.016**
BUSY_FYE1_SMGR_MGR
+
-0.004
-0.981
0.327
0.009
0.840
0.201
BUSY_FYE1_SEN_ASSOC
+
-0.403
-9.571
0.000***
-0.683
-5.174
0.000***
LG_OFFICE_AUD_HC
-
0.102
7.374
0.000***
0.072
2.095
0.036
ICW
+
0.344
11.872
0.000***
0.235
3.262
0.000***
RESTATE
+
0.083
5.067
0.000***
0.059
1.319
0.094*
GCM
+
0.121
3.617
0.000***
0.258
3.012
0.002***
SIZE
+
0.462
129.010
0.000***
0.447
47.945
0.000***
LOSS
+
0.166
12.856
0.000***
0.126
3.876
0.000***
EQUITY_MULTIPLIER
+
0.001
1.043
0.149
0.001
0.950
0.171
QUICK
-
-0.026
-13.547
0.000***
-0.026
-4.783
0.000***
OPSEG
+
0.011
9.131
0.000***
0.031
4.133
0.000***
GEOSEG
+
0.008
11.458
0.000***
0.027
5.592
0.000***
lnPOPULATION
+
0.018
3.046
0.001***
0.022
1.468
0.071*
FIRM_TENURE
+
0.059
3.352
0.000***
-0.028
-0.642
0.521
NATIONAL_LEADER
+
-0.013
-1.264
0.206
0.002
0.066
0.474
CITY_LEADER
+
0.035
3.266
0.000***
0.039
1.472
0.071*
(H3b)
NONAUDIT
+
0.017
12.168
0.000***
0.015
4.434
0.000***
FEM_AU
?
0.488
5.851
0.000***
0.290
1.369
0.171
INITIAL
-
0.104
4.866
0.000***
0.097
1.530
0.126
FOREIGN
+
0.050
8.049
0.000***
0.018
1.404
0.081*
MERGER
+
0.054
5.209
0.000***
0.058
2.250
0.013**
DCFO
+
0.117
6.769
0.000***
0.123
2.690
0.003***
GROWTH
+
0.013
1.914
0.028**
0.020
0.931
0.176
Year and Industry fixed effects
Yes
Yes
Total Number of Observations
11,301
1,565
Model p-value
0.000***
0.000***
R2
77.3%
79.1%
Expected Sign
Estimate
Estimate

223
The results also indicate significant positive relationships between RESTATE and ICW,
AU_FEES, EQUITY_MULTIPLIER, and FIRM_TENURE, and significant negative
relationships between RESTATE and SIZE, QUICK, and NATIONAL_LEADER, all of
which are expected based on the prior literature. When evaluating the results using only
2017-2018 control variable years, the results show a significant negative association
between RESTATE and BUSY_FYE1_SEN_ASSOC and significant positive associations
between RESTATE and BUSY_FYE1_SMGR_MGR and BUSY_FYE1_PART, while none
of the control variable results are unexpected.
Panel B of Table 19 presents the results from the logistic regression of ICW on the
test and control variables for Hypothesis 3b. The results show significant negative
relationships between ICW and BUSY_FYE1_PART (p = 0.013) and
BUSY_FYE1_SMGR_MGR (p = 0.034), indicating that during periods of workload
compression, partners and managers may not be as likely to detect and report material
weaknesses, a sign of poor audit quality. The significant positive relationship between
ICW and AU_FEES is expected, as is the significant positive relationship between ICW
and MERGER. The significant negative relationships between ICW and SIZE, INITIAL,
and QUICK are also expected. When evaluating the results using only 2017-2018 control
variable years, the model is not significant.
Panel C of Table 19 presents the results from the logistic regression of GCM on
the test and control variables for Hypothesis 3b. The results show a significant positive
association between GCM and BUSY_FYE1_PART (p = 0.002) and
LG_OFFICE_AUD_HC (p = 0.048), and a significant negative association between
GCM and BUSY_FYE1_SMGR_MGR (p = 0.010) which complements the results of

224
Panel C in Tables 14, 15, and 16. These results might indicate that workload
compression affects the manager level, or primary reviewers, greater than the partner or
staff level, although more so at non-large offices. The significant positive relationships
between GCM and AU_FEES, EQUITY_MULTIPLIER, and BANKRUPTCY are
expected. The significant negative relationships between GCM and SIZE, QUICK,
GEOSEG, FIRM_TENURE, LnPOPULATION, and MERGER are also expected. When
evaluating the results using only 2017-2018 control variable years, the results show
significant positive associations between GCM and BUSY_FYE1_PART, while none of
the control variable results are unexpected.
Panel D of Table 19 presents the results from the OLS regression of AU_FEES on
the test and control variables for Hypotheses 3b. The results show significant positive
relationships between AU_FEES and BUSY_FYE1_PART (p < 0.01) and
LG_OFFICE_AUD_HC (p < 0.01), and significant negative relationships between
AU_FEES and BUSY_FYE1_SEN_ASSOC (p < 0.01), possibly indicating that firms
charge fee premiums during peak times of the year in exchange for high quality
performance, although only at the partner level and primarily at large offices. The
findings indicate significant positive relationships between AU_FEES and ICW,
RESTATE, SIZE, LOSS, OP_SEG, GEO_SEG, LnPOPULATION, FIRM_TENURE,
CITY_LEADER (when controlling for NATIONAL_LEADER), NONAUDIT, INITIAL,
FOREIGN, MERGER, GROWTH, and DCFO, and a significant negative relationship
between AU_FEES and QUICK. The findings again report a significant negative
relationship between AU_FEES and AUDIT_CLIENTS (p < 0.01) at all staffing levels,
similar to previously reported results, as well as the presence of a significant female audit

225
fee premium when evaluating the positive relationship between AU_FEES and FEM_AU
(p < 0.01). When evaluating the results using only 2017-2018 control variable years, the
findings indicate a significant positive relationship between AU_FEES and
BUSY_FYE1_PRIN (p = 0.031) and a significant negative relationship between
AU_FEES and BUSY_FYE1_SEN_ASSOC (p < 0.01), while none of the control variable
results are unexpected.
Results Summary for Audit Workload Compression at the Audit Office Personnel Level
and Audit Quality (H3b)
The test results for H3b suggest that when the office audit department workload is
concentrated on clients with fiscal years ending in December, audit partners and senior
managers/managers do not perform as well, which conflicts with H3b, as they tend to be
associated with fewer reporting of material internal control weaknesses. It may be that
some offices do not feel pressure because they either do not have the same proportional
client project volume as other offices, or because they can “borrow” audit human capital
from offices that have more capacity. Additionally, managers in general might get
bogged down in the review process, and are less likely to report going concern opinion
modifications and more likely to be associated with future financial restatements.
Finally, partners seem to bill differently during compression periods. It is likely that
there is a balance between being efficient with time, adhering to a client contract, and
charging for expertise. Senior associates and associates do not seem to be associated
with the deteriorating audit quality effects, possibly because the Big 4 firms have made

226
an effort to alleviate turnover issues that commonly occur at the staff level or because
their mistakes are caught at the manager review level.
Supplemental Analysis for Audit Workload Compression at the Audit Office Personnel
Level and Audit Quality (H3b)
In the primary phase of supplemental analysis of H3b testing, the dependent
variable RESTATE is again modified in three ways. First, RESTATE is replaced with
RESTATE_NO_ICW. The models for this test (untabulated) are not significant. Second,
RESTATE was replaced by RESTATE_CE. The models for this test (untabulated) are
significant, although only the test variable BUSY_FYE1_SMGR_MGR is significant (p =
0.090), perhaps indicating that while managers often face workload compression
restatement issues due to review responsibilities, these restatement issues are less likely
to be related to core earnings. Finally, RESTATE is replaced by SEC_REG_FAR, to test
for restatements that occurred at an auditor office in the same city as one of the eleven
SEC regional offices. The models for this test (untabulated) are significant (pseudo
Rsquare 0.097; p < 0.01). SEC_REG_FAR has a significant positive relationship with
BUSY_FYE1_PART (p < 0.01), and a significant negative relationship with
BUSY_FYE1_SEN_ASSOC (p < 0.01). These results indicate that the proximity of an
SEC regional office may influence auditors to commit errors that result in future
restatements due to workload volume, and that this is more of an issue at the associate
staffing level. This finding is counter to the supplemental analysis for H1a, in which the
proximity of an office to an SEC regional office reduced the likelihood of a future
financial restatement.

227
In the secondary phase of supplemental analysis of H3b testing, the test variables
BUSY_FYE1_PART, BUSY_FYE1_PRIN, BUSY_FYE1_SMGR_MGR, and
BUSY_FYE1_SEN_ASSOC are replaced in the main models by three additional
measurements of time period windows to consider the sensitivity of busy season to audit
planning, issues, and delays: December through January (BUSY_FYE2); November
through December (BUSY_FYE3); and November through January (BUSY_FYE4), for
each staffing level. The results (untabulated) show that the test variables for the alternate
busy season windows retained a similar coefficient direction and significance as the main
models for RESTATE, ICW, GCM, and AU_FEES. These results indicate that the effects
of workload compression should be considered from November through January fiscal
years, rather than simply December fiscal years.
Note on Self-Selection Bias
The analysis performed heretofore makes the assumption that each audit office
hires a particular type or number of individual(s) for reasons that are exogenous to the
multivariate analysis contained in this study. However, it is possible that new hires have
some selection power, perhaps because of personal connections or pay disparity, which
allows them to choose an office at which to work, rather than be placed at an office that
the firm feels would be the best fit. The result might be variations in the headcount
among offices related to something other than quality or need. This suggests that audit
quality and the available audit human capital are both endogenous. If self-selections are
included in the multivariate regressions, bias might occur. To help address the
endogeneity issue, the multivariate regressions testing H1c include various educational

228
variables (See Panels A1 through D4 of Table 13) for each staffing level, which not only
capture local, available audit human capital effects, but also capture the effect of
connections between audit offices and university professors or alumni, who might help
guide students to audit offices with which they have educational ties. In Panels A1
through D4 of Table 13, there are several significant educational variables at multiple
staffing levels, suggesting that there may be some variability in audit office headcount for
reasons other than need. Future research should examine office headcount from the
perspective of hires and resignations of both audit and non-audit personnel in order to
better address self-selection bias concerns.

CHAPTER 5
CONCLUSIONS, LIMITATIONS, AND FUTURE RESEARCH
Efforts to increase audit quality, at the audit engagement team level, have been at
the forefront of the minds of the PCAOB in recent years, as they continue to develop
methods to make their inspections more robust. This study investigates how Big 4 audit
department level personnel influence audit quality, by examining the audit human capital
available to each office, the experiences and education of the auditor at each office, and
the workload compression of audit engagements at each office. By examining audit
quality at the personnel level, this study extends prior research on the inputs affecting
audit quality.
The results of this study yield the following findings. First, offices with greater
amounts of total audit human capital are more likely to report material internal control
weaknesses, while also maintaining levels of efficiency that mitigate significant increases
in audit fees. However, offices with greater amounts of senior-level audit human capital
have fewer future financial restatements, fewer going concern opinion modifications, and
no effect on the reporting of material internal control weaknesses. It might be that future
financial restatements and going concern opinion modifications allow for less auditor
judgment, since they are often tied to a “bright line” test, whereas material internal

230
164
control weaknesses, often matters of judgment, can sometimes be negotiated between
senior-level (or more experienced) auditors and clients. In addition, offices of all sizes
seem to be negatively impacted by disproportionate staffing. Historically, audit firms
have maintained a pyramid-shaped model for staffing levels (fewer partners on top to
more associates at the bottom) in order to achieve the most realization on client billings.
When evaluating audit human capital proportions, it becomes apparent that
disproportionate staffing levels might be resulting in inefficiencies and negative effects
on audit quality. Future research could focus on the effects of staffing proportions on
audit efficiency, in addition to audit qualify effectiveness, including the extent to which
offices that lack audit human capital or expertise borrow from offices that have an excess
capacity of audit human capital or expertise.
Second, auditor educational effects tend to impact audit quality, although not
solely at lower staffing levels as expected. “Specialized” educational variables (such as
attending a separately accredited accounting program or attending an elite university)
tend to be positively associated with higher audit quality, measured by a willingness to
report going concern opinion modification, but only at the partner and principal levels.
However, “general” educational variables (such as having a post-graduate degree or
attending a school in the same metro-statistical area as the auditor office) tend to be
associated with higher audit quality, measured by a willingness to report a material
internal control weakness, but only at the manager level. The results of audit quality
measured by restatements and audit fees tend to be mixed, and at first glance
inconclusive; however, the mixed results could be capturing efficiency issues that are

231
exacerbated by disproportionately staffed audit offices, which will affect audit quality at
all staffing levels.
Third, more experienced auditors have higher quality, although not equally at all
staffing levels. For example, experienced audit managers tend to have fewer
restatements, possibly because they are the primary audit engagement reviewer at the
detailed level. Also, more experienced partners tend to report more material internal
control weaknesses. This finding, when taken together with the audit human capital
finding that audit departments with more senior-level auditors report fewer material
internal control weaknesses, seems to indicate that in some situations, individual
experience rather than simply quantity can have a greater impact on audit quality, leading
to poorer performance at audit departments with less individual experience. This study
did hypothesize that long-tenured partners at smaller offices would show deteriorating
audit quality, and the results suggest that long-tenured audit partners are less likely to
report material internal control weaknesses at smaller offices, which supports the
hypothesis. However, long-tenured audit partners at smaller offices tend to have no
effect on the reporting of going concern opinion modifications or restatements, possibly
due to the “unofficial” mandatory partner retirement age practices that are employed by
the Big 4 in order to avoid such negative audit quality effects. Lastly, the results indicate
that more long-tenured audit principals at smaller offices are associated with fewer going
concern opinion modifications, an indicator of poor audit quality. These findings could
be interpreted in two ways: first, audit principals may not fall under any of the Big 4
retirement policy considerations that are often associated with partners and therefore
might actually be experiencing audit quality deterioration; and second, in some offices
(especially larger offices), audit principals might be acting in more of an administrative

232
or specialist role and might not take a direct role in specific audit engagements, which
could be skewing the findings.
Finally, audit departments feel the negative audit quality effects that result from
workload compression period, as auditors in general report fewer material internal
control weaknesses and going concern opinion modifications, and have more future
financial restatements for clients with December fiscal year-ends, although they also tend
to have higher audit fees, likely due to premiums charged in order to meet client
deadlines. However, when evaluating the results for auditor staffing levels, audit partners
and managers seem to feel the workload compression effects more than associates. This
finding is intuitive, as audit partners and managers are more involved in the review and
reporting process, whereas mistakes made at the associate levels are being caught in the
review process, or perhaps smaller offices are able to “borrow” audit human capital from
larger offices that might have excess capacity.
Through additional tests, this study incorporates a control variable to test the
significance of males and females in the audit department, primarily due to the limited
prior evidence. The findings indicate that the proportion of female auditors at the office
is positively related to fewer restatements, more reporting of material internal control
weaknesses, more going concern opinion modifications, and higher audit fees to various
extents and levels of significance throughout the models used in this study. Future
research should study the relationship of gender at various staffing levels with audit
quality.
Through additional tests, the study examines the impact of the proximity of the
audit office to an SEC regional office on audit quality, measured by future financial
restatements. At first glance, this proximity seems to result in more scrutiny at the office

233
level, with fewer financial restatements occurring. However, during workload
compression busy seasons, the relationship between the proximity of the audit office to
an SEC regional office and financial restatements becomes positive, possibly indicating
that workload pressure has a more intense effect on auditors than SEC pressure. This
finding could be important in helping the PCAOB understand the impact of pressure on
auditors and audit quality.
There are several limitations to the research presented in this study. First, the data
and sample for the Big 4 office personnel comes from LinkedIn, a public website with
profiles populated by individuals; therefore, it is possible that the LinkedIn profiles are
inaccurate or embellished. While this study incorporates numerous validation tests of the
LinkedIn data, it is possible that there may still be errors. However, because researchers
are constantly looking for new ways to incorporate atypical sources of data (e.g.
LinkedIn, Glassdoor, Facebook), future studies should continue to search for additional
methods to validate sources of atypical data.
Second, the LinkedIn data is extracted at one moment in time (November
2017January 2018), but based on disclosures (e.g., time in position, previous work
history) was codified to examine a sample period from 2011-2018, which may result in
incorrect conclusions. This study has provided a comparison of Compustat and Audit
Analytics data for 2017-2018 for additional assessment. Future research should continue
to extract LinkedIn data annually, so that the personnel data can be matched and
compared to audit client data on a year-for-year basis.
Third, because of the sources of public data used in this study, the client sample
relates to publicly traded companies only. These companies are primarily large in nature
and typically are domiciled in the U.S. Therefore, the results may not be generalizable to

234
private companies, smaller companies, or non-U.S. companies. Future research should
explore the impact of Big 4, non-Big 4, and/or non-U.S. Big 4 auditor human capital,
auditor experience and education, and auditor workload on private companies and/or
foreign companies.
Fourth, this study analyzes auditor human capital, auditor experience and
education, and auditor workload compression for the Big 4 firms in total. It is possible
that the results might change when evaluating each Big 4 firm separately. Future
research should perform detailed analysis on the impact of auditor human capital, auditor
experience, and auditor workload compression on audit quality separately for each Big 4
firm after obtaining a larger sample for each Big 4 firm.
Finally, this study may contain omitted variables which, if included, could
influence the results of the analysis, such as using alternative audit client information to
proxy for measures of audit quality. Future studies should consider using discretionary
accruals as a proxy measure of audit quality, while acknowledging its limitations. In
addition, both the data samples for office personnel and for the audit clients may contain
missing or incomplete data, resulting in a reduction to the final sample. For example, the
search of LinkedIn data may find no profiles for auditors in a particular office, when in
fact that office exists. In a case such as this, the office has to be excluded from the
sample of personnel, which may influence the results and conclusions.
Despite the limitations, this study makes several important contributions to the
audit literature. First and foremost, this study is among the first to examine in detail the
personnel characteristics of all staffing levels at each Big 4 office in the U.S. Second, it
gives additional insight into the inputs affecting audit quality that historically have been
measured using proxy variables. Third, it answers the call from researchers to find and

235
use alternative sources of information that will continue to advance the audit quality
literature. In summary, this study presents audit quality evidence that should benefit
audit researchers, regulators, and audit firms.

