

discussion post
 BrittanyB
Assignment Details
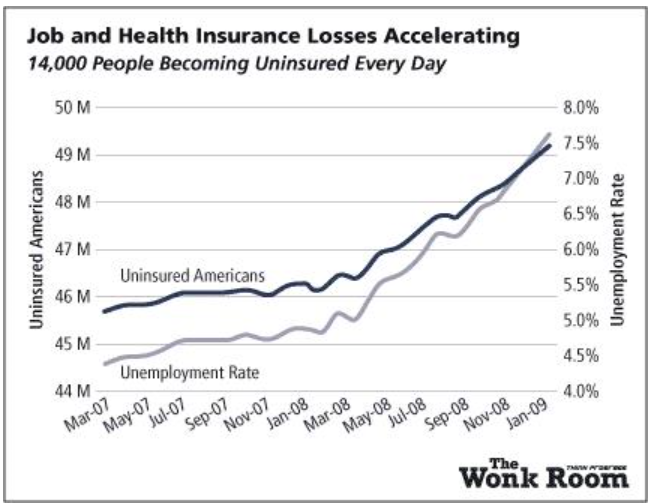
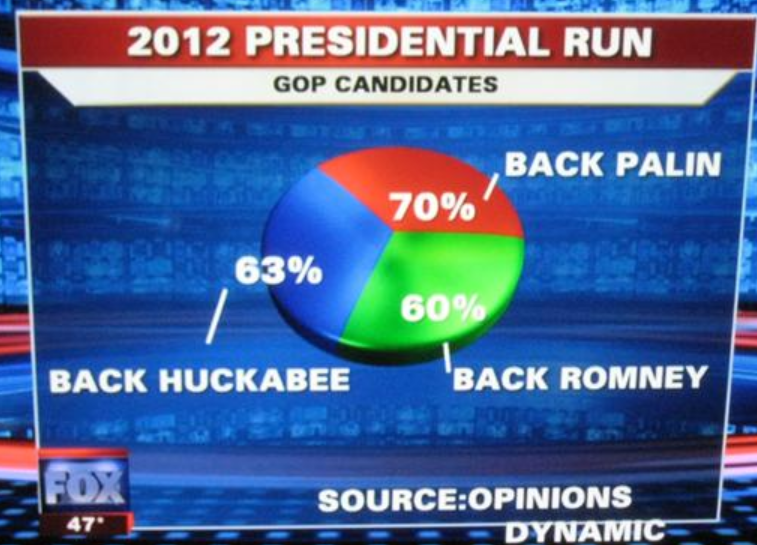
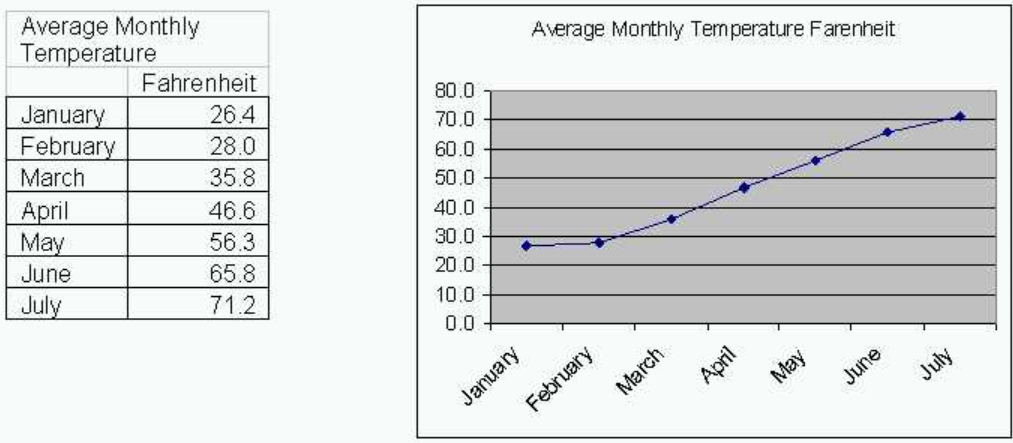
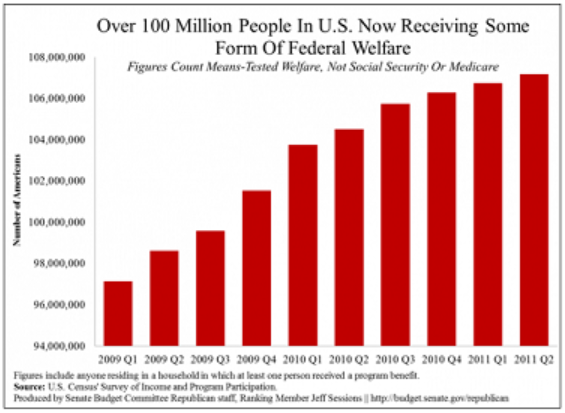
Statistics and related graphs are commonly used in the news, advertising, and debates to illustrate and support a specific viewpoint. These statistics and graphs can often be used to mislead or misrepresent the actual data.
Choose 1 of the graphs below, and discuss the following in your main post:
- Why do you consider the graph misleading?
- What should be changed or added to the graph to make the information accurate?
Respond to 2 classmates who chose a different graph than you. In your response, consider finding something different that you would change or why you think the graph was set up the way that it was.
(Stephanie, 2014)
For assistance with your assignment, please use your text, Web resources, and all course materials.
Reference
Stephanie. (2014, January 24). Misleading graphs: Real life examples [Images]. Retrieved from https://www.statisticshowto.datasciencecentral.com/misleading-graphs/
 4 years ago
 5
5
Purchase the answer to view it

 MISLEADINGGRAPHS1.docx
- DISPO1.pdf
- unit iv tet
- Assignment 2: The Struggle for Freedom and Equality in the 20th CenturyDue 3/5/2016As illustrated within the text, the twentieth century saw highs and lows in the arena of civil rights for African-Americans. At every opportunity—whether through war or leg
- OL 211 Final Project Complete Solution
- This article discusses earnings management in the post-SOX period. Please answer the following questions in about 3-4 pages double spaced in total. 1. Explain the purpose of the article, the method used by the author to conduct the study and the overall
- HCA 205 week 3 DQ 1
- soci homework
- Social Media in Stakeholder management"
- Can someone do this college algebra
- write a journal respond to the items provided professor Anthony.
- 6 pages Community profile paper