

Discussion
 YenRose99
1.
A. Analysis of Carl’s Cookies
Step 1: Read the Scenario
SCENARIO: Carl’s Cookies, established in 2019, is a boutique bakery. Carl’s Cookies has built a loyal customer base due to its commitment to quality and unique product offerings. Carl, the owner, has a strong desire to optimize production and marketing strategies to maximize revenue and maintain high customer satisfaction. Carl has collected sample data over the past 85 weeks and wants you to analyze this data to uncover insights that can help address his questions.
Step 2: Look Over the Data
Use Carl’s Cookies Excel workbook to help you with this case, which is located here: Carl's Cookies Data
A breakdown of each column is as follows:
WeekThe chronological week in which data was collected.YearThe year in which data was collected.QuarterThe financial quarter in which the data was collected.Gross SalesThe dollar amount of gross sales for the week.Cookies SoldThe number of cookies sold for the week.Selling Price / CookieThe amount charged per cookie.Snickerdoodles SoldHow many snickerdoodle cookies were sold that week.Peanut Butter SoldHow many peanut butter cookies were sold that week.Pumpkin SoldHow many pumpkin cookies were sold that week.Sugar SoldHow many sugar cookies were sold that week.Oatmeal Raisin SoldHow many oatmeal raisin cookies were sold that week.White Choc. Mac. SoldHow many white chocolate macadamia cookies were sold that week.Gingerbread SoldHow many gingerbread cookies were sold that week.Black and White SoldHow many black and white cookies were sold that week.Macaron SoldHow many macarons were sold that week.Cost to Make CookiesThe cost of ingredients used to make all cookies in a particular week.Labor CostThe labor cost of Carl’s Cookies for the week.Rent CostThe rent cost for Carl’s Cookies for the week.Utilities CostThe cost of all utilities for the week.Marketing CostThe amount Carl’s Cookies spent on marketing that week.Type of MarketingWhat kind of marketing Carl’s Cookies did for the week.Discounts GivenThe number of discounts Carl’s Cookies gave to customers that week.Customer Sat. RatingThe average customer satisfaction rating that week.Average Customer SpendThe amount the average customer spent that week.
ASSIGNMENT: For this touchstone, you are going to analyze the sample data using the analytical techniques you have learned in Challenges 1.2, 2.1, and 2.2 and present your findings as a PowerPoint presentation. Your audience is Carl, the owner of Carl’s Cookies. You should answer all of Carl’s questions in your presentation. Your analysis should be presented in a PowerPoint presentation that includes speaker notes, which explain your points. Use visualizations to summarize your findings.
Step 3: Read Carl's Questions
Question 1: Carl is offering several cookie varieties. He wants to optimize his operations by identifying underperforming cookies. Carl has provided you with sales data, including weekly cookie sales and selling prices, as well as associated costs. After analyzing customer feedback, Carl found trends in customer satisfaction:
- Peanut Butter Cookies: Consistently receive the lowest satisfaction ratings, with complaints about dryness and lack of flavor.
- Pumpkin Cookies: Average satisfaction ratings, with some customers mentioning they are too seasonal for year-round appeal.
- Macaron Cookies: Not always everyone’s favorite but have good customer satisfaction ratings overall.
Using the provided sales data, create a PivotTable (format as a heatmap) and a PivotChart of units of cookies sold by cookie type. Based on your findings and the customer feedback Carl supplied, recommend whether Carl should continue (or discontinue), improve, or expand production of specific cookie varieties. Specifically make sure to identify underperforming cookies using sales data, recommend whether to continue, improve, or discontinue specific varieties. (Slide #2)
Question 2: Carl wants to understand how his marketing strategies (flyer, coupon, tv, radio, and shopper) boost his store's sales. He has gathered data on the different marketing campaigns, including total gross sales, number of cookies sold, and marketing costs for each campaign. He gives you the following information about marketing to consider:
- The competition spends 10% of their gross sales on marketing.
- Carl spends about 7% of his gross sales on marketing.
- Studies show if Carl moves to social media marketing, he can cut his marketing costs to $300 per week, but he will also incur a 5% drop in gross sales.
Carl is seeking your assistance to analyze the effectiveness of these marketing strategies based on total gross sales, average gross sales per marketing media, and gross sales generated per marketing dollar spent. Visualize which type of marketing is the most effective overall and which one performs best on average. Based on the data and Carl’s insights, should he adjust his marketing strategy? (Slide #3)
Question 3: Carl is looking to understand the financial trends of his business and how he can navigate them while boosting weekly net income. He has provided data on his gross profit and all associated costs over several months. After reviewing costs for his business, Carl provides you with the following information:
- Selling Price per Cookie: Has remained unchanged at $3.50 for the past two years, but he is thinking about raising the price to $4.00 to keep up with rising costs.
- Utilities Cost: Generally stable, but there are rumors of rate hikes of 10%.
- Cost to Make Cookies: Variable, often influenced by inflation and commodity pricing. It is expected that these costs will increase by 6% in the next 12 months.
Carl is asking for your help to analyze his income trends, specifically focusing on net income (Net Income = Gross Profit – All Costs). Specifically, he wants to identify trends considering the following scenarios:
- Current weekly net income
- New weekly net income if he raised his prices to $4 per cookie and there are no cost increases
- The increase in weekly net income if prices increase to $4 per cookie but costs do not increase
- New net income per week if both costs and price of cookies increase
Based on this data, how could changing price and cost factors impact his overall profitability? Using the data and the information Carl provided, what are your recommendations to boost weekly net income? (Slide #4 and calculations on Slide #5)
Question 4: Carl is interested in understanding customer spending habits at his store. He has collected data on the average amount each customer spends per week. Carl notices the following trends:
- High-Spending Customers: A small percentage of customers make large purchases regularly (between $34 and $35).
- Moderate-Spending Customers: The majority of customers spend a consistent, moderate amount each week (between $28-$33). These customers can usually be upsold by $2-$3 per customer if deals are offered.
- Low-Spending Customers: Customers who make infrequent purchases ($27 or less) are often more demanding and want to sample cookies, increasing costs.
Carl is seeking your assistance to analyze the distribution of the average amount a customer spends per week. He wants to learn what insights can be drawn from this data to better understand customer behavior and improve his profit margin. What recommendations can you give, based on the data? (Slide #6)
Question 5: Carl wants to gain insight into the performance of his business throughout the year and has provided data on his gross sales in the spreadsheet. Carl’s business goals are:
- To attain quarter-over-quarter growth in gross sales of 5%
- To mediate any quarterly declines in sales
- To have his geometric mean per year average 5%
Based on the trend and geometric mean data you calculated and Carl’s goals, should Carl raise his prices, reduce the costs of the ingredients he uses in his cookies, or both? (Slide #7)
Question 6: In 2023, Carl began a discount incentive to help increase customer satisfaction. The incentive is that for any order over $30, the customer would receive 10% off their entire order. Carl has collected data on the number and cost of discounts given each week and the corresponding average customer satisfaction ratings. Carl wonders:
- Should I continue with the discounts?
- Are the costs of the discounts worth any potential increases in customer satisfaction?
- What if I discontinue the discounts?
Carl is seeking your assistance in determining the strength of any relationship between the number of discounts he gives each week and their corresponding customer satisfaction scores. Using this data, what advice would you give him that would answer his questions about the discounts? (Slide #8 and show calculations on Slide #9)
Question 7: Every quarter, Carl often ends up ordering too many ingredients because he does not have a valid model to reference for purchases. In addition, some ingredients for his cookies need a longer lead time to order. Because of these issues, Carl needs to understand the relationship between the business quarter and the type of cookies sold in that quarter. He has gathered data on the number of each type of cookie sold across the four business quarters for 2023. Carl has the following questions:
- Is there an effective model I can use to help me order ingredients?
- Are type of cookie and quarter sold dependent variables?
- Should I use the data I observed as a guide to help me order ingredients in the future?
Carl is seeking your assistance to analyze whether there is a significant association between the business quarter and the type of cookie sold. Based on the data, does Carl have a strong model he can use as a guide to order ingredients for upcoming quarters? (Slide #10)
Step 4: Analyze the Provided Excel Dataset to Derive Insights
You should answer all of Carl’s questions in your presentation. Here is a basic template with slide headers that you can use, but it is not required.
Carl’s Cookies - StudentTemplate with guidance.pptx
Make sure to use visuals (graphs, tables, heatmaps) to enhance your findings. At minimum you should have 11 slides.
- Slide 1 – Title Slide
- Slide 2 – Question 1 on Product Performance Analysis
- Which cookies are underperforming, and what should Carl do?
- Analyze weekly sales and customer satisfaction ratings.
- Recommend whether Carl should discontinue, improve, or expand certain varieties.
- Slide 3 – Question 2 on Marketing Strategy Evaluation
- Slide 4 – Question 3 on Financial Trends Analysis
- Slide 5 – Excel Calculations for Financial Trends for Question #3
- Slide 6 – Question 4 on Customer Spending Behavior
- Slide 7 – Question 5 on Quarterly Sales Performance
- Slide 8 – Question 6 on Discount Incentive Effectiveness
- Slide 9 – Excel Calculations for Discounts for Question 6
- Slide 10 – Question 7 on Ingredient Ordering Model
- Slide 11 – Summary and Recommendations for Carl Slide
Step 5: Add Speaker Notes Explaining Your Methodology, Analysis, and Recommendations
Your analysis should be presented in a PowerPoint presentation that includes speaker notes, which should clearly explain your analysis and recommendations.
Speaker notes for each question should address the following:
- The data you used (and why you used that data) to answer the question.
- A justification of why you chose the data visualization you used.
- A detailed explanation of how the data supports your answer.
- The rationale of any calculations you made, if any.
Step 6: Review the Grading Rubric to Ensure All Criteria are Met
Review the rubric to ensure that you understand how you will be evaluated. Also review the requirements to ensure that your Touchstone is complete.
Step 7: Submit Your Touchstone
Submit your completed Touchstone (as a .pptx file) using the blue button at the top of this page.
B. Rubric
Advanced (100%)Proficient (85%)Acceptable (75%)Needs Improvement (50%)Non-Performance (0%)
Completeness of Responses to Carl’s Questions
All seven of Carl’s questions have been answered fully and accurately. Each question is weighted equally within this category. (25%)All 7 questions are thoroughly answered with detailed analysis and appropriate conclusions for each. There is clear evidence of deep understanding and insight.5-6 questions are fully answered, with minor gaps or incomplete interpretations in some areas. Overall analysis and conclusions are solid, though some areas could be improved.3-4 questions are answered, but significant gaps in the analysis or reasoning exist. The work demonstrates basic understanding but lacks depth in several areas.1-2 questions are answered, or most answers show a lack of thoroughness, accuracy, or completeness. The analysis is superficial or incorrect in several areas.None of the questions are adequately answered, or all answers are entirely missing depth, accuracy, and completeness.
Data Accuracy, Analytical Techniques, and Use of Excel
Data analysis is accurate, appropriate analytical techniques were used (as learned in Challenges 1.2 through 2.2), and Excel was used effectively to perform the analysis. (30%)All data calculations and analyses are accurate, and appropriate analytical techniques (e.g., statistical methods, trend analysis) are used for each of Carl’s 7 questions. Excel is used effectively and efficiently throughout the analysis with no errors.Most analyses are correct, with minor errors or incomplete application of analytical techniques in some cases. Excel is used effectively, though some areas could be optimized for better efficiency.Some analyses contain errors or misinterpretations, and the appropriate analytical techniques are not consistently applied. Excel is used, but with noticeable inefficiencies or mistakes.Several analyses are inaccurate or misinterpreted, and the appropriate analytical techniques are frequently misapplied. Excel usage is flawed, and its application to the analysis is limited or incorrect.Most analyses are inaccurate or missing. Analytical techniques are either not applied or applied incorrectly, and Excel is used minimally or not at all.
Presentation Design & Use of Appropriate Visualizations
The design of the presentation is effective, with a specific focus on whether the most appropriate visualizations (charts, graphs, etc.) are chosen to best represent the analysis for each of Carl’s 7 questions. (20%)Each of Carl’s 7 questions is accompanied by the most appropriate and effective visual (e.g., bar chart, line graph, pie chart, scatter plot, etc.), clearly and accurately communicating the analysis. The choice of visual is based on best practices for data representation, enhancing the clarity and impact of the presentation.Most questions are accompanied by appropriate visuals that support the analysis, though some may not fully align with the optimal choice for data representation. The overall presentation remains clear and effective.Visuals are included for most questions, but several do not represent the data in the best possible way, leading to reduced clarity and effectiveness of the analysis. Some improvement in visual selection is needed.Visuals are present for only a few questions, and many of them are not the best choice for effectively communicating the data. The analysis lacks clarity due to inappropriate or poorly designed visuals.Visuals are missing for most or all questions, or the chosen visuals are ineffective and fail to support the analysis. The presentation does not clearly communicate the data.
Clarity and Insightfulness of Speaker Notes
Speaker notes clearly explain the analysis for each of Carl's 7 questions, offering insights, recommendations, and detailed explanations. (15%)Speaker notes are thorough, insightful, and clearly explain the analysis for each of Carl’s 7 questions. They provide detailed explanations, relevant insights, and actionable recommendations, demonstrating a deep understanding of the data and findings.Speaker notes are clear and adequately explain the analysis for most of Carl’s questions. Some minor gaps in detail or insights may exist, but the recommendations are generally relevant and supported by the data.Speaker notes provide explanations for some of Carl’s questions but may lack depth or clarity. Several explanations may be incomplete, and insights or recommendations are either minimal or not strongly linked to the data.Speaker notes are incomplete, unclear, or lacking depth for most of Carl’s questions. The analysis is not well-explained, and the insights or recommendations are shallow or only marginally related to the data.Speaker notes are largely absent or fail to explain the analysis effectively for the majority of Carl’s questions. Recommendations, if provided, are irrelevant or not data driven.
Technical Execution & Use of Excel
Technical aspects of the project are accurate and complete, including correct calculations, adherence to the PowerPoint structure, and the effective use of Excel for analysis. (10%)All calculations are correct, and Excel is used efficiently and effectively for data analysis, including appropriate use of formulas, charts, and other tools. The presentation fully adheres to all assignment requirements, including slide structure and file format.Most calculations are correct, with only minor errors. Excel is generally used effectively, though some inefficiencies or minor mistakes may be present. The presentation follows most assignment requirements, with slight deviations in slide structure or format.Some calculations are incorrect, and Excel is not fully utilized effectively in parts of the analysis. Several assignment requirements are missing or incomplete, such as the correct number of slides or proper file format.Many calculations are incorrect, and Excel is used poorly or only partially. Numerous assignment requirements are not met, and the presentation does not align with key structural or formatting expectations.Most or all calculations are incorrect, and Excel is either not used or used ineffectively. The majority of assignment requirements, such as slide structure and file format, are not fulfilled.
C. Requirements
The following requirements must be met for your submission:
- Hand in a .pptx file with slides listed above.
- Use a readable 11- or 12-point font.
- All writing must be appropriate for an academic context. Follow academic writing conventions (correct grammar, spelling, punctuation, and formatting).
- Plagiarism of any kind is strictly prohibited.
- Submission must include your name and the date (included in the template).
This assignment provides a practical experience in business analytics, honing skills essential for data-driven decision-making in business environments. Your analysis and recommendations will help Carl optimize his operations and improve profitability.
Good luck, and enjoy uncovering insights for Carl's Cookies!
2.
A. Analysis of TechGear Inc.
Step 1: Read the Scenario
SCENARIO: As a data analyst at TechGear Inc., a company specializing in electronic gadgets and accessories, your task is to analyze historical sales data, build predictive models, and use prescriptive analytical methods to provide actionable insights for improving decision-making. The company has been experiencing fluctuating sales and aims to optimize its marketing strategies and production processes to maximize profits and enhance customer satisfaction. Your analysis will help TechGear Inc. understand the factors influencing its sales, forecast future sales trends, assess financial risks associated with different business scenarios, and determine the optimal allocation of its marketing budget and production resources. Ultimately, your work will enable the company to make data-driven decisions, enhancing its sales and marketing strategies, and leading to improved profitability and customer satisfaction.
Step 2: Look Over the Data
- Questions 1-5 (Linear Regression) and 7 (Machine Learning): Use the data in the techgear_sales_data.xlsx Excel file, which can be found at the following GitHub link:
https://raw.githubusercontent.com/sophiaAcademics/BDA_Excel/main/StudentData/Assessments/Unit6/TechGearTouchstone/techgear_sales_data.xlsx - Question 6 (Forecasting): Use the data in the techgear_sales_data_monthly.xlsx Excel file, which is available at this GitHub link:
https://raw.githubusercontent.com/sophiaAcademics/BDA_Excel/main/StudentData/Assessments/Unit6/TechGearTouchstone/techgear_sales_data_monthly.xlsx
This file contains the same data as techgear_sales_data.xlsx, but the last row only includes a date with missing values for all other columns. These missing values are intended for you to apply forecasting methods for the upcoming time period. - Questions 8 and 9: Since Question 8 focuses on Monte Carlo simulations and Question 9 focuses on linear programming, all necessary data is provided in the problem statement.
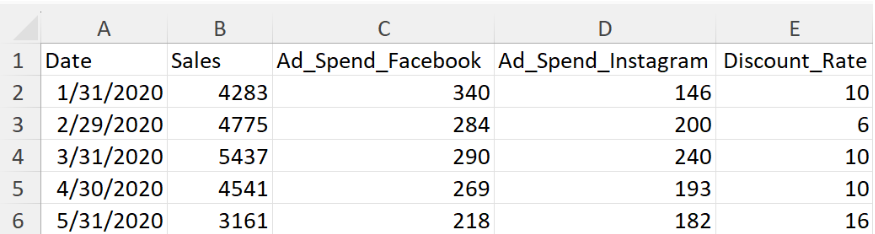
This dataset contains monthly sales and advertising spend data for TechGear from January 2020 to December 2024. It includes the following columns:
Column NameDescriptionUnit/FormatDateThe month and year for each data entryMM/DD/YYYYSalesThe total sales generated in that monthNumber of SalesAd_Spend_FacebookThe amount of money spent on Facebook advertising in that monthDollarsAd_Spend_InstagramThe amount of money spent on Instagram advertising in that monthDollarsDiscount_RateThe discount rate applied to sales in that monthPercentage
A snapshot of the first few rows of the dataset is provided below:
Step 3: Read TechGear Inc. Questions
Question 1: Exploring Data Structures and Averages in Advertising Spend and Discounts
Before conducting an analysis, use Python to create a pandas DataFrame named sales from the dataset.
- What key features of the dataset can you summarize, such as the number of rows and columns?
- What is the average amount spent on advertising for each social media platform (Facebook and Instagram)?
- What is the average discount provided to customers?
- What insights can you draw from this summary regarding advertising spend and discount trends?
Question 2: Visualizing Relationships
- How can you visualize the relationships between sales and each advertising spend variable (Facebook and Instagram) as well as discount rates?
- What types of plots (e.g., scatter plots, line plots, or histograms) would be most effective in identifying patterns or correlations between these variables?
- What do these visualizations reveal about the impact of advertising spend and discount rates on sales?
Question 3: Simple Linear Regression
TechGear wants to optimize its marketing strategy.
- How can you develop a simple linear regression model in Python to predict sales based on Facebook ad spend?
- What do the coefficients of the model indicate?
- Specifically, how does the slope describe the relationship between Facebook ad spend and sales?
- What does the R² value tell you about how well the model explains the variability in sales?
- How does the regression output from Python support your interpretation of the model’s performance?
Question 4: Assessing the Fit of the Simple Linear Regression Model
- How can you evaluate the performance of your simple linear regression model by analyzing residuals?
- What insights do residual plots provide about the model’s accuracy?
- Do they suggest any patterns, heteroscedasticity, or violations of linear regression assumptions?
- How might these findings impact the reliability of the model’s predictions?
Question 5: Multiple Linear Regression Model
The simple linear regression model provides insights into Facebook ad spend.
- How can you develop a multiple linear regression model to predict monthly sales using Facebook ad spend, Instagram ad spend, and discount rates?
- How do the coefficients of this model compare to the simple linear regression model? What do they reveal about the combined influence of these factors on sales?
- Which model performs better in predicting sales?
- How can you compare the effectiveness using statistical metrics (such as R² and RMSE)?
- Based on this comparison, what recommendations can you provide to TechGear for optimizing its advertising strategy?
Question 6: Forecasting
Using historical sales data, how can you construct:
- A 3-month moving average forecast for January 2025?
- An exponential smoothing forecast with a smoothing parameter of 0.80 for January 2025?
Given TechGear’s preference for emphasizing recent sales trends:
- Which forecasting method provides the most reliable prediction for January 2025?
- What key differences exist between the two forecasting methods, and what do they imply for forecasting accuracy?
Based on your analysis, consider:
- What actionable recommendations can you provide to TechGear to improve its marketing strategies and production planning?
Question 7: TechGear needs a reliable model to predict future sales.
- How can you build and compare different predictive models to achieve this?
- How can you develop a multiple linear regression model using 5-fold cross-validation to predict future sales?
- How can you develop a decision tree model using 5-fold cross-validation to predict future sales?
- How do the two models compare in terms of RMSE, and which model should TechGear choose?
TechGear requires a minimum of $6,500 in sales each month to remain profitable.
- If the best model predicts sales of $4,200, how can the RMSE value be used to determine the range within which actual sales may fall?
- What are the implications of this for decision-making and risk assessment?
Question 8: Monte Carlo Simulations
TechGear has experienced significant fluctuations in sales, making accurate predictions challenging.
- How can you use Monte Carlo simulations to estimate future sales?
- How can you estimate the average and median monthly sales by running 1,000 simulations?
- What visuals (e.g., histograms or box plots) can you generate to summarize the results?
- If daily sales are assumed to follow a uniform distribution between the minimum and maximum observed sales over the past 60 months, how does this impact the simulation results? You can assume that the value for minimum sales observed over 60 months is 2,299 and the maximum value is 7,702.
- How can you interpret the standard deviation of simulated sales, and what does it reveal about TechGear’s sales variability?
- How can TechGear use these insights to improve budgeting, sales forecasting, and operational decision-making?
Question 9: Linear Programing
TechGear wants to optimize its advertising spend across Facebook and Instagram to maximize its monthly sales. They have a fixed advertising budget and need to determine the optimal allocation of this budget to achieve the highest possible sales. The sales generated from advertising on each platform are influenced by the amount spent on that platform.
TechGear has a monthly advertising budget of $10,000. The estimated sales generated from advertising on Facebook and Instagram are given by the following linear equations:
- Sales from Facebook advertising:
 where F is the amount spent on Facebook advertising
 - Sales from Instagram advertising:
 where I is the amount spent on Instagram advertising
TechGear has a monthly advertising budget of $10,000. They must spend at least $2,000 on Facebook advertising to maintain its presence on the platform. Additionally, they must spend a minimum of $1,000 and no more than $7,000 on Instagram advertising due to platform-specific constraints. The amount spent on Instagram advertising should be at least 50% of the amount spent on Facebook advertising to ensure balanced marketing efforts.
- What is the optimal budget allocation for Facebook and Instagram, and what is the maximum sales revenue TechGear can achieve under these conditions?
Step 4: Using the PowerPoint Template, Analyze Data for TechGear Inc.
- Your task is to analyze historical sales data for TechGear Inc. using various analytical techniques.
- You’ll apply concepts from linear regression, forecasting, machine learning, and prescriptive analytics.
- The goal is to provide actionable insights to help TechGear make data-driven decisions.
- Include Python code snippets in your slides for data exploration, regression models, forecasting, machine learning, Monte Carlo simulation, and linear programming tasks.
- Your Python code should be accurate and well-documented to demonstrate how each analysis step was performed.
- Your findings will be presented in a PowerPoint presentation, with speaker notes explaining your approach and insights.
Review each question and then follow the directions outlined on each slide to summarize and present your findings for each question.
Step 5: Review the Grading Rubric to Ensure All Criteria are Met
Review the rubric to ensure that you understand how you will be evaluated. Also review the requirements to ensure that your Touchstone is complete.
Step 6: Submit Your Touchstone
Submit your completed Touchstone (as a .pptx file) using the blue button at the top of this page.
B. Rubric
Advanced (100%)Proficient (85%)Acceptable (75%)Needs Improvement (50%)Non-Performance (0%)
Python Analysis (Shown at Key Steps)
The inclusion of well-documented, accurate Python code for data exploration, regression models, forecasting, machine learning, Monte Carlo simulation, and linear programming. (5%)Python code is shown for all major steps, including data exploration, visualization, regression models, forecasting, machine learning, Monte Carlo simulation, and linear programming. Code is well-documented and accurate.Python code is shown for most key steps. Minor issues with code documentation or accuracy.Python code is shown for some steps, but critical components are missing or incomplete.Python code is partially shown but lacks key analyses or is significantly incorrect.No Python code is provided.
Data Exploration and Summary (Slide 2)
Clear summary of data structure, accurate calculation of averages, and key insights from data exploration. Python analysis is included and well-integrated. (10%)There is a comprehensive summary of data structure with accurate calculation of averages and clear insights from the exploration. Python analysis is included and well-integrated.Data summary is mostly accurate, with minor errors or missing insights. Python analysis is included.Basic summary provided, but some key features are missing or inaccurate. Python analysis is incomplete.Minimal data exploration with several inaccuracies and no significant insights. Python analysis is missing or incorrect.No data exploration is provided.
Visualizing Relationships (Slide 3)
Accurate and clear visualizations showing relationships between sales, ad spend, and discount rate. Proper interpretation of patterns and correlations. (10%)Clear and accurate visualizations for all specified variables with detailed insights into patterns and correlations. Python-generated plots are used.Visualizations are mostly accurate and provide useful insights. Minor errors in interpretation or plot generation.Basic visualizations are provided, but significant patterns or correlations are overlooked. Python plots are incomplete.Visualizations are unclear or inaccurate with limited analysis. Missing Python plots.No visualizations are provided.
Simple Linear Regression & Model Fit (Slides 4 & 5)
Well-implemented regression model with correct interpretation of coefficients and R² value. Assessment of model fit through residual analysis. (10%)Accurate regression model with clear interpretation of coefficients and R² value. Residual plots are well-explained, and the fit is thoroughly assessed. Python output included.Regression model and assessment are mostly accurate, with minor errors or incomplete explanations.Basic model output provided, but interpretations and model fit assessments are incomplete or contain errors.Model is poorly developed, with incorrect interpretations and no reliable assessment of fit.No regression model or assessment is provided.
Multiple Linear Regression (Slide 6)
Complete multiple regression analysis, including variable interpretation and comparison to simple regression. Python output included. (10%)Complete and accurate multiple linear regression analysis, with well-explained coefficients and comparison to the simple linear regression model. Python output included.Multiple regression analysis is mostly accurate, with minor errors or incomplete comparisons.Basic multiple regression is provided, but interpretations and comparisons are incomplete or partially inaccurate.Incomplete or incorrect multiple regression model with minimal explanation.No multiple regression model is provided.
Forecasting (Slide 7)
Implementation of both forecasting methods, clear comparison, and justified selection of the best method based on business needs. (10%)Both forecasting methods are accurately implemented and compared. The recommendation is well-justified and aligned with TechGear’s preferences. Python output included.Forecasting analysis is mostly accurate, with minor errors or incomplete justification of the chosen method.Basic forecasting analysis is provided, but one method may be missing, or justification is unclear.Minimal forecasting analysis with significant errors and no clear recommendation.No forecasting analysis is provided.
Machine Learning Models (Slide 8)
Accurate implementation of multiple regression and decision tree models with RMSE comparison and well-supported model selection. (10%)Both models are accurately built and compared using RMSE. Clear model recommendation with actionable insights. Python output included.Machine learning analysis is mostly accurate, with minor errors in the comparison or recommendation.Basic models are provided, but the comparison and recommendation are incomplete or unclear.Models are incomplete or contain major errors. Limited or no comparison is provided.No machine learning analysis is provided.
Monte Carlo Simulations (Slide 9)
Simulation correctly executed with proper assumptions, visualizations, and interpretation of results. Actionable insights are provided. (10%)Simulation is well-executed with clear visualizations and interpretation of results. Actionable insights are provided. Python output included.Simulation is mostly accurate, with minor errors or incomplete insights.Basic simulation is provided, but interpretation is incomplete or unclear.Simulation is incomplete or incorrect with minimal explanation.No simulation is provided.
Linear Programing (Slide 10)
Accurate optimization model that meets constraints and clearly explains the best budget allocation for maximum sales. (10%)Linear programming solution is accurate and fully meets all constraints. Clear explanation of the optimal budget allocation and maximum achievable sales. Python output included.Solution is mostly accurate, with minor errors in constraints or explanation.Basic linear programming solution is provided but contains errors or incomplete explanations.Incomplete or incorrect solution with minimal explanation.No linear programming solution is provided.
Presentation Quality & Speaker Notes
Well-organized slides with readable formatting and professional layout. Speaker notes effectively explain analysis and insights. (15%)Slides are visually appealing and well-organized, with clear speaker notes that thoroughly explain the analysis and findings.Slides are mostly clear and organized. Speaker notes are informative but may lack detail.Basic slides with limited visual appeal. Speaker notes are incomplete or too brief.Poorly organized slides with missing or unclear speaker notes.No presentation or speaker notes provided.
C. Requirements
The following requirements must be met for your submission:
- Hand in a .pptx file with slides listed above.
- Use a readable 11- or 12-point font.
- All writing must be appropriate for an academic context. Follow academic writing conventions (correct grammar, spelling, punctuation, and formatting).
- Plagiarism of any kind is strictly prohibited.
- Submission must include your name and the date (included in the template).
This assignment provides a practical experience in business analytics, honing skills essential for data-driven decision-making in business environments. Your analysis and recommendations will help TechGear optimize its operations,
Good luck, and enjoy uncovering insights for TechGear!

 5 months ago
 3
3
- Hsa 305
- Essay 1
- COMMENT4
- MOS 5425 Advanced Toxicology WK 8 Discussion
- ET332
- 226 SLP
- COMMENT
- Choose two (2) publicly traded companies in the same industry. I recommend you choose an industry that interests you. Provide me with paper copies of the financial statements (balance sheets and income statements) used, as well as the data source for the
- 1. What is the difference between Horizontal and Vertical Equity? 2. What is the difference between Static and Dynamic Forecasting?
- FOR EXCEPTIONAL PROFF ONLY"