


Data Analysis on Organizational Performance
The respondents were requested to rate the attributes of organizational performance
present in their respective organizations. Consequently, organizational performance
descriptive statistics were derived and the outcomes exhibited in Table 4.16.
Table 4.16 exhibits that the attribute with the highest mean is “there is the employees
have a positive attitude and deliver excellent customer service” which has a mean of
4.2700 and a standard deviation of 0.83913. The attribute with the lowest mean is “the
bank has been releasing innovative and differentiated products” which has a mean of
3.8889 and a standard deviation of 1.21125. The attributes have an overall mean of
4.1248 and a standard deviation of 1.03652, which implies that organizational
performance is exhibited to a great extent in Kenyan banks.
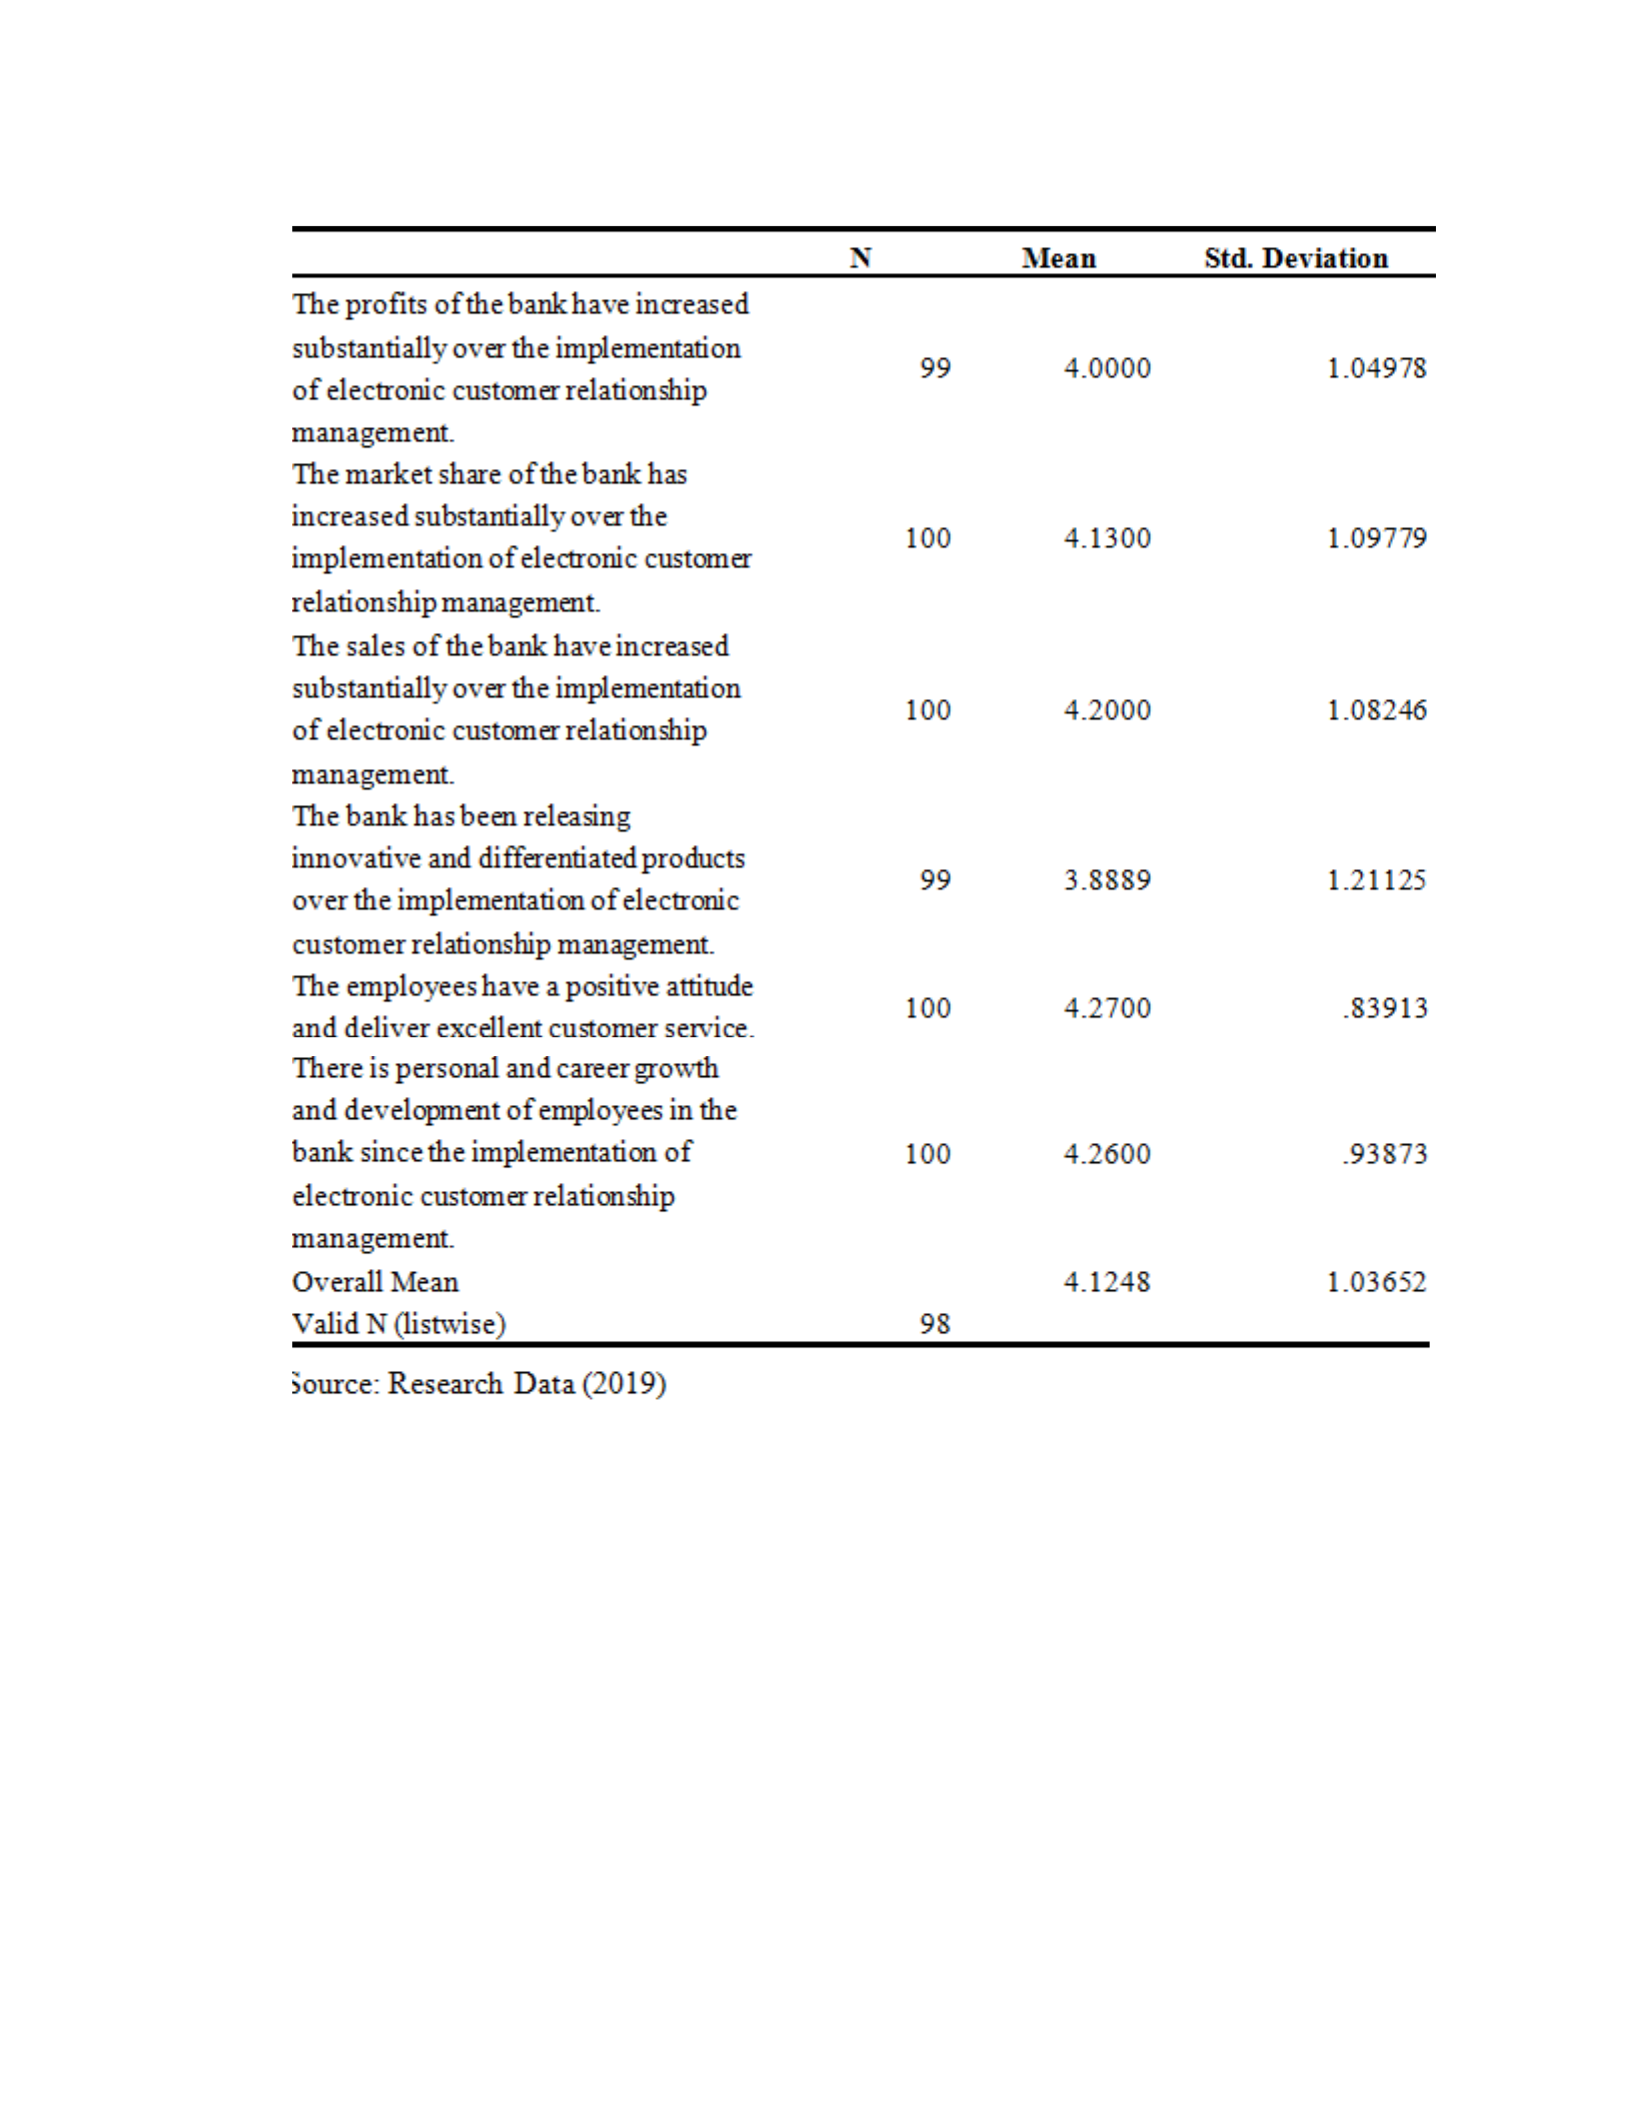
Table 4.16: Organizational Performance Descriptive Statistics
4.1 Inferential Statistics
Inferential statistics are used in determining the direction, relationship, and strength of the
relationship between the predictor variables and the response variable. The section entails
the inferential statistics employed in the study, which included correlation and regression
analysis. The attributes constituting the various variables were summarized to create a
whole variable. This was achieved by estimating the median value of all the attributes.
4.1.1 Correlation Analysis
Correlation analysis establishes whether there exists an association among two variables.
The association falls between a perfect positive and a strong negative correlation. The
study used Pearson Correlation. This study employed a Confidence Interval of 95% and a
two tail test.
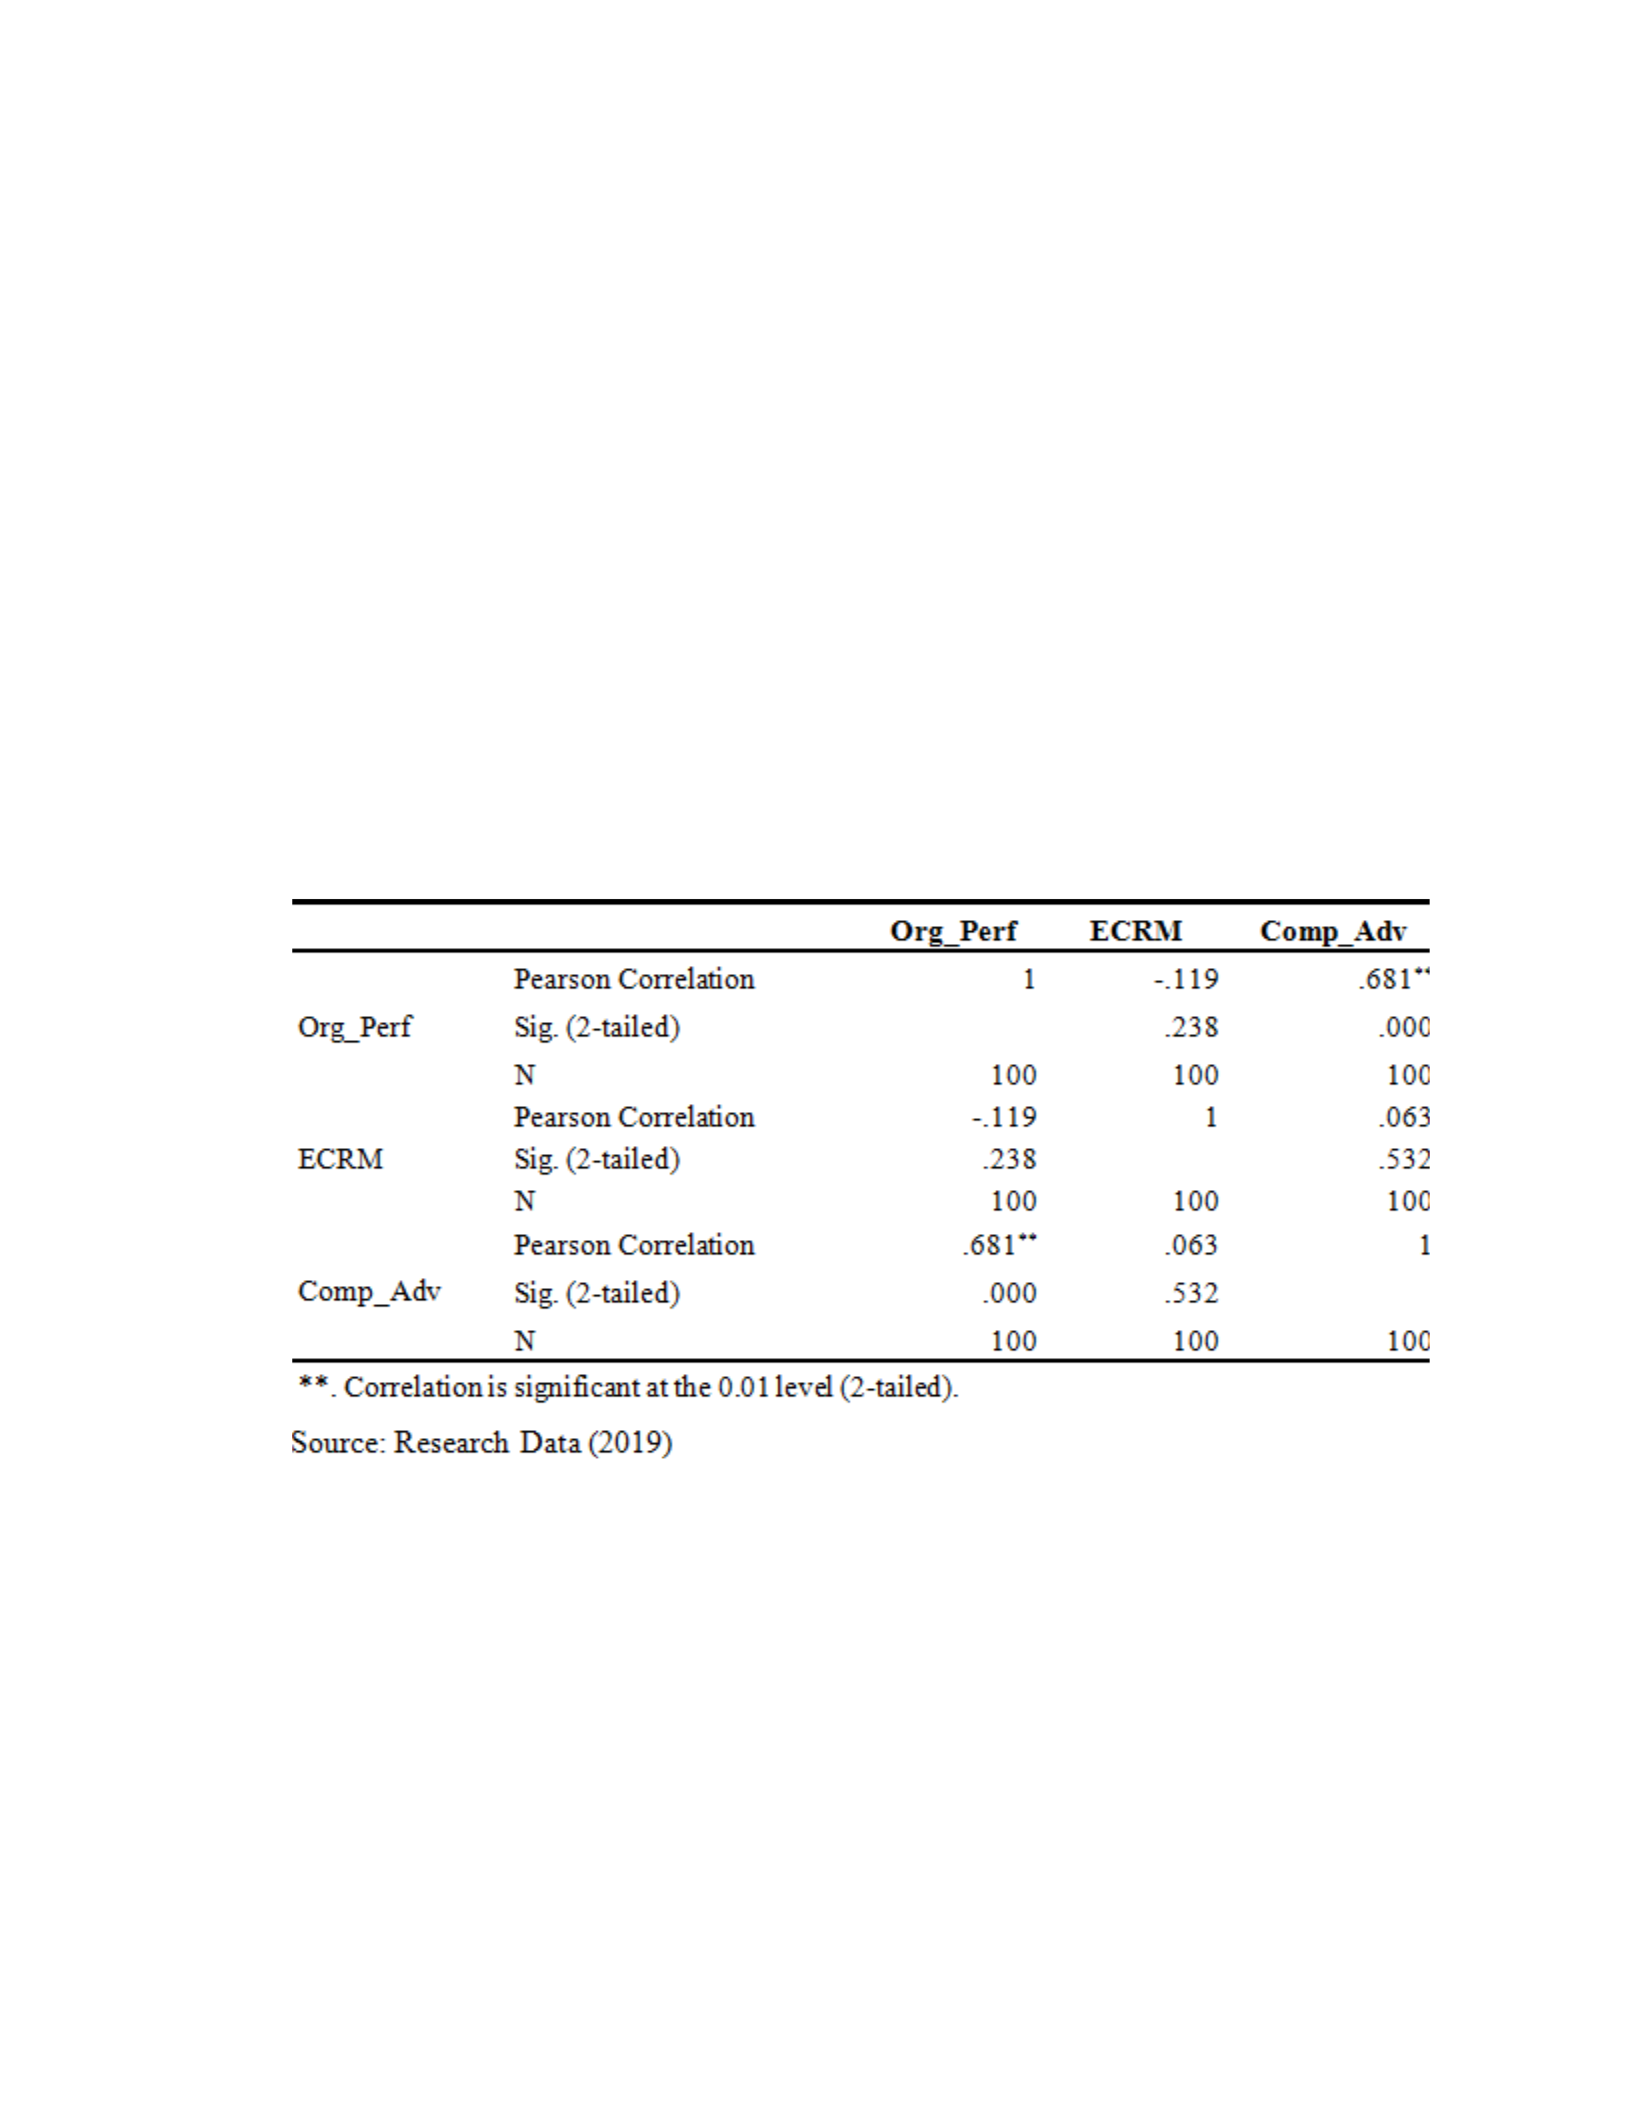
Table 4.17: Correlation Analysis
Table 4.17 displays that only competitive advantage is significantly correlated at the 5%
significance level to organizational performance. Competitive advantage has a positive
association with organizational performance.

4.1.2 Regression Analysis
The variables of the study were analyzed using the linear regression model. The
regression analysis was assumed at 5% significance level. The significance critical value
exhibited from the Analysis of Variance and Model Coefficients were compared with the
values obtained in the analysis. The main predictor variable, electronic customer
relationship management was run against organizational performance, then the
moderating variable competitive advantage was introduced. When electronic customer
relationship management was solely run against organizational performance, the findings
are presented.
Table 4.18: Model Summary
Table 4.18 showcases that the R square, in other words, the coefficient of determination,
shows deviations in the response variable as a consequence of variations in predictor
variables. From Table 4.18, the R square value is 0.014, a discovery that 1.4% of the
deviations in organizational performance are caused by electronic customer relationship
management. Other factors not incorporated in the model justify for 98.6% of the
variations in organizational performance.
When the moderating variable, competitive advantage, was introduced into the analysis,
the coefficient of determination, R Square, increases to 49%. Thus, competitive
advantage increases the explanatory power of the model.
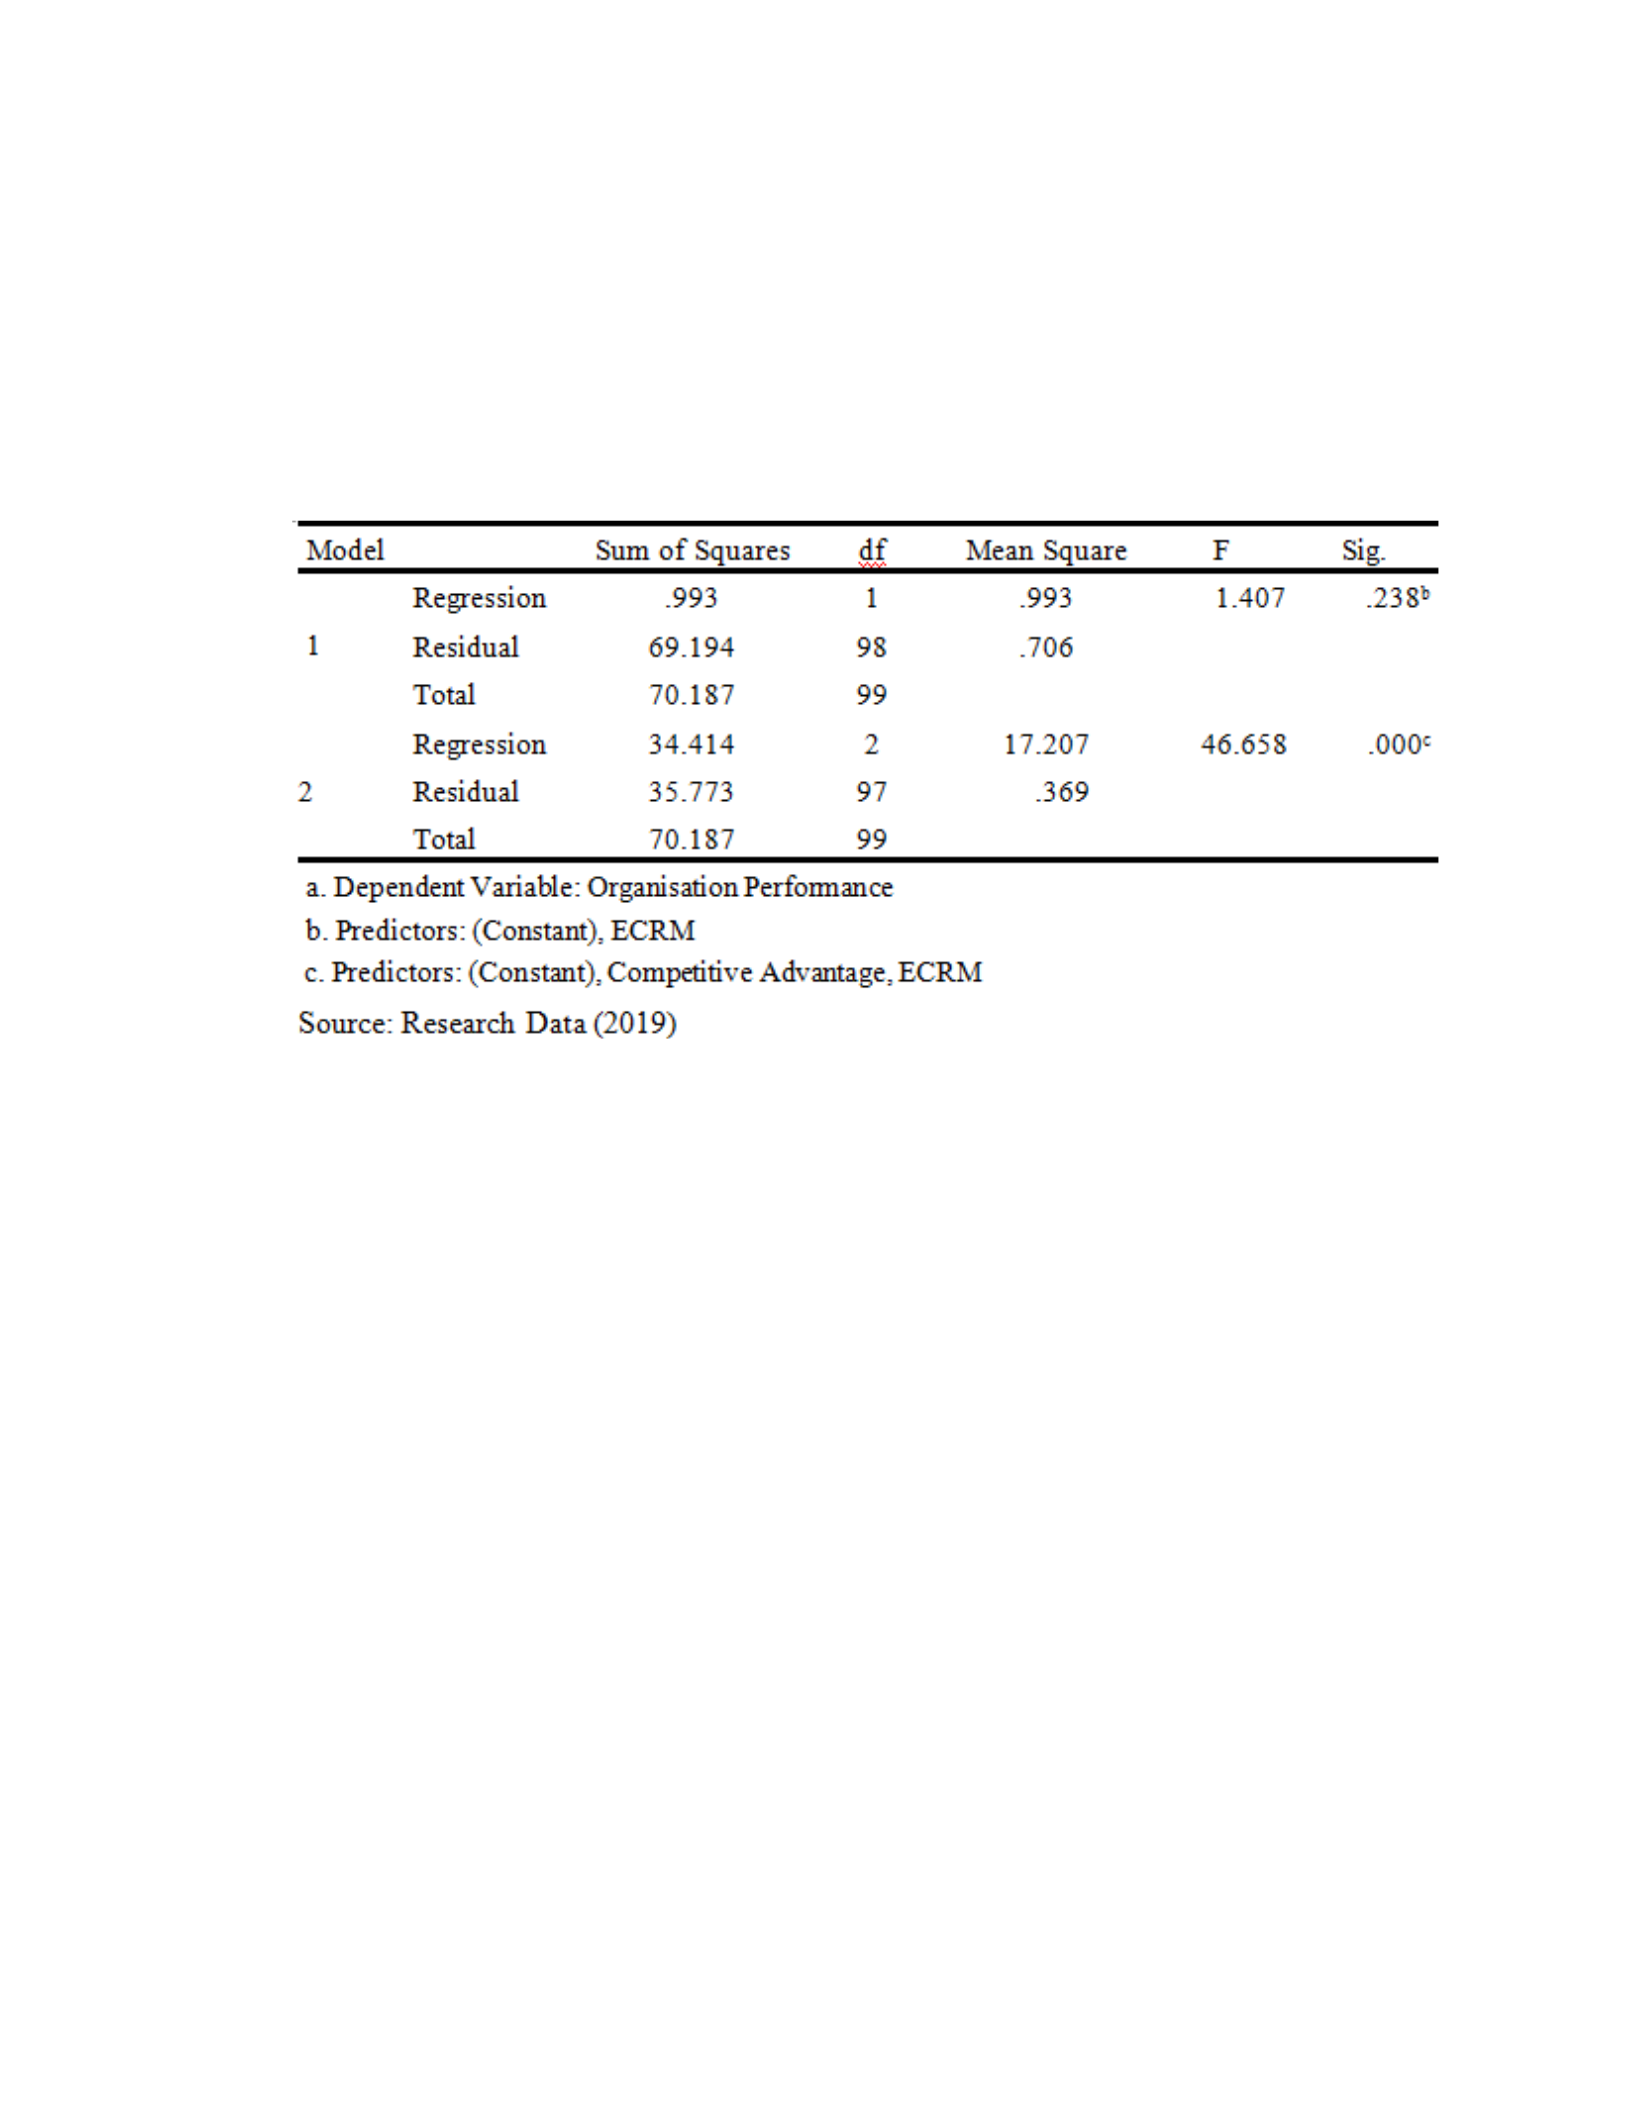
Table 4.19: Analysis of Variance
Table 4.19 elucidates the significance of the entire model to predict firm performance.
The significance value obtained in the study is more than critical value of 0.05, thus the
electronic customer relationship management does not significantly affect organizational
performance. Electronic customer relationship management cannot significantly predict
organizational performance.
When the moderating variable, competitive advantage, was introduced into the analysis,
the model is now significant to predict organizational performance after introduction of
the competitive advantage variable. Thus, competitive advantage increases the predictive
power of the model.
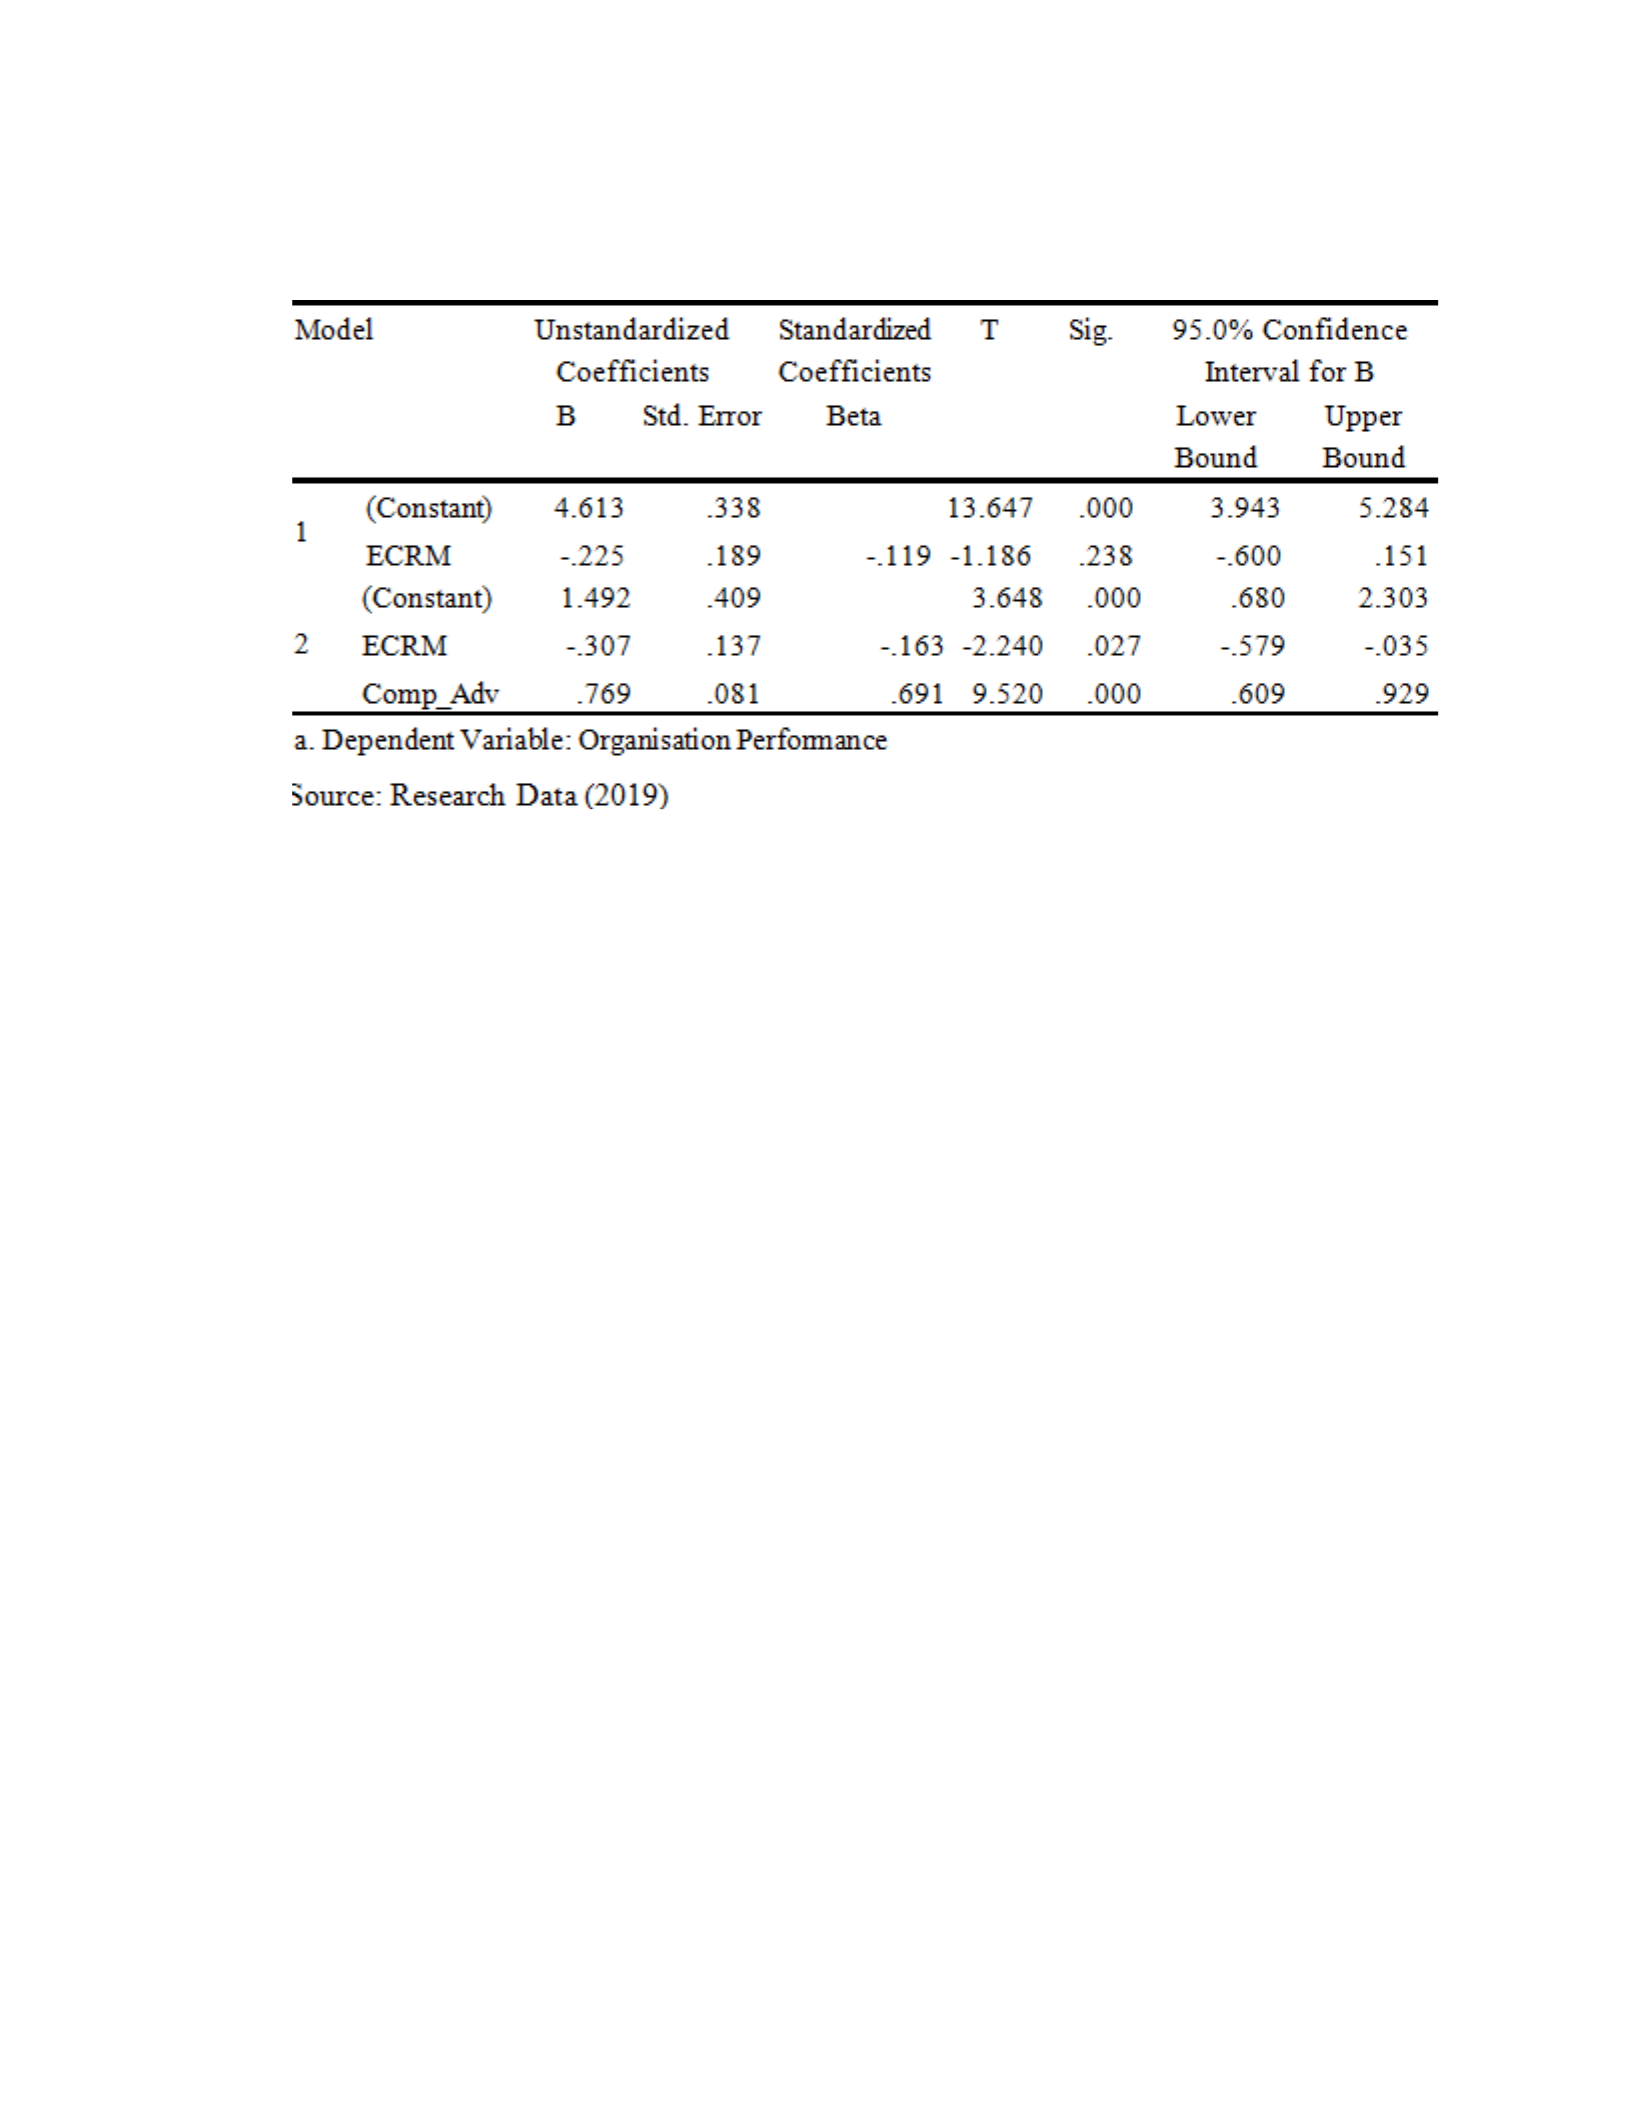
Table 4.20: Model Coefficients
Table 4.20 displays the significance of the effect of individual variables on firm
performance. Electronic customer relationship management has a significance greater
than the critical value of 0.05.
With the introduction of the competitive advantage variable, electronic customer
relationship management variable now significantly impacts on organizational
performance. Thus, competitive advantage has a moderating effect on the relationship
between electronic customer relationship management and organizational performance. It
has changed the magnitude of the relationship. The regression equation below was thus
estimated:
Yi = 1.492 - 0.307X1 + 0.769X2

Where;
Yi= Organizational Performance
X1 = Electronic Customer Relationship
Management X2 = Competitive Advantage

