


Statistical Report
Wk 2: Signature Assignment: Statistical Report
University of Phoenix
DAT/565: Data Analysis And Business Analytics
Professor: Samantha Bietsch
Section 1: Scope and descriptive statistics

This report will analyze the available database of Pastas R Us Inc. to find out what kinds
of opportunities it can take advantage of to expand its operations. The statistical analysis also
aims to find out how effective the company's Loyalty Card program is in increasing sales.
The statistical analysis was conducted to look into various aspects of the company's demographic
profile. These included the ages of its customers between 25 and 40 years old, the household
median income level, and the percentage of college education. The database of Pastas R Us Inc.
contains information about 74 restaurants.
The data collected during the study included various key factors such as the average annual sales
per customer, the number of people who use the company's Loyalty card, and the income level of
its customers, and annual sales/sqft.
Analysis of the current performance of the Loyalty Card program and identify areas where it can
improve. In addition, it will also make recommendations on how to improve the program's
effectiveness. Different variables were then used to come up with a descriptive analysis. These
included the size of the establishment, the average spending of customers, the growth of sales
over the previous years and the percentage of loyalty cards. It will also factor in the median age,
income, and annual sales/sqft.
Summarized descriptive statistics:
The following table shows the total number of restaurants in this case. Based on the
descriptive analysis, it shows that the majority of these establishments are 2580 sq feet. On the
other hand, the average annual sales per person is around 7.0 and the company's sales per square
are 420.
Obs SqFt Sales/Person SalesGrowth% LoyaltyCard% Sales/SqFt MedIncome MedAge BachDeg%
Annual
Sales
Mean 2580.47297 7.04 7.41 2.03 420.31 62808 35.2 26 1059381.3
Standard deviation 372.377178 0.295245747 6.579816378 0.548625882 136.3090751 17782.88665 3.62977526 6.957254964 278522.25
Skew 0.5164242 0.885210527 0.483682184 -0.741461513 1.210702186 0.291766436 -0.16359153 0.137679132 0.35404574
Min 1251 6.54 -8.31 0.29 178.56 32929 24.7 14 499968.0
Max 3799 7.97 28.81 3.38 987.12 114353 43.5 40 1746600.0
Q1 2400 6.825 3.98 1.8575 332.845 46953 32.525 20.25 877477.575
Q3 2735.25 7.1775 11.4225 2.325 483.5625 76194.25 37.525 30.75 1228866.96
IQR 335.25 0.3525 7.4425 0.4675 150.7175 29241.25 5 10.5 351389.385
Mean, Standard Deviation & Skew
Five-number Summary & Interquartile range (IQR)
Section 2 – Analysis
Below we are going to use a scatter plot to show pairs of observations as dots on
each graph. This chats is crucial to our statistics analysis. A scatter plot is a starting point for
bivariate data analysis. We create a scatter plot to investigate the relationship between two
variables. (Doane & Seward, 2022). that involves looking at the relationship between two
different variables. In this type of display, we can identify the type of association that exists
between two variables.
Scatter plot of “BachDeg%” versus “Sales/SqFt”
2
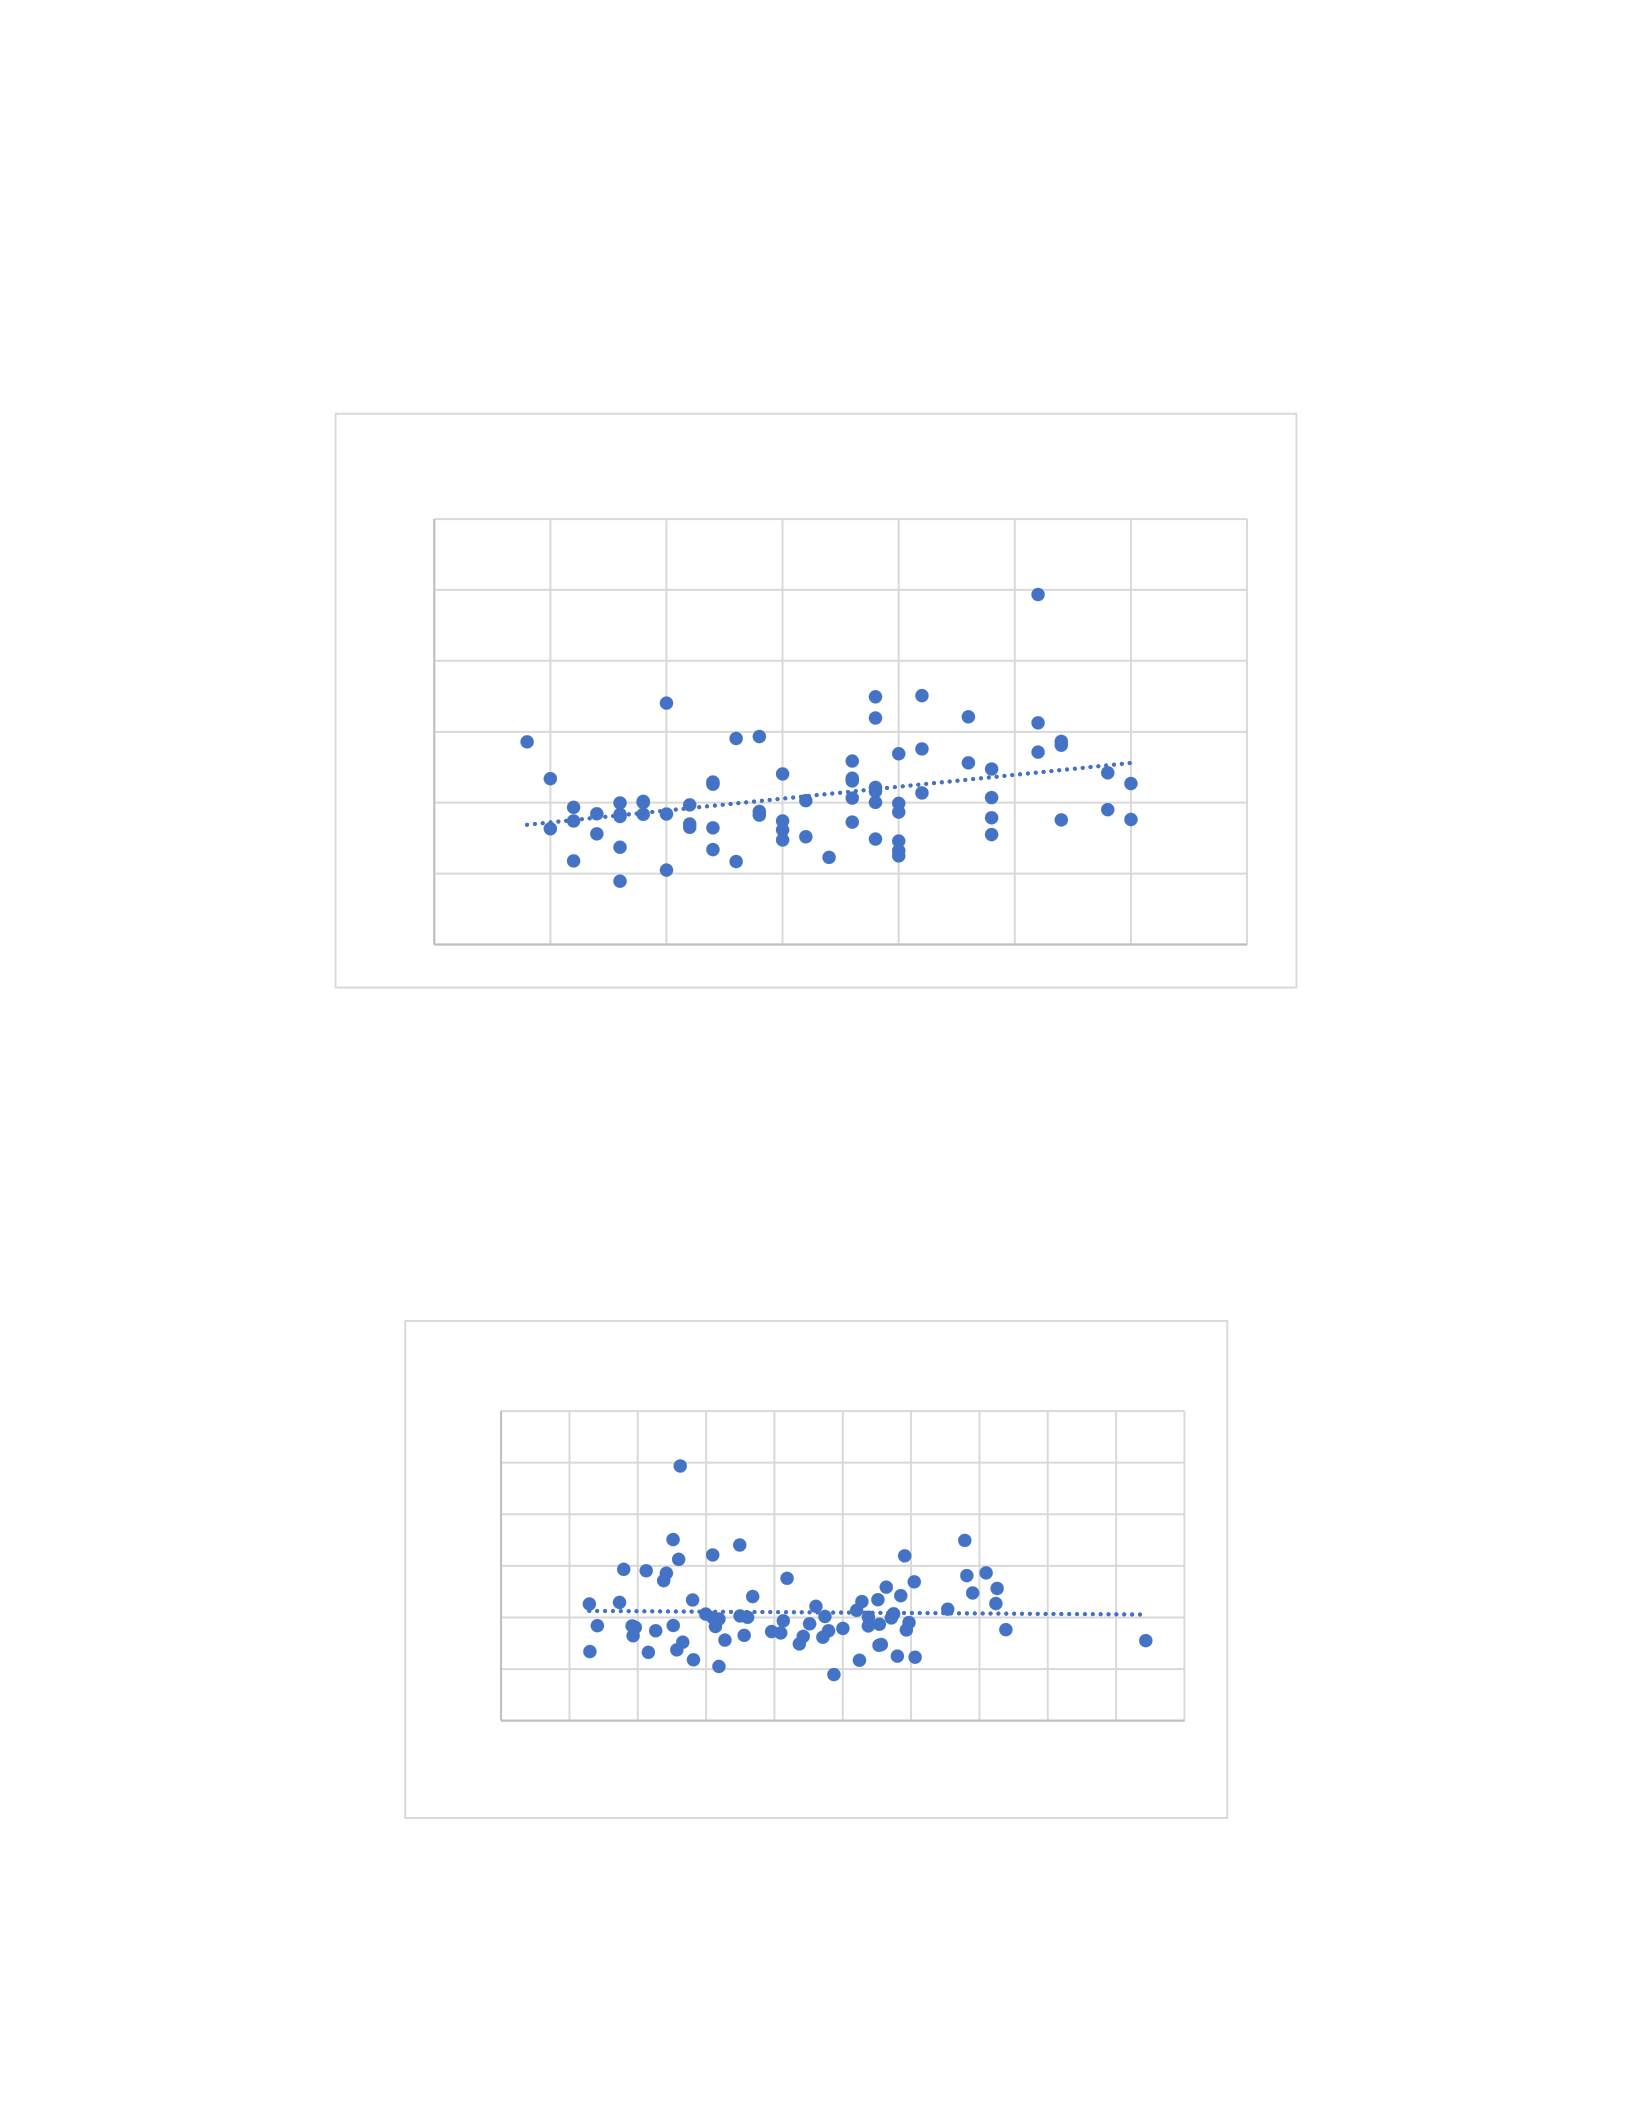
The sales per square foot and bachelor's degree showing a positive relationship as a
6.69. It shows that an increase in degrees equates to a significant increase in sales per square
foot.
This relationship is positive as the Y-values tend to increase on the other side as the X moves to
the right (Stanglin, 2022).
10 15 20 25 30 35 40 45
0.00
200.00
400.00
600.00
800.00
1,000.00
1,200.00
f(x) = 6.69955934006647 x + 244.034567093116
R² = 0.116928067704288
“BachDeg%” versus “Sales/SqFt”
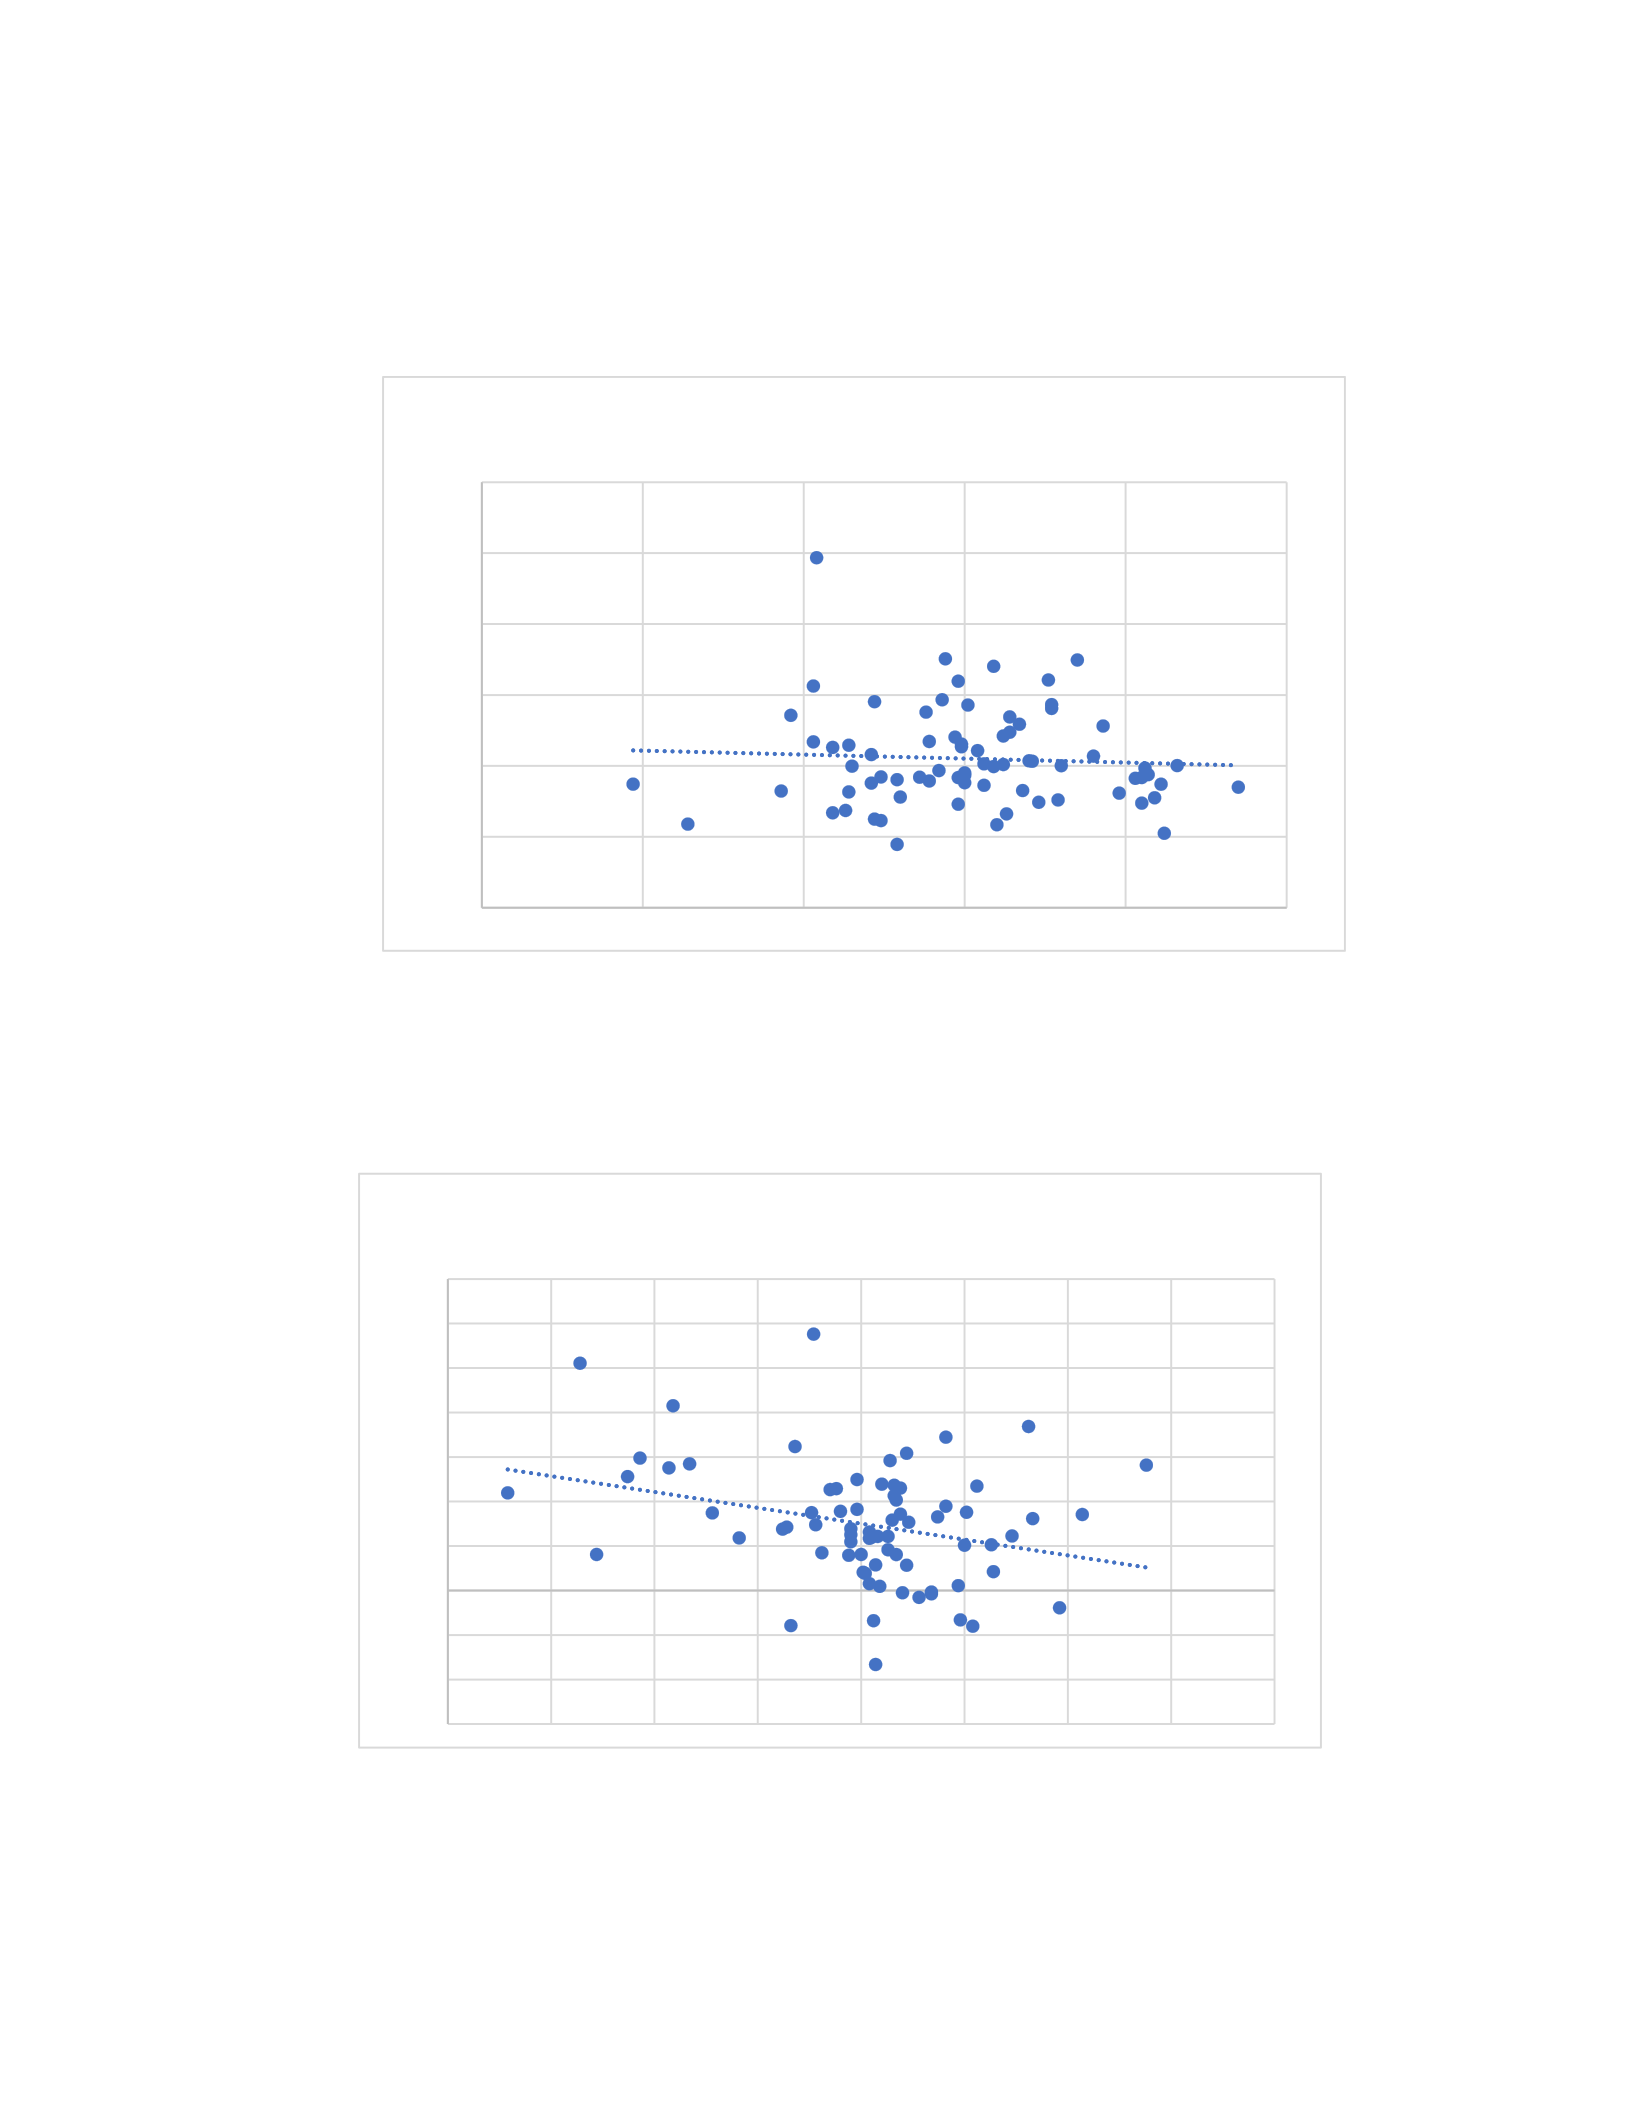
MedIncome” versus “Sales/SqFt
The sales per square foot and the median income relationship is not significant
here. As indicated in the below scatterplot, the slope of the equation does not suggest that a
significant change in the income makes a difference in the sales per square foot.
It demonstrates that the increase in the income makes a difference in the sales per square
foot. This type of relationship exists due to how the X-values tend to increase as the Y-values
go up. The increase in the X-axis caused by the concertation is the reason why the income
goes up against the sales per square foot.
20000
30000
40000
50000
60000
70000
80000
90000
100000
110000
120000
0.00
200.00
400.00
600.00
800.00
1,000.00
1,200.00
f(x) = − 0.000172018061904 x + 431.109464696966
R² = 0.000503620127848
“MedIncome” versus “Sales/SqFt”
“MedAge” versus “Sales/SqFt”
3
The median age and the sales per square foot is negative relationship as shown in the
chart. The plot shows a -2.2452-slope change, which explains the decrease in the average sales
per square foot. explaining a decrease in sales per square foot with each unit of increased median
age (Ma et al., 2018).
20.0 25.0 30.0 35.0 40.0 45.0
0.00
200.00
400.00
600.00
800.00
1,000.00
1,200.00
f(x) = − 2.24519097402456 x + 499.339161732927
R² = 0.003574509912087
“MedAge” versus “Sales/SqFt”
“LoyaltyCard(%)” versus “SalesGrowth(%)”
The sales growth and loyalty card usage is negative relationship. In the below chart, the -
3.5596 angle indicates that the annual sales growth rate reduced with boost of loyalty card usage.
The relationship measurement is 0.08881.
- 0.50 1.00 1.50 2.00 2.50 3.00 3.50 4.00
-15.00
-10.00
-5.00
0.00
5.00
10.00
15.00
20.00
25.00
30.00
35.00
f(x) = − 3.55962942397607 x + 14.6275949786412
R² = 0.088091622994128
“LoyaltyCard(%)” versus “SalesGrowth(%)”
Section 3: Recommendations and Implementation
4

The evaluation revealed that the correlation between the BachDeg% and the Sales/SqFt is
strong. It is also beneficial for the company to use this method to improve its daily operations.
The MedAge versus Sales/SqFt chart shows no relationship. Furthermore, a line graph can be
used to identify the existing relationship between the two. The company should consider various
strategies to increase its income. Based on the above analysis, the organization should consider
adopting a marketing strategy that is based on sales per square foot and Bachelor's degree. In
addition, it should focus on the younger customers who are less than 35 years old. They prefer to
be served inside the establishment.
Unlike other establishments, the restaurant's data collection process is relatively simple.
The information collected can be obtained from the customers' identification cards, such as
national and passport cards. Besides this, the data can also be obtained from the customers'
phone numbers and address.
Through the use of POS systems, the restaurant can collect and store the demographic
information of its customers. This data will allow the company to improve its marketing efforts
and identify potential customers.
References
5

Doane, D, & Seward, L (2022). Applied statistics in business and economics (7th ed.). McGraw-
Hill.
Stanglin, S (2022). Determining Correlation on a Scatterplot.
https://study.com/academy/lesson/scatter-plot-and-correlation-definition-example-analysis.html
IEEE. (2020). ScatterNet: A Deep Subjective Similarity Model for Visual Analysis of
Scatterplots. https://ieeexplore.ieee.org/abstract/document/8490694
6

