


1
Project Three
Tiffany Denton
Southern New Hampshire University
PSY 260: Statistical Applications for the Behavioral and Social Sciences
Frankie Holt
December 17, 2024

2
Project Three
Topic from Project Three Milestone: Police Striking Adults
Describe the key findings from your interpretation of the data for a general audience. Your
response should be about 2 to 4 sentences. Include the following in your response:
Easy-to-understand statistical values (e.g., percentages)
According to the key findings of the data for police striking adults, are that the p-value
show how the different happens among different races. These two things tell us what
the significance measurement of the two differences of each race.
Summarize the background information for the scientific community. Your response should be
about 3 to 5 sentences. Include the following in your response:
Introduction to the research topic
Credible background sources to support the introduction to the topic. Note: In the
Project Three Milestone, you reviewed credible sources to create your annotated
bibliography. Use those credible sources in this section or additional credible sources if
needed.
The purpose of this research is to determine a comparison between race and law
enforcement in the United States. According to the article "10 things we know about
race and policing in the U.S.", it is a widely accepted belief that most Americans claim
that black citizens are subject to more police misconduct than white or other races in
the U.S. The article shows that more misconduct happens to an African American than a
white person in the United States. (DeSilver, D., Lipka, M. & Fahmy, D. (2020 Jun)
Describe the major statistical findings for the scientific community. Your response should be
about 3 to 7 sentences. Include the following in your response:
An explanation of at least two major findings
An explanation contextualizing the graphs you will include in the next item to ensure
that the reader understands their purpose in the brief
This article shows and contains data from research center with charts and surveys and
measured 10 different people. The first four is the 2019 nation survey did a sample of
population that had 9,402 and only 6,637 responded to it, which this is 71% on adults
with equality of America. The survey also showed that 84% of blacks and 54% of white
people see there is more discrimination against African American's. The last five data
was measured with two different surveys back in 2017 of race and police from the
public and law enforcement throughout the United States. The first set of data was sent
out in 2016 which shoed that 7,917 of police offices and 54 in law enforcement in the
3
United States are ran by the Nation Police Research Platform. The data set that was
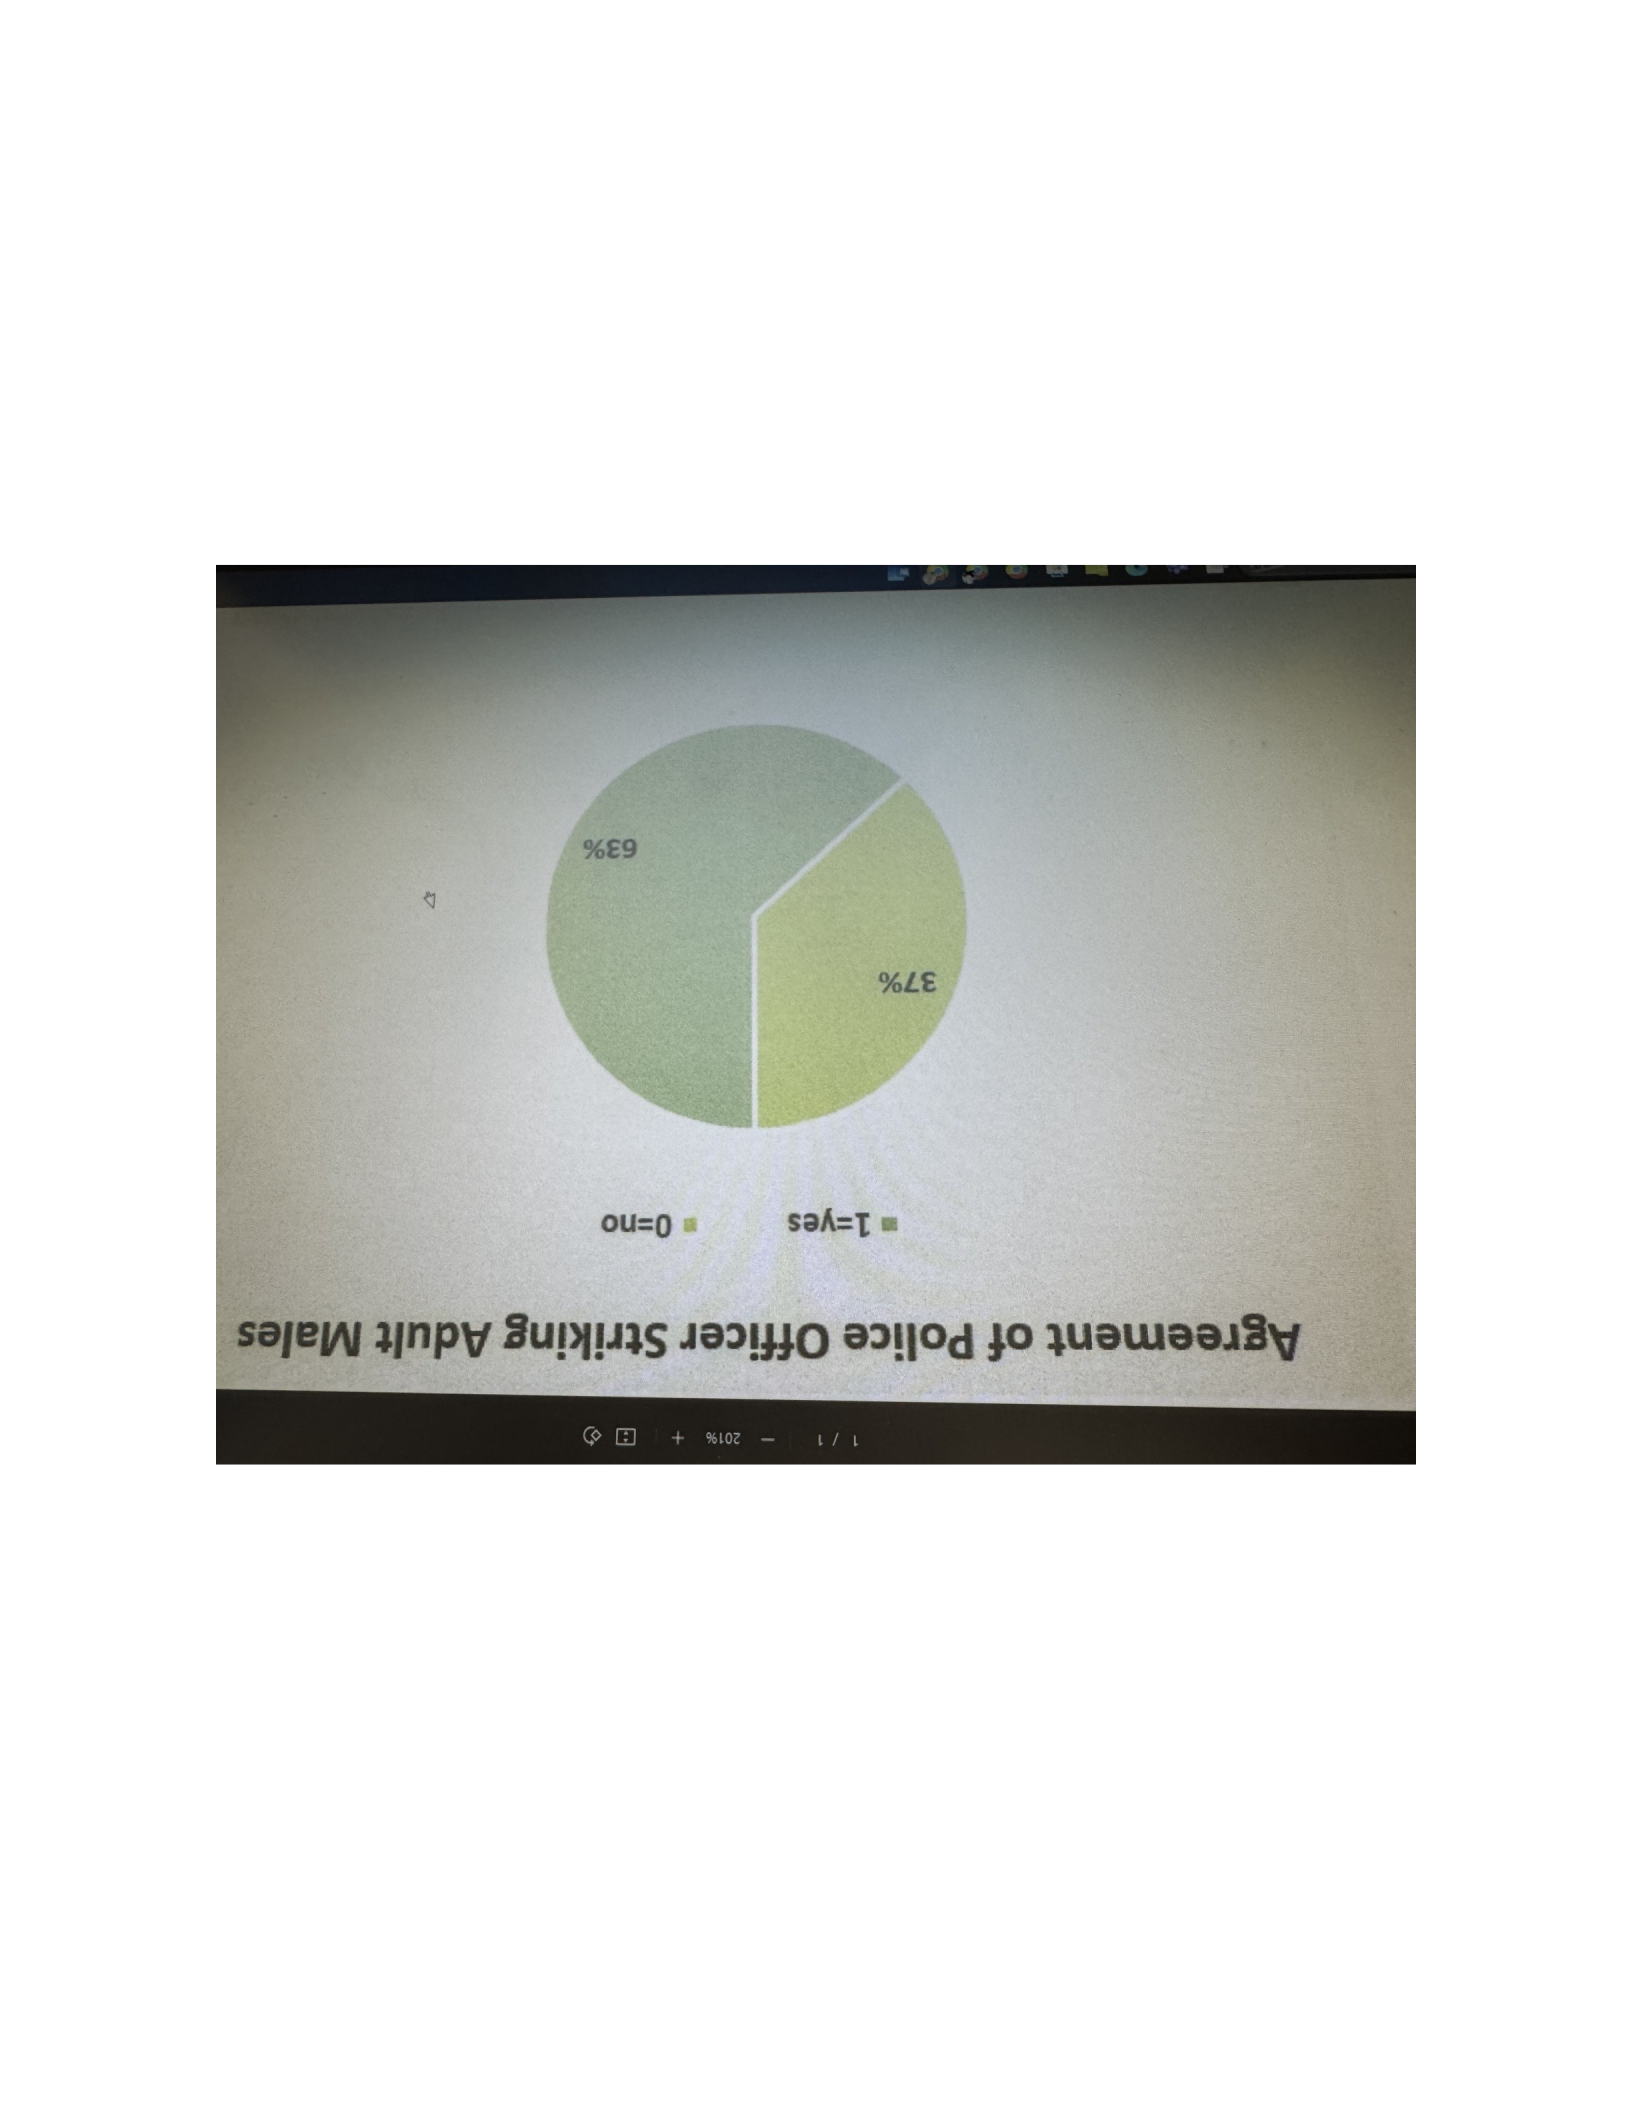
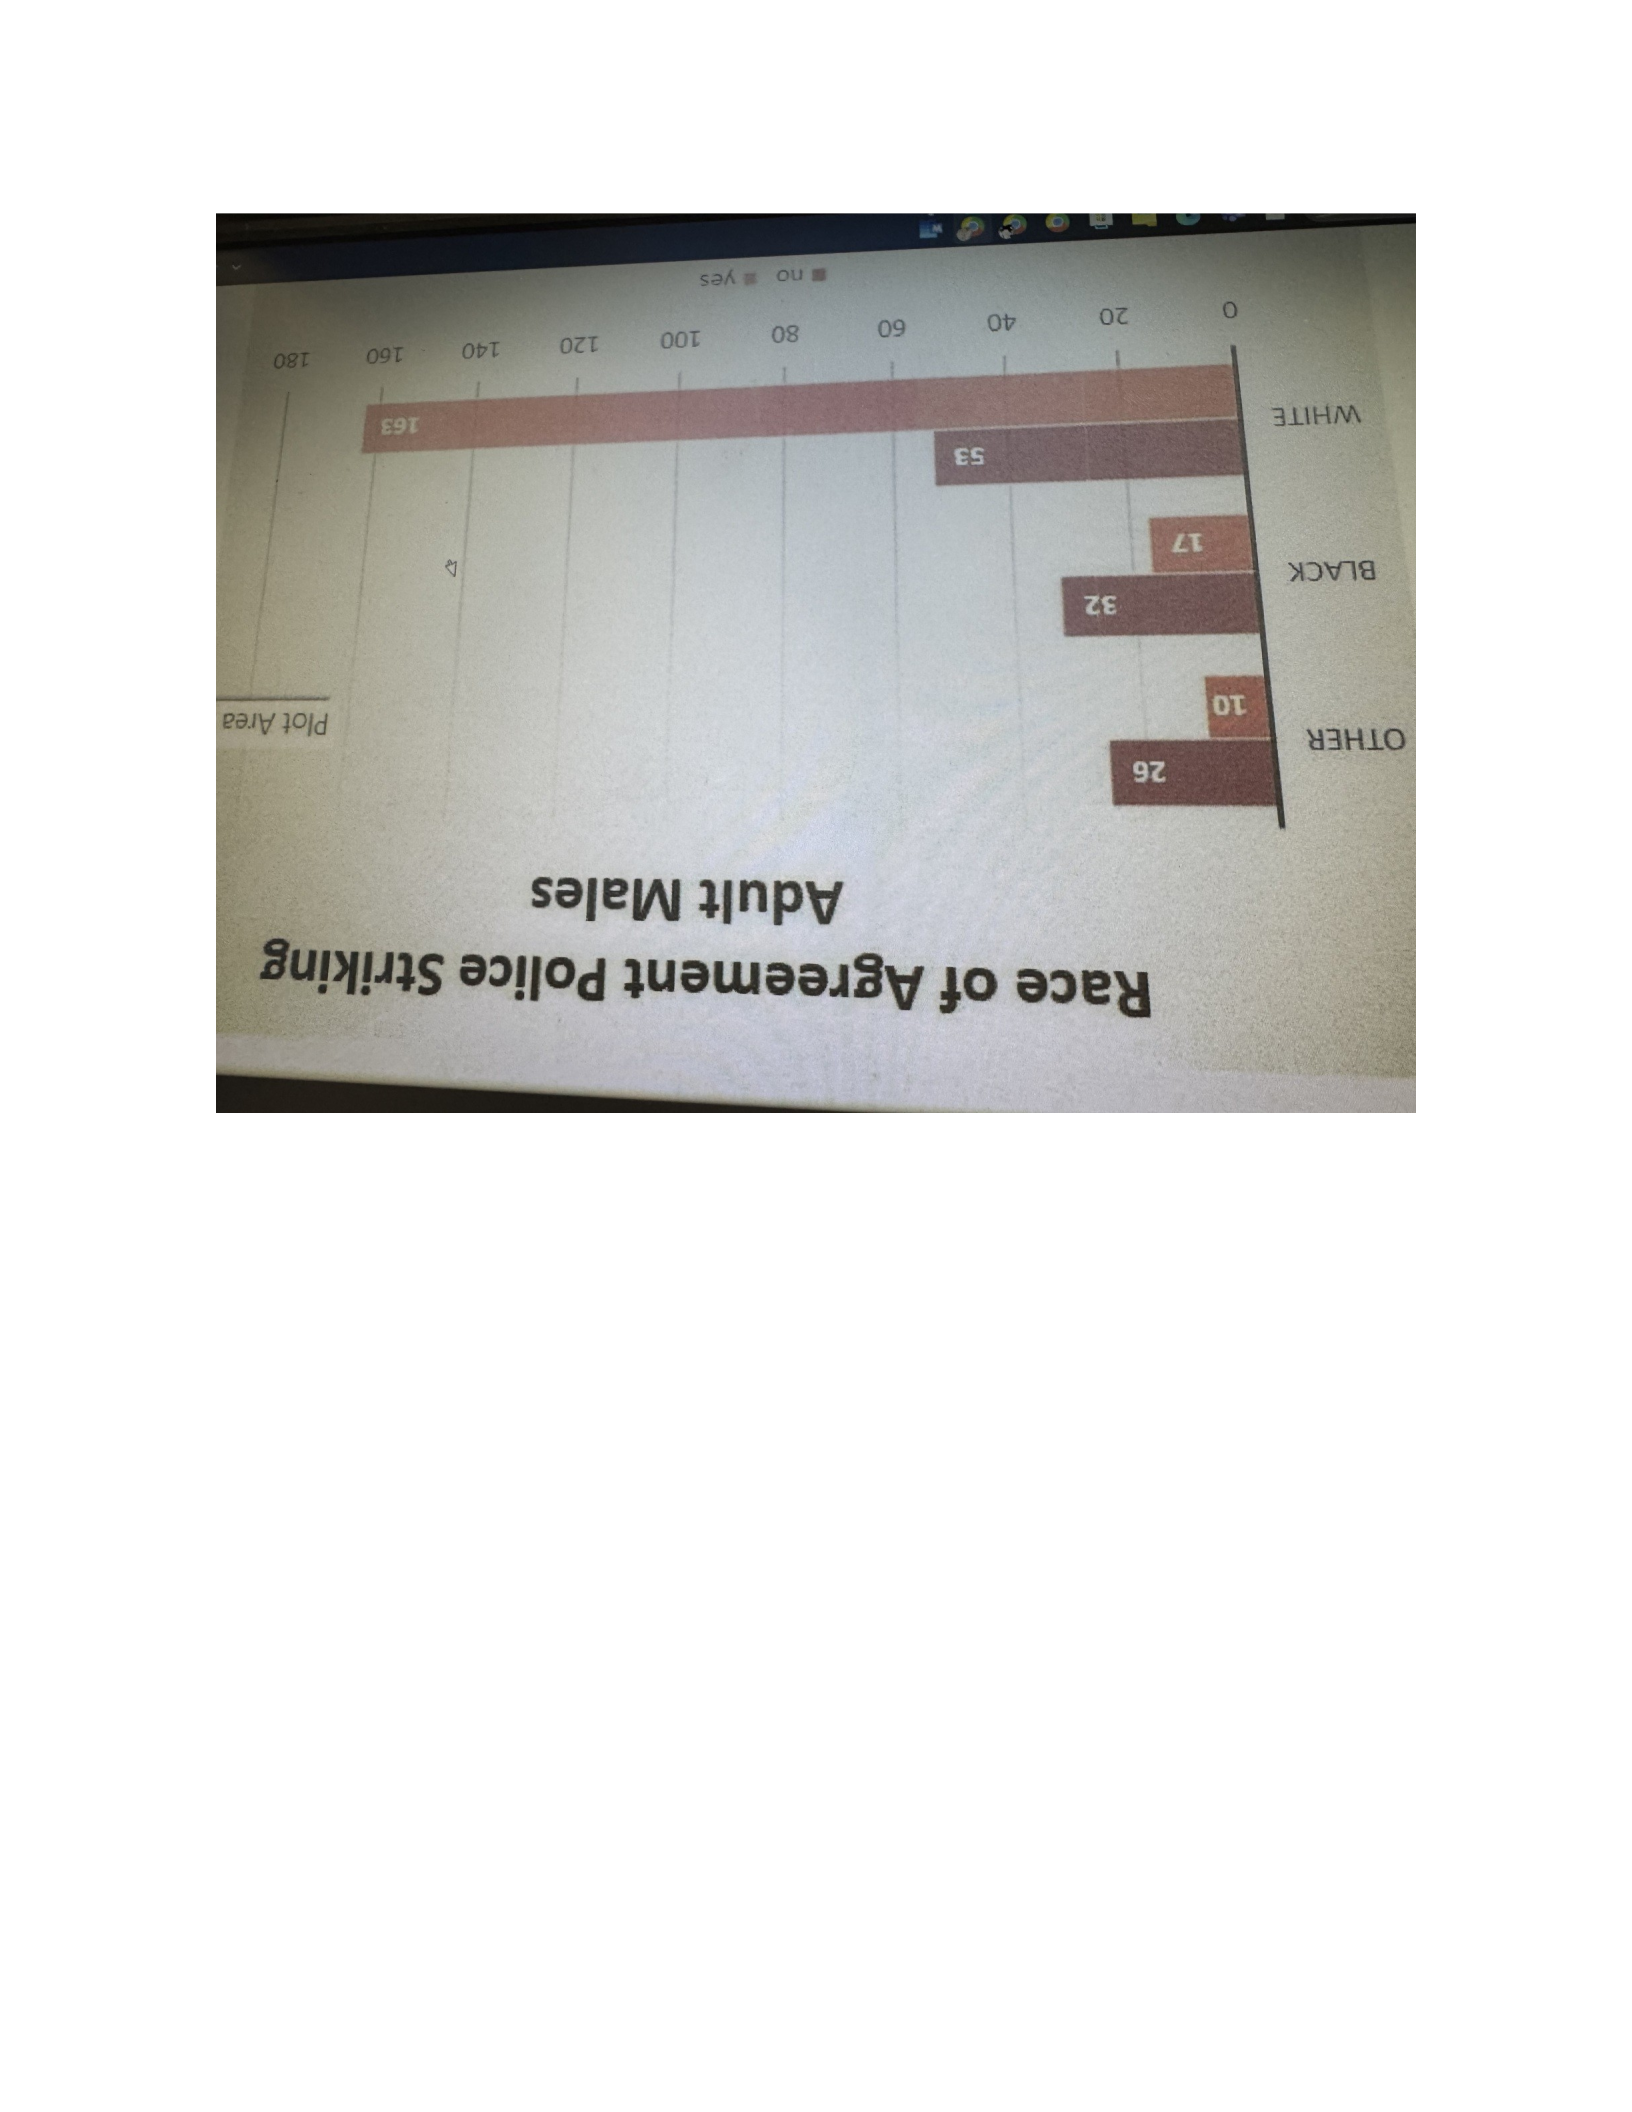
done in 2017 used 4,538 of the US public adults. The charts show that police striking
adults had 301 respondents. The first chart is a yes or no for law enforcement officer to
strike a US adult male. Out of this there was 111 responding of no and 190 responded
yes. The second chart shows what race chose yes or no.
Represent the major statistical findings for the scientific community with graphs. Your response
should include a graph for each finding to support your description.
4
Provide a concise summary appropriate for a general audience. Include the following in your
response:
A restatement of why this research was completed and reminder of the key findings
The application of the findings
The research that has been conducted in this briefing was to analyze the understanding
of police striking adults. Each one shows how it may differ depending on the race of the
victim and how there has always been so much controversy surrounding this topic which
means there will be continuous studies done. What was found is that blacks are treated
unjustly more than whites by law enforcement offices and with the society to determine
that 301 out of 190 agreed with a yes and 111 disagreed with a no show that's there is a
problem in the United States.

5
References
DeSilver, D. (2024, April 14). 10 things we know about race and policing in the U.S. Pew
Research Center. https://www.pewresearch.org/short-reads/2020/06/03/10-things-we-
know-about-race-and-policing-in-the-u-s/
Graziano, L. M., & Gauthier, J. F. (2017). Examining the racial-ethnic continuum and perceptions
of police misconduct. Policing & Society, 29(6), 657–672.
https://doi.org/10.1080/10439463.2017.1310859
Horowitz, J.M., Brown, A., & Cox, K. (2019 April 09). Race in America 2019. Pew Research
Center. https://www.pewresearch.org/social-trends/2019/04/09/race-in-america-
2019/#majorities-of-black-and-white-adults-say-blacks-are-treated-less-fairly-than-
whites-in-dealing-with-police-and-by-the-criminal-justice-system Morin, R., Parker, K.,
Stepler, R., & Mercer, A. (2017 January 11)
. Behind the Badge. https://www.pewresearch.org/social-trends/2017/01/11/behind-the-
badge/
Pew Research Center. (2016 August-September). 2016 Pew Research Center’s American Trends
Panel.
https://assets.pewresearch.org/wp-content/uploads/sites/3/2017/01/06164356/W20-
Topline_SDT-for-Jan-17-release_FINAL.pdf\

