


Regional vs. National Housing Price Comparison Report 1
Report: Regional vs. National Housing Price Comparison
Emily Higdon
Southern New Hampshire University

Regional vs. National Housing Price Comparison Report 2
Introduction
The purpose of this paper is to gather information in order to determine if the Mid Atlantic
The region's housing prices and square footage are significantly different from those of the
national market. I will be taking a random sample of 500 which will include the state’s, region’s,
house listing price and square footage.
In order to get a random sample of 500, I first will create a column labeled and using the
function =RAND, it will generate an entire column of random random numbers. I will then
highlight every single cell and sort the data based on the random column. Once that is complete,
I will delete everything under 501 because everything above will be used as my random sample
of 500.
The population parameter for the variables I am analyzing is whether or not the square footage
of the homes in the Mid Atlantic region are different from the average for the national market.
For both of the tests, I will be using a confidence interval of a= 0.5. The first test is going to be a
Right Tailed Test, focusing on the average listing price, with a hypothesis of:
H0: μ = 288,407
Ha: μ > 288,407
In the Right tailed test, we are trying to see if there is enough statistical evidence to see if the
average price of homes in my selected region is greater than the national market everage. The
second test will be a Two Tailed test, which will be based on the average square footage instead
of average listing price, with a hypothesis of:
H0: μ = 1,944
Ha: μ ≠ 1,944
Regional vs. National Housing Price Comparison Report 3
The second test we will conduct is to see if the average square footage of homes in my
selected region is different from the average for the national market. I will be using estimation
and confidence intervals to support my tests and to see if there is enough evidence to reject or
fail to reject my hypothesis.
1-Tail Test
The population parameter for this test is the mean listing price for the Mid Atlantic region
which is $267,787. The null hypothesis is the mean listing price in the Mid Atlantic region is
equal to the mean listing price for the national average. The alternative hypothesis is whether
or not the mean is less than the mean listing price for the national average.
H0: μ = 288,407
Ha: μ > 288,407
The level of significance I will be using is 0.05.

Regional vs. National Housing Price Comparison Report 4
Sample Size Mean Median Standard
Dev.
Q1 Q3
500 $267,787 $199,950 261581.114 $148,637.50 $297,512.50
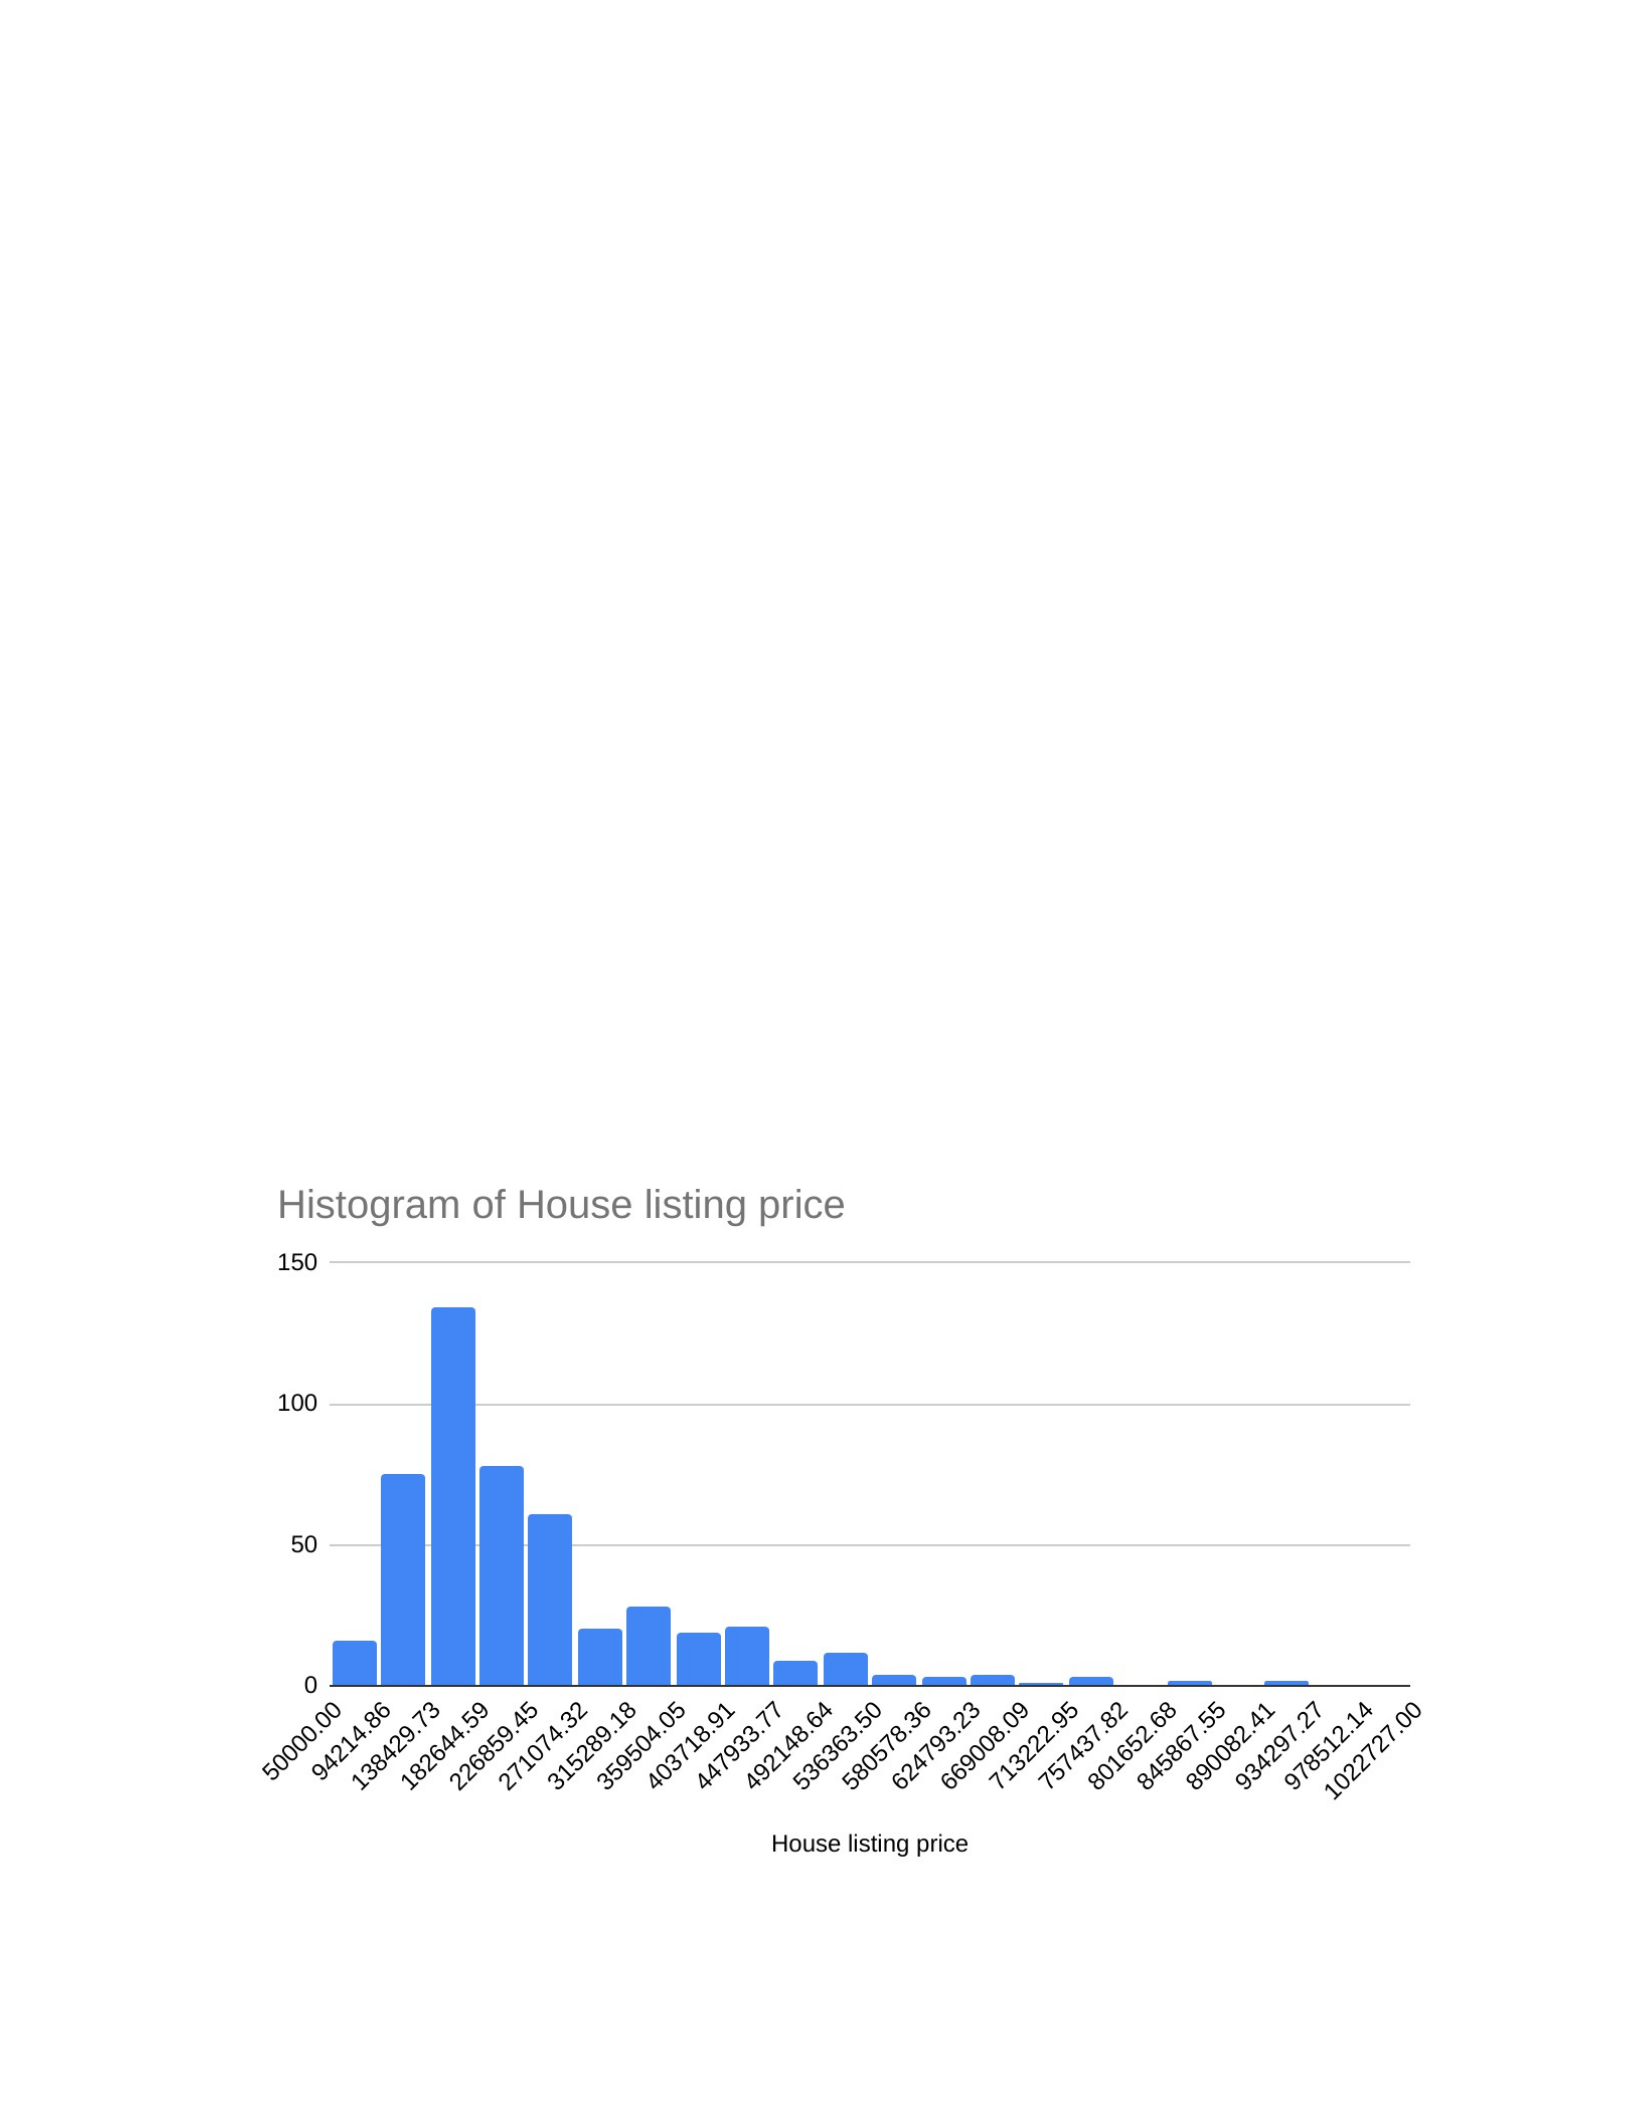
The shape of my data is skewed right and the spread on the chart ranges from $0 up to
$934,297.27. In comparison to the national average, it is similar in the way it is shaped and
the direction it is skewed towards. From the data I have gathered, the normal conditions have
been met with our random sampling, our data distribution, and the required size of my
sample which is 500.
Using all the information I have gathered thus far, the appropriate test statistic is -1.722 and
the probability value, or p value, is 0.043. Again noting that our significance level is 0.05, we
can see that the p value is lower than the test statistic.The conclusion is as follows; since the p
value is less than the significance level, we will reject the null hypothesis. The interpretation of
that is because we reject the null hypothesis, there is evidence that the average listing price in the
Mid Atlantic region is lower than the average listing price.
2-Tailed Test
The population parameter for this test is the mean square footage for the Mid Atlantic region
which is 1,701. The null hypothesis is the mean square footage in the Mid Atlantic region
will be equal to the mean of the national average. The alternative hypothesis is whether or
not the mean square footage for the Mid Atlantic region is not equal to the mean for the
national average. The level of significance will again be 0.05.
H0: μ = 1,944
Regional vs. National Housing Price Comparison Report 5
Ha: μ ≠ 1,944
Sample Size Mean Median Standard
Dev.
Q1 Q3
500 1,701 1,734 353.917 1558.125 1905.50
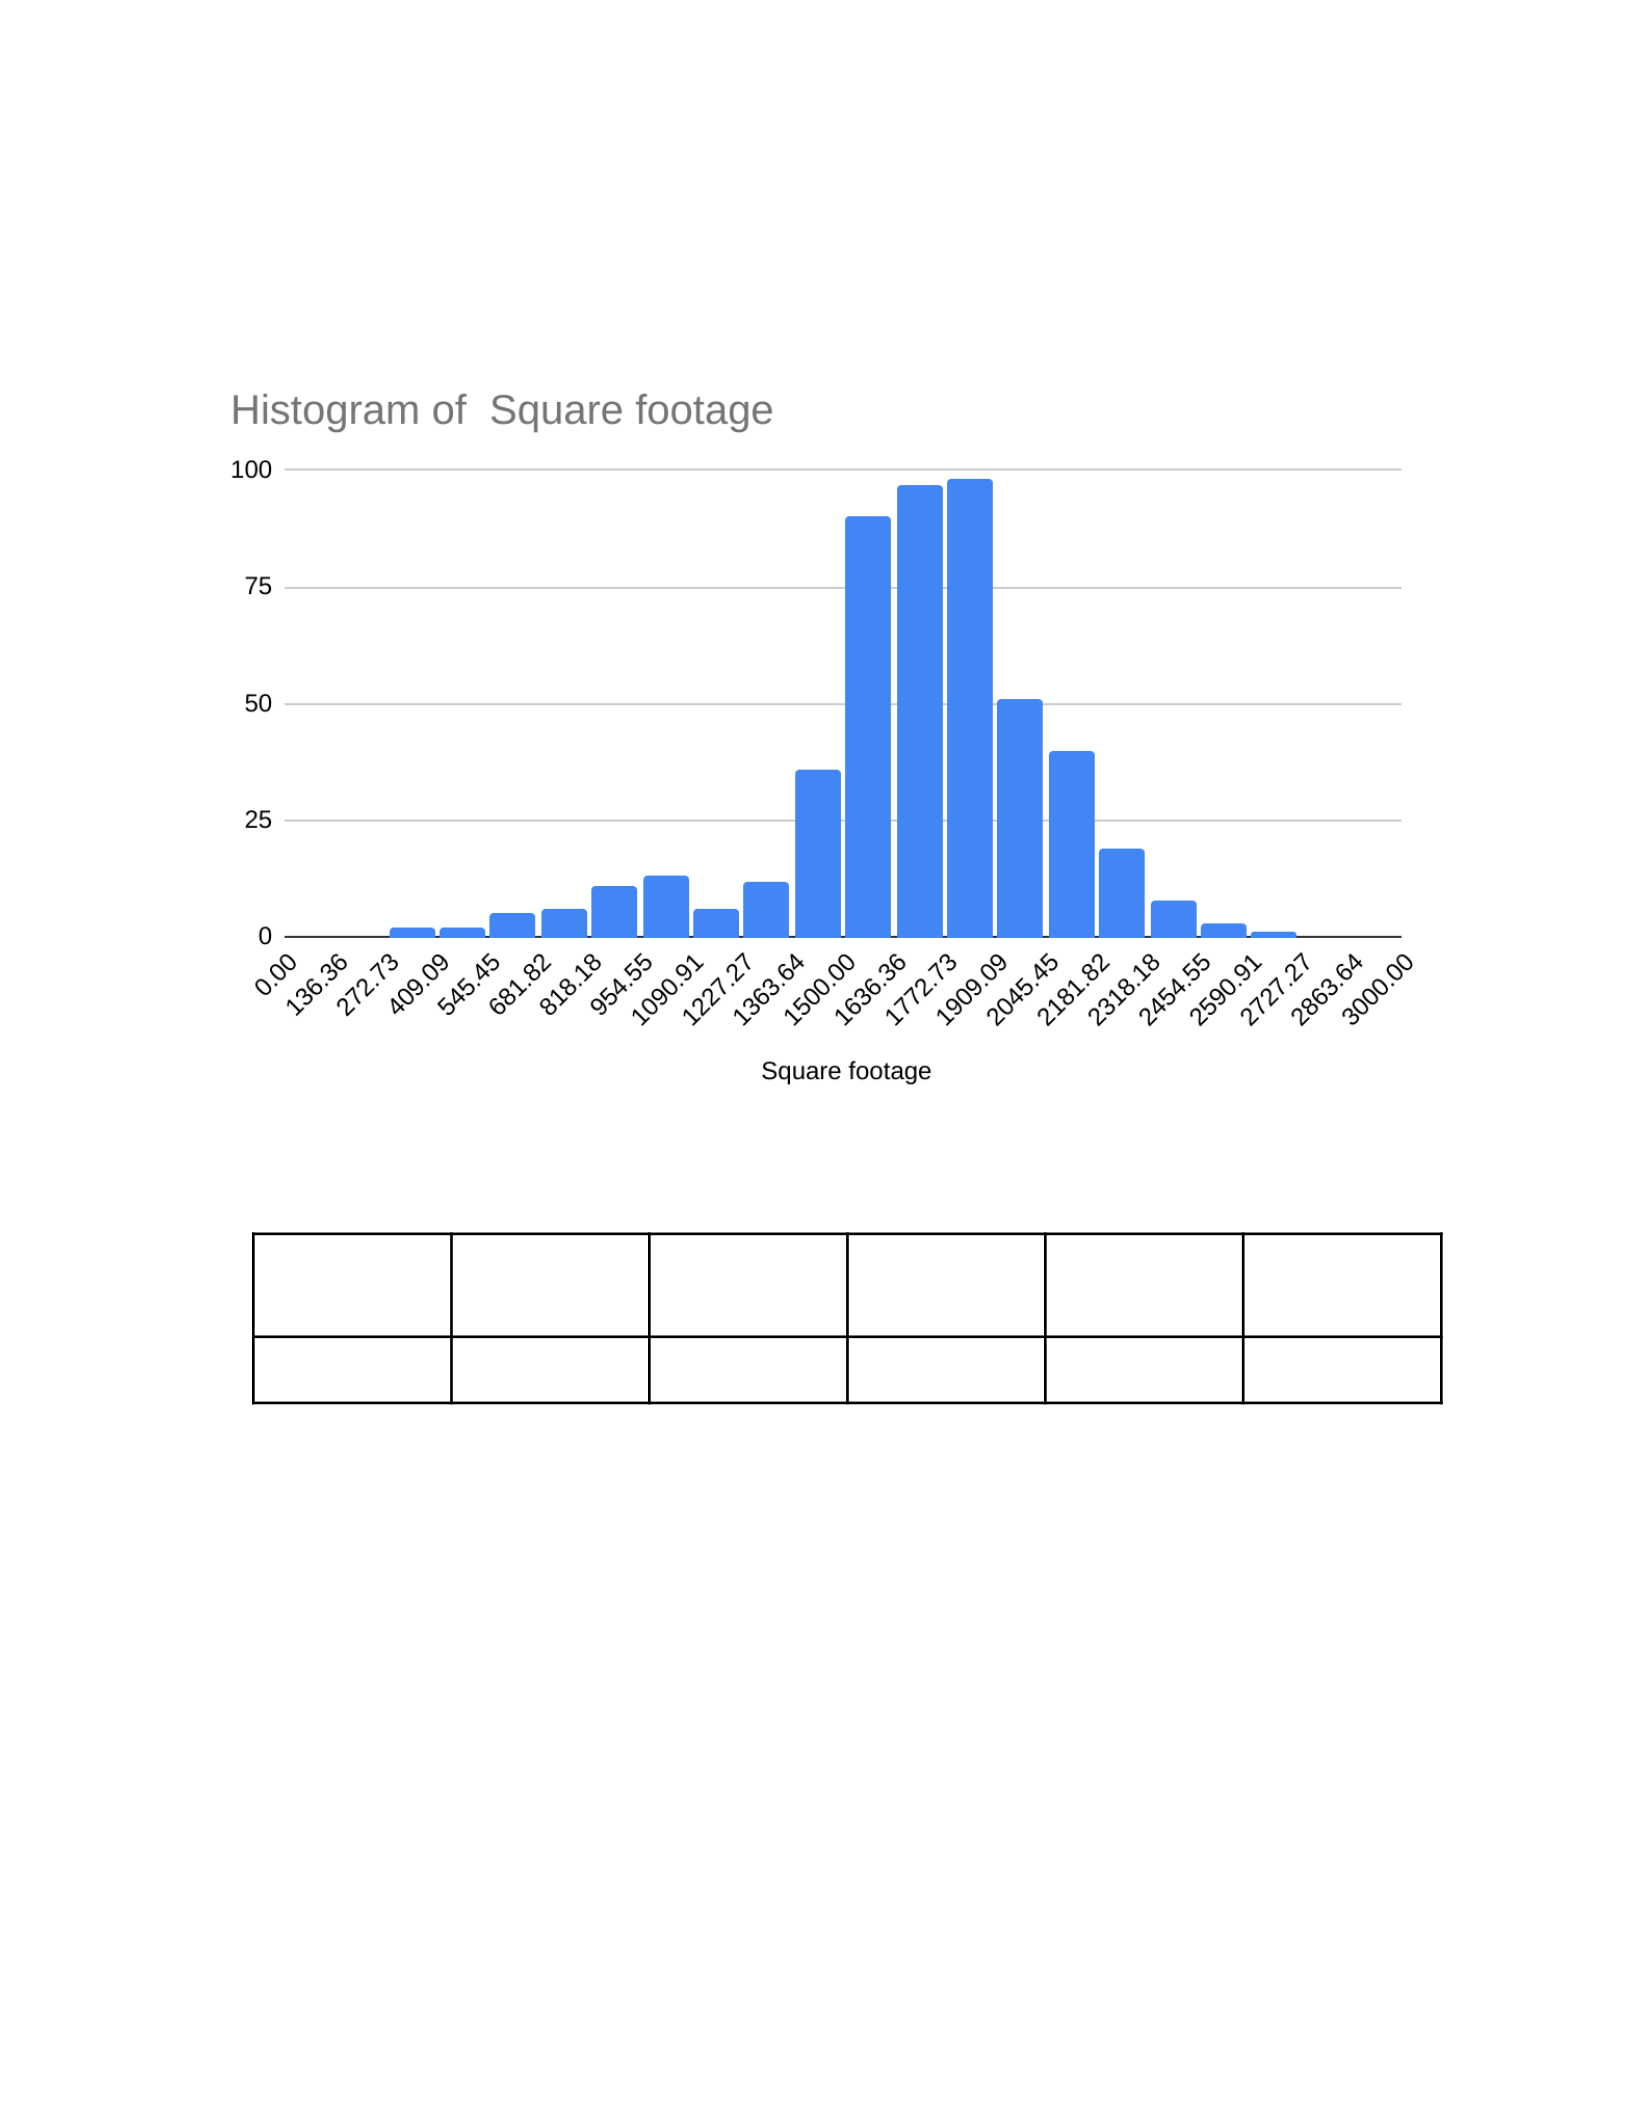
For the shape of this histogram, I would say that it is more skewed to the left,maybe even
a little symmetrical. The center of the graph falls between 1500.00 to 1909.09 and the
overall range of the graph is between 27273 and 2727.27. In comparison to the histogram
for the national average, is it similar in both shape and it being almost symmetrical? I would
conclude that my histogram has a wider range of numbers. This information leads us to the

Regional vs. National Housing Price Comparison Report 6
belief that our null hypothesis calculation is accurate in that the average square footage of
homes in the mid Atlantic region is not much different than the average in the national
summary statistic. Much like our first test, the normal conditions have been met with our
random sampling, our data distribution, and the required size of our sample.
The appropriate test statistic is -4.0 and the probability value, or p value, is 1.
Since our significance level is 0.05, we can see that the p value is higher than the
significance. Since the p value is much more than our level of significance, we fail to reject
the null hypothesis and conclude that there is not enough data to support that the mean
square footage in the Mid Atlantic region is different from the mean square footage in the
national average.
Comparison of the Test Results:
To calculate the confidence interval, we need to first determine the margin or error by using the
function m=z*☌/✓n). I will instead be using the =confidence.t function in excel to
calculate the margin of error.
=confidence.t(0.05,353.917,500)
confidence interval is calculated to be 31.097
Using that margin of error, we can find our confidence interval by adding or subtracting our
sample mean with our margin or error.
Lower bound: 1701-31.097= 1675.903
Upper Bound: 1701+31.097= 1731.091
With those calculations, we can say that we are 95% confident that the average square footage
for houses in the Mid Atlantic region falls within the range [1,675.903, 1,731.091].

Regional vs. National Housing Price Comparison Report 7
Final Conclusions
Our overall findings from both tests were to be expected. We have found that the average
listing price and the average square footage both correlate with each other. The higher the
square footage is, the higher the price is going to be. In comparison to the national averages,
we have found that the listing prices in the Mid Atlantic region are definitely lower than that
of the national average. Because the average listing price is lower than the average listing
price in the national summary, we can also conclude that the square footage will also be
lower. These findings pretty much aligned with my original guess that the averages would
be lower because states in the Mid Atlantic region always have had lower square footage
and lower listing prices compared to those everywhere else.

