Median Housing Price Prediction Model for D.M. Pan National Real Estate Company 1
Median Housing Price Prediction Model for D.M. Pan National Real Estate Company

Median Housing Price Prediction Model for D.M. Pan National Real Estate Company 2
Notes
The Selling Price and Area Analysis Report analyzed a simple random sample from the
1
South Atlantic region of the United States to establish a numeric relationship between the median
ft2 of homes and the median listing price. For the analysis, A simple random sample (SRS) was
generated of 30 counties from the South Atlantic region from a list of 1000 counties from different
regions of the United States that depict the median list price and the median ft of homes.
2
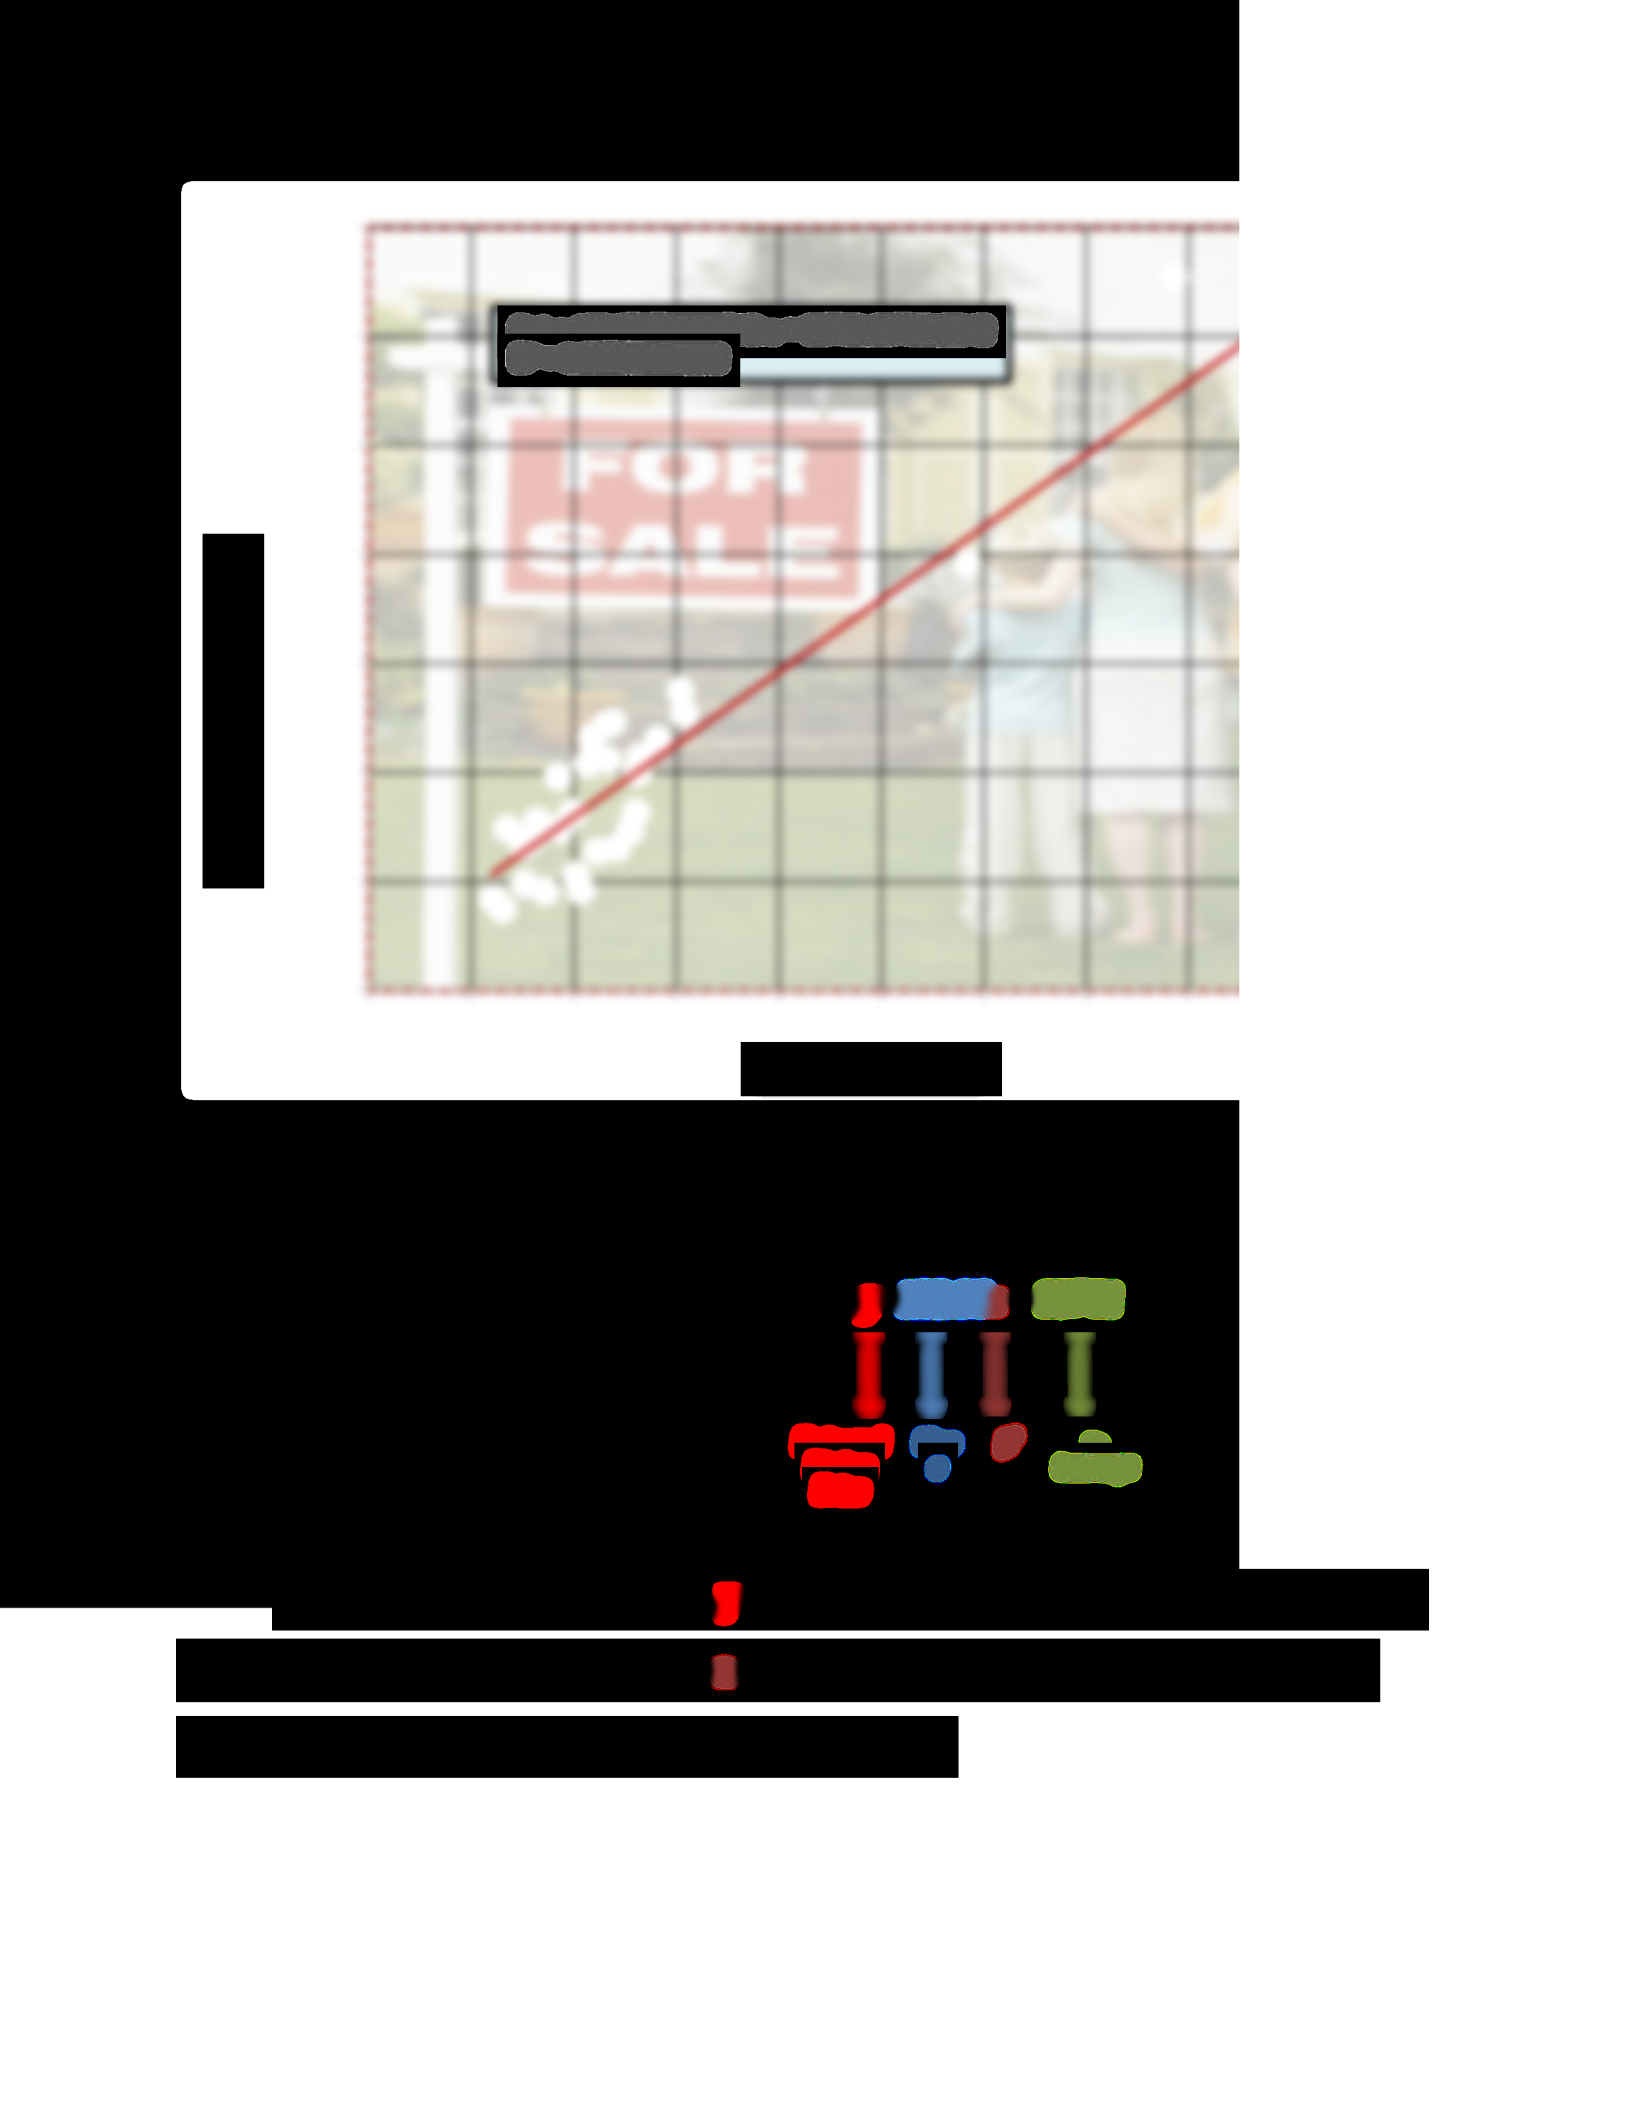
A scatter plot was created from the SRS data that used the median ft of homes for the
2
independent variable (predictor) and their median listing price for the dependent variable
(response). As shown below, the scatter plot forms a cluster with 3 outliers. The outliers are 3
counties within the SRS with a median ft > 3,900 and < 5,525 and a median listing price
2
> $590,000 and < $855,000. These outliers differ substantially from the rest of the data that are
forming a cluster. All 3 counties have a high demand for housing but a low supply of land which
would cause an increase in list prices per ft . The Supply and Demand Theory could be a strong
2
indicator of the reasoning for the 3 outliers. (Britannica, 2018)
1 Report: Selling Price and Area Analysis for D.M. Pan National Real Estate Company
Median Housing Price Prediction Model for D.M. Pan National Real Estate Company 3
1,000 1,500 2,000 2,500 3,000 3,500 4,000 4,500 5,000 5,500 6,000
200,000
300,000
400,000
500,000
600,000
700,000
800,000
900,000