


DESCRIPTIVE STATISTICS 1
SPSS: Descriptive Statistics Assignment
Chris Webb
Department of Psychology, Liberty University
DESCRIPTIVE STATISTICS 2
Table 1
Gender Frequency and Percent
Gender
N
Percent
Female
2,673
65.1
Male
1,402
34.1
Other
28
0.7
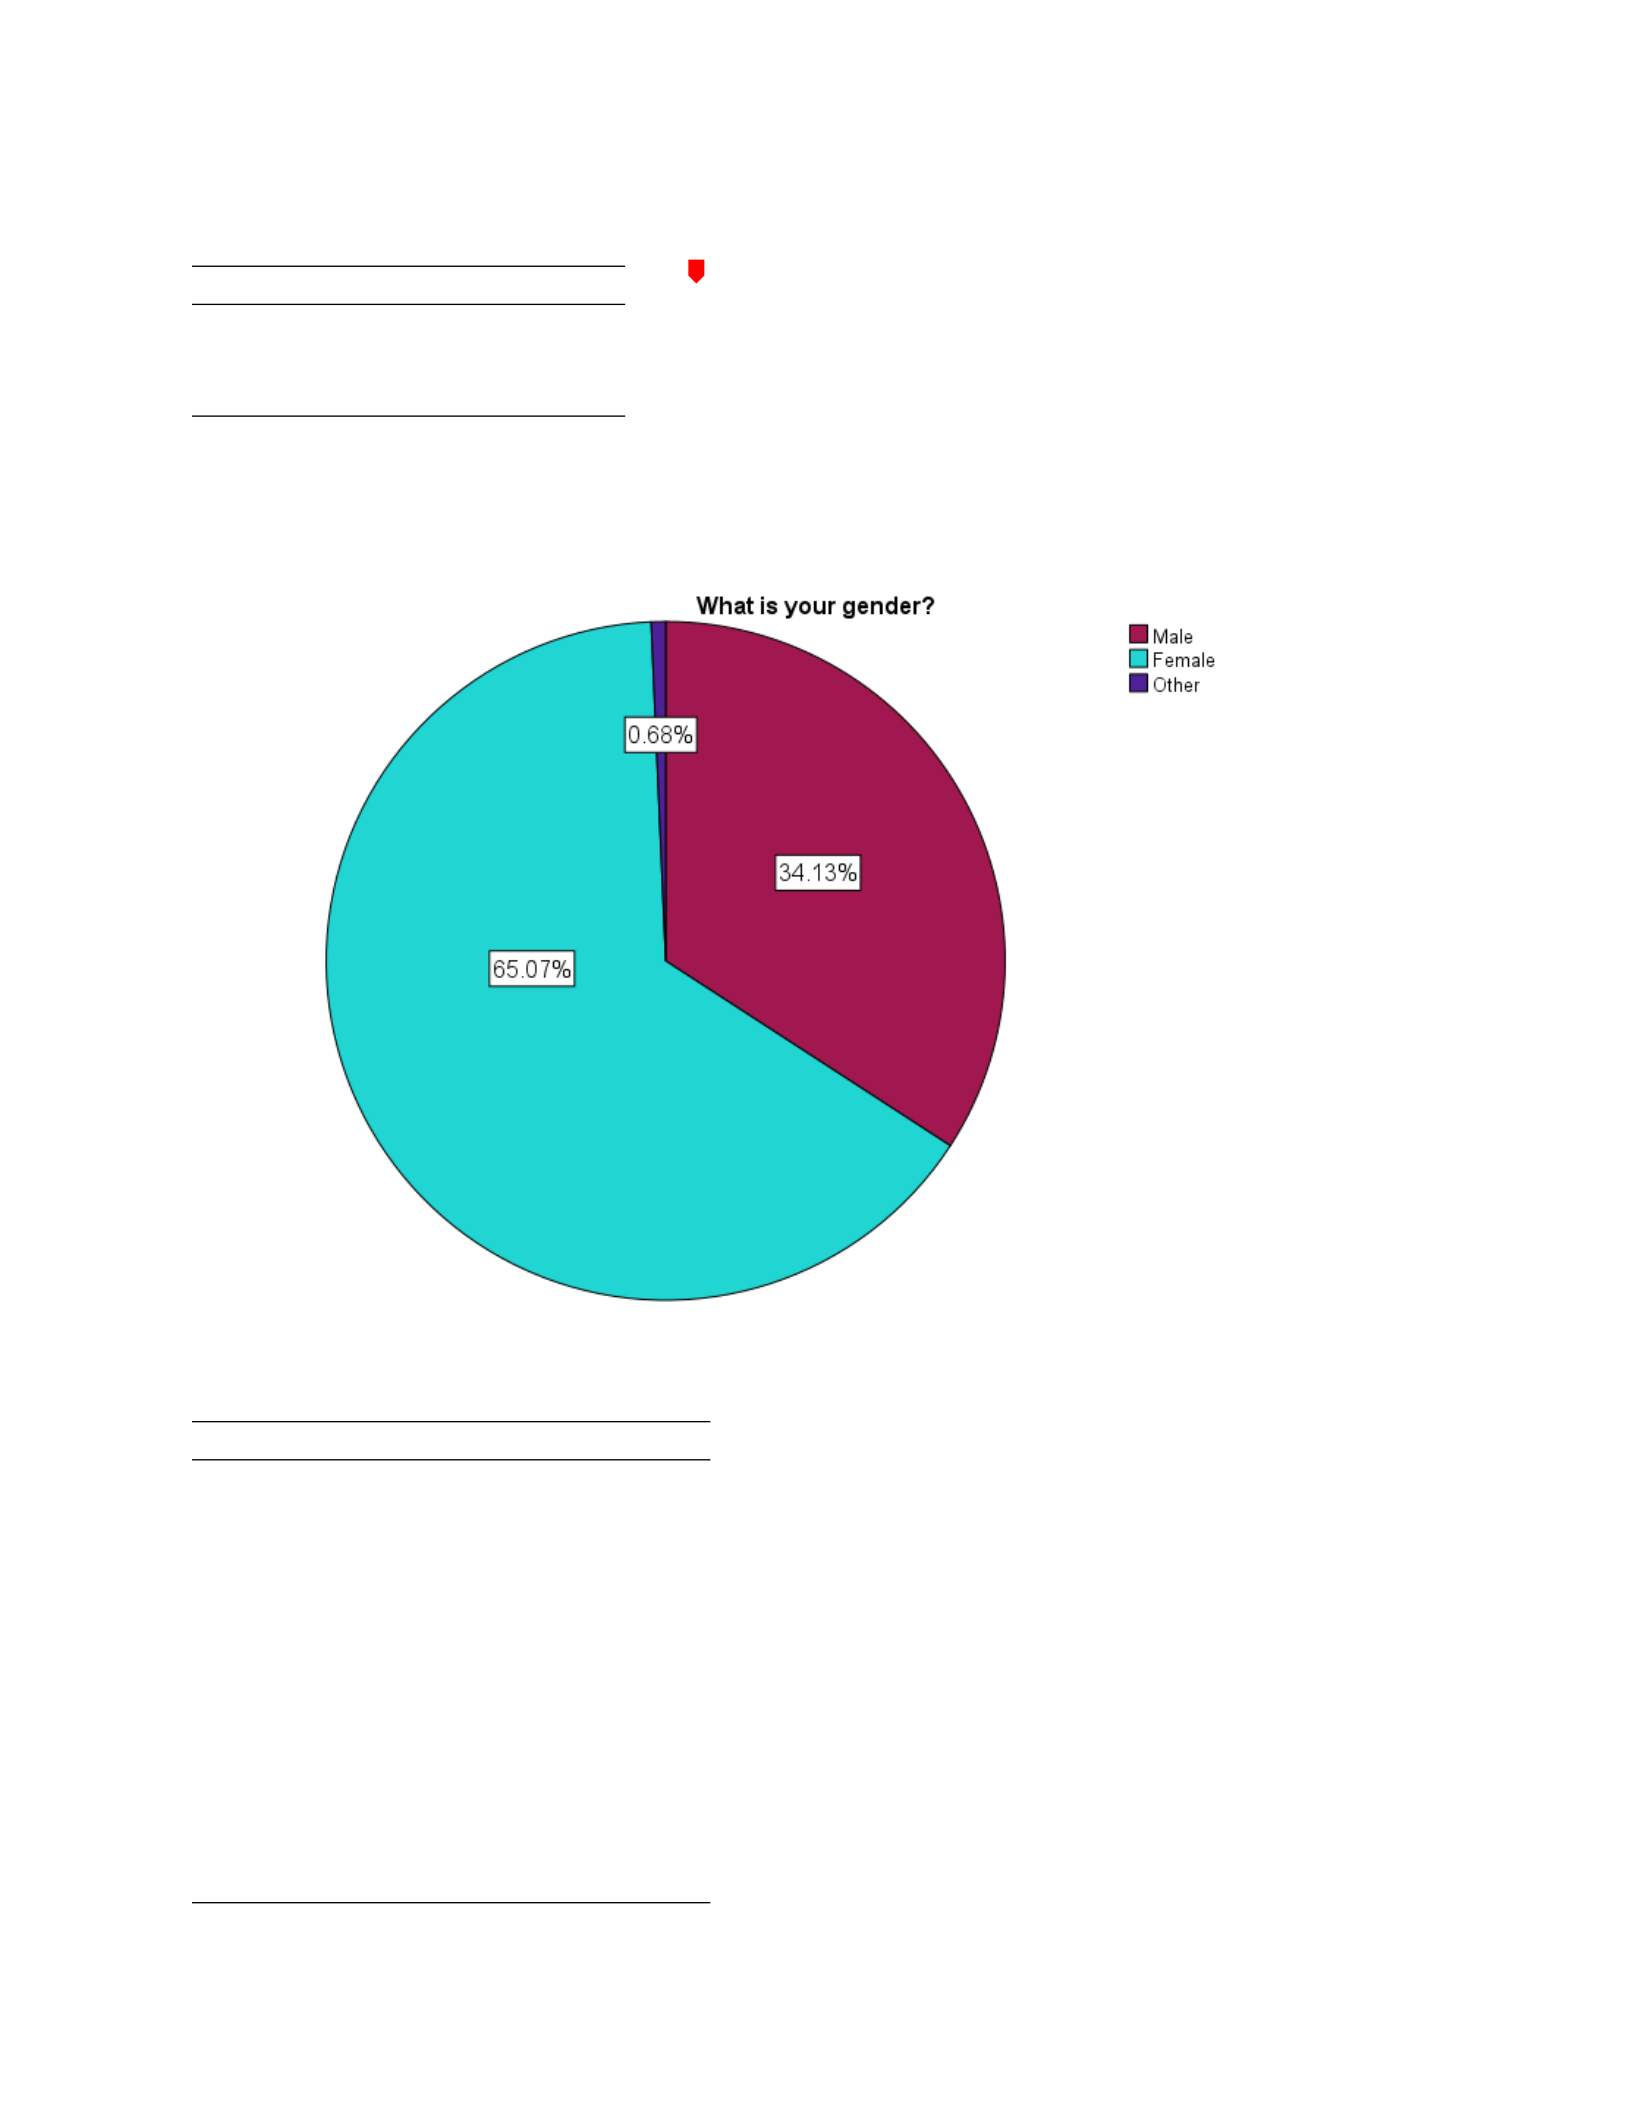
Figure 1
Percentage of the Participants’ Gender
Table 2
Religion Frequency and Percent
Religion
N
Percent
Agnostic
597
14.5
Atheist
627
15.3
Buddhist
97
2.4
Christian (Catholic)
801
19.5
Christian (Mormon)
39
0.9
Christian (Protestant)
434
10.6
Christian (Other)
643
15.7
Hindu
168
4.1
Jewish
56
1.4
Muslim
220
5.4
Sikh
15
0.4
Other
352
8.6
DESCRIPTIVE STATISTICS 3
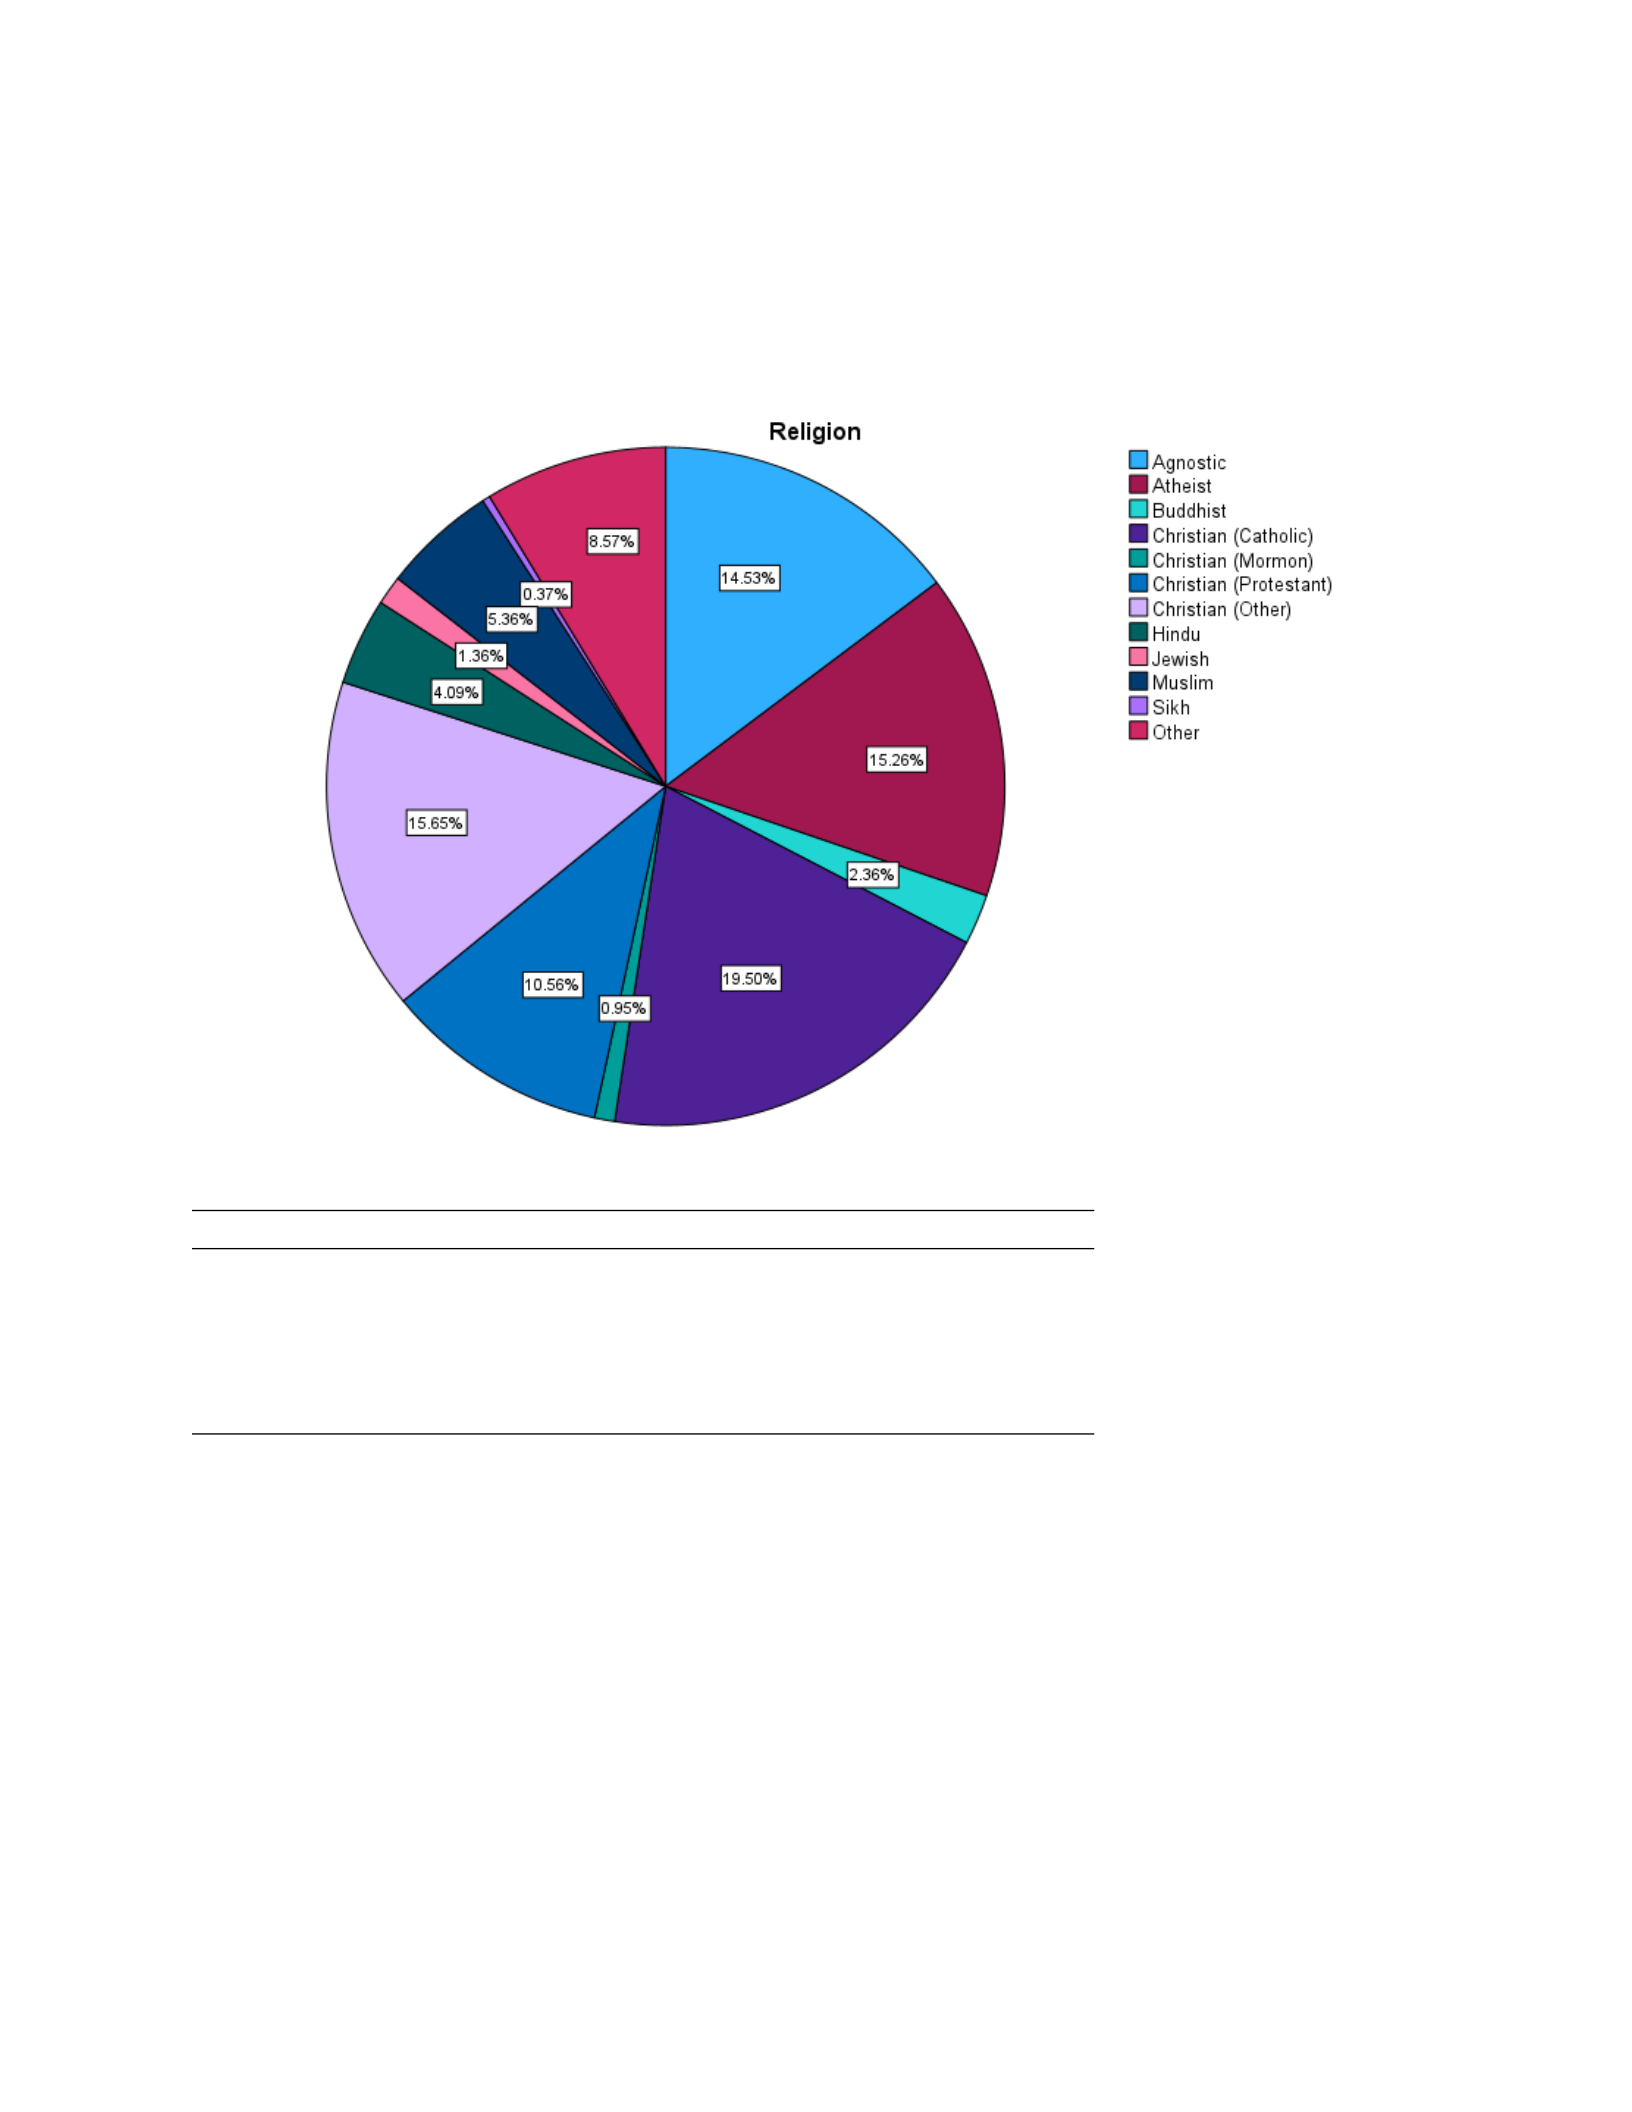
Figure 2
Percentage of the Participants’ Religion
Table 3
Race Frequency and Percent
Race
N
Percent
Asian
748
18.2
Arab
68
1.7
Black
239
5.8
Indigenous Australian, Native American, or White
2,558
62.3
Other
456
11.1
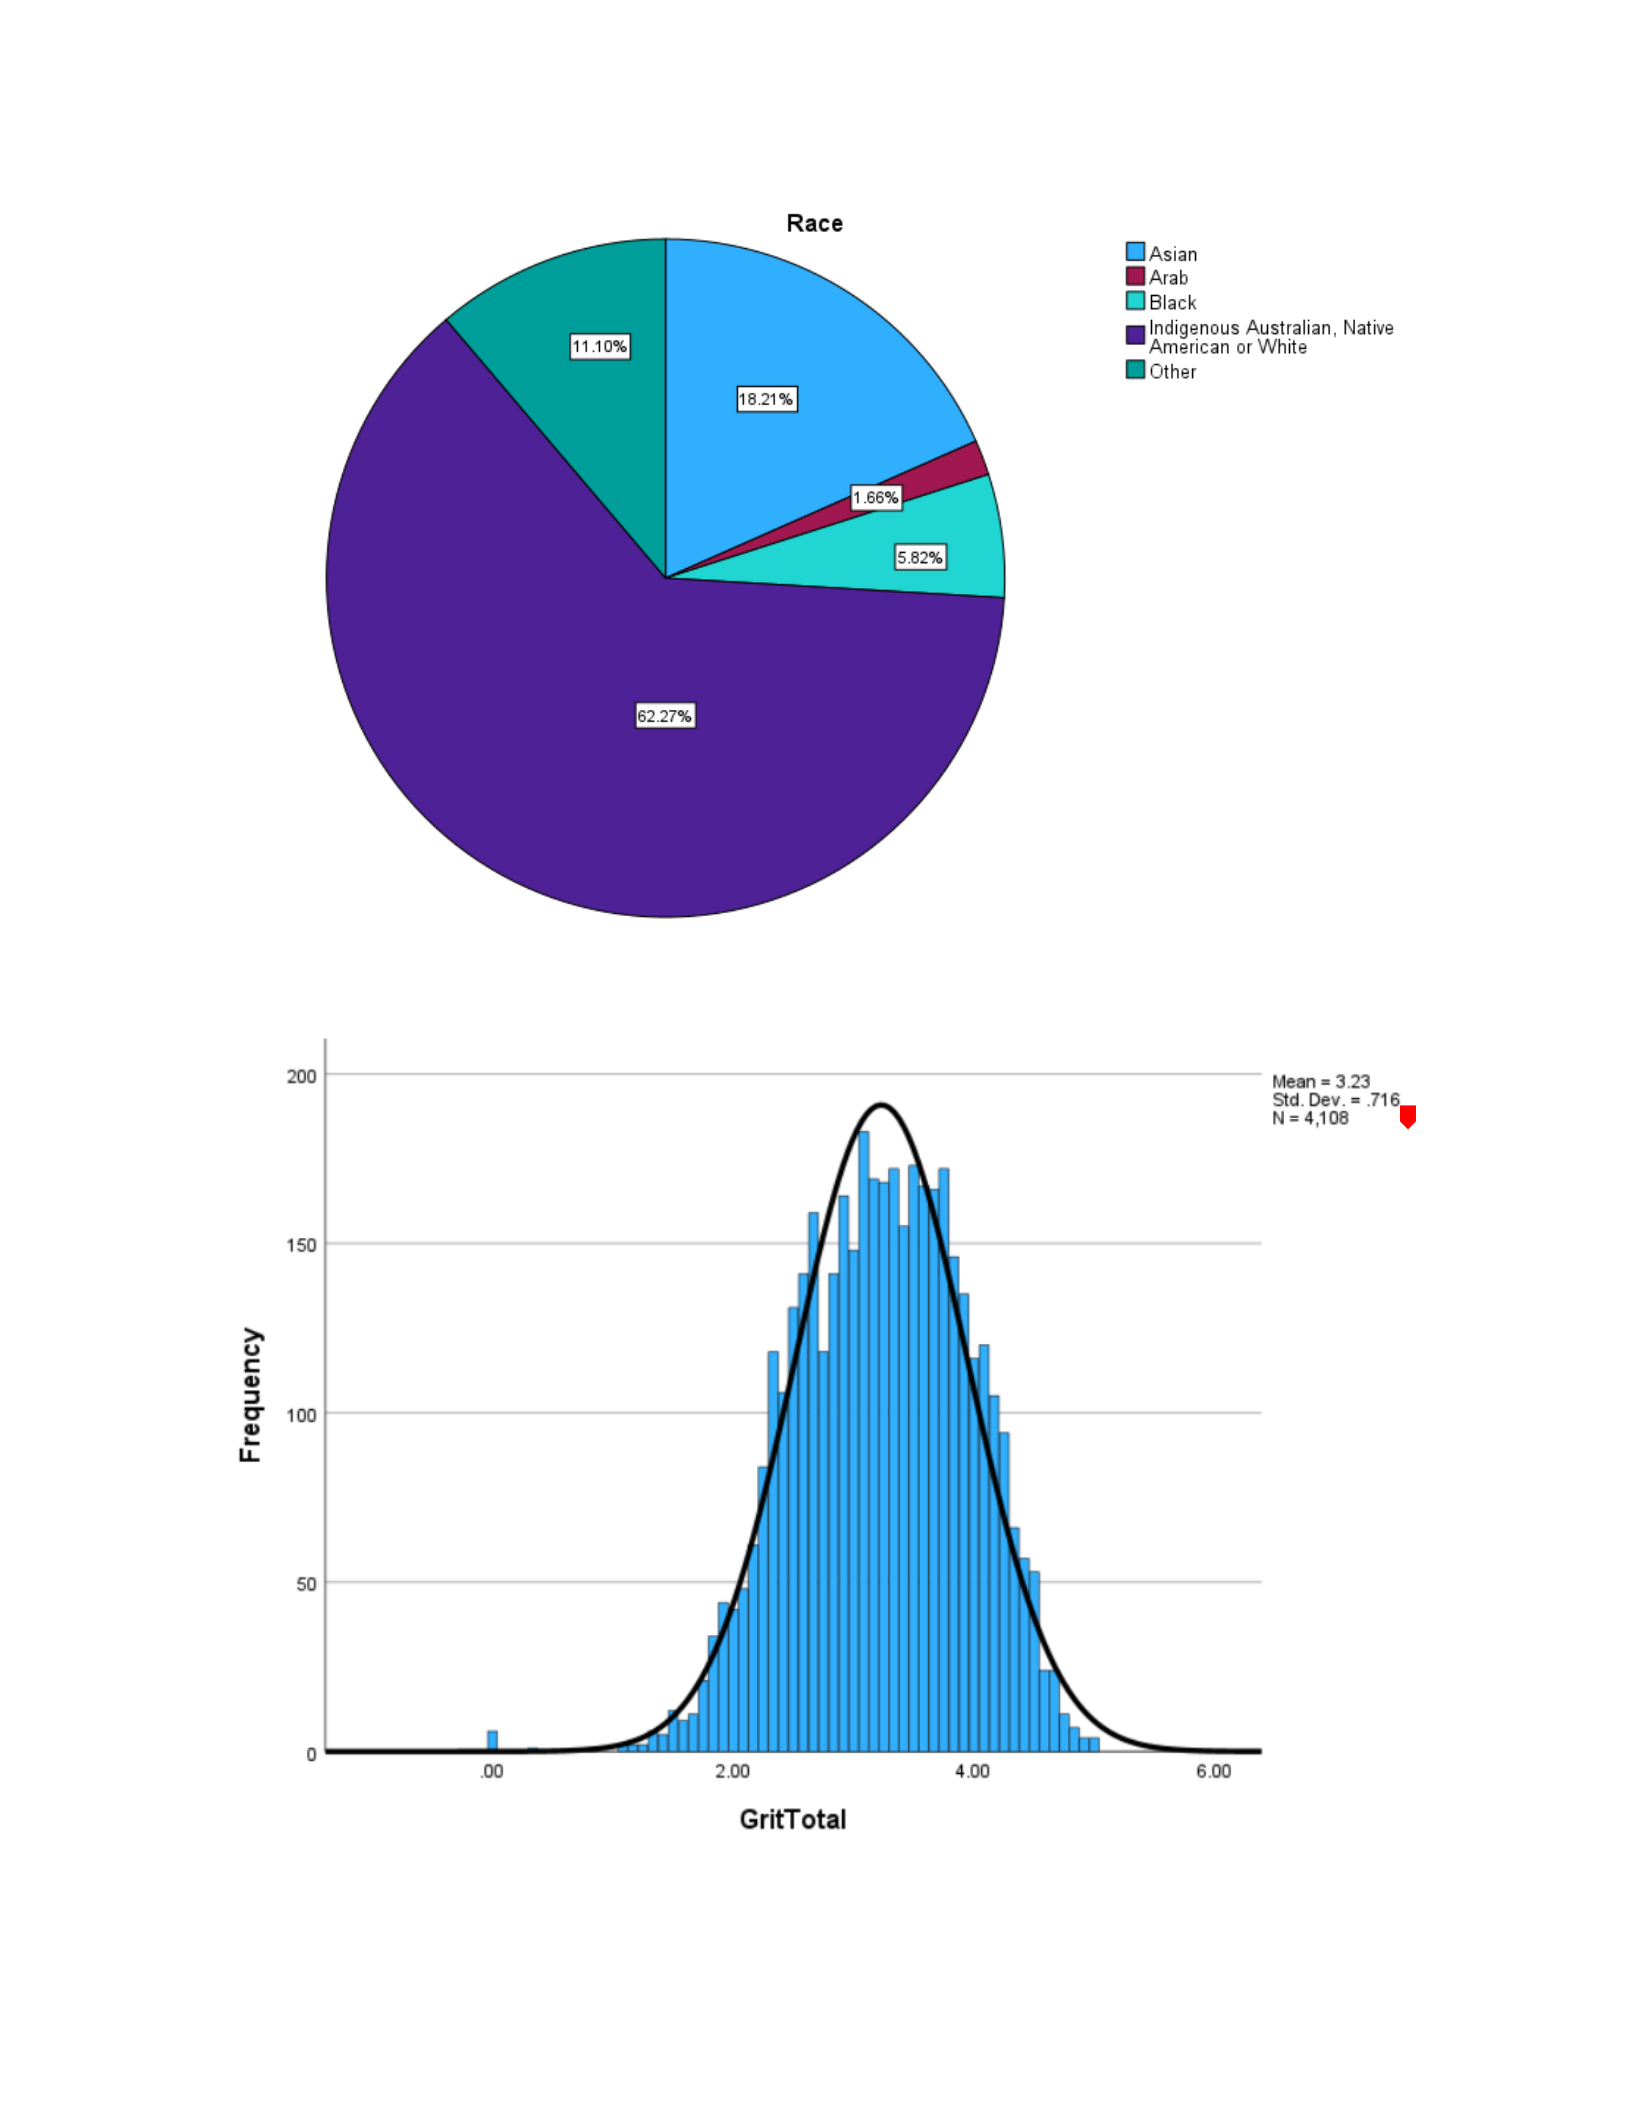
Figure 3
Percentage of the Participants’ Race
DESCRIPTIVE STATISTICS 4
Figure 4
Frequency of Grit Scale

DESCRIPTIVE STATISTICS 5
Summary
The present sample is comprised of 4,108 respondents who completed the survey online.
As seen in Table One and Figure One, 2,673 of the participants were female. 1,402 were male
and 28 did not identify. Each participant was divided into 12 different religious categories. The
religion was the highest number of individuals was Catholic with a population of 801 which is
19.5% of the sample. The lowest percentage was Sikh with 0.4% which is 15 individuals. When
asked about race, the participants were divided into five categories. The race with the highest
percentage is Asian with 62.3% and the lowest is black with 5.8%.
The Grit Scale’s score had a mean of 3.23 and a standard deviation of .716. Based on the
skewness and kurtosis values of -.541 and 3.583, the distribution is mesokurtic. The data displays
that the population primarily contains high levels of grit.

